Teaching Beer’s Law and Absorption Spectrophotometry with aSmart Phone: A Substantially Simplified ProtocolThomas S. Kuntzleman*,† and Erik C. Jacobson‡
†Department of Chemistry, Spring Arbor University, Spring Arbor, Michigan 49283, United States‡Vandercook Lake High School, Jackson, Michigan 49203, United States
*S Supporting Information
ABSTRACT: A very simple protocol for teaching Beer’s Lawand absorption spectrophotometry using a smart phone isdescribed. Materials commonly found in high school chemistrylaboratories or even around the house may be used. Datacollection and analysis is quick and easy. Despite the simplenature of the experiment, excellent results can be achieved.
KEYWORDS: High School/Introductory Chemistry, First Year Undergraduate/General, Analytical Chemistry, Laboratory Instruction,Hands-On Learning/Manipulatives, Spectroscopy, UV-Vis Spectroscopy
■ INTRODUCTION
Quantification of analyte concentration using absorptionspectrophotometry via Beer’s Law analysis is an importantfacet of undergraduate and Advanced Placement Chemistrycurricula.1 Given the limited resources in many high schoolsand colleges, it is not surprising that several authors havedescribed how to build simple and inexpensive absorptionspectrophotometers and colorimeters.2−4 Such instruments aregenerally simple in design, but their construction is oftensomewhat involved, requiring the use of light emitting diodes,photodiode detectors, and the like. In 2010, Scheeline reportedhow a cell phone camera can be used in spectrophotometricanalysis.5 This protocol eliminated the need for a photo-detector, but nevertheless remained relatively complicated.Reports have also appeared in this Journal that describe howcell phones can be used to conduct colorimetric6−11 andfluorescence12 analyses. These experiments further simplifiedthe process, allowing Beer’s Law experiments to be conductedin almost any high school laboratory. However, because theseexperiments require a somewhat sophisticated analysis of digitalphotos, these experiments involve drawbacks for those lookingfor a simplified approach. Furthermore, these experiments donot allow students to explore the process of light absorption bysample that occurs in absorption spectrophotometry.The experiment presented here allows students to conduct
Beer’s Law analysis with a cell phone camera. The protocol wasdeveloped with simplicity in mind. The setup is very simple, thedata collection is fast and easy, and the data analysis issubstantially streamlined. Nevertheless, the process of conduct-
ing the experiment allows students to quantitatively andqualitatively explore concepts and equations involved inabsorption spectrometry.
■ BACKGROUND
In absorption spectrometry, light is directed through a sampleand the fraction of light that passes through the sample ismeasured (Figure 1).The amount of light absorbed, or the absorbance, A, is
defined as
= −⎛⎝⎜
⎞⎠⎟A
II
log0 (1)
Received: October 21, 2015Revised: December 30, 2015
Figure 1. Green light is shined through a red solution and the amountof light transmitted is detected.
where I is the intensity of light transmitted through the sampleand I0 is the intensity of light transmitted through a blank. It isuseful to use a color wheel (Figure 2) to estimate the color of
light that is absorbed by a particular chemical species insolution.13 This approximation is done by noting the color onthe wheel opposite the observed color of the compound. Forexample, if a particular species appears red in solution, itprobably absorbs green light very well. The predictions madeusing the color wheel are not absolute. Its use is complicated bythe fact that our eyes are not equally sensitive to all colors oflight, in addition to other factors.13
In solutions that are sufficiently dilute, absorbance dependslinearly on analyte concentration, c:
ε=A bc (2)
where ε is the molar absorptivity of analyte and b is the lengthof sample through which light from the source travels. Equation2 is also known as Beer’s Law. This relationship is useful indetermining the concentration of analyte samples. To do so,the absorbance of a solution of unknown concentration iscompared to a series of solutions of known concentration.The experiment presented here describes how to conduct
absorbance measurements and Beer’s Law analysis using aremarkably simple protocol. A cell phone application (hereincalled the RGB analyzer) capable of determining average RGBvalue of images in the camera view, in real time, is used as thelight detector.14 Either light reflected from colored constructionpaper or light from a computer screen is used as a lightsource.15 Cuvettes, test tubes, or even clear plastic cups can beused to hold samples.
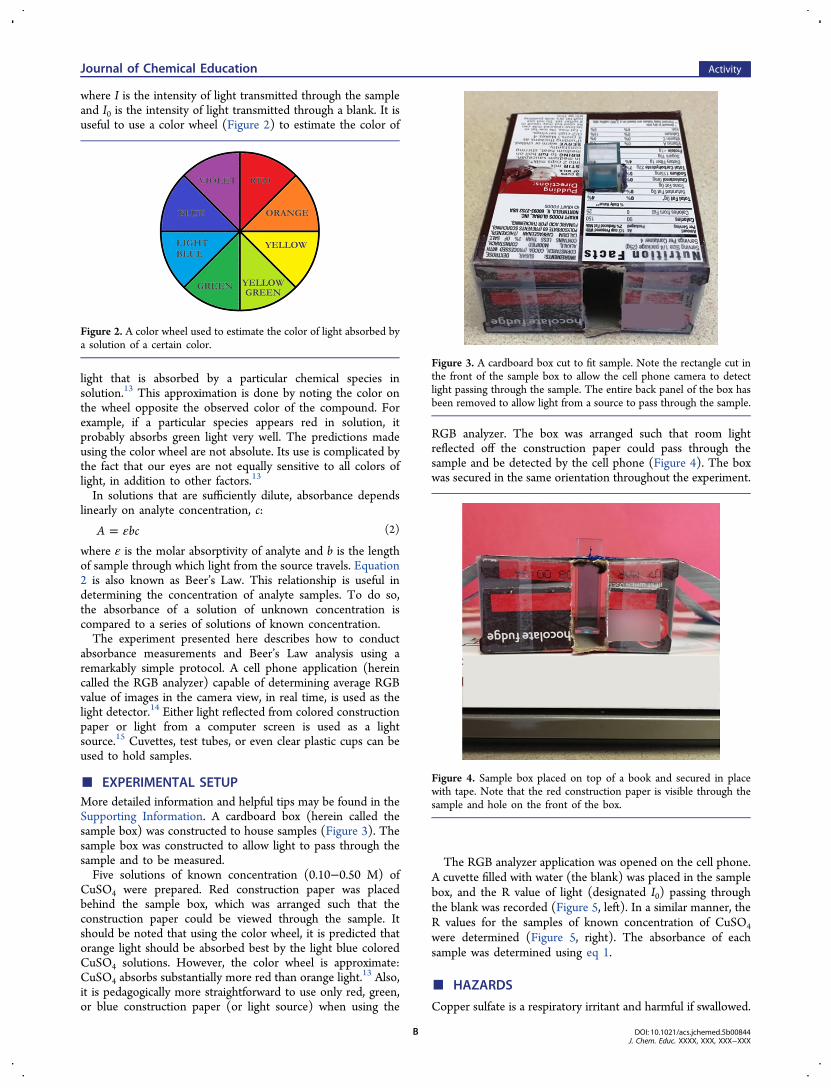
■ EXPERIMENTAL SETUPMore detailed information and helpful tips may be found in theSupporting Information. A cardboard box (herein called thesample box) was constructed to house samples (Figure 3). Thesample box was constructed to allow light to pass through thesample and to be measured.Five solutions of known concentration (0.10−0.50 M) of
CuSO4 were prepared. Red construction paper was placedbehind the sample box, which was arranged such that theconstruction paper could be viewed through the sample. Itshould be noted that using the color wheel, it is predicted thatorange light should be absorbed best by the light blue coloredCuSO4 solutions. However, the color wheel is approximate:CuSO4 absorbs substantially more red than orange light.13 Also,it is pedagogically more straightforward to use only red, green,or blue construction paper (or light source) when using the
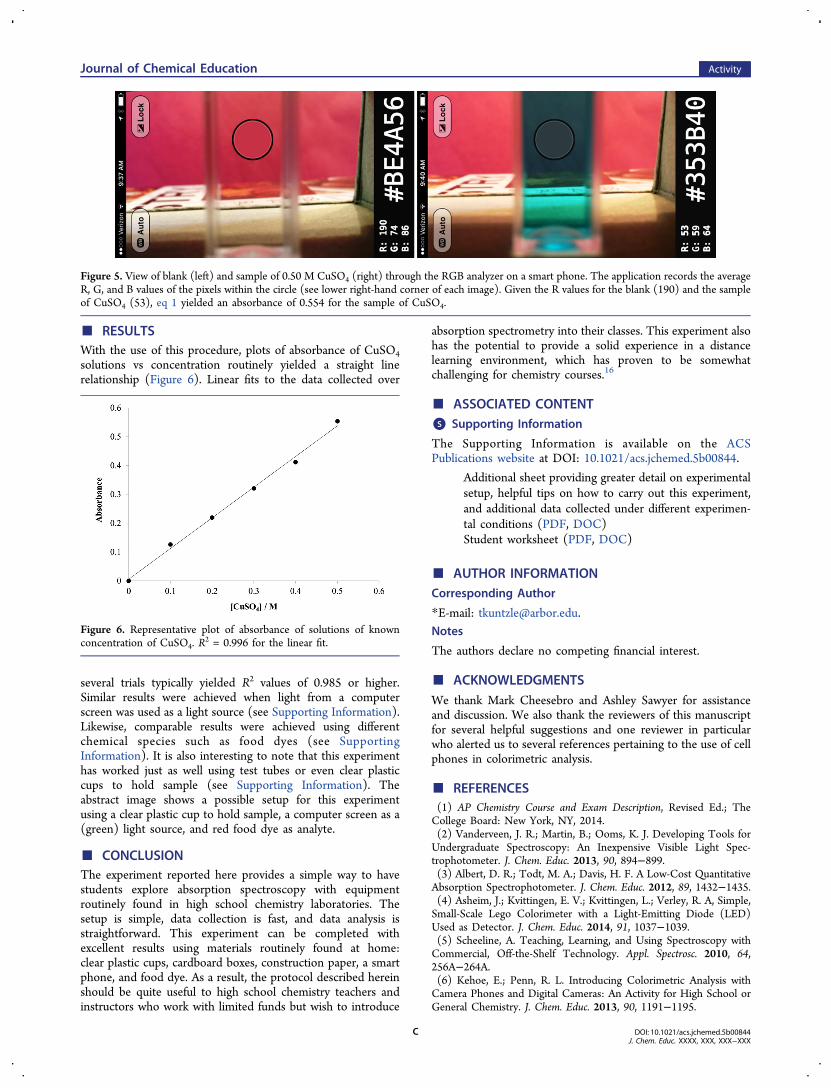
RGB analyzer. The box was arranged such that room lightreflected off the construction paper could pass through thesample and be detected by the cell phone (Figure 4). The boxwas secured in the same orientation throughout the experiment.
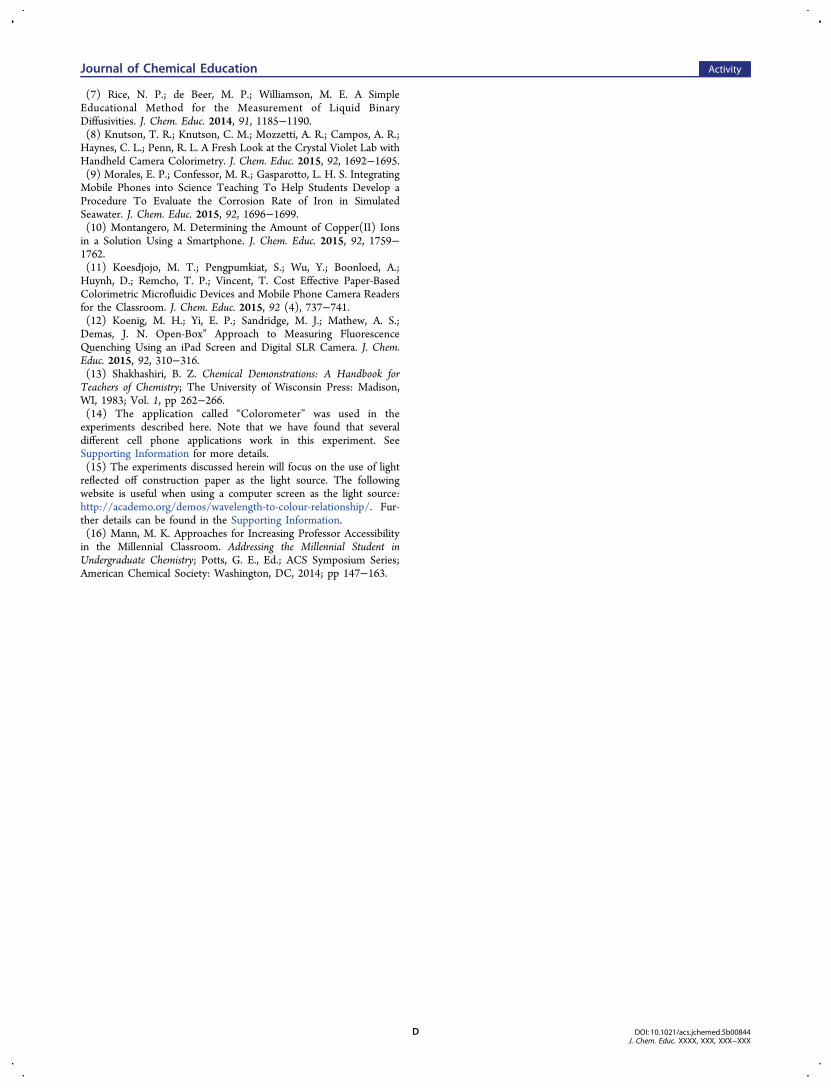
The RGB analyzer application was opened on the cell phone.A cuvette filled with water (the blank) was placed in the samplebox, and the R value of light (designated I0) passing throughthe blank was recorded (Figure 5, left). In a similar manner, theR values for the samples of known concentration of CuSO4
were determined (Figure 5, right). The absorbance of eachsample was determined using eq 1.
■ HAZARDS
Copper sulfate is a respiratory irritant and harmful if swallowed.
Figure 2. A color wheel used to estimate the color of light absorbed bya solution of a certain color.
Figure 3. A cardboard box cut to fit sample. Note the rectangle cut inthe front of the sample box to allow the cell phone camera to detectlight passing through the sample. The entire back panel of the box hasbeen removed to allow light from a source to pass through the sample.
Figure 4. Sample box placed on top of a book and secured in placewith tape. Note that the red construction paper is visible through thesample and hole on the front of the box.
■ RESULTSWith the use of this procedure, plots of absorbance of CuSO4solutions vs concentration routinely yielded a straight linerelationship (Figure 6). Linear fits to the data collected over
several trials typically yielded R2 values of 0.985 or higher.Similar results were achieved when light from a computerscreen was used as a light source (see Supporting Information).Likewise, comparable results were achieved using differentchemical species such as food dyes (see SupportingInformation). It is also interesting to note that this experimenthas worked just as well using test tubes or even clear plasticcups to hold sample (see Supporting Information). Theabstract image shows a possible setup for this experimentusing a clear plastic cup to hold sample, a computer screen as a(green) light source, and red food dye as analyte.
■ CONCLUSIONThe experiment reported here provides a simple way to havestudents explore absorption spectroscopy with equipmentroutinely found in high school chemistry laboratories. Thesetup is simple, data collection is fast, and data analysis isstraightforward. This experiment can be completed withexcellent results using materials routinely found at home:clear plastic cups, cardboard boxes, construction paper, a smartphone, and food dye. As a result, the protocol described hereinshould be quite useful to high school chemistry teachers andinstructors who work with limited funds but wish to introduce
absorption spectrometry into their classes. This experiment alsohas the potential to provide a solid experience in a distancelearning environment, which has proven to be somewhatchallenging for chemistry courses.16
■ ASSOCIATED CONTENT*S Supporting Information
The Supporting Information is available on the ACSPublications website at DOI: 10.1021/acs.jchemed.5b00844.
Additional sheet providing greater detail on experimentalsetup, helpful tips on how to carry out this experiment,and additional data collected under different experimen-tal conditions (PDF, DOC)Student worksheet (PDF, DOC)
The authors declare no competing financial interest.
■ ACKNOWLEDGMENTSWe thank Mark Cheesebro and Ashley Sawyer for assistanceand discussion. We also thank the reviewers of this manuscriptfor several helpful suggestions and one reviewer in particularwho alerted us to several references pertaining to the use of cellphones in colorimetric analysis.
■ REFERENCES(1) AP Chemistry Course and Exam Description, Revised Ed.; TheCollege Board: New York, NY, 2014.(2) Vanderveen, J. R.; Martin, B.; Ooms, K. J. Developing Tools forUndergraduate Spectroscopy: An Inexpensive Visible Light Spec-trophotometer. J. Chem. Educ. 2013, 90, 894−899.(3) Albert, D. R.; Todt, M. A.; Davis, H. F. A Low-Cost QuantitativeAbsorption Spectrophotometer. J. Chem. Educ. 2012, 89, 1432−1435.(4) Asheim, J.; Kvittingen, E. V.; Kvittingen, L.; Verley, R. A, Simple,Small-Scale Lego Colorimeter with a Light-Emitting Diode (LED)Used as Detector. J. Chem. Educ. 2014, 91, 1037−1039.(5) Scheeline, A. Teaching, Learning, and Using Spectroscopy withCommercial, Off-the-Shelf Technology. Appl. Spectrosc. 2010, 64,256A−264A.(6) Kehoe, E.; Penn, R. L. Introducing Colorimetric Analysis withCamera Phones and Digital Cameras: An Activity for High School orGeneral Chemistry. J. Chem. Educ. 2013, 90, 1191−1195.
Figure 5. View of blank (left) and sample of 0.50 M CuSO4 (right) through the RGB analyzer on a smart phone. The application records the averageR, G, and B values of the pixels within the circle (see lower right-hand corner of each image). Given the R values for the blank (190) and the sampleof CuSO4 (53), eq 1 yielded an absorbance of 0.554 for the sample of CuSO4.
Figure 6. Representative plot of absorbance of solutions of knownconcentration of CuSO4. R
(7) Rice, N. P.; de Beer, M. P.; Williamson, M. E. A SimpleEducational Method for the Measurement of Liquid BinaryDiffusivities. J. Chem. Educ. 2014, 91, 1185−1190.(8) Knutson, T. R.; Knutson, C. M.; Mozzetti, A. R.; Campos, A. R.;Haynes, C. L.; Penn, R. L. A Fresh Look at the Crystal Violet Lab withHandheld Camera Colorimetry. J. Chem. Educ. 2015, 92, 1692−1695.(9) Morales, E. P.; Confessor, M. R.; Gasparotto, L. H. S. IntegratingMobile Phones into Science Teaching To Help Students Develop aProcedure To Evaluate the Corrosion Rate of Iron in SimulatedSeawater. J. Chem. Educ. 2015, 92, 1696−1699.(10) Montangero, M. Determining the Amount of Copper(II) Ionsin a Solution Using a Smartphone. J. Chem. Educ. 2015, 92, 1759−1762.(11) Koesdjojo, M. T.; Pengpumkiat, S.; Wu, Y.; Boonloed, A.;Huynh, D.; Remcho, T. P.; Vincent, T. Cost Effective Paper-BasedColorimetric Microfluidic Devices and Mobile Phone Camera Readersfor the Classroom. J. Chem. Educ. 2015, 92 (4), 737−741.(12) Koenig, M. H.; Yi, E. P.; Sandridge, M. J.; Mathew, A. S.;Demas, J. N. Open-Box” Approach to Measuring FluorescenceQuenching Using an iPad Screen and Digital SLR Camera. J. Chem.Educ. 2015, 92, 310−316.(13) Shakhashiri, B. Z. Chemical Demonstrations: A Handbook forTeachers of Chemistry; The University of Wisconsin Press: Madison,WI, 1983; Vol. 1, pp 262−266.(14) The application called “Colorometer” was used in theexperiments described here. Note that we have found that severaldifferent cell phone applications work in this experiment. SeeSupporting Information for more details.(15) The experiments discussed herein will focus on the use of lightreflected off construction paper as the light source. The followingwebsite is useful when using a computer screen as the light source:http://academo.org/demos/wavelength-to-colour-relationship/. Fur-ther details can be found in the Supporting Information.(16) Mann, M. K. Approaches for Increasing Professor Accessibilityin the Millennial Classroom. Addressing the Millennial Student inUndergraduate Chemistry; Potts, G. E., Ed.; ACS Symposium Series;American Chemical Society: Washington, DC, 2014; pp 147−163.