JOURNAL OF ECONOMICS AND FINANCE EDUCATION • Volume 5 • Number 1 • Summer 2006 47 Teaching Methods and Assessment Techniques Used for the Introductory Level Undergraduate Finance Course in British and Irish Universities Abdullah M. Iqbal, M. Nauman Farooqi, and Kent T. Saunders 1 ABSTRACT This study reports the results of a survey of teaching methods and assessment techniques for introductory level undergraduate finance courses in British and Irish universities and compares them with the results reported in similar studies conducted in the US and Canada. The survey results show that the most popular teaching methods in the UK and Ireland are the ‘Instructor Overhead Projector Lecture’ and ‘Instructor Computer PowerPoint Lecture’, whereas the ‘Writing-on-the-Board Lecture’ was the most common teaching method in the US and Canada. We find, as in the US and Canada, that textbook reading is the most commonly used (non-assessed) out-of-class assignment and in-class exams taken by individual students are the primary tool for determining a student’s overall grade. Introduction Historically, writing-on-board has been the dominant in-class teaching method and end-of-year examinations the main assessment method. However, with advances in technology and computing software and hardware and the recognition that one teaching style may not suit all, this position may be changing. Recent research highlights the importance of different student learning styles (Gentry and Helgesen, 1999 and Lucas and Meyer, 2005) and points to different teaching styles such as group work (Byrd and Harman, 1997 and Ingram and Adams, 2003), writing assignments (Locke and Ebron, 1998) and student presentations (Saunders, 2000) to supplement traditional writing-on-board lectures. In addition, research also suggests that the use of technology and computing for in-class teaching and out-of-class assignment methods could enhance students’ experience of learning finance (Clinebell and Clinebell, 1995 and Marks, 1998). Saunders (2001) and Farooqi and Saunders (2004) conducted national surveys of teaching and assessment methods for introductory undergraduate finance courses in the US and Canada. Most of the findings of these two studies are similar. For example, Saunders (2001) reports that the writing-on-board lecture is the dominant teaching method, textbook reading is the main out-of-class assignment method, and end-of-year examination is the main method for determining the students’ overall grades. Farooqi and Saunders (2004) report similar results for Canada; however, they find that the use of group work is more common as an in-class teaching method and an out-of-class assignment method in Canada than in the US. This study offers an important and interesting insight into the teaching methods and assessment techniques used in delivering introductory level undergraduate finance modules on the other side of the Atlantic, that is, in British and Irish universities. The purpose of the survey is two-fold: first to assess the range of teaching and assessment methods used in British and Irish universities in teaching an introductory level finance module and second to compare the results with those of similar surveys conducted in the US (Saunders, 2001) and Canada (Farooqi and Saunders, 2004). We did not expect any 1 Abdullah M. Iqbal, Kent Business School, University of Kent, Canterbury, Kent CT2 7PE, United Kingdom, +44-1227- 823027, [email protected], M. Nauman Farooqi, Mount Allison University, Sackville, Canada, [email protected], Kent T. Saunders, Professor of Finance and Economics, Falls School of Business, Anderson University, Anderson, Indiana 46012, 765-641-4396, [email protected]. The authors are grateful to the British Accounting Association for providing an electronic copy of the ‘British Accounting Review Research Register 2004’ that made it easier to identify the faculty members with teaching interests in finance across British and Irish universities.
Transcript
JOURNAL OF ECONOMICS AND FINANCE EDUCATION • Volume 5 • Number 1 • Summer 2006
47
Teaching Methods and Assessment Techniques Used for the Introductory Level Undergraduate Finance Course in British and Irish Universities
Abdullah M. Iqbal, M. Nauman Farooqi, and Kent T. Saunders1
ABSTRACT This study reports the results of a survey of teaching methods and assessment techniques for introductory level undergraduate finance courses in British and Irish universities and compares them with the results reported in similar studies conducted in the US and Canada. The survey results show that the most popular teaching methods in the UK and Ireland are the ‘Instructor Overhead Projector Lecture’ and ‘Instructor Computer PowerPoint Lecture’, whereas the ‘Writing-on-the-Board Lecture’ was the most common teaching method in the US and Canada. We find, as in the US and Canada, that textbook reading is the most commonly used (non-assessed) out-of-class assignment and in-class exams taken by individual students are the primary tool for determining a student’s overall grade.
Introduction
Historically, writing-on-board has been the dominant in-class teaching method and end-of-year examinations the main assessment method. However, with advances in technology and computing software and hardware and the recognition that one teaching style may not suit all, this position may be changing. Recent research highlights the importance of different student learning styles (Gentry and Helgesen, 1999 and Lucas and Meyer, 2005) and points to different teaching styles such as group work (Byrd and Harman, 1997 and Ingram and Adams, 2003), writing assignments (Locke and Ebron, 1998) and student presentations (Saunders, 2000) to supplement traditional writing-on-board lectures. In addition, research also suggests that the use of technology and computing for in-class teaching and out-of-class assignment methods could enhance students’ experience of learning finance (Clinebell and Clinebell, 1995 and Marks, 1998). Saunders (2001) and Farooqi and Saunders (2004) conducted national surveys of teaching and assessment methods for introductory undergraduate finance courses in the US and Canada. Most of the findings of these two studies are similar. For example, Saunders (2001) reports that the writing-on-board lecture is the dominant teaching method, textbook reading is the main out-of-class assignment method, and end-of-year examination is the main method for determining the students’ overall grades. Farooqi and Saunders (2004) report similar results for Canada; however, they find that the use of group work is more common as an in-class teaching method and an out-of-class assignment method in Canada than in the US. This study offers an important and interesting insight into the teaching methods and assessment techniques used in delivering introductory level undergraduate finance modules on the other side of the Atlantic, that is, in British and Irish universities. The purpose of the survey is two-fold: first to assess the range of teaching and assessment methods used in British and Irish universities in teaching an introductory level finance module and second to compare the results with those of similar surveys conducted in the US (Saunders, 2001) and Canada (Farooqi and Saunders, 2004). We did not expect any
1 Abdullah M. Iqbal, Kent Business School, University of Kent, Canterbury, Kent CT2 7PE, United Kingdom, +44-1227-823027, [email protected], M. Nauman Farooqi, Mount Allison University, Sackville, Canada, [email protected], Kent T. Saunders, Professor of Finance and Economics, Falls School of Business, Anderson University, Anderson, Indiana 46012, 765-641-4396, [email protected]. The authors are grateful to the British Accounting Association for providing an electronic copy of the ‘British Accounting Review Research Register 2004’ that made it easier to identify the faculty members with teaching interests in finance across British and Irish universities.
JOURNAL OF ECONOMICS AND FINANCE EDUCATION • Volume 5 • Number 1 • Summer 2006
48
significant differences in teaching and assessment methods across these geographical locations, a priori. The survey also looks at some of the demographics of the finance faculty and the characteristics of the universities offering such a module. Brown and Guilding (1993) conducted a survey of teaching methods used to teach accounting and non-accounting courses in only seven English universities in 1992. They found that lectures, seminars, and textbooks were more commonly used to teach accounting courses. However, they do not identify the specific lecture method(s) used. The significant advances in technology since the early nineties also warrant a more recent study of teaching methods. The results of this survey are expected to be particularly useful to faculty members who teach introductory finance at undergraduate level. We use an introductory level finance module for the survey as (1) there is no prior research on this or other closely relevant subjects in the UK or Ireland, (2) it is often a core module for a degree in accounting (and finance) and hence offers coverage of the teaching and assessment methods of an important component of a popular programme of study in the UK2, and (3) results of the survey could be applied to other technical type introductory core modules. The rest of the paper is organised as follows. Section 2 outlines the research method used. Section 3 provides results on an individual teacher and institutional characteristics and Section 4 reports results on the teaching and assessments methods including the use of computers, group work, writing assignments and presentations as types of teaching and assessment. Section 5 describes the modal British and Irish introductory level finance module and teacher. Section 6 concludes the paper.
Research Method
The questionnaire used in this study was originally designed by Saunders (2001) to conduct a survey in the US. Later, Farooqi and Saunders (2004) adopted it for a Canadian survey with a few modifications. The questionnaire used for this study was amended to make it suitable for the UK and Irish academic environment and a pilot survey was also conducted to test it. The final survey with the responses is presented as the only Appendix. The survey was first sent to 564 finance faculty members of all British and Irish Universities (108 in total) in January 2005 with a follow up letter sent in early March 2005 to improve the response rate. The finance faculty members’ names, addresses, and other details were taken from the British Accounting Review Research Register that is published once every two years and this survey is based on the details taken from the research register of 2004. All faculty members with a teaching interest related to any area of finance were included in the survey population. It was not clear from the research register if the faculty members were teaching undergraduate (UG) or postgraduate (PG) finance modules so the survey was sent to all faculty members. Overall, 107 questionnaires were returned representing a response rate of over 23%. Of these 107 responses, 38 (35.51%) were returned with the comment 'Not involved in teaching finance to undergraduates' and another three (2.8%) with the comment that the ‘faculty member had left the institute’. In addition to these 41 (38.31%) surveys, 66 completed surveys were received out of which one was found invalid. The survey results for UK and Irish universities are based on 65 valid surveys. Assuming that 35.51% of the 564 faculty members are not involved in teaching undergraduate finance modules, the valid response rate turns out to be 18% (65 out of 364) which is comparable to 19% for the US and 21% for Canada.
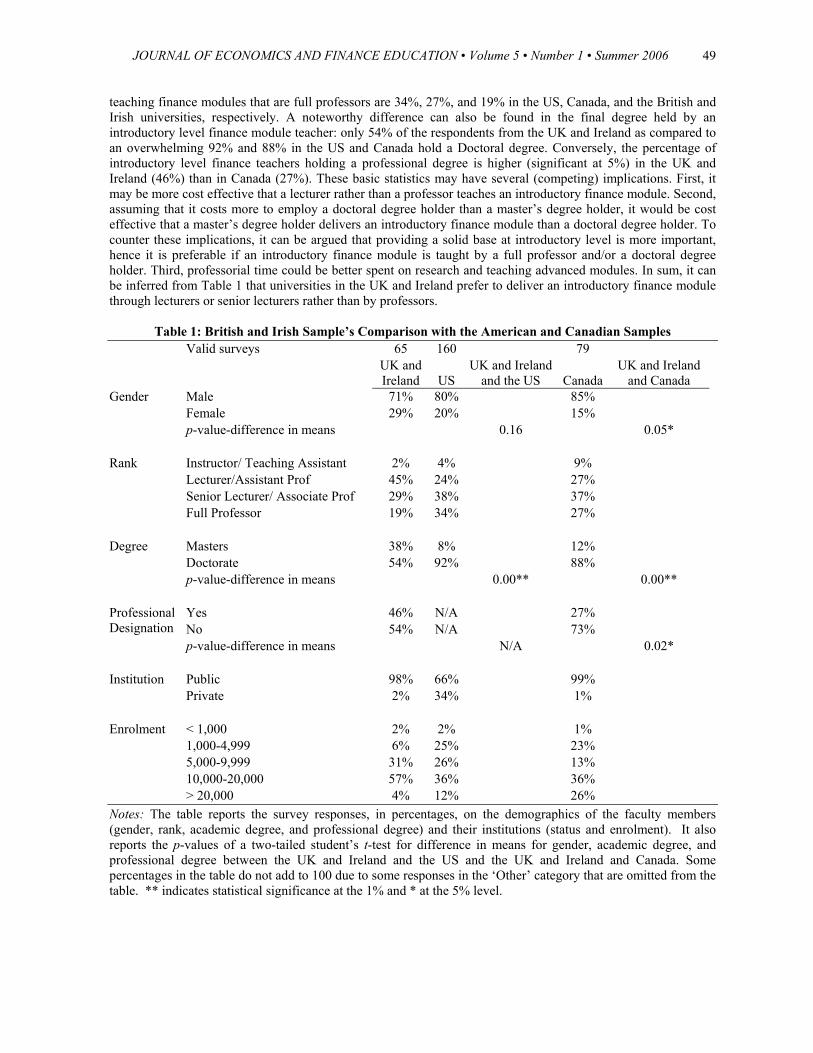
Results on Individual Teacher’s and Institutional Characteristics Table 1 presents a comparison of individual teacher and institutional characteristics in the UK and Ireland with those in the US and Canada. The percentage of female respondents teaching introductory finance in the UK and Ireland is 29% compared with 20% in the US and 15% in Canada. The gender difference among faculty members teaching introductory finance is insignificant between the UK and Ireland and the US and is significant at the 5% level between the UK and Ireland and Canada. As for the rank in the UK and Irish universities, almost half (45%) of faculty teaching introductory finance are lecturers whereas comparable rank (of assistant professor) stands close to only one fourth (24% in the US, and 27% in Canada) across the Atlantic.3 In addition, teachers
2 According to HESA, 35185 students were registered for an Accounting and/or finance degree in the UK in 2003/04 (http://www.hesa.ac.uk/holisdocs/pubinfo/student/subject0304.htm). 3 Moore, Newman, and Terrell (2002) consider ranks of lecturer and senior lecturer in the UK to be equivalent to assistant and associate professor in the US.
JOURNAL OF ECONOMICS AND FINANCE EDUCATION • Volume 5 • Number 1 • Summer 2006
49
teaching finance modules that are full professors are 34%, 27%, and 19% in the US, Canada, and the British and Irish universities, respectively. A noteworthy difference can also be found in the final degree held by an introductory level finance module teacher: only 54% of the respondents from the UK and Ireland as compared to an overwhelming 92% and 88% in the US and Canada hold a Doctoral degree. Conversely, the percentage of introductory level finance teachers holding a professional degree is higher (significant at 5%) in the UK and Ireland (46%) than in Canada (27%). These basic statistics may have several (competing) implications. First, it may be more cost effective that a lecturer rather than a professor teaches an introductory finance module. Second, assuming that it costs more to employ a doctoral degree holder than a master’s degree holder, it would be cost effective that a master’s degree holder delivers an introductory finance module than a doctoral degree holder. To counter these implications, it can be argued that providing a solid base at introductory level is more important, hence it is preferable if an introductory finance module is taught by a full professor and/or a doctoral degree holder. Third, professorial time could be better spent on research and teaching advanced modules. In sum, it can be inferred from Table 1 that universities in the UK and Ireland prefer to deliver an introductory finance module through lecturers or senior lecturers rather than by professors.
Table 1: British and Irish Sample’s Comparison with the American and Canadian Samples
Valid surveys 65 160 79 UK and
Ireland
US UK and Ireland
and the US
Canada UK and Ireland
and Canada Gender Male 71% 80% 85% Female 29% 20% 15% p-value-difference in means 0.16 0.05* Rank Instructor/ Teaching Assistant 2% 4% 9% Lecturer/Assistant Prof 45% 24% 27% Senior Lecturer/ Associate Prof 29% 38% 37% Full Professor 19% 34% 27% Degree Masters 38% 8% 12% Doctorate 54% 92% 88% p-value-difference in means 0.00** 0.00**
Yes 46% N/A 27% Professional Designation No 54% N/A 73% p-value-difference in means N/A 0.02* Institution Public 98% 66% 99% Private 2% 34% 1% Enrolment < 1,000 2% 2% 1% 1,000-4,999 6% 25% 23% 5,000-9,999 31% 26% 13% 10,000-20,000 57% 36% 36% > 20,000 4% 12% 26% Notes: The table reports the survey responses, in percentages, on the demographics of the faculty members (gender, rank, academic degree, and professional degree) and their institutions (status and enrolment). It also reports the p-values of a two-tailed student’s t-test for difference in means for gender, academic degree, and professional degree between the UK and Ireland and the US and the UK and Ireland and Canada. Some percentages in the table do not add to 100 due to some responses in the ‘Other’ category that are omitted from the table. ** indicates statistical significance at the 1% and * at the 5% level.
JOURNAL OF ECONOMICS AND FINANCE EDUCATION • Volume 5 • Number 1 • Summer 2006
50
Table 1 further shows that almost all of the respondents (98%) identified their university as a public institute. Although each university has degree awarding powers, they are classified as a public institute on the basis of the funds that are provided by the central governments in the UK and Ireland through their higher education funding authorities. Similarly, 99% of the Canadian finance faculty members are from publicly funded universities where provincial governments rather than the central government provide funds. Contrary to Canada and the UK and Ireland, 34% of the US respondents were from privately funded and 66% from publicly funded universities. In the UK and Ireland, 57% of the respondents are from universities with an overall student enrolment of between 10,000-20,000, whereas similar figures stand at 36% for both the US and Canada. However, an enrolment of less than 5,000 (8%) and more than 20,000 (4%) students are less common in the UK and Ireland as compared to similar ranges of student enrolment in the US (27% and 12%) and Canada (24% and 26%), indicating that both the US and Canada have relatively larger proportions of smaller and bigger universities in terms of student population than those in the UK and Ireland. Table 2 reports a bi-variate comparison between gender and academic rank across British and Irish, American, and Canadian samples. It is clear that in the UK and Ireland, the ratio of males to females in the lecturer rank is almost one to one as compared to 2 to 1 in the US and 4 to 1 in Canada, whereas this ratio for the UK and Ireland lies between those for the US and Canada for the senior lecturer rank. None of the female respondents from the UK and Ireland held a professorial rank. Pearson correlation between academic rank and gender appears to be relatively better in the UK and Ireland (−0.21, insignificant at conventional levels) than that in the US (−0.26, significant at 1%) and Canada (−0.27, significant at 5%).
Table 2: Cross Tabulation of Gender Vs. Rank in the UK and Ireland, the United States, and Canada
UK and Ireland Academic Rank Instructor Lecturer Senior Lecturer Full Professor Total Gender Male 1 16 15 12 44 Female 13 4 17 Total 1 29 19 12 61
Notes: The table reports the survey responses in terms of cross tabulating the gender versus the academic rank along with the Pearson correlation and p-values (two-tailed) for differences across the two demographics of the finance faculty in the UK and Ireland, the US and Canada. ** indicates statistical significance at the 1% and * at the 5% level.
JOURNAL OF ECONOMICS AND FINANCE EDUCATION • Volume 5 • Number 1 • Summer 2006
51
Results on Teaching and Assessment Methods
This section reports the responses on teaching methods, out-of-class assignments, and grade determinants in the UK and Irish universities and also compares these with the corresponding responses from the American and Canadian finance faculty. The tables in this section report mean, median, and mode figures for the UK and Ireland and only mean figures for the US and Canada as the results are compared based on means.
Teaching Method Table 3 reports the teaching methods used to teach introductory finance modules in the UK and Ireland in the order of their popularity and shows that the most popular teaching method is ‘Instructor Overhead Projector Lecture’ with a mean score of 3.3 followed by ‘Instructor Computer PowerPoint Lecture’ with a mean score of 2.6, whereas the most popular teaching methods in the US and Canada is ‘Instructor Writing on Board Lecture’ with mean scores of 2.8 and 3.0 with this method being the third most popular in the UK and Ireland.4
Table 3: In-Class Teaching Methods in the UK and Ireland, the United States, and Canada 0 = Never. 1 = Rarely, 1-10% of the time. 2 = Occasionally, 11-33% of the time. 3 = Frequently, 34-65% of the time. 4 = Usually or Always, 66-100% of the time
UK and Ireland US
UK and Ireland and
US Canada
UK and Ireland and
Canada
Teaching Method: Mean Median Mode Mean p-value-diff
in means Mean p-value-diff
in means Instructor Overhead Projector Lecture 3.3 3 4 2.0 0.00** 2.6 0.01** Instructor Computer PowerPoint Lecture 2.6 3 4 1.5 0.00** 1.8 0.01** Instructor Writing on Board Lecture 2.4 2 3 3.0 0.01** 2.8 0.08 Instructor Led Problem Solving 2.2 2 2 2.6 0.08 2.4 0.60 Journal Article Discussion 1.7 2 2 0.6 0.00** 0.7 0.00** Small Group Activities 1.6 2 2 0.8 0.00** 0.9 0.01** Instructor Computer Demonstration 1.6 1 0 1.2 0.15 1.1 0.13 Individual Student Presentations 1.5 1 2 0.6 0.00** 0.8 0.00** Group of Students Presentations 1.4 1 2 0.6 0.00** 0.9 0.03* Instructor Led Case Study 1.4 1 0 0.9 0.04* 1.4 0.99 Newspaper Article Discussion 1.3 1 0 1.6 0.18 1.4 0.63 Magazine Article Text Discussion 1.2 1 0 1.2 0.91 1.0 0.39 Individual Student Computer Work 1.1 0 0 1.1 0.87 0.9 0.38 Student Debates 1.0 0 0 0.3 0.00** 0.6 0.05* Guest Lectures 1.0 1 0 0.6 0.05* 0.7 0.11 Group of Students Computer Work 0.9 0 0 0.6 0.19 0.9 0.95 Videotapes/Televisions 0.6 0 0 0.6 0.99 0.4 0.18 Other (Please Specify): 2 other 4 other 5 other Notes: The table reports the mean, median, and mode values of the survey responses related to the different in-class teaching methods in terms of the categories (i.e. usage in percent) given below for the UK and Ireland and mean values for the US and Canada. It also reports p-values of a two-tailed student’s t-test for difference in means for each of the given teaching method between the UK and Ireland and the US and the UK and Ireland and Canada. ** indicates statistical significance at the 1% and * at the 5% level.
4 It may be worth noting here the survey was conducted in 2001 in the US and 2002 in Canada. This hierarchy of the popularity of teaching methods might have changed since then.
JOURNAL OF ECONOMICS AND FINANCE EDUCATION • Volume 5 • Number 1 • Summer 2006
52
The use of ‘Instructor Overhead Projector Lecture’ and ‘Instructor Computer PowerPoint Lecture’ as teaching methods are significantly (at 1% or less) more common among the British and Irish academics as compared to their use among the American and Canadian academics. These results suggest that the finance faculty in the US and Canada uses more traditional method of writing-on-board instead of employing the latest available technology in delivering the lectures. Statistically, ‘Instructor Writing-on-Board Lecture’ is significantly (at the 1% level) more popular in the US and is only slightly (at the 10% level) more popular in Canada than its use in the UK and Ireland. In addition to the above three teaching methods, ‘Instructor Led Problem Solving’ is another commonly used teaching method on both sides of the Atlantic and is ranked second, third, and fourth most popular in the US, Canada, and the UK and Ireland respectively. Although the use of teaching methods such as ‘Journal Article Discussion’, ‘Small Group Activities’, ‘Individual’ and ‘Group’ student presentations and ‘student debates’ is rare on both sides of the Atlantic, they are more common in the UK and Ireland.. Overall, the British and Irish finance faculty members employ both the latest available technology and a wider range of teaching methods as compared to their peers in the US and Canada.
Out-of-Class Assignments
Table 4 shows that the most popular (non-assessed) out-of-class assignment in the UK and Ireland, similar to the American and Canadian samples, is ‘Textbook Reading’ although its use is significantly more common in the US and Canada as compared to its use in the UK and Ireland. Rarely used assignments such as ‘Journal Article Reading’, ‘Workbook Assignments’, and ‘Individual Papers’ are more common and popular in the UK and Ireland (all with a mean score of 1.6) as compared to their use across the Atlantic. Both in the US and Canada, ‘Individual Student Computer Work’ is the second most commonly used out-of-class assignment method with this method being the third most popular in hierarchy in the UK and Ireland and that its use is as common in US and Canada as it is in the UK and Ireland.
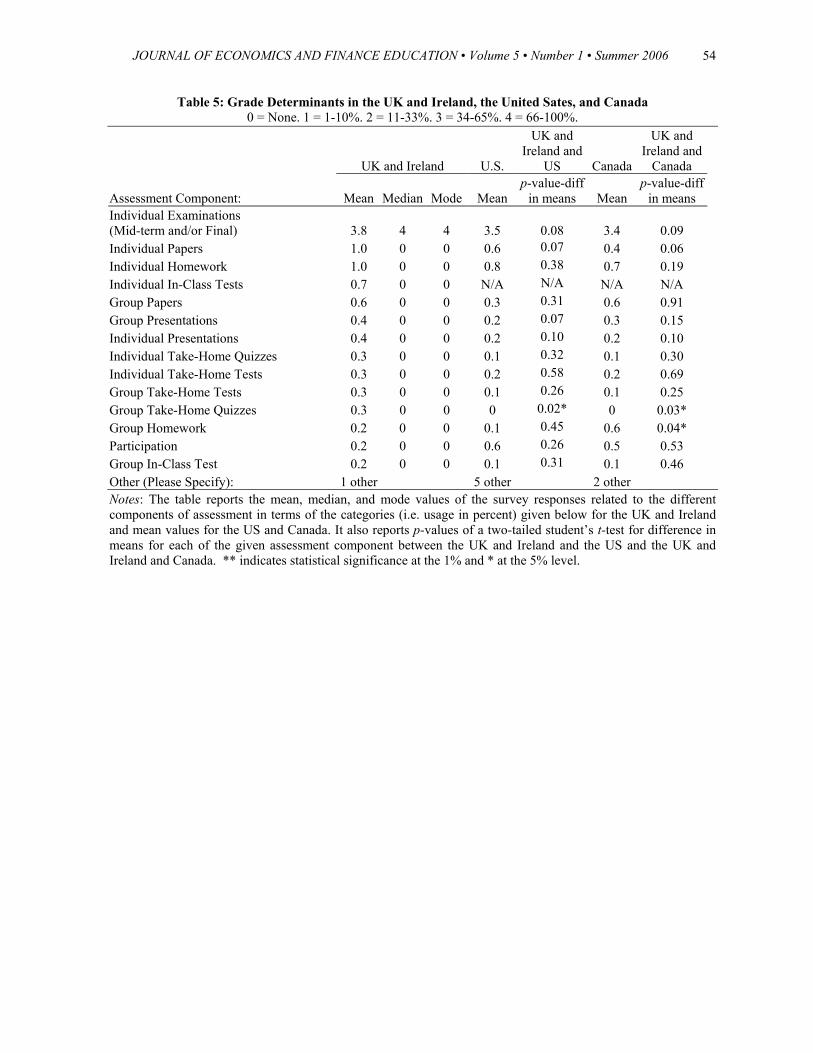
Grade Determinants The survey results reported in Table 5 reveal that (mid-term and/or final) examination taken individually is the primary method used for determining students’ final grade on both sides of the Atlantic. In addition, the use of group work activities in determining the final grade is more common in the UK and Ireland and Canada as compared to their use in the US.5 Results from the survey in the Appendix show that the mid-term and/or final examination consists mainly of open-ended problems or essay questions.
Use of Computers, Group Work, Writing Assignments, and Presentations
This subsection outlines the use of computers, group work, writing assignments, and presentations as sources of teaching or assessment methods. Table 6 reports the percentages of the usage of the indicated method at any level.6
5 The category ‘Individual In-Class Tests’ in the UK and Ireland refers to in-class assignments/tests and not examinations as is the case in the US and Canada. Untabulated results show no significant difference in the use of mid-term and/or final examinations on the two sides of the Atlantic. Other assessment methods are rarely used. 6 A new variable (X1) was created that added together the responses for each component. If someone did not do any of the components the sum would be 0. If someone did any of the components then the sum would be greater than or equal to 1. Then another variable (X2) was created that was 0 if the value was 0, 1 if the value was greater than or equal to 1, and missing if the value was missing. The mean of X2 would be between 0 and 1 and is the percentage of faculty who did any or all of the above components in decimal form (e.g. if the mean of X2 is 0.44 then 44% of the faculty did at least one of the components). Here is an example: Component 1 Component 2 X1 X2 Faculty 1 2 2 4 1 Faculty 2 0 0 0 0 Faculty 3 1 0 1 1 Here, the average of X2 would be 0.67, which means that 67% of the faculty did at least 1 of the 2 components.
JOURNAL OF ECONOMICS AND FINANCE EDUCATION • Volume 5 • Number 1 • Summer 2006
53
The use of computer in one form or the other as a tool for assisting introductory level finance teaching in the UK and Ireland at 87% is comparable to that in the US (84%) and Canada (81%). However, computer usage for out-of-class assignments is relatively less popular in the UK and Ireland than that in that US. Similar to the use of computers in-class, group work activities in the UK and Ireland are both more popular as an in-class teaching method (81%) as compared to its use as an out-of-class assignment (51%) method and in comparison with the corresponding activities in the US (55%) and Canada (65%). Group work as an out-of-class assignment method is much more common in Canada (71%) than in the UK and Ireland (51%) and the US (43%). The percentages for the use of group work as a determinant of grade are comparable across the three samples and range between 46% for the US and 57% for Canada. Written assignments are as common in the UK and Ireland (54%) as they are in the US (56%) and Canada (63%). The percentages for written assignments as grade determinants are also comparable across the three samples. The British and Irish faculty members teaching finance at introductory level, make greater use of presentations as an in-class teaching method (75%) as compared to those of their peers across the Atlantic (43% in the US and 54% in Canada).
Table 4: Out-of-Class Assignments in the UK and Ireland, the Unites States, and Canada 0 = None. 1 = Rarely, 1-2 assignments. 2 = Occasionally, 3-5 assignments
3 = Frequently, 6-9 assignments. 4 = Usually or Always, 10 or more assignments.
UK and Ireland US
UK and Ireland and
US Canada
UK and Ireland and
Canada
Out-of-Class Assignment: Mean Median Mode Mean p-value-diff
in means Mean p-value-diff
in means Textbook Reading 2.4 3 3 3.5 0.00** 2.9 0.04* Journal Article Reading 1.6 2 0 0.4 0.00** 0.5 0.00** Workbook Assignments 1.6 1 0 1.0 0.02* 1.1 0.08 Individual Papers 1.6 1 0 1.0 0.04* 0.8 0.00** Individual Student Computer Work 1.4 1 0 1.5 0.70 1.2 0.33 Case Studies 1.3 1 0 0.8 0.02* 1.1 0.27 Magazine Article Reading 1.3 1 0 0.8 0.02* 0.6 0.00** Newspaper Article Reading 1.2 1 0 1.1 0.82 0.8 0.03* Group Homework 1.1 0 0 0.5 0.01** 1.0 0.76 Textbook web sites/Publishers web sites 1.1 0 0 N/A N/A 0.0 0.02* WebCT, Blackboard or other platform 1.0 0 0 N/A N/A 0.0 0.02* Small Group Activities 0.9 0 0 0.4 0.03* 0.5 0.07 Individual Take-Home Tests 0.9 0 0 0.3 0.01** 0.4 0.05* Individual Take-Home Quizzes 0.8 0 0 0.4 0.05* 0.4 0.14 Group Papers 0.7 0 0 0.4 0.17 1.0 0.38 Group of Students Computer Work 0.7 0 0 0.5 0.46 0.9 0.35 Group Take-Home Quizzes 0.3 0 0 0.1 0.15 0.1 0.09 Guest Lectures 0.3 0 0 0.2 0.59 0.1 0.14 Videotapes/Television 0.2 0 0 0.1 0.40 0.0 0.12 Group Take-Home Tests 0.2 0 0 0.1 0.25 0.2 0.77 Other (Please Specify): 2 other 3 other 7 other Notes: The table reports the mean, median, and mode values of the survey responses related to the different out-of-class assignment methods in terms of the categories given below for the UK and Ireland and mean values for the US and Canada. It also reports p-values of a two-tailed student’s t-test for difference in means for each of the given assignment method between the UK and Ireland and the US and the UK and Ireland and Canada. ** indicates statistical significance at the 1% and * at the 5% level.
JOURNAL OF ECONOMICS AND FINANCE EDUCATION • Volume 5 • Number 1 • Summer 2006
54
Table 5: Grade Determinants in the UK and Ireland, the United Sates, and Canada 0 = None. 1 = 1-10%. 2 = 11-33%. 3 = 34-65%. 4 = 66-100%.
UK and Ireland U.S.
UK and Ireland and
US
Canada
UK and Ireland and
Canada
Assessment Component: Mean Median Mode Mean p-value-diff
in means Mean p-value-diff
in means Individual Examinations (Mid-term and/or Final) 3.8 4 4 3.5
0.08 3.4 0.09
Individual Papers 1.0 0 0 0.6 0.07 0.4 0.06 Individual Homework 1.0 0 0 0.8 0.38 0.7 0.19 Individual In-Class Tests 0.7 0 0 N/A N/A N/A N/A Group Papers 0.6 0 0 0.3 0.31 0.6 0.91 Group Presentations 0.4 0 0 0.2 0.07 0.3 0.15 Individual Presentations 0.4 0 0 0.2 0.10 0.2 0.10 Individual Take-Home Quizzes 0.3 0 0 0.1 0.32 0.1 0.30 Individual Take-Home Tests 0.3 0 0 0.2 0.58 0.2 0.69 Group Take-Home Tests 0.3 0 0 0.1 0.26 0.1 0.25 Group Take-Home Quizzes 0.3 0 0 0 0.02* 0 0.03* Group Homework 0.2 0 0 0.1 0.45 0.6 0.04* Participation 0.2 0 0 0.6 0.26 0.5 0.53 Group In-Class Test 0.2 0 0 0.1 0.31 0.1 0.46 Other (Please Specify): 1 other 5 other 2 other Notes: The table reports the mean, median, and mode values of the survey responses related to the different components of assessment in terms of the categories (i.e. usage in percent) given below for the UK and Ireland and mean values for the US and Canada. It also reports p-values of a two-tailed student’s t-test for difference in means for each of the given assessment component between the UK and Ireland and the US and the UK and Ireland and Canada. ** indicates statistical significance at the 1% and * at the 5% level.
JOURNAL OF ECONOMICS AND FINANCE EDUCATION • Volume 5 • Number 1 • Summer 2006
55
Table 6: Usage of Computers, Group Work, Writing Assignments, and Presentations in the UK and Ireland, the US, and Canada
% Indicating Some Usage UK & Ireland US
UK & Ireland and
US p-value Canada
UK & Ireland and
Canada p-value
Instructor Computer Demonstration 65% 68% 62% Individual Student Computer Work 46% 57% 38% Instructor Computer PowerPoint Lecture 82% 57% 60% Group of Students Computer Work 37% 32% 38%
Use of Computers: In-Class Teaching Methods
Any or All of Above 87% 84% 0.51 81% 0.31
Individual Student Computer Work 52% 66% 54% Group of Students Computer Work 30% 27% 43%
Use of Computers: Out-of-Class Assignments Any or All of Above 54% 70% 0.03* 63% 0.28
Small Group Activities 68% 43% 49% Group of Students Presentations 67% 33% 45% Group of Students Computer Work 35% 32% 38%
Group Work: In-Class Teaching Methods
Any or All of Above 81% 55% 0.00** 65% 0.04*
Group of Students Computer Work 30% 27% 43% Group Homework 40% 22% 47% Group Paper 25% 23% 45% Small Group Activities 36% 23% 28% Group Take-Home Quiz 14% 5% 4% Group Take-Home Test 9% 4% 9%
Group Work: Out-of-Class Assignments
Any or All of Above 51% 43% 0.30 71% 0.01**
Group Work used as a Grade Determinant 52% 46% 0.42 57% 0.62
Individual Student Paper 49% 52% 47% Group of Students Paper 25% 23% 45%
Writing Assignments: Out-of-Class Any or All of Above 54% 56% 0.75 63% 0.28
Individual Student Paper 35% 41% 25% Group of Students Paper 16% 20% 33%
Writing Assignments: Grade Determinant Any or All of Above 43% 50% 0.32 46% 0.11
Individual Student Presentations 68% 38% 45% Group of Student Presentations 67% 33% 45%
Presentations: In-Class Teaching Methods: Any or All of Above 75% 43% 0.00** 54% 0.01**
Individual Student Presentations 13% 16% 19% Group of Student Presentations 17% 14% 18%
Presentations: Grade Determinant
Any or All of Above 20% 21% 0.86 26% 0.43 Notes: The table reports the usage of different components of teaching and assessments methods, in percentages, at some level for the three countries. The percentages showing ‘Any or All of Above’ for each component are calculated as explained in Note 6. It also reports p-values of a two-tailed student’s t-test for difference in means for the overall usage at some level between the UK and Ireland and the US and the UK and Ireland and Canada. ** indicates statistical significance at the 1% and * at the 5% level.
JOURNAL OF ECONOMICS AND FINANCE EDUCATION • Volume 5 • Number 1 • Summer 2006
56
A Modal Introductory Level Finance Module and Teacher in the UK and Ireland
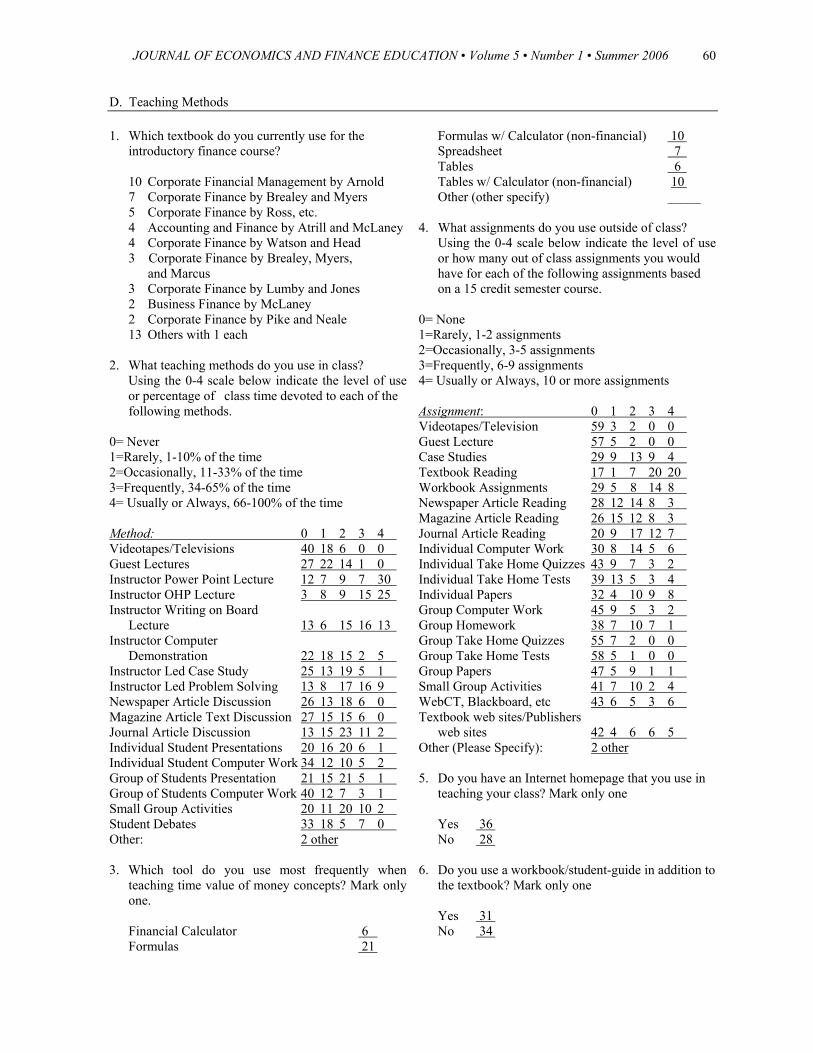
Based on the most common responses for the UK and Ireland, we can deduce that a person teaching finance at an introductory level to undergraduates is a male lecturer and holds a doctorate degree. He teaches at a public university with an undergraduate enrolment of between 10,000 and 20,000 students with more than 75 students graduating with majors in finance each year. He has a module homepage that he uses in teaching. He takes lectures in a tiered auditorium style classroom equipped with an overhead projector, multimedia/data projector, computer with Internet connection, and TV/VCR. These features of a modal finance teacher are comparable to his American and Canadian counterparts. The difference lies in the size of the class and the average number of students taught by a lecturer in the UK and Ireland and his American/Canadian counterpart. The average number of students taught in one semester/term by British and Irish lecturer is 175 as compared to the corresponding figure of 114 for his Canadian counterpart (this difference is significant at less than 1%).7 The usual lecture class size for an introductory level finance module is also much larger in the UK and Ireland and stands at between 150 and 299 students whereas the usual class size is between 15-39 students in the US and 40-74 students in Canada. However, it is important to note that sometimes, both in the US and Canada, due to class size and pedagogy, the class may be split into two sections taught by two different finance faculty members during the same semester. Nevertheless, these results have implications for the resources available and employed (e.g. room sizes, teacher’s time, etc.) on the two sides of the Atlantic. The most popular textbook adopted by the modal lecturer for an introductory level finance module, is Arnold’s Corporate Financial Management. To deliver his lectures, the lecturer usually uses power point and overhead projector, frequently uses instructor led problem solving and writing on the board, occasionally uses a journal article discussion and rarely invites guest speakers. He prefers to use formulae to teach time value of money concepts like his counterpart in Canada and unlike his corresponding colleague in the US who mainly uses a financial calculator for this purpose. He uses the textbook reading as the main out-of-class assignment and determines student’s overall grade using individual (mid-term and/or final) examination consisting of open-ended problems or essay questions.
Conclusion
This survey shows that the UK and Irish teachers prefer to use an overhead projector and/or PowerPoint to deliver lectures, use the textbook readings as the major out-of-class assignment, and use in-class exams as the major assessment method. The UK and Irish finance faculty use a great deal of group work and presentations as in-class teaching methods as compared to their use across the Atlantic and as an out-of-class assignment method. As for the characteristics of the teachers and the institutions concerned, the results of the survey indicate that the female to male ratio of those responded to the survey is higher for the UK and Ireland than that for the US and Canada. In addition, the modal introductory level finance module teacher is a lecturer (equivalent to an assistant professor in the US and Canada) in the UK and Ireland as compared to an associate professor (equivalent to a senior lecturer in the UK and Ireland) in the US and Canada. The proportion of doctorate to non-doctorate degree holders who teach introductory finance at undergraduate level is much higher in the US and Canada as compared to that in the UK and Ireland. However, the average number of students taught by each faculty member overall and per class are much higher for the UK and Ireland than that in the US and Canada. This type of survey would be even more useful, if conducted globally in the same year at the same time to enhance the comparability of the results across countries. Additionally, conducting similar surveys over time will also reveal the changes that take place in teaching methods and assessment techniques.
7 A comparable figure for the US is not available.
JOURNAL OF ECONOMICS AND FINANCE EDUCATION • Volume 5 • Number 1 • Summer 2006
57
References Brown, Reva B. and Christopher J. Guilding. 1993. “A Survey of Teaching Methods Employed in University Business School Accounting Courses.” Accounting Education 2(3): 211-218. Byrd, Anthony K. and Yvette S. Harman. 1997. “A Teamwork Approach to Teaching Corporate Finance.” Financial Practice and Education 7(1): 67-72. Clinebell, John M. and Sharon K. Clinebell. 1995. “Computer Utilization in Finance Courses.” Financial Practice and Education 5(1): 132-142. Farooqi, Nauman and Kent T. Saunders. 2004. “A Note on Teaching Methods: The Canadian Experience.” Advances in Financial Education 2(1): 52-56. Gentry, James and Marlene Helgesen. 1999. “Using Learning Style Information to Improve the Core Financial Management Course.” Financial Practice and Education 9(1): 59-69. Helliar, Christine, and Lissa Monk. 2004. The British Accounting Review Research Register. Oxford: Elsevier. Ingram, Virginia and Janet S. Adams. 2003. “Effects of Team Learning on Success Rates in Introductory Finance.” Journal of Financial Education 29(3): 28-39. Locke, Ivy and Sonja Ebron. 1998. “The SPHINX Teaching Method and its Application to a Business Finance Course.” Financial Practice and Education 8(1): 120-126. Lucas, Ursula and Jan H. F. Meyer. 2005. “Towards a Mapping of the Student World: The Identification of Variation in Students Conceptions of, and Motivation to Learn, Introductory Finance.” The British Accounting Review 37(2): 177-204. Marks, Barry 1998. “An Examination of the Effectiveness of a Computerized Learning Aid in the Introductory Graduate Finance Course, Financial Practice and Education, 8(1): 127-132. Moore, William J., Robert J. Newman, and M. Dek Terrell. 2002. “Academic Economists’ Pay and Productivity: A Tale of Two Countries.” Working paper No. 2002_16, Louisiana State University: available at http://www.bus.lsu.edu/economics/papers/wp2002.html. Saunders, Kent T. 2000. “A Comparison of Own Group, Peer and Instructor Evaluation Scores for Group Oral Presentations.” Journal of Financial Education 26(3): 24-39. Saunders, Kent T. 2001. “Teaching Methods and Assessment Techniques for the Undergraduate Introductory Finance Course: A National Survey.” Journal of Applied Finance 11(1): 110-112.
JOURNAL OF ECONOMICS AND FINANCE EDUCATION • Volume 5 • Number 1 • Summer 2006
58
APPENDIX: The Survey Instrument and Responses
65 valid questionnaires while some respondents chose not to answer individual questions
A. Individual Characteristics 1. What is your sex? Male 46 Female 19 2. What is your academic rank? Instructor/Teaching Assistant 1 Lecturer 29 Senior Lecturer 19
Reader 0 Full Professor 12
Other (Please Specify) 4 3. What is your terminal degree? MA/MSc/MBA 26 PhD or DBA Finance 21 PhD or DBA Accounting 5 PhD or DBA Economics 7 Other 6
4 What professional designations do you hold? CFA 2 ACCA 4 CIMA 6 CA 9 CIPFA 4 Other 5 5. What is the total number of students taught by you in one semester on average (class size times number of classes taught)? Average = 175 Range: 12-600
B. Institution Characteristics 1. What is your institution type? Public 62 Private 1 2. What is the total number of undergraduate students enrolled in your institution? Average = 10,525 Less than 1000 1 1000-4999 3 5000-9999 16 10000-20000 30 More than 20000 2
3. What is the total number of undergraduate students graduating with a major or concentration in finance each year? Average = 99 Less than 10 1 10-24 6 25-49 3 50-75 15 More than 75 30 4. What type of accreditation does your business program has? Mark only one. AACSB 13 Other 16 None 19
JOURNAL OF ECONOMICS AND FINANCE EDUCATION • Volume 5 • Number 1 • Summer 2006
59
C. Classroom Characteristics 1. What is the typical lecture class size for the
introductory course in finance?
Less than 40 2 40-74 9 75-149 19 150-299 22 More than 300 19 2. What is the typical seminar/workshop/tutorial class
size for the introductory course in finance? Less than 15 2
15-19 12 20-24 24 25-29 13 More than 30 10 3. In what type of classroom do you usually take
lectures? Group table with 3-8 movable chairs 0 Rows of individual tablet arm-chairs 2 Rows of tables with movable chairs 5 Tiered auditorium style classroom 58 Other (Please Specify) 0 4. In what type of classroom do you usually take
seminars/workshops/tutorials? Group table with 3-8 movable chairs 7 Rows of individual tablet arm-chairs 13 Rows of tables with movable chairs 38 Tiered auditorium style classroom 3 Other (Please Specify) 2
5. What audio/visual equipment is available for instructor use/demonstration in the classroom for taking lectures? Mark all that apply Computer 54
Multimedia/Data Projector 57 Internet connection in classroom 47 Overhead Projector 63 TV/VCR 45 DVD Player 26 Other (Please Specify) 1 6. What audio/visual equipment is available for
instructor use/demonstration in the classroom for taking seminars/workshops/tutorials? Mark all that apply
Computer 35 Multimedia/Data Projector 34 Internet connection in classroom 27 Overhead Projector 58 TV/VCR 27 DVD Player 15 Other (Please Specify) 1 7. Do students have access to computers in the classroom? Mark only one for each Lecture Yes 4 Seminar Yes 12 No 61 No 51
JOURNAL OF ECONOMICS AND FINANCE EDUCATION • Volume 5 • Number 1 • Summer 2006
60
D. Teaching Methods 1. Which textbook do you currently use for the introductory finance course? 10 Corporate Financial Management by Arnold 7 Corporate Finance by Brealey and Myers 5 Corporate Finance by Ross, etc. 4 Accounting and Finance by Atrill and McLaney 4 Corporate Finance by Watson and Head
3 Corporate Finance by Brealey, Myers, and Marcus
3 Corporate Finance by Lumby and Jones 2 Business Finance by McLaney
2 Corporate Finance by Pike and Neale 13 Others with 1 each 2. What teaching methods do you use in class?
Using the 0-4 scale below indicate the level of use or percentage of class time devoted to each of the
following methods. 0= Never 1=Rarely, 1-10% of the time 2=Occasionally, 11-33% of the time 3=Frequently, 34-65% of the time 4= Usually or Always, 66-100% of the time Method: 0 1 2 3 4 Videotapes/Televisions 40 18 6 0 0 Guest Lectures 27 22 14 1 0 Instructor Power Point Lecture 12 7 9 7 30 Instructor OHP Lecture 3 8 9 15 25 Instructor Writing on Board Lecture 13 6 15 16 13 Instructor Computer Demonstration 22 18 15 2 5 Instructor Led Case Study 25 13 19 5 1 Instructor Led Problem Solving 13 8 17 16 9 Newspaper Article Discussion 26 13 18 6 0 Magazine Article Text Discussion 27 15 15 6 0 Journal Article Discussion 13 15 23 11 2 Individual Student Presentations 20 16 20 6 1 Individual Student Computer Work 34 12 10 5 2 Group of Students Presentation 21 15 21 5 1 Group of Students Computer Work 40 12 7 3 1 Small Group Activities 20 11 20 10 2 Student Debates 33 18 5 7 0 Other: 2 other 3. Which tool do you use most frequently when teaching time value of money concepts? Mark only one. Financial Calculator 6 Formulas 21
Formulas w/ Calculator (non-financial) 10 Spreadsheet 7 Tables 6 Tables w/ Calculator (non-financial) 10 Other (other specify) _____ 4. What assignments do you use outside of class? Using the 0-4 scale below indicate the level of use or how many out of class assignments you would have for each of the following assignments based on a 15 credit semester course. 0= None 1=Rarely, 1-2 assignments 2=Occasionally, 3-5 assignments 3=Frequently, 6-9 assignments 4= Usually or Always, 10 or more assignments Assignment: 0 1 2 3 4 Videotapes/Television 59 3 2 0 0 Guest Lecture 57 5 2 0 0 Case Studies 29 9 13 9 4 Textbook Reading 17 1 7 20 20 Workbook Assignments 29 5 8 14 8 Newspaper Article Reading 28 12 14 8 3 Magazine Article Reading 26 15 12 8 3 Journal Article Reading 20 9 17 12 7 Individual Computer Work 30 8 14 5 6 Individual Take Home Quizzes 43 9 7 3 2 Individual Take Home Tests 39 13 5 3 4 Individual Papers 32 4 10 9 8 Group Computer Work 45 9 5 3 2 Group Homework 38 7 10 7 1 Group Take Home Quizzes 55 7 2 0 0 Group Take Home Tests 58 5 1 0 0 Group Papers 47 5 9 1 1 Small Group Activities 41 7 10 2 4 WebCT, Blackboard, etc 43 6 5 3 6 Textbook web sites/Publishers web sites 42 4 6 6 5 Other (Please Specify): 2 other 5. Do you have an Internet homepage that you use in teaching your class? Mark only one Yes 36 No 28 6. Do you use a workbook/student-guide in addition to the textbook? Mark only one Yes 31 No 34
JOURNAL OF ECONOMICS AND FINANCE EDUCATION • Volume 5 • Number 1 • Summer 2006
61
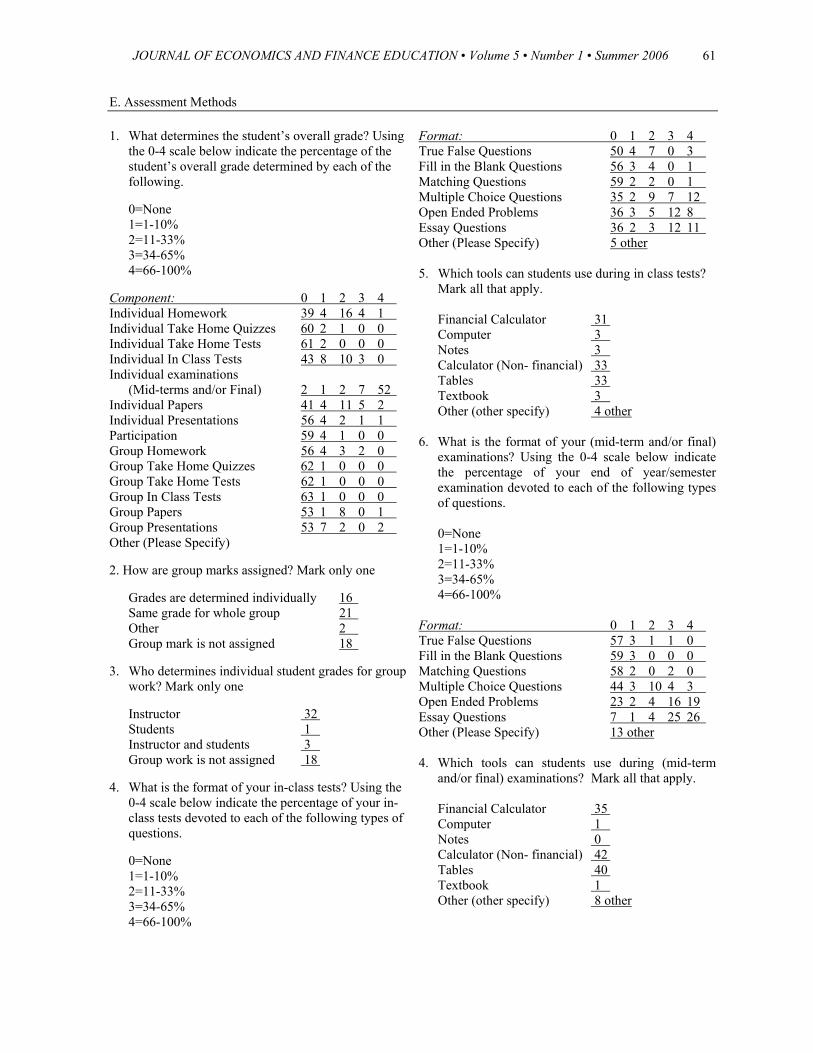
E. Assessment Methods 1. What determines the student’s overall grade? Using the 0-4 scale below indicate the percentage of the student’s overall grade determined by each of the following. 0=None 1=1-10% 2=11-33% 3=34-65% 4=66-100% Component: 0 1 2 3 4 Individual Homework 39 4 16 4 1 Individual Take Home Quizzes 60 2 1 0 0 Individual Take Home Tests 61 2 0 0 0 Individual In Class Tests 43 8 10 3 0 Individual examinations (Mid-terms and/or Final) 2 1 2 7 52 Individual Papers 41 4 11 5 2 Individual Presentations 56 4 2 1 1 Participation 59 4 1 0 0 Group Homework 56 4 3 2 0 Group Take Home Quizzes 62 1 0 0 0 Group Take Home Tests 62 1 0 0 0 Group In Class Tests 63 1 0 0 0 Group Papers 53 1 8 0 1 Group Presentations 53 7 2 0 2 Other (Please Specify) 2. How are group marks assigned? Mark only one Grades are determined individually 16 Same grade for whole group 21 Other 2 Group mark is not assigned 18 3. Who determines individual student grades for group work? Mark only one Instructor 32 Students 1 Instructor and students 3 Group work is not assigned 18 4. What is the format of your in-class tests? Using the 0-4 scale below indicate the percentage of your in- class tests devoted to each of the following types of questions. 0=None 1=1-10% 2=11-33% 3=34-65% 4=66-100%
Format: 0 1 2 3 4 True False Questions 50 4 7 0 3 Fill in the Blank Questions 56 3 4 0 1 Matching Questions 59 2 2 0 1 Multiple Choice Questions 35 2 9 7 12 Open Ended Problems 36 3 5 12 8 Essay Questions 36 2 3 12 11 Other (Please Specify) 5 other 5. Which tools can students use during in class tests? Mark all that apply. Financial Calculator 31 Computer 3 Notes 3 Calculator (Non- financial) 33 Tables 33 Textbook 3 Other (other specify) 4 other 6. What is the format of your (mid-term and/or final)
examinations? Using the 0-4 scale below indicate the percentage of your end of year/semester examination devoted to each of the following types of questions.
0=None 1=1-10% 2=11-33% 3=34-65% 4=66-100% Format: 0 1 2 3 4 True False Questions 57 3 1 1 0 Fill in the Blank Questions 59 3 0 0 0 Matching Questions 58 2 0 2 0 Multiple Choice Questions 44 3 10 4 3 Open Ended Problems 23 2 4 16 19 Essay Questions 7 1 4 25 26 Other (Please Specify) 13 other 4. Which tools can students use during (mid-term
and/or final) examinations? Mark all that apply. Financial Calculator 35 Computer 1 Notes 0 Calculator (Non- financial) 42 Tables 40 Textbook 1 Other (other specify) 8 other