26
Teaching Research Methods: Resources for HE Social Sciences Practitioners Sampling
| Date post: | 18-Dec-2015 |
| Category: |
Documents |
| Upload: | briana-carr |
| View: | 215 times |
| Download: | 0 times |

Teaching Research Methods: Resources for HE Social Sciences Practitioners
Sampling

Teaching Research Methods: Resources for HE Social Sciences Practitioners
Session Objectives
By the end of the session you will be able to:
• Explain what sampling means in research• List the different sampling methods available• Have had an introduction to confidence levels
and confidence intervals

Teaching Research Methods: Resources for HE Social Sciences Practitioners
Sampling• Sample frame = the target population you wish to research
• Census = all the respondents in the sample frame participating in the research
• Sample = a smaller group selected from the sample frame to participate in the research
• Sample method = the technique used to select the sample

Teaching Research Methods: Resources for HE Social Sciences Practitioners
Representativeness• The aim of any sample is to represent the
characteristics of the sample frame.• There are a number of different methods
used to generate a sample. • As a researcher you will have to select the
most appropriate method meet the requirements of your research.

Teaching Research Methods: Resources for HE Social Sciences Practitioners
Task – 10 mins – Small groups
• Match up the type of sampling with the descriptions
Sampling Methods

Teaching Research Methods: Resources for HE Social Sciences Practitioners
Sampling
• Sampling methods can be split into two distinct groups:
1. Probability samples2. Non-probability samples

Teaching Research Methods: Resources for HE Social Sciences Practitioners
Probability Samples Probability samples offer each respondent an equal probability or chance at being included in the sample. They are considered to be:• Objective • Empirical• Scientific• Quantitative• Representative
Sampling

Teaching Research Methods: Resources for HE Social Sciences Practitioners
Non Probability SamplesA non probability sample relies on the researcher selecting the respondents. They are considered to be:• Interpretivist • Subjective • Not scientific • Qualitative • Unrepresentative
Sampling

Teaching Research Methods: Resources for HE Social Sciences Practitioners
Probability Sampling Methods
• Random Sampling• Systematic Random Sampling• Stratified Random Sampling• Cluster Random Sampling • Quota Random Sampling• Multi-Stage Sampling

Teaching Research Methods: Resources for HE Social Sciences Practitioners
Random Sampling
• This involves selecting anybody from the sample frame entirely at random.
• Random means that each person within the sample frame has an equal chance of being selected.
• In order to be random, a full list of everyone within a sample frame is required.
• Random number tables or a computer is then used to select respondents at random from the
list.

Teaching Research Methods: Resources for HE Social Sciences Practitioners
Systematic Random Sampling
• This selection is like random sampling but rather than use random tables or a computer to select your respondents you select them in a systematic way.
• E.g. every tenth person on the college list is selected.

Teaching Research Methods: Resources for HE Social Sciences Practitioners
Stratified Random Sampling
• An appropriate group is decided upon i.e. female, male, 16 –18 year olds and the participants are picked randomly from within the strata

Teaching Research Methods: Resources for HE Social Sciences Practitioners
Cluster Random Sampling• Similar to stratified sampling
but the groups are selected for their geographical location
• i.e. school children within a particular school.
• The school is the cluster with the children being selected randomly from within the cluster

Teaching Research Methods: Resources for HE Social Sciences Practitioners
Quota Random Sampling
• Having decided on the characteristics of the sample frame, a sample is selected to meet these characteristics.
• E.g. if the sample frame is car drivers and the car driving population is 55% male and 45% female then the quota would require the same proportions.
• Participants would be selected to fill this quota using the random method

Teaching Research Methods: Resources for HE Social Sciences Practitioners
Non-probability Sampling
• Convenience Sampling • Snowball Sampling
• These non-probability methods can be used in conjuncture with the cluster, quota or stratified methods, however they will remain non-probability samples

Teaching Research Methods: Resources for HE Social Sciences Practitioners
Convenience Sampling
• This involves selecting the nearest and most convenient people to participate in the research.
• This method of selection is not representative and is considered a very unsatisfactory way to conduct research.

Teaching Research Methods: Resources for HE Social Sciences Practitioners
Snowball Sampling• This type of sampling is used when the research is
focused on participants with very specific characteristics such as being members of a gang.
• Having identified and contacted one gang member the researcher asks to be put in touch with any friends or associates who are also gang members.
• This type of sampling is not representative however is useful, especially where the groups in the research are not socially organised i.e. they do not have clubs or membership lists.

Teaching Research Methods: Resources for HE Social Sciences Practitioners
Sampling Methods
Task – 10 mins – Small groups
• Return to the task and see how many you got right and put right any you got wrong.

Teaching Research Methods: Resources for HE Social Sciences Practitioners
Quantitative Research - Sample Size
• When conducting probability sampling it is important to use a sample size that is appropriate to the aims and objectives of the research.
• There are tables recommending sample size (see de Vaus, 1996 pp 71-72) but as a general rule the smaller the total sample frame the larger the sample ratio needs to be.
• A common error is to assume that the sample should be a certain percentage of the population, for example 10%. In reality there is no such relationship and it only the size of the sample that is important.
• A probability sample size of 100+ is considered a large enough sample to conduct statistical analysis

Teaching Research Methods: Resources for HE Social Sciences Practitioners
Statistics and Samples
• When presenting your research you need to be able to demonstrate, how representative of the whole population the sample data you have collected is.
• There are two statistical test used to do this:• Standard Error• Confidence Levels

Teaching Research Methods: Resources for HE Social Sciences Practitioners
Standard Error• Using the standard deviation of the population and
the sample size a statistical calculation can measure the degree of error likely to occur between the results of a sample and the results of a census, this is call the standard error.
• The larger the sample the lower the standard error. • When a probability sample of 100+ is undertaken
the distribution can usually be assumed to be normal
• When the sample has normal distribution, we can use the z score approach to obtain confidence limits for the sample mean.

Teaching Research Methods: Resources for HE Social Sciences Practitioners
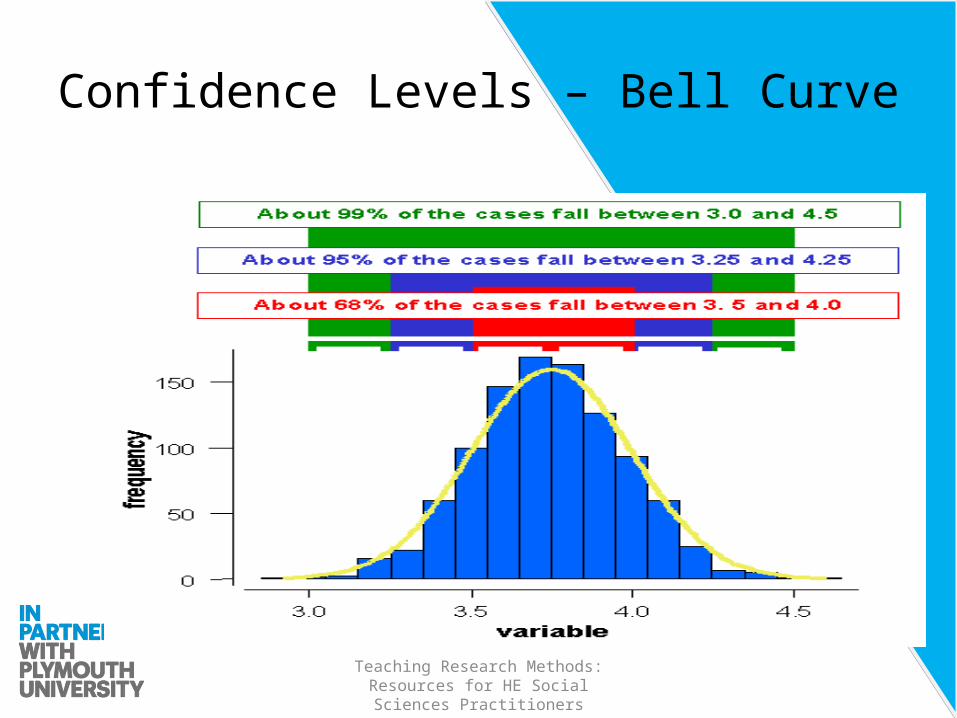
Confidence Levels• Confidence levels are calculated using the
Central Limit Theorem • Using this and the sampling error we can then
use the area below the normal distribution curve to make predictions about our sample.
• As well as making predictions we can use the properties of the normal distribution curve to provide us with confidence levels
• There are three confidence levels 68%, 95% and 99%

Teaching Research Methods: Resources for HE Social Sciences Practitioners
Confidence Levels
• The concept does not mean that we are 95% sure that a single sample mean lies within these limits.
• The 95% confidence limits mean that if we drew many samples, and find the mean for each, then we can expect 95% of the sample means to lie within the stated limits.
• 95% confidence is considered acceptable in social research, medical research often requires 99% confidence
Teaching Research Methods: Resources for HE Social Sciences Practitioners
Confidence Levels – Bell Curve

Teaching Research Methods: Resources for HE Social Sciences Practitioners
Review
• Can you explain what sampling means in research?
• Can you list the different sampling methods available?
• Have had an introduction to confidence levels and sample error?

Teaching Research Methods: Resources for HE Social Sciences Practitioners
Further Reading
• Drummond, A. (1996) Research methods for therapists. Cheltenham, Nelson Thornes
• Fielding J and Gilbert N (2000) Understanding social statistics London: Sage
• Thomas J R and Nelson J K (2001) Research methods in physical activity 4th Ed, Leeds, Human Kinetics
• Trochim W (2007) available at www.socialresearchmethods.net/kb/sampstat.php


