Fall 2010 93 Teaching the Fundamental of Ben Graham and Warren Buffett James Kuhle and Suzanne M. Ogilby California State University - Sacramento Given today’s investment environment and the recent Bear market confronting investors, it is more important than ever to take a reasoned, fundamental approach to selecting common stocks. This paper presents a fundamental approach to selecting common stocks based upon the precepts of Benjamin Graham and Warren Buffett. The paper presents a detailed description of a semester investment project that incorporates different analysis and models to identify publicly traded corporations that are “good buys” based on intrinsic value and future prospects for growth. Key Words: Buffett, Graham, Fundamental Financial Analysis Disciplines of Interest: Investment Analysis, Financial Analysis INTRODUCTION Given today’s investment environment, there is more interest than ever in doing sound fundamental financial analysis. Fundamental analysis is that area of stock investment that uses critical data from income statements, balance sheets, cash flow analysis, and historic industry data to determine the financial well-being and future prospects of a corporation. The process of fundamental analysis has many methods and forms that are practiced by various financial analysts. There is no “one right way” to do fundamental analysis. However, the purpose of this article is to illustrate a systematic process for teaching fundamental stock analysis for the purpose of analyzing the potential investment opportunity of a publicly traded corporation. This process is part of a required semester term project taught in a financial investment class at California State University, Sacramento in the College of Business Administration. The analysis is composed of various components with multiple steps within each component of the project. First, an ex-post ratio and DuPont analysis is used to determine the current financial well-being of the company in question. Second, a strategic financial analysis using Value Line Investment Survey data is performed using various analytical models to calculate and present key fundamental performance variables as well as identifiable non-quantitative variables. An important by-product of the strategic financial analysis is that it forces the
Transcript
Fall 2010 93
Teaching the Fundamental of Ben Grahamand Warren Buffett
James Kuhle and Suzanne M. OgilbyCalifornia State University - Sacramento
Given today’s investment environment and the recent Bear market confrontinginvestors, it is more important than ever to take a reasoned, fundamentalapproach to selecting common stocks. This paper presents a fundamentalapproach to selecting common stocks based upon the precepts of BenjaminGraham and Warren Buffett. The paper presents a detailed description of asemester investment project that incorporates different analysis and models toidentify publicly traded corporations that are “good buys” based on intrinsicvalue and future prospects for growth.
Key Words: Buffett, Graham, Fundamental Financial AnalysisDisciplines of Interest: Investment Analysis, Financial Analysis
INTRODUCTION
Given today’s investment environment, there is more interest than ever in doingsound fundamental financial analysis. Fundamental analysis is that area of stockinvestment that uses critical data from income statements, balance sheets, cash flowanalysis, and historic industry data to determine the financial well-being and futureprospects of a corporation. The process of fundamental analysis has many methods andforms that are practiced by various financial analysts. There is no “one right way” to dofundamental analysis. However, the purpose of this article is to illustrate a systematicprocess for teaching fundamental stock analysis for the purpose of analyzing the potentialinvestment opportunity of a publicly traded corporation. This process is part of a requiredsemester term project taught in a financial investment class at California State University,Sacramento in the College of Business Administration. The analysis is composed ofvarious components with multiple steps within each component of the project. First, anex-post ratio and DuPont analysis is used to determine the current financial well-beingof the company in question. Second, a strategic financial analysis using Value LineInvestment Survey data is performed using various analytical models to calculate andpresent key fundamental performance variables as well as identifiable non-quantitativevariables. An important by-product of the strategic financial analysis is that it forces the
94 Journal of the Academy of Business Education
student to assess whether the company holds a long-term competitive advantage in itsindustry. Finally, the third element of the project involves developing the student’sability to forecast a firm’s intrinsic value and culminates in a decision and presentationby the student as to the investment viability of the company analyzed. The examplesused throughout this article are intended for illustrative purposes only.
HISTORIC BACKGROUND
Perhaps the best-known “fundamental” financial analyst was Benjamin Graham. Infact, Graham is often referred to as “the father of Fundamental Analysis” (Kahn & Milne,1977). The Graham model was based on information contained in the balance sheet andincome statement almost exclusively (Graham & Spencer, 1937). At the heart of theGraham model was the importance of not buying a stock but “investigating” a companyas if you were buying the business and then buying the business at a substantial discount(Lowe, 1994). Primarily, the intrinsic value of a business is derived exclusively from thecompany’s earnings power. But, as Graham discovered, a company's “normal earnings”could deviate substantially from reported earnings. Graham contended that earningpower should be evaluated in light of past earnings and long-term trends (Ross, 2000).According to Graham, earning power defines a company’s future prospects andultimately potential success for stockholders. Hence, if the market price continues toadvance, it is because of investors’ expectations for growth in earnings (Vick, 2000).Graham took fundamental analysis to a different level by utilizing methods that enabledan investor to search the market for bargains. Graham’s model used the net current assetvariable, defined as current assets minus current liabilities minus preferred stock minuslong-term debt. This “net current asset” variable was used to find those companies thatwere significantly undervalued or “out of favor” in the market. By purchasing stocksbelow the net current asset value, the investor buys a bargain because the fixed assets ofthe firm are purchased at a significant discount. The Graham model also takes intoaccount the earnings per share (EPS), the expected earnings growth rate, and the currentestimated yield on AAA rated corporate bonds market wide. Graham suggested thatsimple analytical models were the best (Lowe, 1994). Further, Graham had a dislike forthe use of high-powered mathematics such as calculus when doing investment analysis.He felt that whenever the analyst used anything but simple arithmetic or elementaryalgebra, this would be a clear indication of substituting theory for experience (Kahn &Milne, 1977). The student project discussed here requires a complete Graham analysisas part of the third and final step and is illustrated in Table 9.
There have been other fundamental investment experts who have followed Grahamincluding Warren Buffett, John Templeton, and Peter Lynch who have all beensuccessful using variations of the Graham model. All concede that finding undervaluedcompanies remains a possibility even in bull markets. In today’s environment, themarket is laden with target rich investment opportunities. These other variations are alsopresented to the student in lecture form, but are not part of the spreadsheet analysis.
Fall 2010 95
The models we present to the students represent variations of the Buffett model thatis based on projecting future investor cash flow. This forecasted cash flow is thendiscounted at a 15% required rate of return to arrive at the firm’s intrinsic value asrecommended by Buffett (Hagstrom, 2005). The fifteen percent discount rate is used sothat all students are using a uniform discount rate. This uniform rate is necessary inorder to make “apples to apples” comparisons among the different companies analyzed.Of course this rate can be changed to reflect individual investor preference. However,a number of “safety margins” are built into the Buffett model. Buffett practices thewisdom of Ben Graham who declared the “margin of safety” is important because it isessentially impossible to pinpoint the precise intrinsic value of a business and that thebest you can do is compute reasonable ranges of value based on reasonable assumptions(Cunningham, 2002). Buffett says that he would rather be approximately right thanprecisely wrong (Cunningham, 2001).
THE IMPORTANCE OF FUNDAMENTAL RATIO ANALYSIS
At the core of solid fundamental investment analysis is the ability to calculate,analyze, and interpret the meaning of financial ratios. Ratios can be characterized asdiagnostic tools that are used to discern changing patterns and potential trouble spots thatmay arise in the future business life of a firm. Ratios can best be described as a way ofstandardizing the performance of key financial variables found on the balance sheet andincome statement. For example, one of the key measures of a firm’s liquidity is thecurrent ratio. By definition, the current ratio is current assets divided by currentliabilities. Preferably the firm would like this ratio to be greater than one. Why?Because a ratio of 2.0 suggests that for every dollar of current liability we have twodollars in current assets to cover it. Taken in isolation, this ratio has little meaning. Itbecomes meaningful when it is compared on a historical basis and also compared toindustry averages. Therefore, the first step in the fundamental stock analysis project isto do a complete ratio analysis of the prospective investment company.
The Fundamental Stock Analysis Process: Student Term Project
Part A: Ex-Post Ratio and DuPont Analysis
The term project undertaken by the student begins with the analysis of both balancesheet and income statement data for a selected company. This information is downloadedfrom the company’s Annual Reports as presented by the Security and ExchangeCommission, which can normally be found at the company’s home web page. This datais compiled for the last three years and the student may need to rearrange theinformation into spreadsheets using standardized balance sheet and income statementcategories provided by the instructor. The spreadsheets are the basis for the student tocomplete a full ex-post ratio and DuPont analysis on the firm that they analyze duringthe course of the semester. Throughout this paper, we will use the Coca Cola Company
96 Journal of the Academy of Business Education
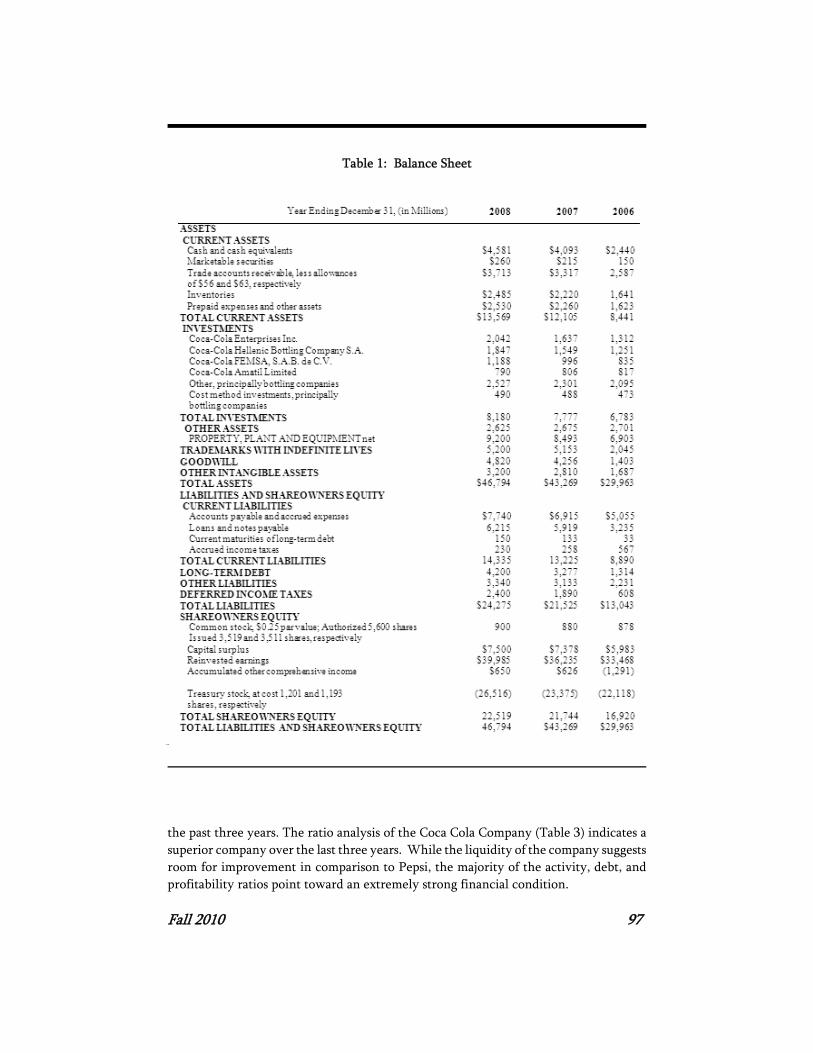
(Coke) as our example to illustrate the process. Tables 1 and 2 summarize the financialstatements for the last three years for the Coca Cola Company. In addition, the studentalso compiles financial data for his/her company’s nearest competitor. In this case Pepsiinformation would be downloaded.
Fundamental Ratio Analysis
The second step of the analysis requires the student to do a complete ratio analysisbased on the balance sheet and income statement data presented in Table 1 and 2. Thesetables represent the ratio analysis input sheets and are the primary input data that in turngenerates all other ex-post analysis. Once the figures are entered on the ratio analysisinput sheet, the industry average spreadsheets and the DuPont analysis are automaticallygenerated. The student begins the ex-post ratio analysis using integrative spreadsheetsthat calculate the necessary data (see Table 3). The ratio analysis has four majorcategories. The first category deals with the relative liquidity of the firm referred to asthe solvency ratios in Table 3. The liquidity of a firm is measured by its ability to satisfyits short-term obligations as they come due. Hence, liquidity measures the relative easeof paying bills. The basic measures of liquidity used in our project analysis are the quickratio, current ratio, cash ratio, and net working capital.
The second category of ratios calculated for the project analysis is the efficiencyratios. Efficiency ratios are used to measure the speed with which various accounts areconverted into sales or cash. These ratios also help to measure the relative efficiency ofa firm in utilizing its assets. These ratios include the average collection period, inventoryturnover, receivable turnover, fixed asset turnover ratio, and the total asset turnoverratio.
The third category of ratio analysis deals with the indebtedness of the firm, i.e.financial leverage ratios. A firm’s debt position can be assessed by looking at both itsdegree of indebtedness and its ability to pay its debts. The debt position of a firmindicates the amount of other people’s money being used in an attempt to generateprofits. In general, the investor is most concerned with long-term debts, since thesecommit the firm to paying interest over the long run. These ratios measure the degreeof financial leverage employed by the firm, which magnifies risk and return. The ratioscalculated in this category include the total debt ratio, the debt to equity ratio, long-termdebt ratio, and the times interest earned ratio.
The fourth category of ratios analyzes profitability. As a group, these ratios allow theinvestor to evaluate the firm’s earnings with respect to a given level of sales, assets, equityinvestment, and share value. These ratios include the gross profit margin, the net profitmargin, return on total assets, return on equity, and earnings per share as well as theprice to earnings ratio.
The remaining columns in Table 3 provide the cross-sectional analysis and time-series analysis. The cross-sectional analysis allows a direct comparison to the chosencompetitor and the time-series analysis allows for a trend comparison of the ratios over
Fall 2010 97
Table 1: Balance Sheet
the past three years. The ratio analysis of the Coca Cola Company (Table 3) indicates asuperior company over the last three years. While the liquidity of the company suggestsroom for improvement in comparison to Pepsi, the majority of the activity, debt, andprofitability ratios point toward an extremely strong financial condition.
98 Journal of the Academy of Business Education
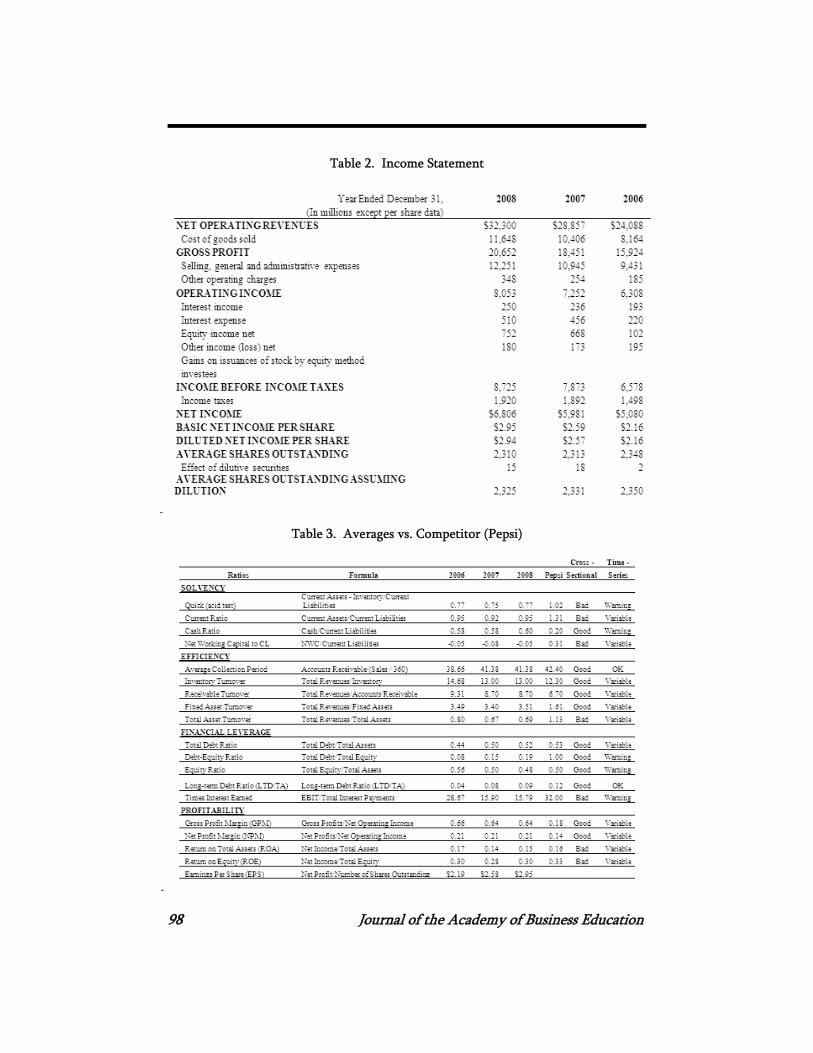
Table 2. Income Statement
Table 3. Averages vs. Competitor (Pepsi)
Fall 2010 99
Coke’s relative liquidity is substandard when compared with Pepsi. For example, thecurrent ratio has a value of .95 for 2008 in comparison to the Pepsi average of 1.02. Inaddition, Coke’s quick ratio also indicates less liquidity than the Pepsi average (.77 versus1.02) with a downward then an upward trend over the last three years. Therefore,Coke’s liquidity position could be characterized as substandard in comparison to Pepsi.
The efficiency ratios reveal a second dimension of the Coca Cola Company. Theseratios indicate the relative efficiency with which the company uses investor’s assets. Theaverage collection period suggests that Coke does a slightly better job of collecting theiroutstanding receivables when compared to Pepsi (41.38 days versus 42.4 days). Also, theinventory turnover ratio measures how rapidly the company “turns over” or uses dollarsinvested in inventory and converts them to sales. In the case of Coke, the inventoryturnover ratio indicates a downward trend over the three-year period. Further, in 2008,Coke’s inventory turnover ratio was superior when compared to Pepsi’s. The inventoryturnover ratio for 2008 was 13.00, in comparison to a Pepsi average of 12.30. Likewise,the three-year trend indicates a slight decrease in inventory turnover. Other activityratios indicate similar results when compared to Pepsi. For example, the Fixed AssetTurnover value is more favorable for Coke (3.51) versus Pepsi (1.61). However, the TotalAsset Turnover value is lower (.69) when compared to Pepsi (1.13).
The third group of ratios deals with the use of debt in the capital structure as wellas the ability to meet required interest payments from operating income. For Coke, alltotal debt ratios indicate a favorable assessment based on both the cross-sectional andtime-series analysis. The Equity ratio for 2008 is slightly substandard when comparedto Pepsi (.48 versus .50).
The fourth category of ratios deals with those that are most important to investors,i.e. profitability ratios. The gross profit margin for Coke is clearly superior in comparisonwith the Pepsi average (.64 versus .18). It is also obvious that the Coca Cola Companydoes a superior job of cost cutting resulting in higher operating profits when comparedto Pepsi. Further, the net profit margin indicates consistent performance on the part ofCoke. Coke has averaged 21% net return on Net Operating Income for the last threeyears. Also, the return on total assets ratio indicates favorable performance for the CocaCola Company. The 2008 return on total assets was equal to 15% compared to 16% forPepsi. Further, Coke’s return on equity has shown stable and consistent levels withreturns of 20%, 28%, and 30% for the last three years. Finally, Coke’s EPS has shown asteady increase over the three year period from $2.19 to $2.95.
DuPont Analysis
As previously stated, no one ratio gives a complete picture of the financial stabilityof the company. All ratios must be used in assessing the financial viability of the firm.The DuPont system is used at this point in the analysis to consider the impact of variousbalance sheet and income statement components in the formation of return on equity.
An essential part of the project analysis is to construct DuPont charts. The DuPont
100 Journal of the Academy of Business Education
analysis helps to complete the diagnosis of financial stability in concert with the ratioanalysis. The DuPont analysis provides a framework for dissecting the firm’s financialstatements in an effort to further diagnose trouble spots in the overall performance of thefirm. The DuPont analysis begins with information from the balance sheet and incomestatement provided in Tables 1 and 2 in calculating key performance and efficiencyratios. These ratios are then used to generate the values for return on total assets andmost importantly, the return on equity. The key value for the return on equity is afunction of the return on total assets and the financial leverage multiplier, whichmeasures the extent the corporation uses debt in its total capital structure. The financialleverage multiplier, in effect, measures the magnification effect of using other people’smoney.
As an example, the 2008 DuPont analysis for Coca Cola Company (Table 6) allowsthe student to consider all the “parts” that go into the return on equity value. The 2008return on equity of 24.08% is a function of two components, the return on total assets(ROA) and the financial leverage multiplier (FLM). These two components, whenmultiplied together, yield the return on equity. The strength of the DuPont system isfound in its ability to dissect and isolate financial areas of underperformance/concernwhich ultimately leads to a quicker solution of any internal problems. Notice in Table5, for example, Coke has a return on equity that is slightly below Pepsi. The DuPontsystem can pinpoint the general cause quickly. In this example, the cause of Coke’s sub-par performance is due to the lower Return on Total Assets, which comes from havinga lower Total Asset Turnover than Pepsi. Management can then use this information toexamine what is causing this lower turnover rate.
Part B: Strategic Financial Analysis
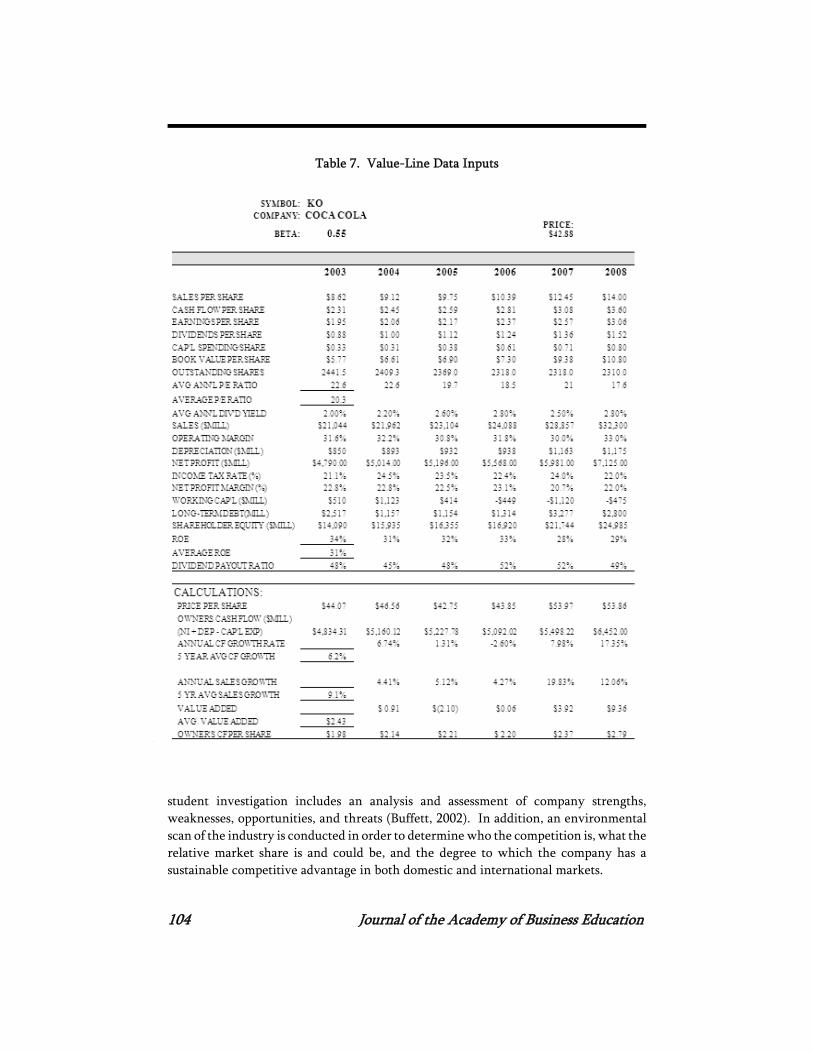
Strategic financial analysis is comprised of both a quantitative and non-quantitativeanalysis. The first step requires the student to input data from the Value Line InvestmentSurvey into the Value Line spreadsheet for analysis (see Table 7). This quantitative datawill be used in the forecast of the future performance and intrinsic value determinationin the final step of the student project. This data sheet reflects both historical andestimated financial data. In addition, various ratings are reported based on timeliness,safety, and technical investment prospects. Once this data is input, the Value Linespreadsheet provides a number of calculations that are used to calculate intrinsic valuesof the firm in the final part of this project. The key calculations from the Value Linespreadsheet (Table 7) are the value of owner’s cash flow, the average growth in owner’scash flow,and the value added. These key calculations are used as the basis for the ex-ante analysis performed in the final step of the student project.
Value Line Investment Cash flow Projections
The owner’s cash flow value is determined by taking net income plus depreciation
Fall 2010 101
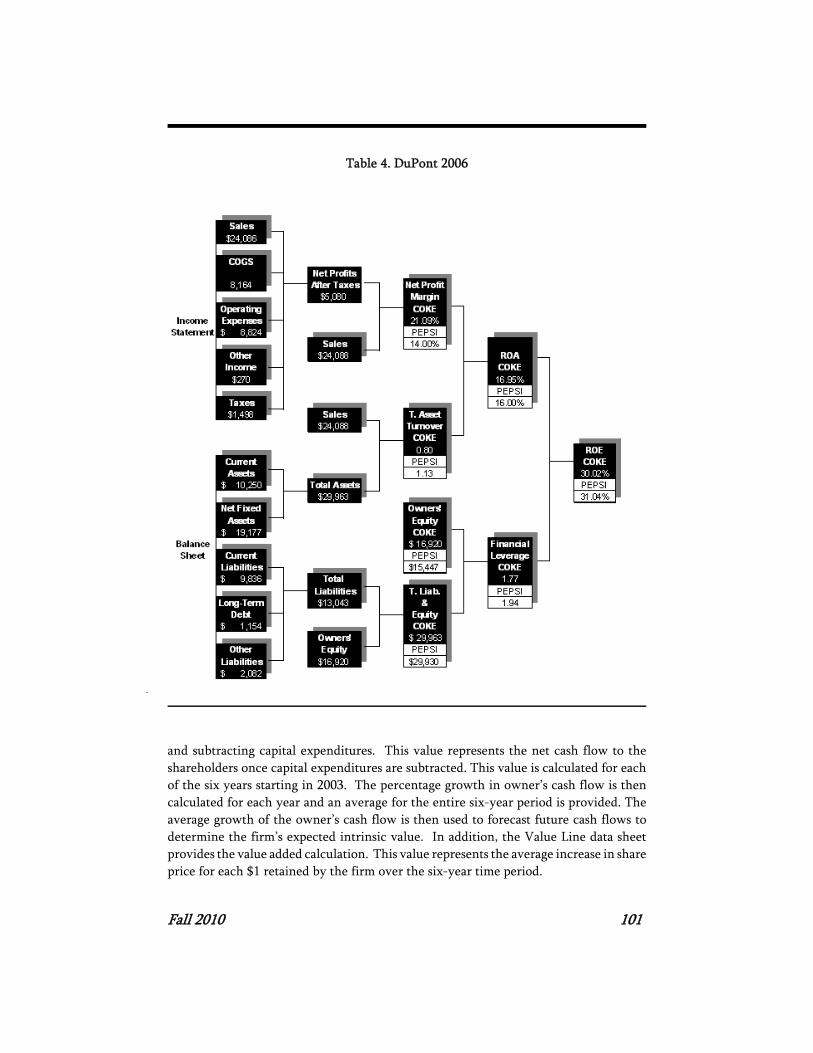
Table 4. DuPont 2006
and subtracting capital expenditures. This value represents the net cash flow to theshareholders once capital expenditures are subtracted. This value is calculated for eachof the six years starting in 2003. The percentage growth in owner’s cash flow is thencalculated for each year and an average for the entire six-year period is provided. Theaverage growth of the owner’s cash flow is then used to forecast future cash flows todetermine the firm’s expected intrinsic value. In addition, the Value Line data sheetprovides the value added calculation. This value represents the average increase in shareprice for each $1 retained by the firm over the six-year time period.
102 Journal of the Academy of Business Education
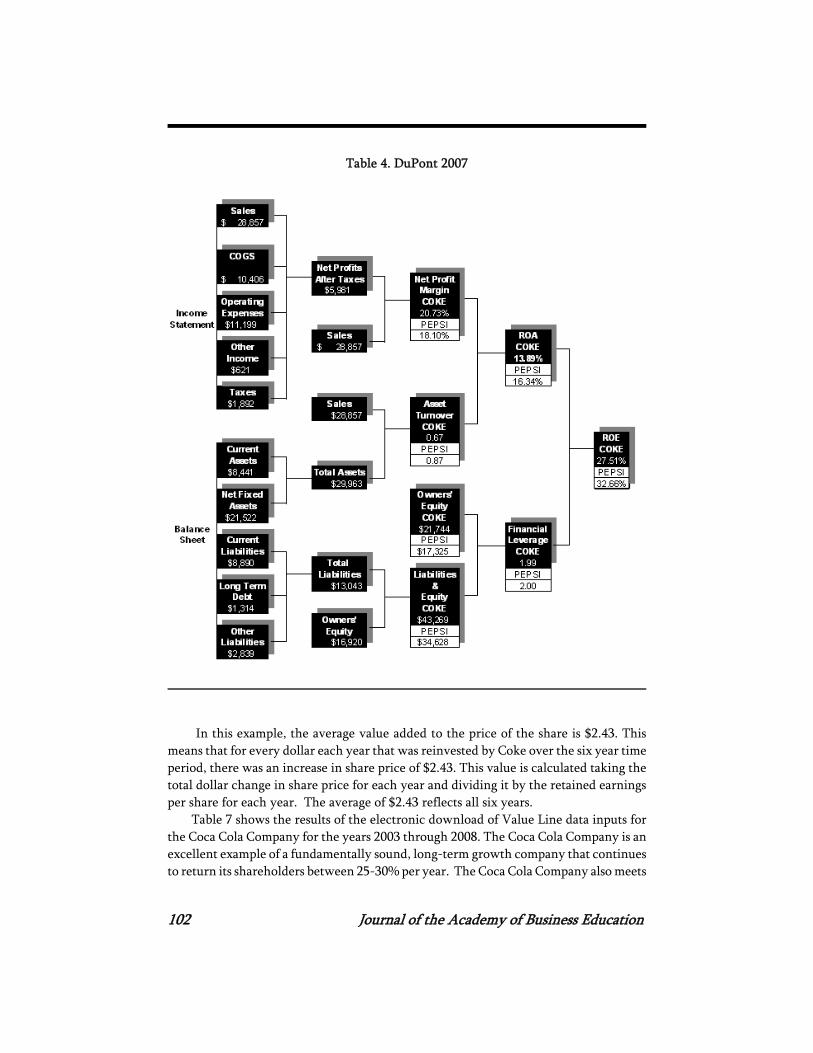
Table 4. DuPont 2007
In this example, the average value added to the price of the share is $2.43. Thismeans that for every dollar each year that was reinvested by Coke over the six year timeperiod, there was an increase in share price of $2.43. This value is calculated taking thetotal dollar change in share price for each year and dividing it by the retained earningsper share for each year. The average of $2.43 reflects all six years.
Table 7 shows the results of the electronic download of Value Line data inputs forthe Coca Cola Company for the years 2003 through 2008. The Coca Cola Company is anexcellent example of a fundamentally sound, long-term growth company that continuesto return its shareholders between 25-30% per year. The Coca Cola Company also meets
Fall 2010 103
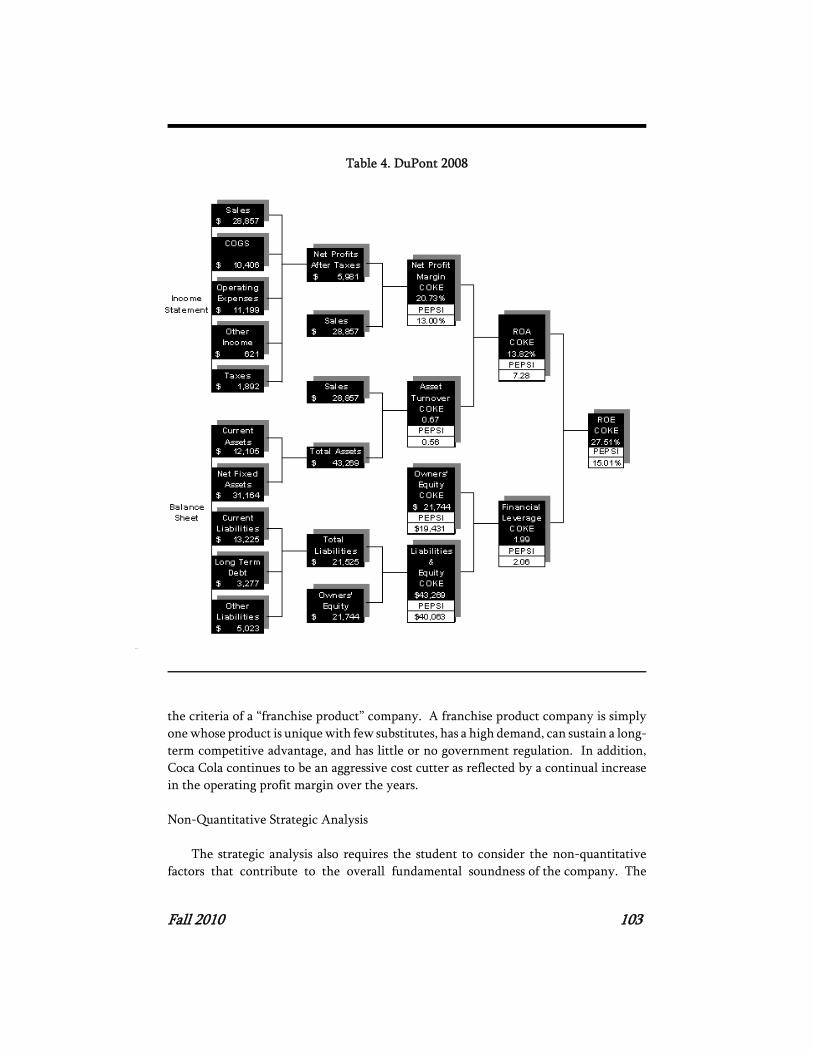
Table 4. DuPont 2008
the criteria of a “franchise product” company. A franchise product company is simplyone whose product is unique with few substitutes, has a high demand, can sustain a long-term competitive advantage, and has little or no government regulation. In addition,Coca Cola continues to be an aggressive cost cutter as reflected by a continual increasein the operating profit margin over the years.
Non-Quantitative Strategic Analysis
The strategic analysis also requires the student to consider the non-quantitativefactors that contribute to the overall fundamental soundness of the company. The
104 Journal of the Academy of Business Education
Table 7. Value-Line Data Inputs
student investigation includes an analysis and assessment of company strengths,weaknesses, opportunities, and threats (Buffett, 2002). In addition, an environmentalscan of the industry is conducted in order to determine who the competition is, what therelative market share is and could be, and the degree to which the company has asustainable competitive advantage in both domestic and international markets.
Fall 2010 105
The student is required to consider these non-quantitative factors in the finalanalysis of whether the company should be a prospective investment. These factorsinclude, but are not limited to, determining whether the company has and maintain a“monopoly” type product(s) and can sustain a long-term competitive advantage with itsproducts over the next 10-20 years. Here, the student will look at the quality of productsand the efficiency (cost) of making these products, along with the ability of the firm toprovide new and innovative products. In this process, the student is normally able toidentify the distinctive competencies of the firm being analyzed and the durability ofcompetitive advantage. This requires the student to do a great deal in the area of product,brand, and sales analysis along with the financial analysis already discussed.
The non-quantitative analysis of Coke reveals that the company has many strengthsand opportunities with minor weaknesses and threats. First, Coke is clearly a franchiseproduct - this is its major strength. The ability to get the product to the customer at theleast cost and when they want it is a strength that is surpassed only by Cokes advertisingprowess. Internationally, Coca Cola has a major presence in both the Chinese and Indianmarkets with distribution networks that have been in place for a number of years. Coke’srelative success in these markets has helped to generate a 9.1% sales growth rate over thelast six years.
Part C: Forecasting the Firm’s Intrinsic Value
This part of the project requires the determination of an intrinsic value for thecompany. The six year historic data from the strategic financial analysis step as presentedin Table 7 is used to determine a number of key forecasting variables for the intrinsicvalue model. The key input variables from Table 7 are owner’s cash flow, growth inowner’s cash flow, and the six-year average growth rate in owner’s cash flow. Then, theintrinsic value for the company is based on projected “owner’s cash flow” over the nextten years.
Forecasting Intrinsic Value
The “owner’s cash flow” value for the most recent year is used as a beginningvariable for the ten-year intrinsic value forecast. The average growth rate in owner’scash flow becomes the next key variable in projecting future cash flows. The 5-yearaverage cash flow growth rate is used to project the annual cash flow values over the next10 years that will ultimately be discounted and used in the determination of thecompany’s intrinsic value. For example, the Coca Cola Company has a five-year averagegrowth rate of 6.2% (Table 7). This historic calculated value is then used as the 10-yeargrowth rate for the forecasted cash flows that are used in determining the intrinsic valueunder a “most likely”, “pessimistic”, and “optimistic” scenario as summarized in Table 8.
The total intrinsic value is composed of two sums. The first calculation for intrinsicvalue is the discounted ten-year cash flows summed and discounted at the investor
106 Journal of the Academy of Business Education
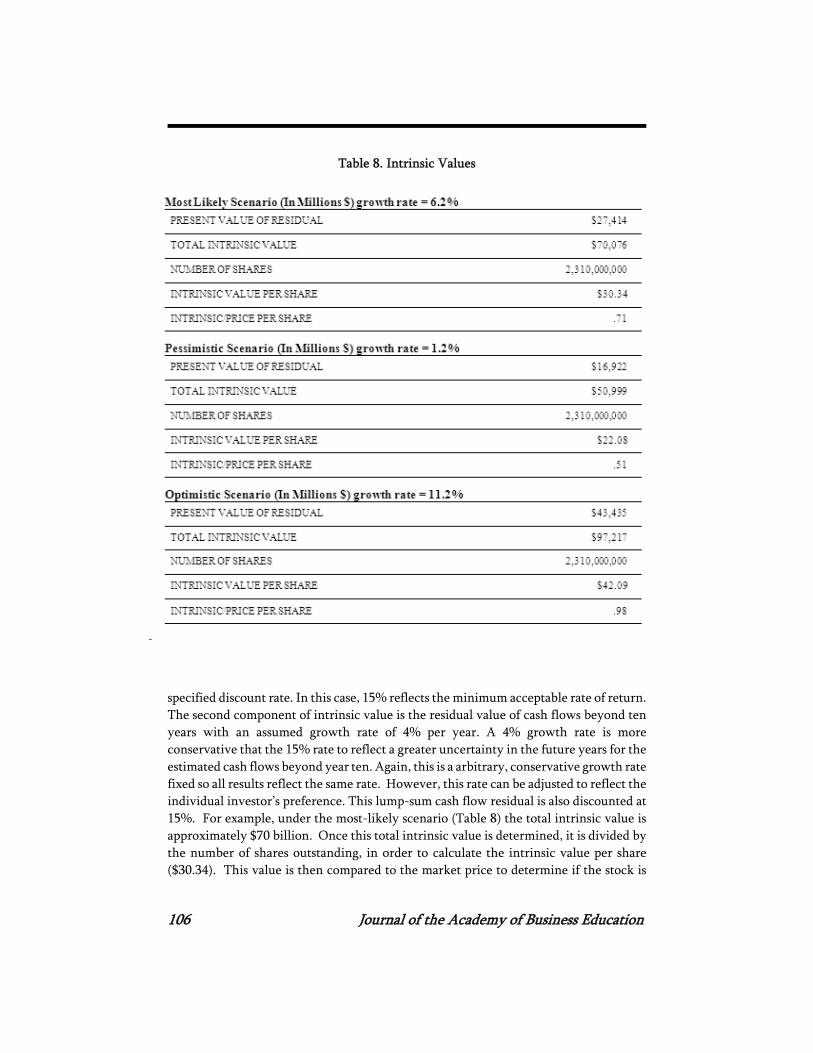
Table 8. Intrinsic Values
specified discount rate. In this case, 15% reflects the minimum acceptable rate of return.The second component of intrinsic value is the residual value of cash flows beyond tenyears with an assumed growth rate of 4% per year. A 4% growth rate is moreconservative that the 15% rate to reflect a greater uncertainty in the future years for theestimated cash flows beyond year ten. Again, this is a arbitrary, conservative growth ratefixed so all results reflect the same rate. However, this rate can be adjusted to reflect theindividual investor’s preference. This lump-sum cash flow residual is also discounted at15%. For example, under the most-likely scenario (Table 8) the total intrinsic value isapproximately $70 billion. Once this total intrinsic value is determined, it is divided bythe number of shares outstanding, in order to calculate the intrinsic value per share($30.34). This value is then compared to the market price to determine if the stock is
Fall 2010 107
selling at a discount. With a current market price of $42.88, it is clear that Coke is notselling at a bargain price. Table 8 presents three different scenarios; a most likely,pessimistic, and optimistic forecast. The most likely scenario is based on a growth ratein owner’s cash flow of the calculated actual growth of 6.2%. The pessimistic andoptimistic scenarios represent a plus and minus five percent either added to or subtractedfrom the 6.2% average. The Table 8 statistics are summarized in the last value for eachscenario, the intrinsic/price per share ratio. This ratio expresses the intrinsic valuereceived for each dollar invested. As can be seen from the data, even the optimisticscenario yields a ratio of .98, which states that for every dollar invested, the intrinsicvalue is only $.98.
Graham Model
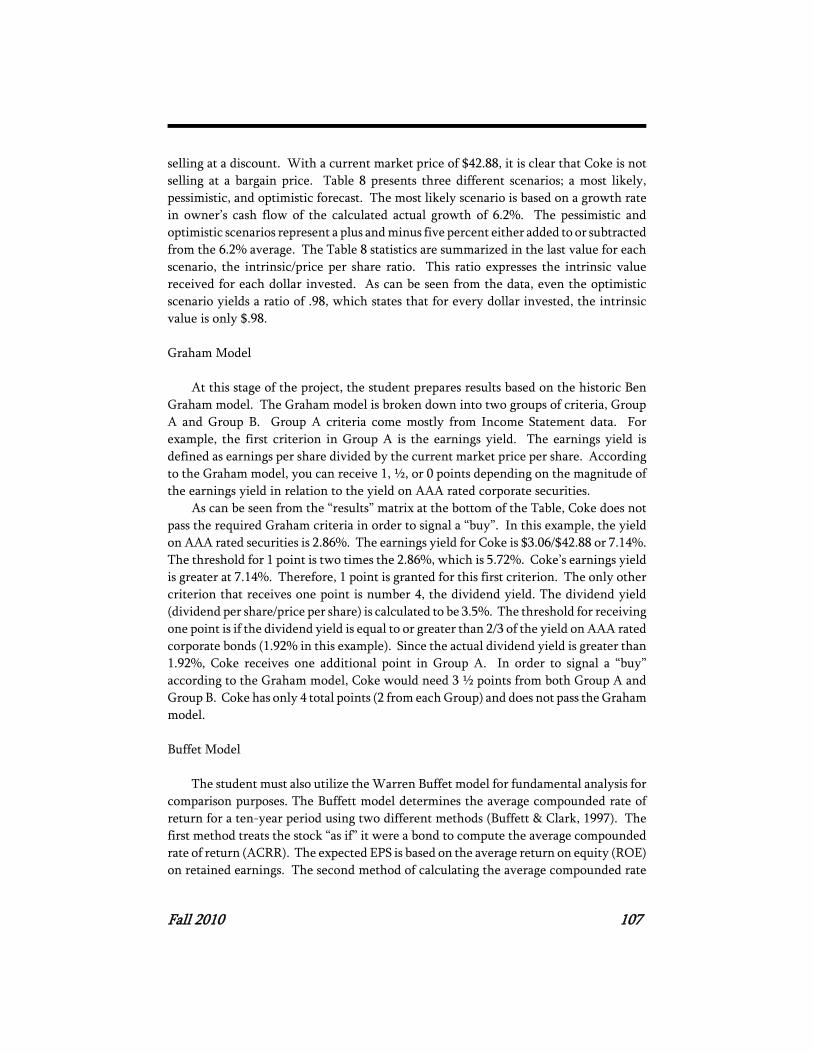
At this stage of the project, the student prepares results based on the historic BenGraham model. The Graham model is broken down into two groups of criteria, GroupA and Group B. Group A criteria come mostly from Income Statement data. Forexample, the first criterion in Group A is the earnings yield. The earnings yield isdefined as earnings per share divided by the current market price per share. Accordingto the Graham model, you can receive 1, ½, or 0 points depending on the magnitude ofthe earnings yield in relation to the yield on AAA rated corporate securities.
As can be seen from the “results” matrix at the bottom of the Table, Coke does notpass the required Graham criteria in order to signal a “buy”. In this example, the yieldon AAA rated securities is 2.86%. The earnings yield for Coke is $3.06/$42.88 or 7.14%.The threshold for 1 point is two times the 2.86%, which is 5.72%. Coke’s earnings yieldis greater at 7.14%. Therefore, 1 point is granted for this first criterion. The only othercriterion that receives one point is number 4, the dividend yield. The dividend yield(dividend per share/price per share) is calculated to be 3.5%. The threshold for receivingone point is if the dividend yield is equal to or greater than 2/3 of the yield on AAA ratedcorporate bonds (1.92% in this example). Since the actual dividend yield is greater than1.92%, Coke receives one additional point in Group A. In order to signal a “buy”according to the Graham model, Coke would need 3 ½ points from both Group A andGroup B. Coke has only 4 total points (2 from each Group) and does not pass the Grahammodel.
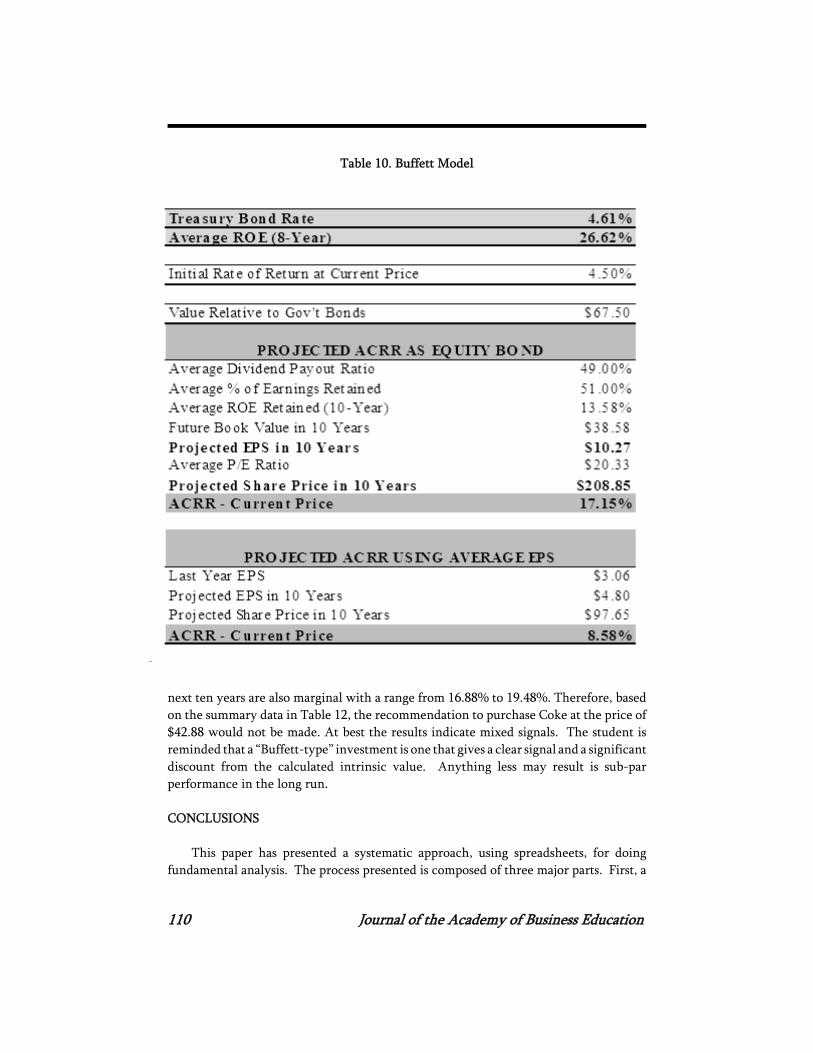
Buffet Model
The student must also utilize the Warren Buffet model for fundamental analysis forcomparison purposes. The Buffett model determines the average compounded rate ofreturn for a ten-year period using two different methods (Buffett & Clark, 1997). Thefirst method treats the stock “as if” it were a bond to compute the average compoundedrate of return (ACRR). The expected EPS is based on the average return on equity (ROE)on retained earnings. The second method of calculating the average compounded rate
108 Journal of the Academy of Business Education
Table 9. Graham Model
Fall 2010 109
of return is based on the projected growth in EPS. This process projects the future shareprice based on a projected EPS value in ten years. This projected price is then used todetermine the annual growth rate from the current price today.
Table 10 presents the results of the Buffett model for our example. Based on thisanalysis Coke could be expected to yield 17.15% per year based on its dividend payoutand projected earnings per share. In our example, the current price used is $42.88, whichgrows to $97.65 in ten years. The calculated growth rate is 8.58% per year. Thisrepresents the annual compounded rate of return over the 10 year period.
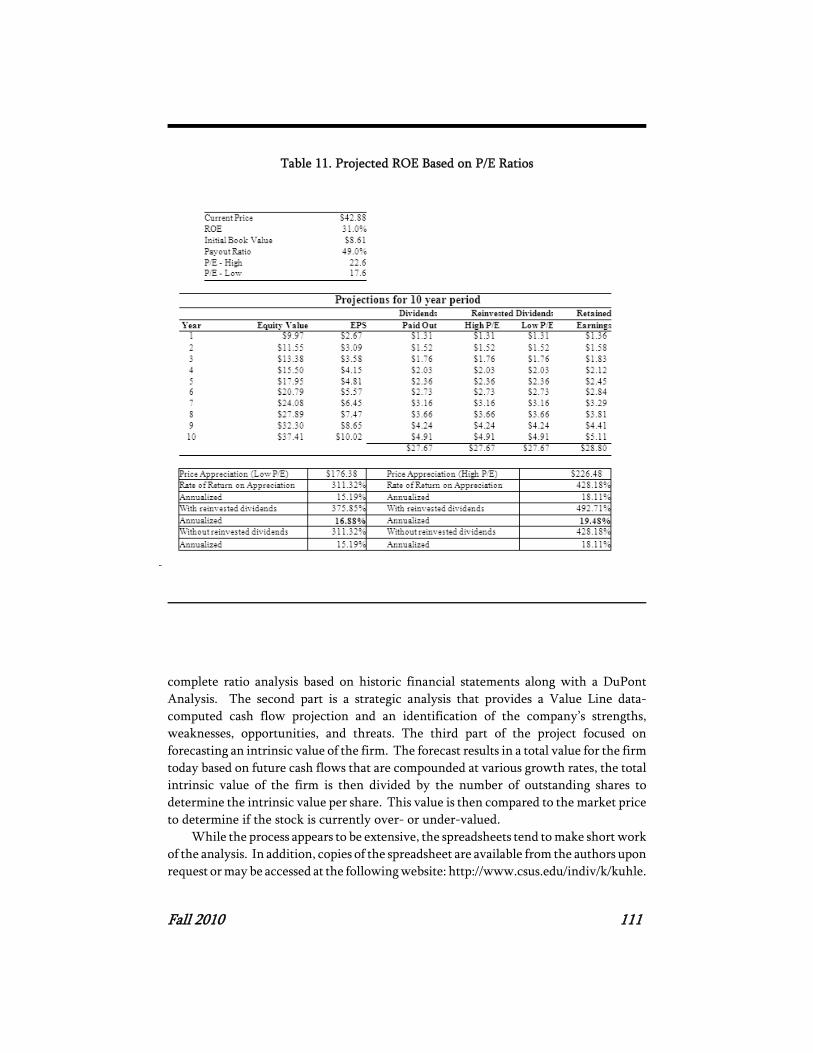
ROE Model
The final comparative model the student prepares is the ROE Model. The purposeof the ROE Model is to present an estimation of the future return on equity for a ten yearperiod. This model is based on using a range in P/E ratios that come directly from theValue Line data. Table 11 presents the projected return on equity values over the nextten years. In our example, Coke has a potential range in ROE values of 16.88% (with alow P/E of 17.6), or 19.48% (with a high P/E of 22.6). Based on the 15% investor returnexpectation, this analysis would result in a positive buy decision.
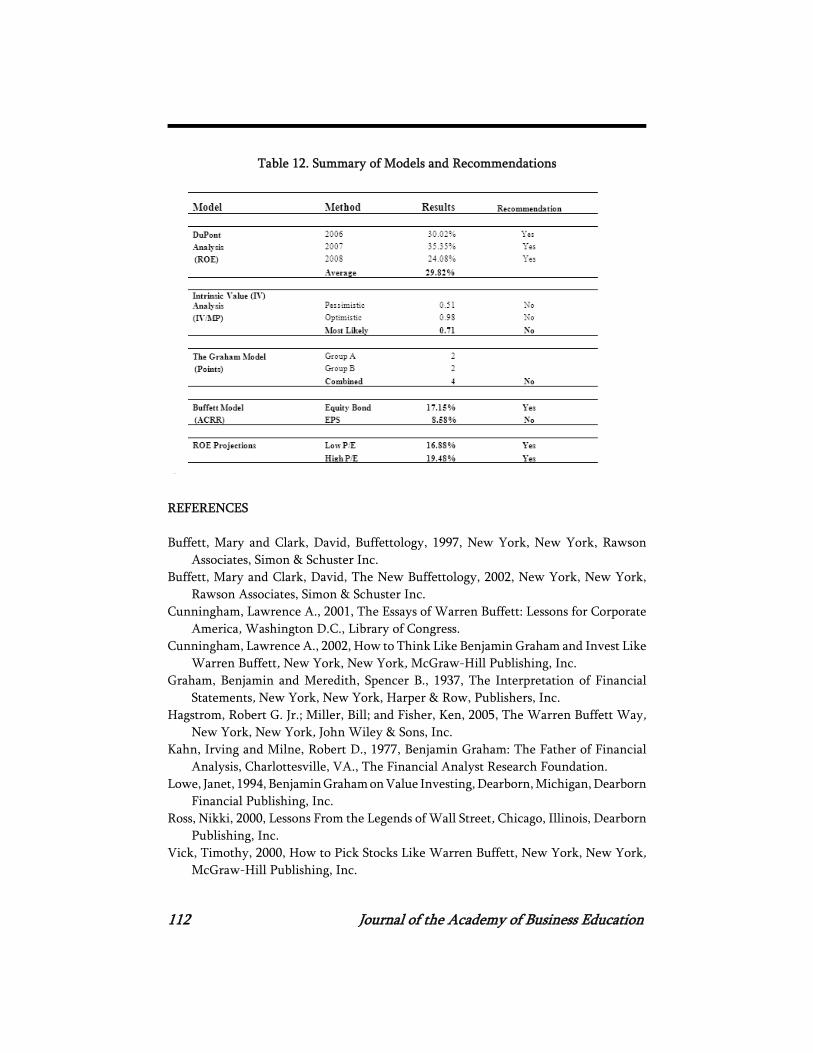
As the final step, the student is expected to create a presentation that summarizes theresults from the ex-post DuPont analysis from Part A, the strategic financial analysis fromPart B, and the comparative presentation of the ex-ante Intrinsic Value Analysis, HistoricGraham Model, Buffett Model, and ROE Projections Analysis from Part C. Table 12 is anexample of the presentation of the summary statistics and recommendations the studentis expected to form for the class presentation. Table 12 can be used during thepresentation to begin a discussion on the strengths and weaknesses of the differentmodels used in the analysis. As articulated below in the discussion for the Coke example,the Graham and Buffett model rely on traditional and fundamental financial analysis.Nonetheless, the student must ultimately decide whether the stock is a “good buy” orwhether it is a “good bye” and provide a rationale for the decision based on what theyperceive to be the most relevant model of analysis. The results often generateconsiderable debate and prove educational.
Using 15% as our required rate of return, the different models present differentresults. First, the ex-post DuPont analysis indicates that for the last three years Coke hasreturned to their shareholder an average return on investment of 29.45%. However,based on the calculated intrinsic values for the three different scenarios, it appears thatthe current market price ($42.88) for Coke is too high to consider as a viable investment.The decision based on the intrinsic value calculations would lead to a “no buy” decision.In addition, the Graham model also substantiates a “no buy” decision in that it yields onlyour points out of a required seven to indicate a buy. Further, the Buffett model suggeststhat the annual compounded rate of return is only marginal with a value ranging from8.58% to 17.15%. This would also suggest only a marginal rate of return considering ourrequired rate of return is a 15% minimum. Finally, the ROE projections for Coke for the
110 Journal of the Academy of Business Education
Table 10. Buffett Model
next ten years are also marginal with a range from 16.88% to 19.48%. Therefore, basedon the summary data in Table 12, the recommendation to purchase Coke at the price of$42.88 would not be made. At best the results indicate mixed signals. The student isreminded that a “Buffett-type” investment is one that gives a clear signal and a significantdiscount from the calculated intrinsic value. Anything less may result is sub-parperformance in the long run.
CONCLUSIONS
This paper has presented a systematic approach, using spreadsheets, for doingfundamental analysis. The process presented is composed of three major parts. First, a
Fall 2010 111
Table 11. Projected ROE Based on P/E Ratios
complete ratio analysis based on historic financial statements along with a DuPontAnalysis. The second part is a strategic analysis that provides a Value Line data-computed cash flow projection and an identification of the company’s strengths,weaknesses, opportunities, and threats. The third part of the project focused onforecasting an intrinsic value of the firm. The forecast results in a total value for the firmtoday based on future cash flows that are compounded at various growth rates, the totalintrinsic value of the firm is then divided by the number of outstanding shares todetermine the intrinsic value per share. This value is then compared to the market priceto determine if the stock is currently over- or under-valued.
While the process appears to be extensive, the spreadsheets tend to make short workof the analysis. In addition, copies of the spreadsheet are available from the authors uponrequest or may be accessed at the following website: http://www.csus.edu/indiv/k/kuhle.
112 Journal of the Academy of Business Education
Table 12. Summary of Models and Recommendations
REFERENCES
Buffett, Mary and Clark, David, Buffettology, 1997, New York, New York, RawsonAssociates, Simon & Schuster Inc.
Buffett, Mary and Clark, David, The New Buffettology, 2002, New York, New York,Rawson Associates, Simon & Schuster Inc.
Cunningham, Lawrence A., 2001, The Essays of Warren Buffett: Lessons for CorporateAmerica, Washington D.C., Library of Congress.
Cunningham, Lawrence A., 2002, How to Think Like Benjamin Graham and Invest LikeWarren Buffett, New York, New York, McGraw-Hill Publishing, Inc.
Graham, Benjamin and Meredith, Spencer B., 1937, The Interpretation of FinancialStatements, New York, New York, Harper & Row, Publishers, Inc.
Hagstrom, Robert G. Jr.; Miller, Bill; and Fisher, Ken, 2005, The Warren Buffett Way,New York, New York, John Wiley & Sons, Inc.
Kahn, Irving and Milne, Robert D., 1977, Benjamin Graham: The Father of FinancialAnalysis, Charlottesville, VA., The Financial Analyst Research Foundation.
Lowe, Janet, 1994, Benjamin Graham on Value Investing, Dearborn, Michigan, DearbornFinancial Publishing, Inc.
Ross, Nikki, 2000, Lessons From the Legends of Wall Street, Chicago, Illinois, DearbornPublishing, Inc.
Vick, Timothy, 2000, How to Pick Stocks Like Warren Buffett, New York, New York,McGraw-Hill Publishing, Inc.
Copyright of Journal of the Academy of Business Education is the property of Academy of Business Education
and its content may not be copied or emailed to multiple sites or posted to a listserv without the copyright
holder's express written permission. However, users may print, download, or email articles for individual use.


![The Super Investors of Graham and Doddsville by Warren Buffett[1]](https://static.documents.pub/doc/80x56/577d2a801a28ab4e1ea95a72/the-super-investors-of-graham-and-doddsville-by-warren-buffett1.jpg)
