106
Teaching Tips for Diagnostic Studies Dr. Annette Plüddemann Department of Primary Care Health Sciences Centre for Evidence-Based Medicine
| Date post: | 15-Oct-2018 |
| Category: |
Documents |
| Upload: | nguyendiep |
| View: | 216 times |
| Download: | 0 times |

Teaching Tips for Diagnostic Studies
Dr. Annette Plüddemann
Department of Primary Care Health Sciences Centre for Evidence-Based Medicine

www.oxford.dec.nihr.ac.uk/horizon-scanning


So far….
Randomised controlled trial Systematic review of an intervention
How should I treat this patient?
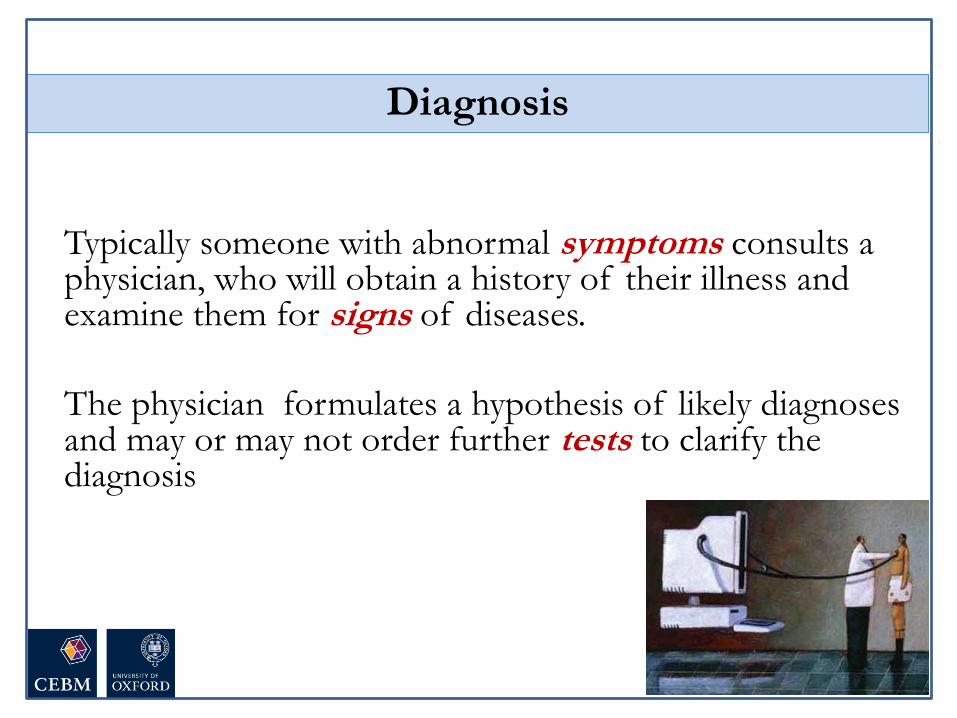
Typically someone with abnormal symptoms consults a physician, who will obtain a history of their illness and examine them for signs of diseases.
The physician formulates a hypothesis of likely diagnoses and may or may not order further tests to clarify the diagnosis
Diagnosis

• 2/3 legal claims against GPs in UK
• 40,000-80,000 US hospital deaths
from misdiagnosis per year
• Adverse events, negligence cases,
serious disability more likely to be
related to misdiagnosis than drug
errors
• Diagnosis uses <5% of hospital
costs, but influences 60% of decision
making
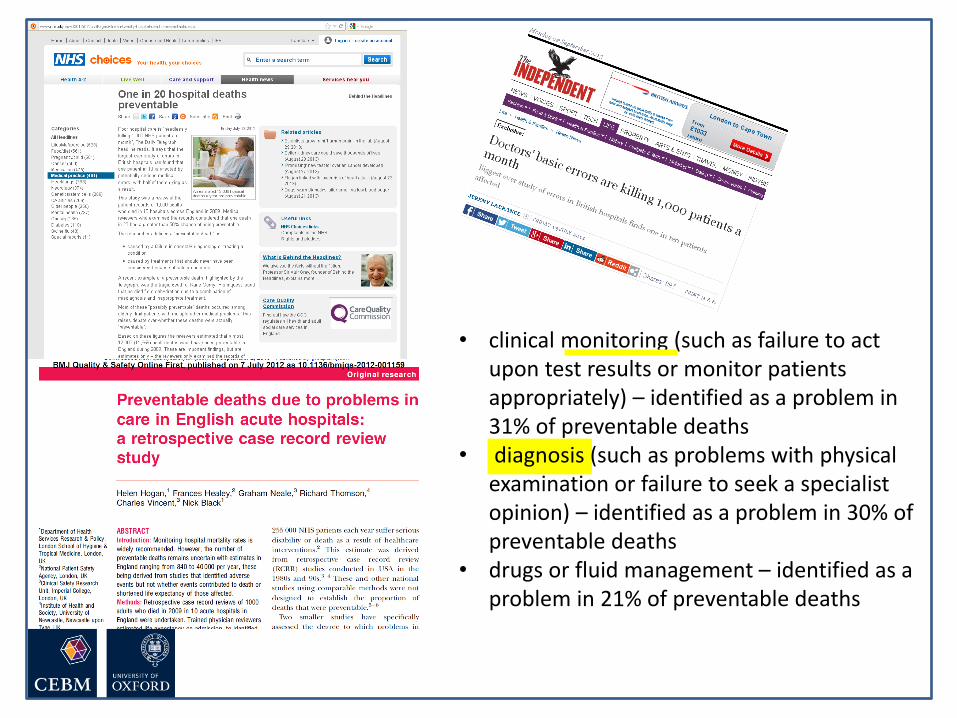
• clinical monitoring (such as failure to act upon test results or monitor patients appropriately) – identified as a problem in 31% of preventable deaths
• diagnosis (such as problems with physical examination or failure to seek a specialist opinion) – identified as a problem in 30% of preventable deaths
• drugs or fluid management – identified as a problem in 21% of preventable deaths

Wolf JA, Moreau J, Akilov O, Patton T, English JC, Ho J, Ferris LK. Diagnostic Inaccuracy of Smartphone Applications for Melanoma Detection. JAMA Dermatol. 2013 Jan 16:1-4.


Monday Tuesday Wednesday Thursday Friday
8.30 Registration Registration Registration Registration Registration
9.00-10.30
10.30-11.00 Coffee Coffee Coffee Coffee Coffee
11.00-12.30
12.30-13.30 Lunch Lunch Lunch Lunch Lunch
13.30-15.00
15.00-15.30 Coffee Coffee Coffee Coffee Coffee
15.30-17.00
Module Timetable

Monday 27
January
Tuesday 28 January Wednesday 29
January
Thursday 30
January
Friday 31 January
8.30 Registration Registration Registration Registration Registration
9.00-10.30 Introduction
Carl Heneghan
Annette
Plüddemann
Diagnostic studies –
the numbers
Annette
Plüddemann
Visualising and
presenting
diagnostic accuracy
studies
Susan Mallett
Multiple tests
Ann Van den Bruel
Rational
monitoring
Jason Oke and
Richard Stevens
(9.30 start)
10.30-11.00 Coffee Coffee Coffee Coffee Coffee
11.00-12.30 Diagnostic study
design
Ann Van den Bruel
Sample size
calculations
Richard Stevens
Systematic reviews
of diagnostic studies
Clare Bankhead
Screening
Paul Hewitson
Rational
monitoring
Jason Oke and
Richard Stevens
12.30-13.30 Lunch Lunch Lunch Lunch Lunch
13.30-15.00 Searching skills
Nia Roberts
Appraisal workshop
Ann Van den Bruel
Systematic reviews
of diagnostic studies
(2)
Clare Bankhead
Innovation and
Adoption of
Diagnostic Services
Chris Price
Student
presentations
15.00-15.30 Coffee Coffee Coffee Coffee Coffee
15.30-17.00 Own search Intermediate,
indeterminate and
uninterpretable
results
Beth Shinkins
Meta-analysis
Beth Shinkins and
Ann Van den Bruel
Consolidation and
Q&A session
Carl Heneghan
Evaluation and
finish by 4.30
18.00-19.00 Invited guest
speaker:
19.00 Drinks reception,
Rewley House
Dinner: Rewley
House
Module Timetable

Diagnostic strategies and what
tests are used for
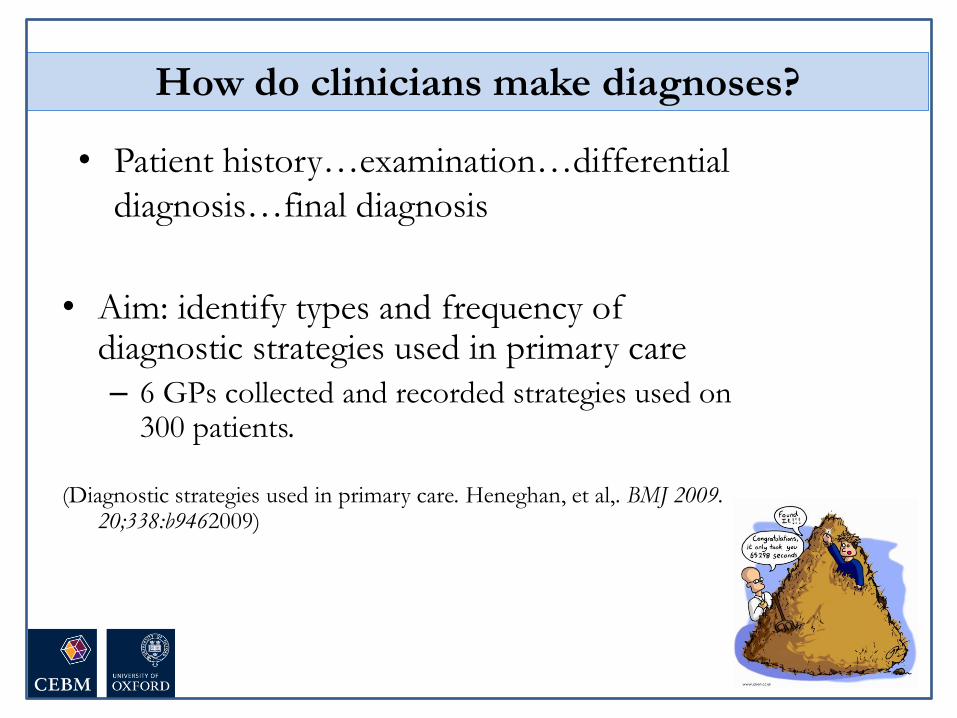
How do clinicians make diagnoses?
• Aim: identify types and frequency of diagnostic strategies used in primary care
– 6 GPs collected and recorded strategies used on 300 patients.
(Diagnostic strategies used in primary care. Heneghan, et al,. BMJ 2009. 20;338:b9462009)
• Patient history…examination…differential
diagnosis…final diagnosis

Refinement of the
diagnostic causes
•Restricted Rule Outs
•Stepwise refinement
•Probabilistic reasoning
•Pattern recognition fit
•Clinical Prediction Rule
•Spot diagnoses
•Self-labelling
•Presenting complaint
•Pattern recognition
Initiation of the
diagnosis
Defining the final
diagnosis
•Known Diagnosis
•Further tests ordered
•Test of treatment
•Test of time
•No label
(Heneghan et al, BMJ 2009)
Stage Strategies used
Diagnostic stages & strategies

Meningitis Chicken Pox
Not all diagnoses need tests?
Spot diagnosis
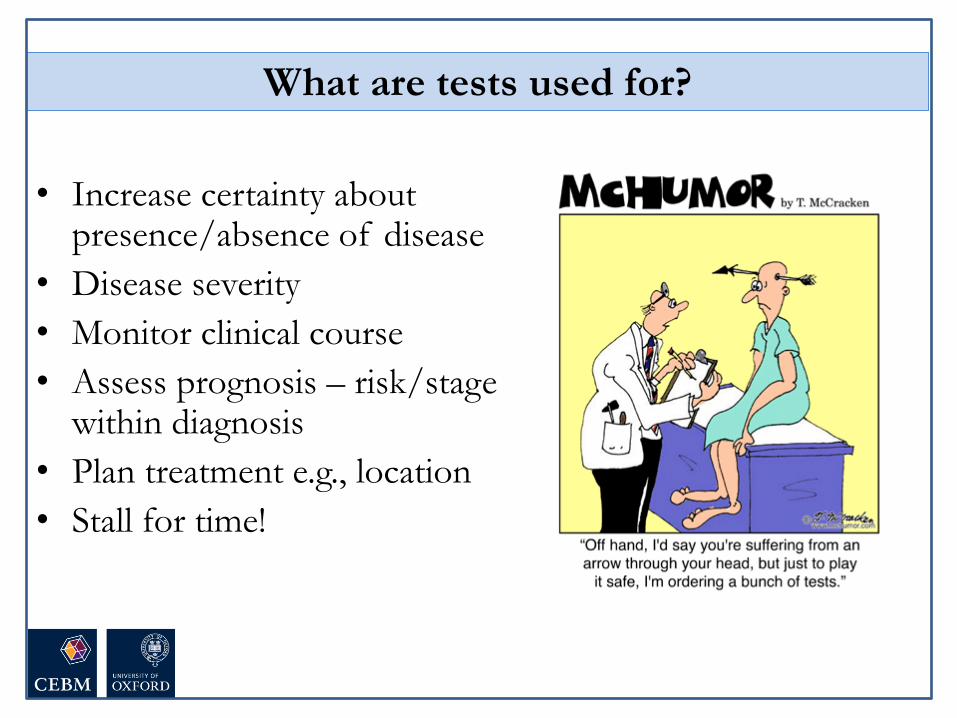
What are tests used for?
• Increase certainty about presence/absence of disease
• Disease severity
• Monitor clinical course
• Assess prognosis – risk/stage within diagnosis
• Plan treatment e.g., location
• Stall for time!

Bossuyt et al BMJ 2006;332:1089–92
• Replacement – new replaces old
– E.g. CT colonography for barium enema
• Triage – new determines need for old
– E.g. B-natriuretic peptide for echocardiography
• Add-on – new combined with old
– E.g. ECG and myocardial perfusion scan
Roles of new tests

Critical appraisal of a diagnostic
accuracy study
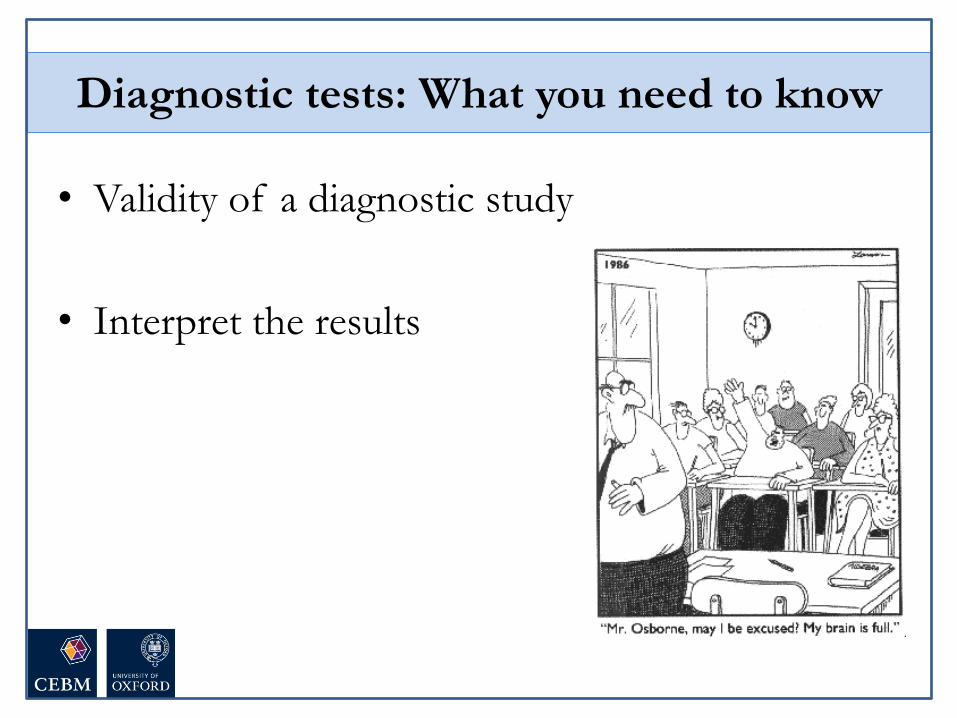
• Validity of a diagnostic study
• Interpret the results
Diagnostic tests: What you need to know Diagnostic tests: What you need to know

• Patient/Problem How would I describe a group of patients similar to mine?
• Index test Which test am I considering?
• Comparator… or …Reference Standard What is the best reference standard to diagnose the target condition?
• Outcome….or….Target condition Which condition do I want to rule in or rule out?
Defining the clinical question: PICO or PIRT

Series of patients
Index test
Reference standard
Compare the results of the index test with the reference standard,
blinded
Diagnostic Accuracy Studies

Diagnostic Study Example
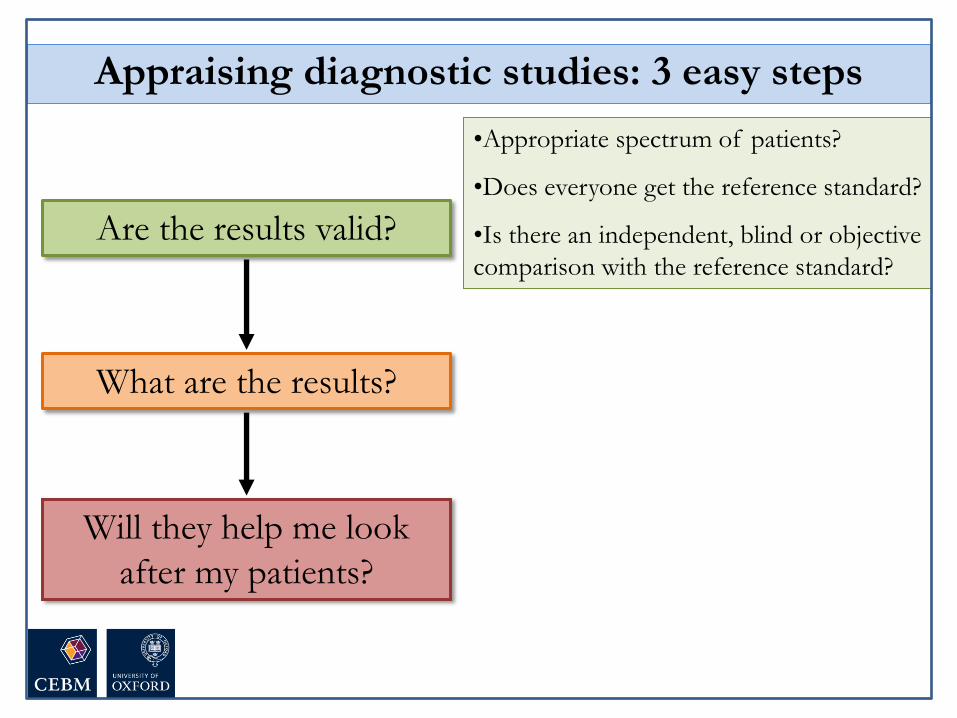
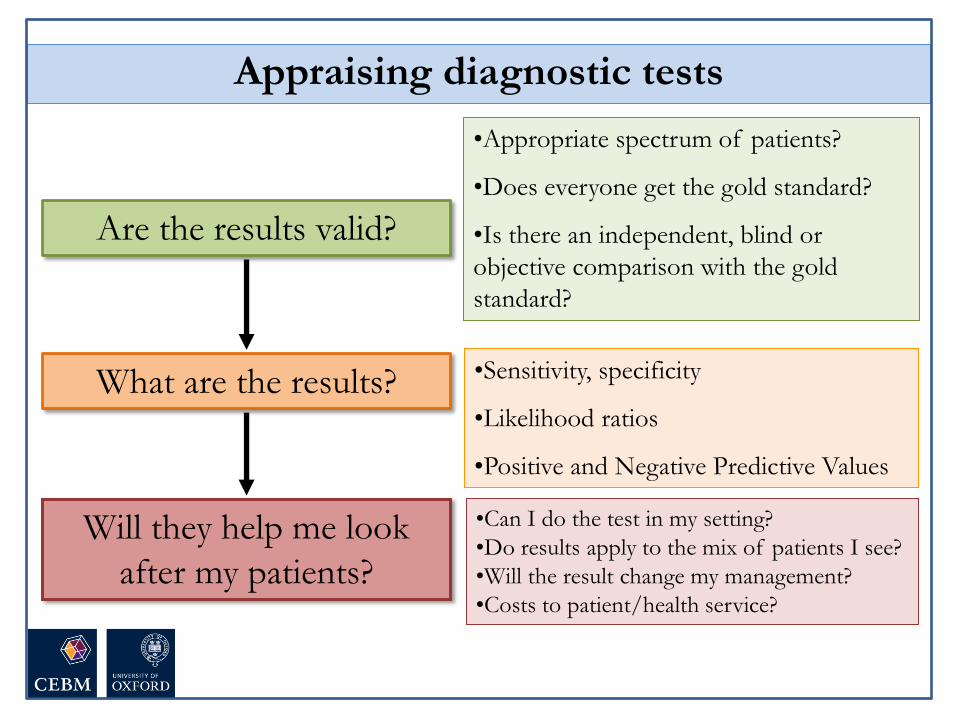
Are the results valid?
What are the results?
Will they help me look
after my patients?
•Appropriate spectrum of patients?
•Does everyone get the reference standard?
•Is there an independent, blind or objective
comparison with the reference standard?
Appraising diagnostic studies: 3 easy steps
1. Appropriate spectrum of patients?
• Ideally, test should be performed on a group of
patients in whom it will be applied in the real
world clinical setting
• Spectrum bias = study using only highly
selected patients…….perhaps those in whom
you would really suspect have the diagnosis

Case-control vs consecutive

2. Do all patients have the reference standard?
• Ideally all patients get the reference standard test
• Verification bias = only some patients get the
reference standard…..probably the ones in
whom you really suspect have the disease

Series of patients
Index test
Compare the results of the index test with the reference standard,
blinded
Partial Reference Bias
Ref. Std. A

Differential Reference Bias
Series of patients
Index test
Ref. Std. A
Blinded cross-classification
Ref. Std. B
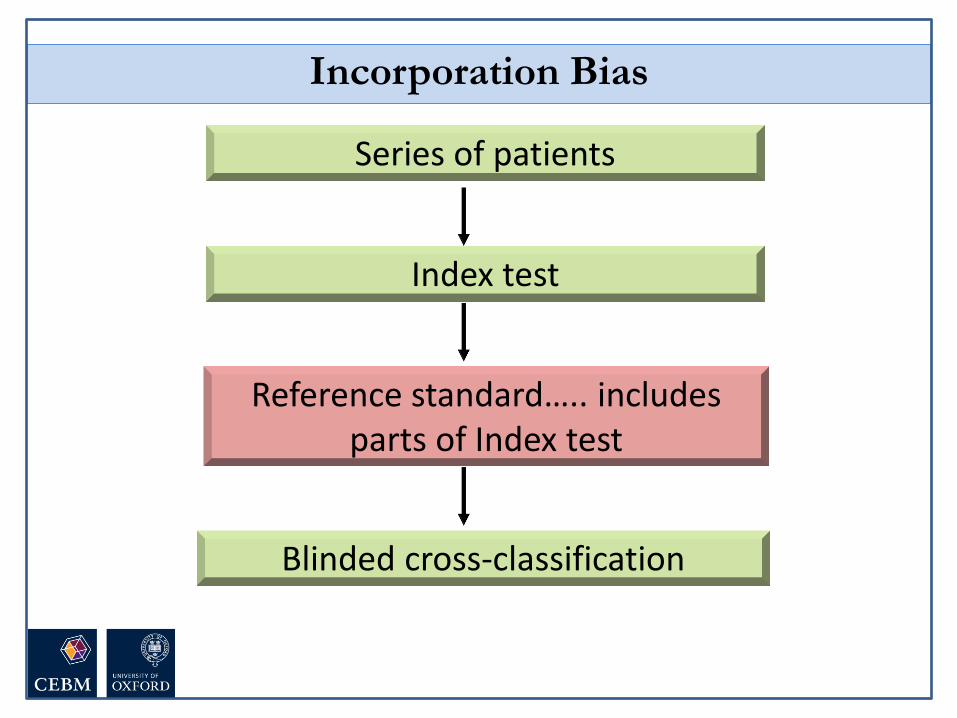
Series of patients
Index test
Reference standard….. includes parts of Index test
Blinded cross-classification
Incorporation Bias

• Ideally, the reference standard is independent,
blind and objective
• Observer bias = test is very subjective, or done
by person who knows something about the
patient or samples
3. Independent, blind or objective comparison
with the reference standard?
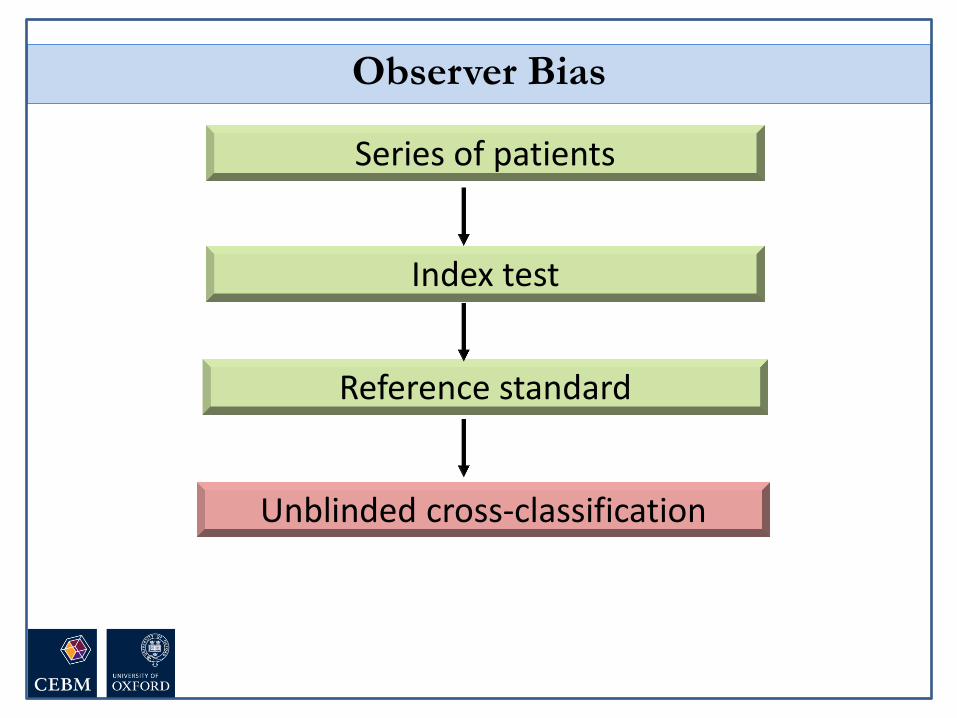
Series of patients
Index test
Reference standard
Unblinded cross-classification
Observer Bias

Diagnostic Study Example

1. Spectrum
3. Reference standard
4. Blinding
2. Index test

Teaching tips….
• Validity of a diagnostic study
• Interpret the results
Diagnostic tests: What you need to know Diagnostic tests: What you need to know
Set the scene, create a relaxed
atmosphere; Humour

Diagnostic Accuracy Studies
Series of patients
Index test
Reference standard
Compare the results of the index test with the reference standard,
blinded
Don’t use “gold”
standard
Series of patients
Index test
Ref. Std. A
Blinded cross-classification
Ref. Std. B
In pictures

Case-control vs consecutive
Use analogies that are not
medical Get tips from
other teachers!
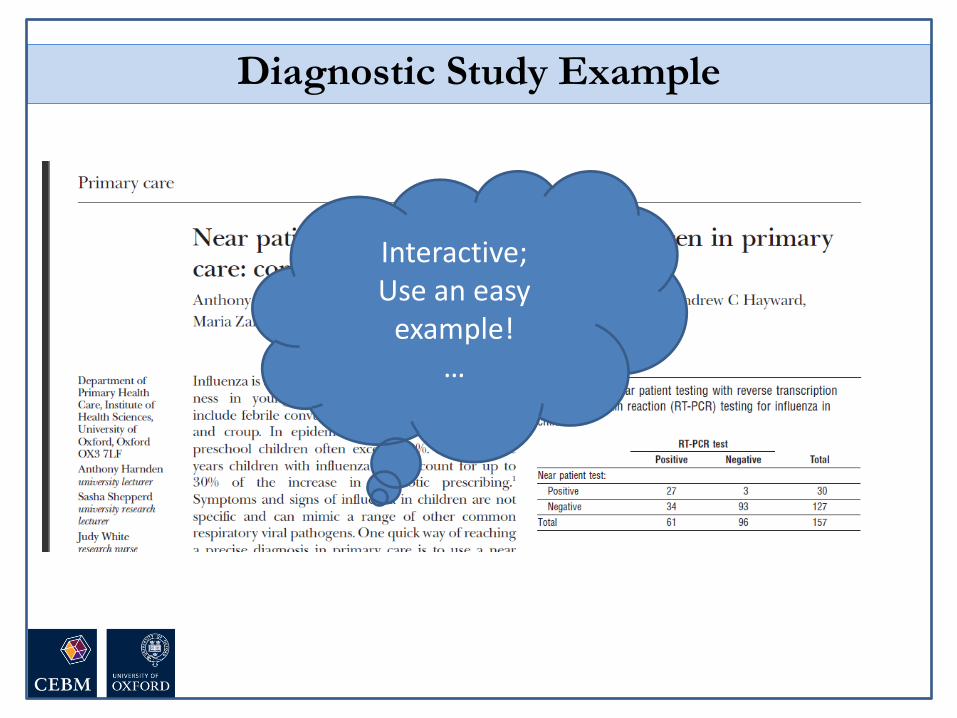
Diagnostic Study Example
Interactive; Use an easy
example! …

Diagnostic Study Example
If you want to use something which shows potential bias, don’t use a
complex test

The Numbers

Using a brain scan, the researchers detected autism with over 90%
accuracy…
You can’t diagnose autism with a brain
scan...

Are the results valid?
What are the results?
Will they help me look
after my patients?
•Appropriate spectrum of patients?
•Does everyone get the reference standard?
•Is there an independent, blind or objective
comparison with the gold standard?
Appraising diagnostic tests
•Sensitivity, specificity
•Likelihood ratios
•Positive and Negative Predictive Values

Diagnostic Study Example


Sensitivity and Specificity

Disease
Test
+ -
+
-
True
positives
False
negatives
True
negatives
False
positives
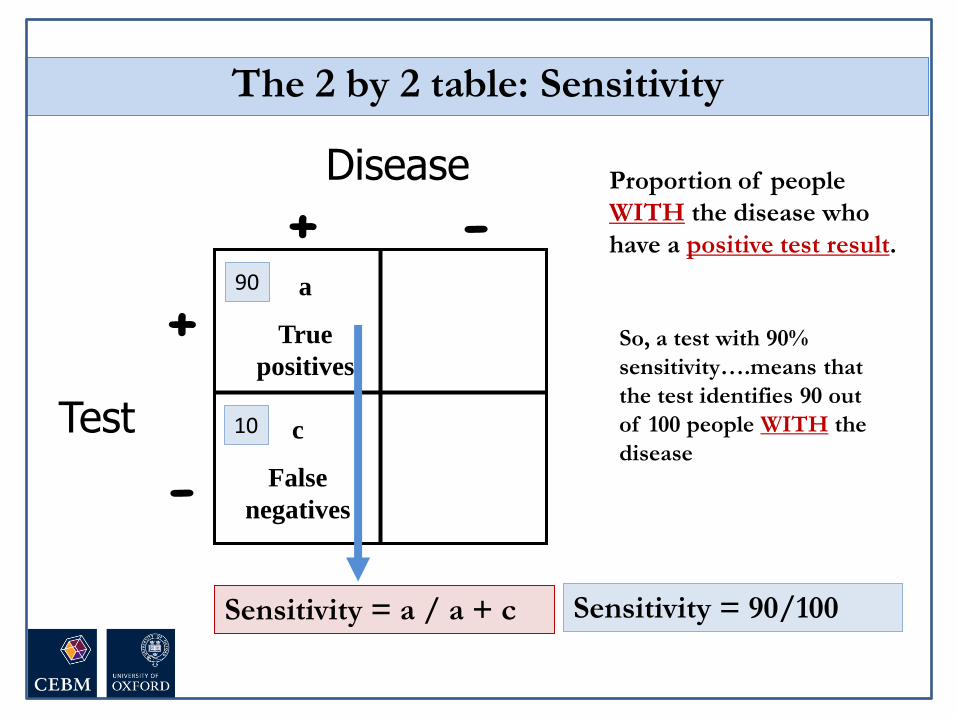
The 2 by 2 table
Disease
Test
+ -
+
-
Sensitivity = a / a + c
Proportion of people
WITH the disease who
have a positive test result.
a
True
positives
c
False
negatives
The 2 by 2 table: Sensitivity
90
10
Sensitivity = 90/100
So, a test with 90%
sensitivity….means that
the test identifies 90 out
of 100 people WITH the
disease

Disease
Test
+ -
+
-
b
False
positives
d
True
negatives
Specificity = d / b + d
Proportion of people
WITHOUT the disease
who have a negative test
result.
The 2 by 2 table: Specificity
75
25
Specificity = 75/100
So, a test with 75%
specificity will be
NEGATIVE in 75 out of
100 people WITHOUT
the disease
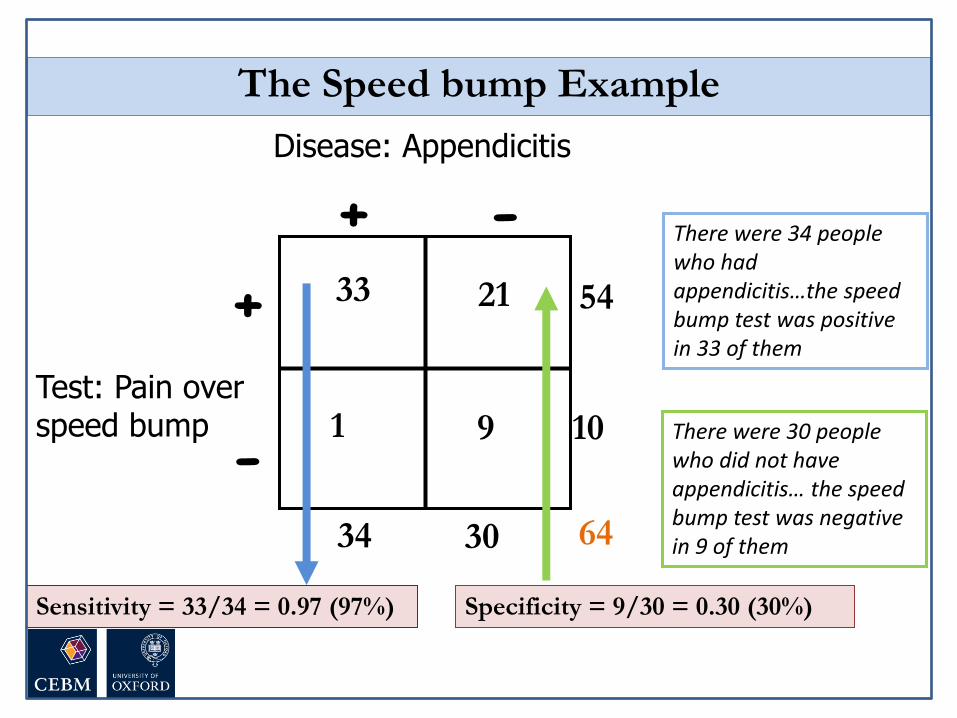
The Speed bump Example
Disease: Appendicitis
Test: Pain over speed bump
+ -
+
-
33 21
1 9
54
10
64 30 34
Sensitivity = 33/34 = 0.97 (97%) Specificity = 9/30 = 0.30 (30%)
There were 30 people who did not have appendicitis… the speed bump test was negative in 9 of them
There were 34 people who had appendicitis…the speed bump test was positive in 33 of them

• Sensitivity is useful to me – ‘The new speed bump test was positive in 33 out of 34 people with
appendicitis (sensitivity = 97%)’
• Specificity seems a bit confusing! – ‘The new speed bump test was negative in 9 of the 30 people who did not
have appendicitis (specificity = 30%)’
• So…the false positive rate is sometimes easier
– ‘There were 30 people who did not have appendicitis… the speed bump test was falsely positive in 21 of them’
– So a specificity of 30% means that the new rapid test is wrong (or falsely positive) in 70% of people
False positive rate = 1 - specificity
Tip
True positive rate = specificity
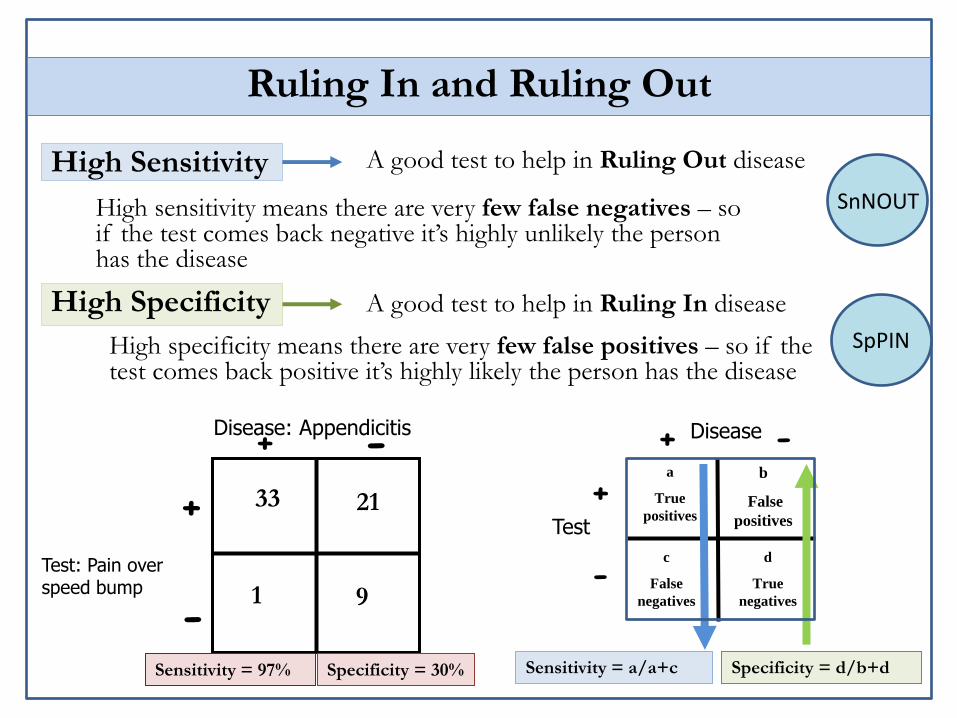
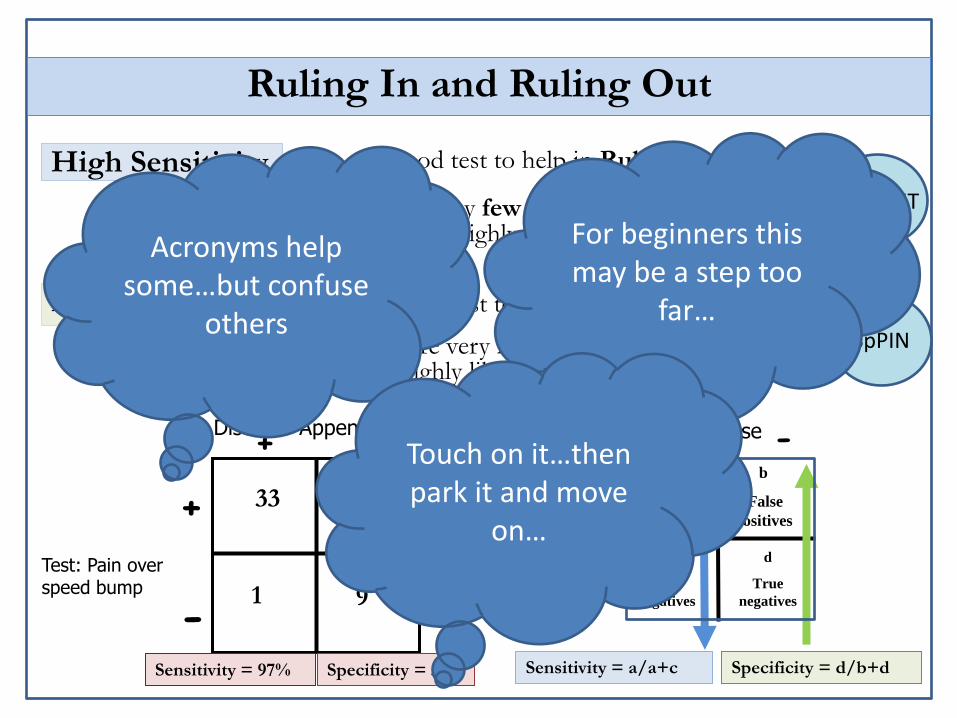
Ruling In and Ruling Out
High Sensitivity
High Specificity
A good test to help in Ruling Out disease
A good test to help in Ruling In disease
High sensitivity means there are very few false negatives – so if the test comes back negative it’s highly unlikely the person has the disease
High specificity means there are very few false positives – so if the test comes back positive it’s highly likely the person has the disease
Disease
Test
+ -
+
-
a
True
positives
c
False
negatives
b
False
positives
d
True
negatives
Specificity = d/b+d Sensitivity = a/a+c
Disease: Appendicitis
Test: Pain over speed bump
+ -
+
-
33 21
1 9
Sensitivity = 97% Specificity = 30%
SnNOUT
SpPIN
Predictive Values

Disease
Test
+ -
+
-
a
True
positives
c
False
negatives
Positive and Negative Predictive Value
b
False
positives
d
True
negatives
PPV = Proportion of
people with a positive test
who have the disease.
NPV = Proportion of
people with a negative test
who do not have the
disease.
PPV = a / a + b
NPV = d / c + d

The Speed bump Example
Disease: Appendicitis
Test: Pain over speedbump
+ -
+
-
33 21
1 9
54
10
64 30 34
PPV = 33/54 = 61%
NPV = 9/10 = 90%

Your father went to his doctor and was told that his test for a disease was positive. He is really worried, and comes to ask you for help!
Predictive Value: Natural Frequencies
After doing some reading, you find that for men of his age:
The prevalence of the disease is 30%
The test has sensitivity of 50% and specificity of 90%
“Tell me what’s the chance I have this disease?”
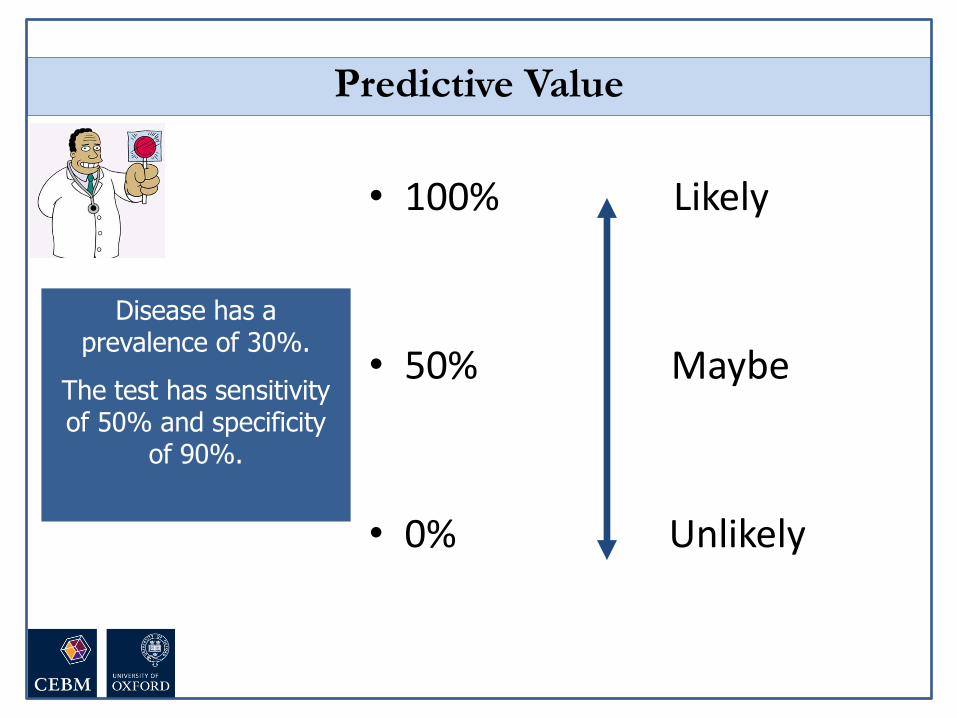
• 100% Likely
• 50% Maybe
• 0% Unlikely
Disease has a prevalence of 30%.
The test has sensitivity of 50% and specificity
of 90%.
Predictive Value

2:00 1:59 1:58 1:57 1:56 1:55 1:54 1:53 1:52 1:51 1:50 1:49 1:48 1:47 1:46 1:45 1:44 1:43 1:42 1:41 1:40 1:39 1:38 1:37 1:36 1:35 1:34 1:33 1:32 1:31 1:30 1:29 1:28 1:27 1:26 1:25 1:24 1:23 1:22 1:21 1:20 1:19 1:18 1:17 1:16 1:15 1:14 1:13 1:12 1:11 1:10 1:09 1:08 1:07 1:06 1:05 1:04 1:03 1:02 1:01 1:00 0:59 0:58 0:57 0:56 0:55 0:54 0:53 0:52 0:51 0:50 0:49 0:48 0:47 0:46 0:45 0:44 0:43 0:42 0:41 0:40 0:39 0:38 0:37 0:36 0:35 0:34 0:33 0:32 0:31 0:30 0:29 0:28 0:27 0:26 0:25 0:24 0:23 0:22 0:21 0:20 0:19 0:18 0:17 0:16 0:15 0:14 0:13 0:12 0:11 0:10 0:09 0:08 0:07 0:06 0:05 0:04 0:03 0:02 0:01 End
Disease has a prevalence of 30%.
The test has sensitivity of 50% and specificity of 90%.
Given a positive test, what is the probability your dad has the disease
Natural Frequencies

30
70
15
7
100
22 people test positive………
of whom 15 have the disease
So, chance of disease is
15/22 = 68%
Disease +ve
Disease -ve
Testing +ve
Sensitivity = 50%
False positive rate = 10%
Prevalence of 30%, Sensitivity of 50%, Specificity of 90%
4
96
2
9.6
100
11.6 people test positive………
of whom 2 have the disease
So, chance of disease is
2/11.6 = 17%
Disease +ve
Disease -ve
Testing +ve
Sensitivity = 50%
False positive rate = 10%
Prevalence of 4%, Sensitivity of 50%, Specificity of 90%
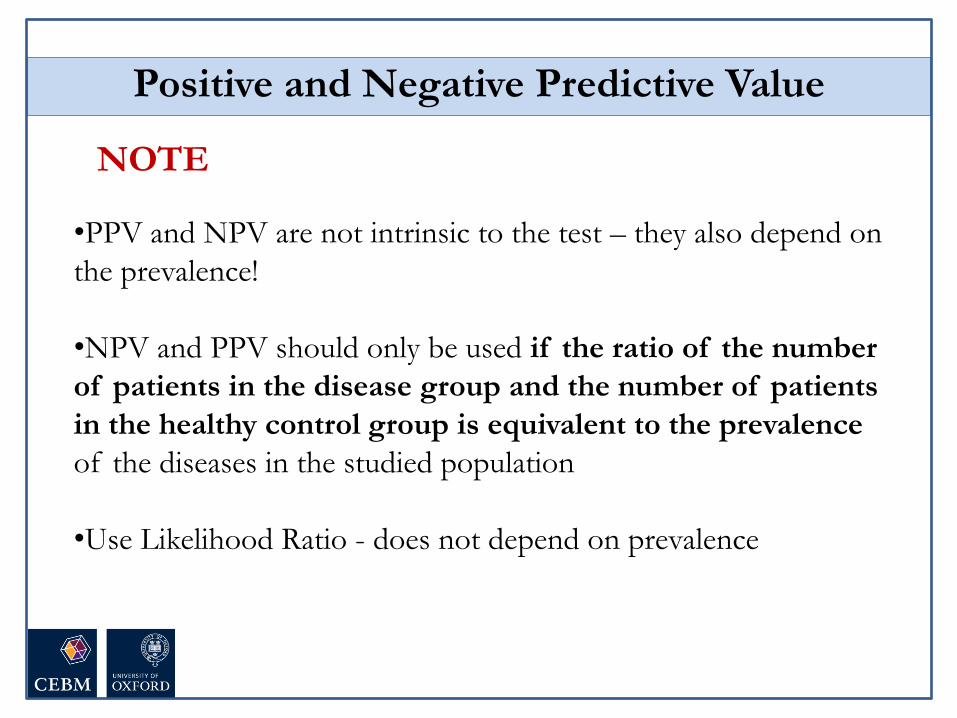
Positive and Negative Predictive Value
•PPV and NPV are not intrinsic to the test – they also depend on
the prevalence!
•NPV and PPV should only be used if the ratio of the number
of patients in the disease group and the number of patients
in the healthy control group is equivalent to the prevalence
of the diseases in the studied population
•Use Likelihood Ratio - does not depend on prevalence
NOTE

Teaching tips….

You can’t diagnose autism with a brain
scan...
Using a brain scan, the researchers detected autism with over 90%
accuracy…
Use examples from the news, blogs, things that people come across – relevant to everyone,
not just clinicians; Suspense…
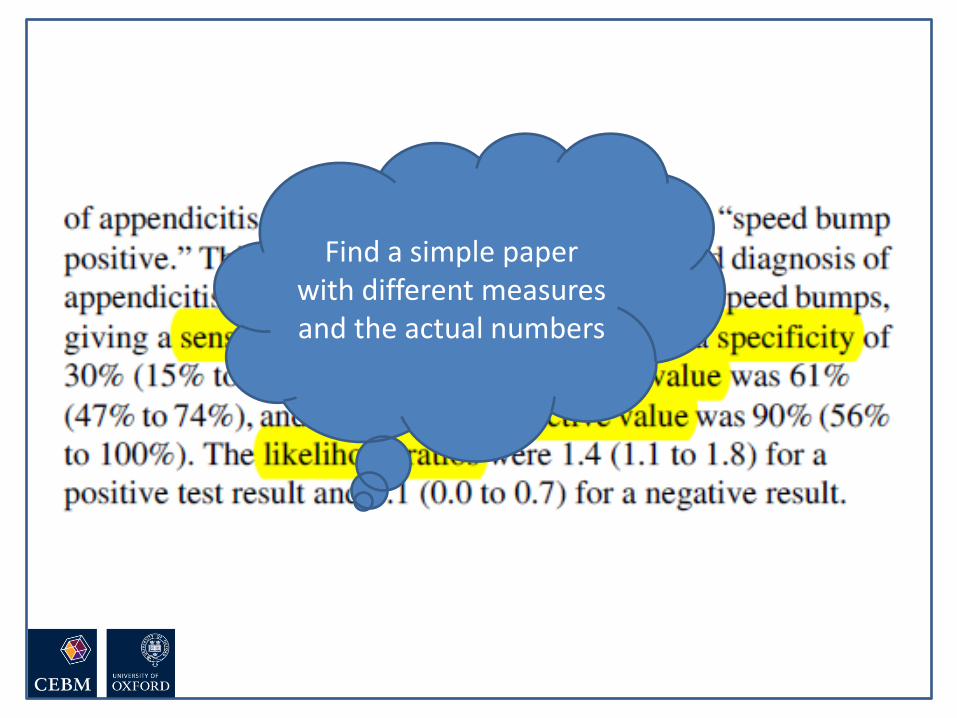
Find a simple paper with different measures and the actual numbers

Disease
Test
+ -
+
-
Sensitivity = a / a + c
Proportion of people
WITH the disease who
have a positive test result.
a
True
positives
c
False
negatives
The 2 by 2 table: Sensitivity
90
10
Sensitivity = 90/100
So, a test with 90%
sensitivity….means that
the test identifies 90 out
of 100 people WITH the
disease
Explain the concepts in words. Don’t focus on formulas – some like
them (so provide them), but for many
this feels too much like “MATHS!”

The Speed bump Example
Disease: Appendicitis
Test: Pain over speed bump
+ -
+
-
33 21
1 9
54
10
64 30 34
Sensitivity = 33/34 = 0.97 (97%) Specificity = 9/30 = 0.30 (30%)
There were 30 people who did not have appendicitis… the speed bump test was negative in 9 of them
There were 34 people who had appendicitis…the speed bump test was positive in 33 of them
Use numbers from a paper; simple
language; It’s more important to
understand what it all means than to know
how to calculate

• Sensitivity is useful to me – ‘The new speed bump test was positive in 33 out of 34 people with
appendicitis (sensitivity = 97%)’
• Specificity seems a bit confusing! – ‘The new speed bump test was negative in 9 of the 30 people who did not
have appendicitis (specificity = 30%)’
• So…the false positive rate is sometimes easier
– ‘There were 30 people who did not have appendicitis… the speed bump test was falsely positive in 21 of them’
– So a specificity of 30% means that the new rapid test is wrong (or falsely positive) in 70% of people
False positive rate = 1 - specificity
Tip
True positive rate = specificity
False positive rate is easier to
understand than specificity – provide
options!
Ruling In and Ruling Out
High Sensitivity
High Specificity
A good test to help in Ruling Out disease
A good test to help in Ruling In disease
High sensitivity means there are very few false negatives – so if the test comes back negative it’s highly unlikely the person has the disease
High specificity means there are very few false positives – so if the test comes back positive it’s highly likely the person has the disease
Disease
Test
+ -
+
-
a
True
positives
c
False
negatives
b
False
positives
d
True
negatives
Specificity = d/b+d Sensitivity = a/a+c
Disease: Appendicitis
Test: Pain over speed bump
+ -
+
-
33 21
1 9
Sensitivity = 97% Specificity = 30%
SnNOUT
SpPIN
Acronyms help some…but confuse
others
For beginners this may be a step too
far…
Touch on it…then park it and move
on…

Your father went to his doctor and was told that his test for a disease was positive. He is really worried, and comes to ask you for help!
Predictive Value: Natural Frequencies
After doing some reading, you find that for men of his age:
The prevalence of the disease is 30%
The test has sensitivity of 50% and specificity of 90%
“Tell me what’s the chance I have this disease?”
A simple, common scenario everyone
can relate to

• 100% Likely
• 50% Maybe
• 0% Unlikely
Disease has a prevalence of 30%.
The test has sensitivity of 50% and specificity
of 90%.
Predictive Value
Have a go… interactive… safe
environment

2:00 1:59 1:58 1:57 1:56 1:55 1:54 1:53 1:52 1:51 1:50 1:49 1:48 1:47 1:46 1:45 1:44 1:43 1:42 1:41 1:40 1:39 1:38 1:37 1:36 1:35 1:34 1:33 1:32 1:31 1:30 1:29 1:28 1:27 1:26 1:25 1:24 1:23 1:22 1:21 1:20 1:19 1:18 1:17 1:16 1:15 1:14 1:13 1:12 1:11 1:10 1:09 1:08 1:07 1:06 1:05 1:04 1:03 1:02 1:01 1:00 0:59 0:58 0:57 0:56 0:55 0:54 0:53 0:52 0:51 0:50 0:49 0:48 0:47 0:46 0:45 0:44 0:43 0:42 0:41 0:40 0:39 0:38 0:37 0:36 0:35 0:34 0:33 0:32 0:31 0:30 0:29 0:28 0:27 0:26 0:25 0:24 0:23 0:22 0:21 0:20 0:19 0:18 0:17 0:16 0:15 0:14 0:13 0:12 0:11 0:10 0:09 0:08 0:07 0:06 0:05 0:04 0:03 0:02 0:01 End
Disease has a prevalence of 30%.
The test has sensitivity of 50% and specificity of 90%.
Given a positive test, what is the probability your dad has the disease
Natural Frequencies
Set a time and stick to it!

30
70
15
7
100
22 people test positive………
of whom 15 have the disease
So, chance of disease is
15/22 = 68%
Disease +ve
Disease -ve
Testing +ve
Sensitivity = 50%
False positive rate = 10%
Prevalence of 30%, Sensitivity of 50%, Specificity of 90%
Simple numbers = year 2 maths;
reinforces sensitivity and
specificity; No formulas!

4
96
2
9.6
100
11.6 people test positive………
of whom 2 have the disease
So, chance of disease is
2/11.6 = 17%
Disease +ve
Disease -ve
Testing +ve
Sensitivity = 50%
False positive rate = 10%
Prevalence of 4%, Sensitivity of 50%, Specificity of 90%
Change the prevalence, keep other
numbers the same… learning by doing; Good transition to
likelihood ratios

Likelihood Ratios
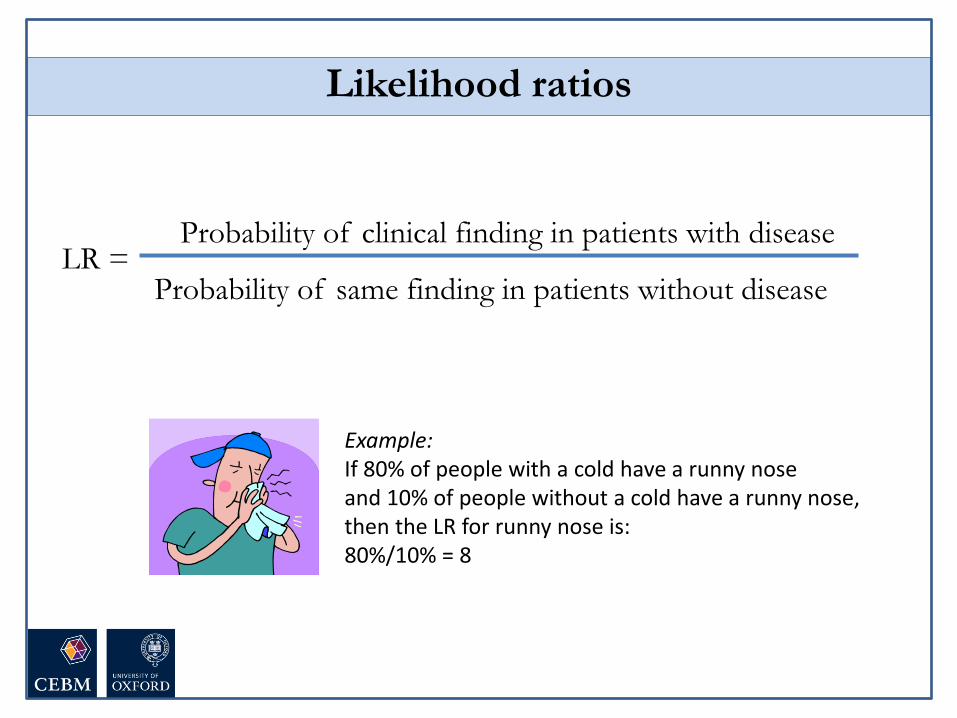
Likelihood ratios
LR = Probability of clinical finding in patients with disease
Probability of same finding in patients without disease
Example: If 80% of people with a cold have a runny nose and 10% of people without a cold have a runny nose, then the LR for runny nose is: 80%/10% = 8

Positive likelihood ratio (LR+)
How much more likely is a positive test to be found in a person with the disease than in a person without it?
Likelihood ratios
LR+ = sens/(1-spec)
LR- = (1-sens)/(spec)
Negative likelihood ratio (LR-)
How much more likely is a negative test to be found in a person without the disease than in a person with it?

LR>10 = strong
positive test
result
LR<0.1 = strong
negative test
result
LR=1
No diagnostic
value
What do likelihood ratios mean?

Diagnosis of Appendicitis
McBurney’s point If palpation of the left lower quadrant
of a person's abdomen results in more
pain in the right lower quadrant
Rovsing’s sign
Abdominal pain resulting from
passively extending the thigh of a
patient or asking the patient to actively
flex his thigh at the hip
Psoas sign
Ashdown’s sign
Pain when driving over speed bumps

McGee: Evidence based Physical Diagnosis (Saunders Elsevier)
For Example
(LR+ = 3.4)
(LR- = 0.4)
Speed bump test (Ashdown’s sign): LR+ = 1.4 LR- = 0.1
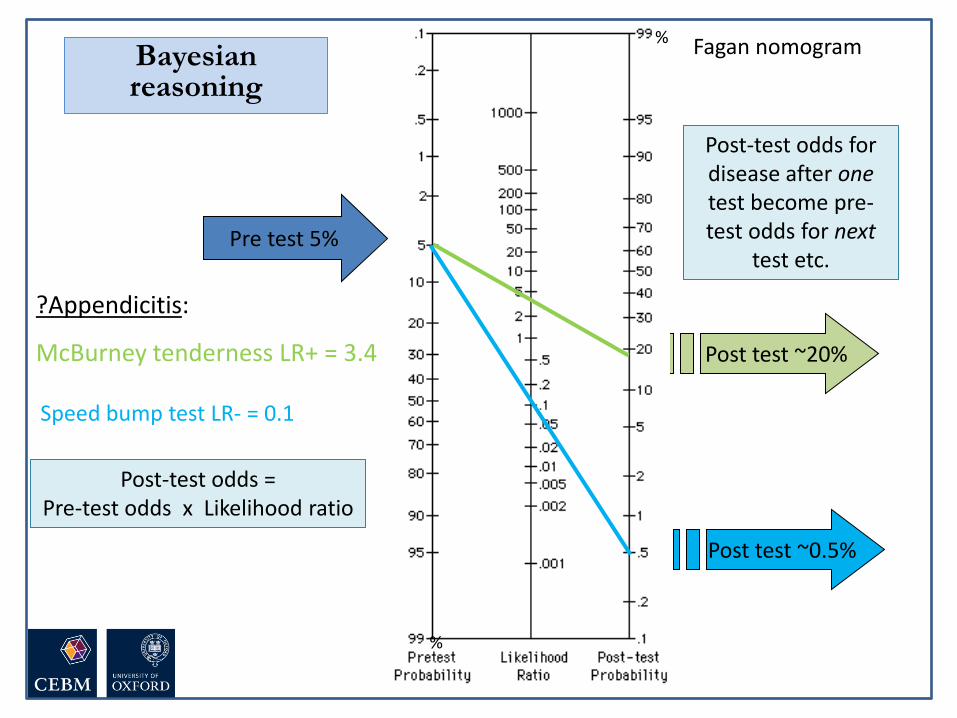
Post test ~20%
?Appendicitis:
McBurney tenderness LR+ = 3.4
Pre test 5%
Fagan nomogram Bayesian reasoning
%
%
Post-test odds = Pre-test odds x Likelihood ratio
Post-test odds for disease after one test become pre-test odds for next
test etc.
Speed bump test LR- = 0.1
Post test ~0.5%

Teaching tips….

Likelihood ratios
LR = Probability of clinical finding in patients with disease
Probability of same finding in patients without disease
Example: If 80% of people with a cold have a runny nose and 10% of people without a cold have a runny nose, then the LR for runny nose is: 80%/10% = 8
Definition is wordy…so give a simple example

Positive likelihood ratio (LR+)
How much more likely is a positive test to be found in a person with the disease than in a person without it?
Likelihood ratios
LR+ = sens/(1-spec)
LR- = (1-sens)/(spec)
Negative likelihood ratio (LR-)
How much more likely is a negative test to be found in a person without the disease than in a person with it?
Calculation in terms of sensitivity/ specificity is simpler and more useful than formula from the 2x2 table

LR>10 = strong
positive test
result
LR<0.1 = strong
negative test
result
LR=1
No diagnostic
value
What do likelihood ratios mean?
Knowing what LRs mean is more
important than how to calculate

Diagnosis of Appendicitis
McBurney’s point If palpation of the left lower quadrant
of a person's abdomen results in more
pain in the right lower quadrant
Rovsing’s sign
Abdominal pain resulting from
passively extending the thigh of a
patient or asking the patient to actively
flex his thigh at the hip
Psoas sign
Ashdown’s sign
Pain when driving over speed bumps
Simple example… related to the paper

McGee: Evidence based Physical Diagnosis (Saunders Elsevier)
For Example
(LR+ = 3.4)
(LR- = 0.4)
Speed bump test (Ashdown’s sign): LR+ = 1.4 LR- = 0.1
Putting numbers on the scale makes it
clearer

Post test ~20%
?Appendicitis:
McBurney tenderness LR+ = 3.4
Pre test 5%
Fagan nomogram Bayesian reasoning
%
%
Post-test odds = Pre-test odds x Likelihood ratio
Post-test odds for disease after one test become pre-test odds for next
test etc.
Speed bump test LR- = 0.1
Post test ~0.5%
Key concept: Nomogram links pre- and post-test odds;
Keep it to a minimum

What about the news story…?
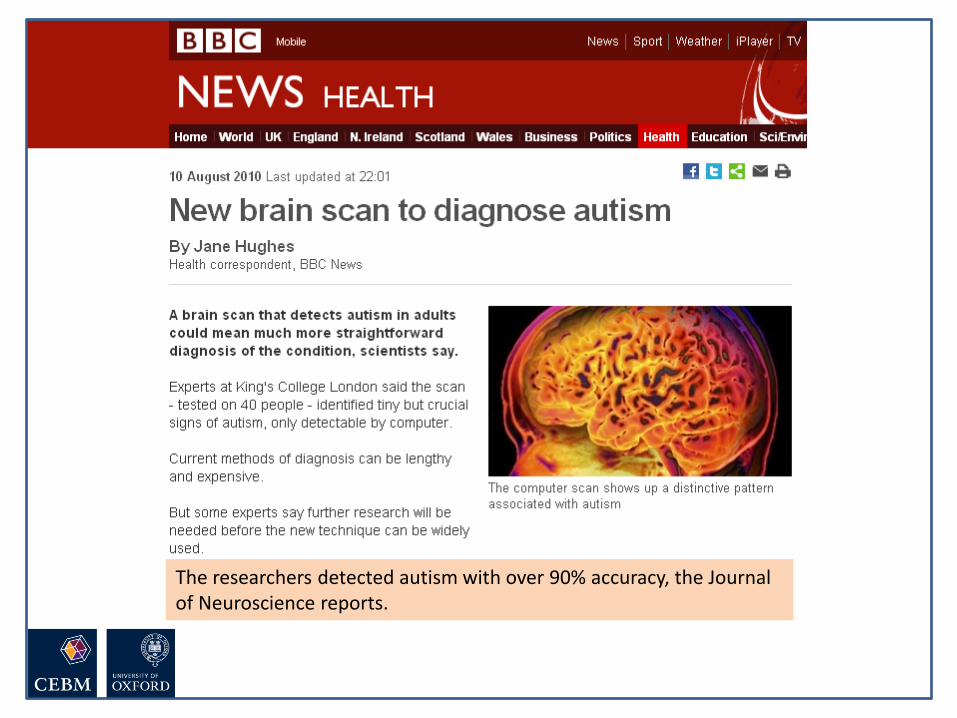
The researchers detected autism with over 90% accuracy, the Journal of Neuroscience reports.


2:00 1:59 1:58 1:57 1:56 1:55 1:54 1:53 1:52 1:51 1:50 1:49 1:48 1:47 1:46 1:45 1:44 1:43 1:42 1:41 1:40 1:39 1:38 1:37 1:36 1:35 1:34 1:33 1:32 1:31 1:30 1:29 1:28 1:27 1:26 1:25 1:24 1:23 1:22 1:21 1:20 1:19 1:18 1:17 1:16 1:15 1:14 1:13 1:12 1:11 1:10 1:09 1:08 1:07 1:06 1:05 1:04 1:03 1:02 1:01 1:00 0:59 0:58 0:57 0:56 0:55 0:54 0:53 0:52 0:51 0:50 0:49 0:48 0:47 0:46 0:45 0:44 0:43 0:42 0:41 0:40 0:39 0:38 0:37 0:36 0:35 0:34 0:33 0:32 0:31 0:30 0:29 0:28 0:27 0:26 0:25 0:24 0:23 0:22 0:21 0:20 0:19 0:18 0:17 0:16 0:15 0:14 0:13 0:12 0:11 0:10 0:09 0:08 0:07 0:06 0:05 0:04 0:03 0:02 0:01 End
Autism has a prevalence of 1%.
The test has sensitivity of 90% and specificity of 80%.
Given a positive test, what is the probability the child has autism?
Natural Frequencies

1
99
0.9
19.8
100
20.7 people test positive………
of whom 0.9 have the disease
So, chance of disease is 0.9/20.7 =
4.5%
Disease +ve
Disease -ve
Testing +ve
Sensitivity = 90%
False positive rate = 20%
Prevalence of 1%, Sensitivity of 90%, Specificity of 80%


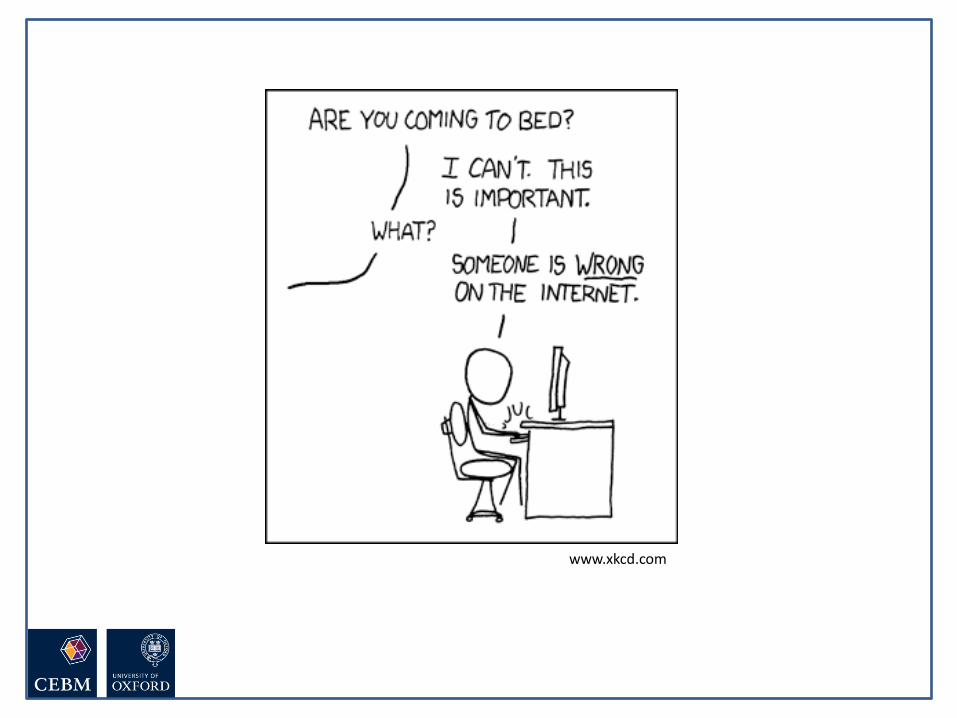
www.xkcd.com
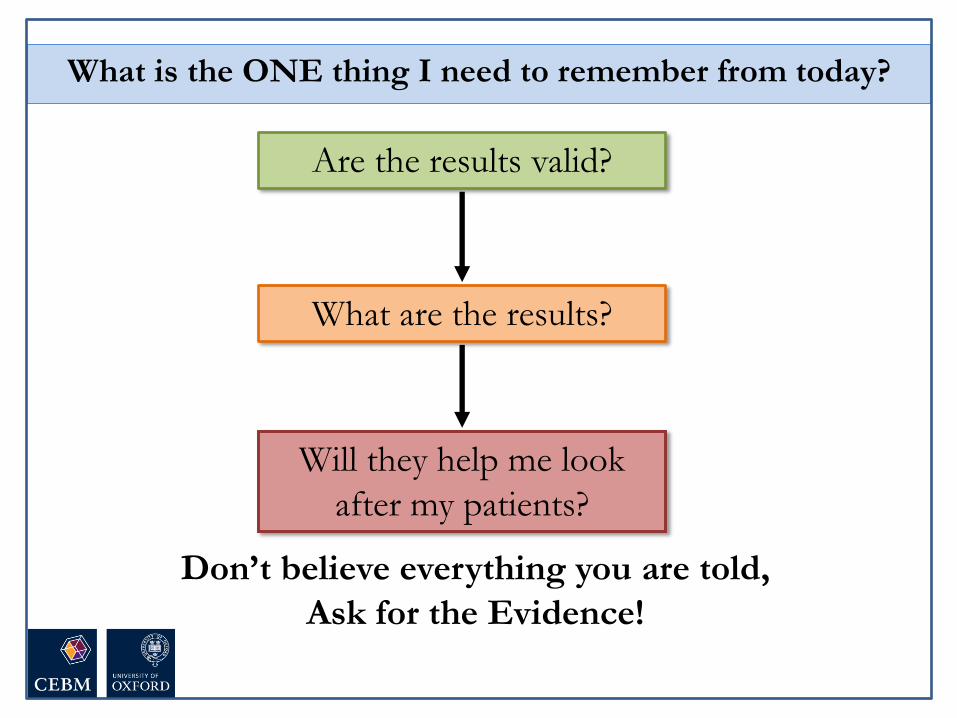
Are the results valid?
What are the results?
Will they help me look
after my patients?
•Appropriate spectrum of patients?
•Does everyone get the gold standard?
•Is there an independent, blind or
objective comparison with the gold
standard?
Appraising diagnostic tests
•Sensitivity, specificity
•Likelihood ratios
•Positive and Negative Predictive Values
•Can I do the test in my setting?
•Do results apply to the mix of patients I see?
•Will the result change my management?
•Costs to patient/health service?

• Reproducibility of the test and interpretation in my setting
• Do results apply to the mix of patients I see?
• Will the results change my management?
• Impact on outcomes that are important to patients?
• Where does the test fit into the diagnostic strategy?
• Costs to patient/health service?
Will the test apply in my setting?
Are the results valid?
What are the results?
Will they help me look
after my patients?
What is the ONE thing I need to remember from today?
Don’t believe everything you are told,
Ask for the Evidence!

Teaching tips….

The researchers detected autism with over 90% accuracy, the Journal of Neuroscience reports.
Bring it back to the beginning…

• Reproducibility of the test and interpretation in my setting
• Do results apply to the mix of patients I see?
• Will the results change my management?
• Impact on outcomes that are important to patients?
• Where does the test fit into the diagnostic strategy?
• Costs to patient/health service?
Will the test apply in my setting?
There is more to diagnostics than
accuracy!
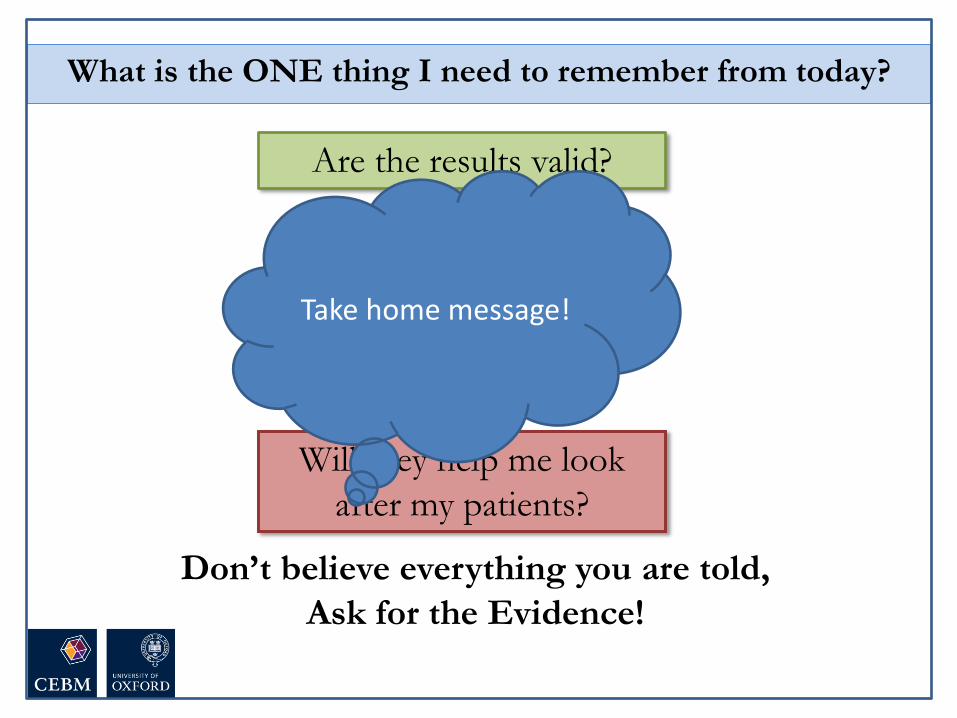
Are the results valid?
What are the results?
Will they help me look
after my patients?
What is the ONE thing I need to remember from today?
Don’t believe everything you are told,
Ask for the Evidence!
Take home message!

The Diagnostic Process. John Balla. Cambridge Univ. Press
Diagnostic Tests Toolkit. Thompson & Van den Bruel. Wiley-Blackwell.
Evidence base of Clinical Diagnosis. Knottnerus & Buntinx. Wiley-Blackwell
Evidence based Physical Diagnosis. Steven McGee. Saunders
Evidence-based Diagnosis. Newman & Kohn. Cambridge Univ. Press
Useful books on diagnostics
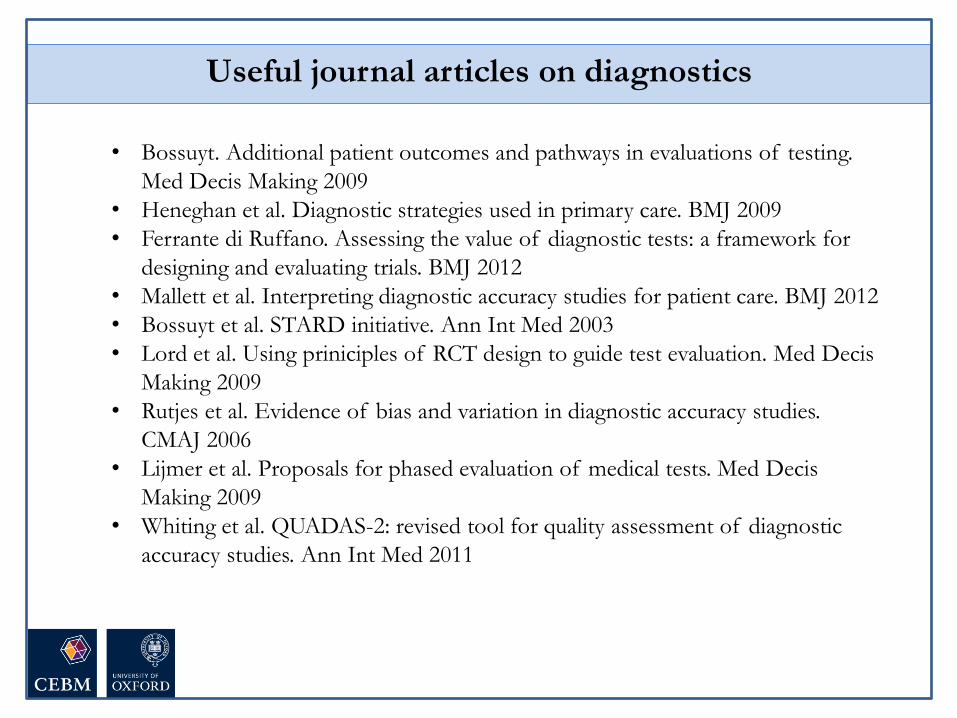
• Bossuyt. Additional patient outcomes and pathways in evaluations of testing.
Med Decis Making 2009
• Heneghan et al. Diagnostic strategies used in primary care. BMJ 2009
• Ferrante di Ruffano. Assessing the value of diagnostic tests: a framework for
designing and evaluating trials. BMJ 2012
• Mallett et al. Interpreting diagnostic accuracy studies for patient care. BMJ 2012
• Bossuyt et al. STARD initiative. Ann Int Med 2003
• Lord et al. Using priniciples of RCT design to guide test evaluation. Med Decis
Making 2009
• Rutjes et al. Evidence of bias and variation in diagnostic accuracy studies.
CMAJ 2006
• Lijmer et al. Proposals for phased evaluation of medical tests. Med Decis
Making 2009
• Whiting et al. QUADAS-2: revised tool for quality assessment of diagnostic
accuracy studies. Ann Int Med 2011
Useful journal articles on diagnostics


