72
Version 1.0.0 Operation TEAM 700 for UNIX GDC 058R707-V100 Issue 1, October 1997 General DataComm

Version 1.0.0
Operation
TEAM 700 for UNIX
GDC 058R707-V100Issue 1, October 1997
General DataComm

Warning
This equipment generates, uses, and can radiate radio frequency energy and if not installed and used in accordance with the instruction manual, may cause interference to radio communications. It has been tested and found to comply with the limits for a Class A computing device pursuant to CISPR 22, which is designed to provide reasonable protection against such interference when operated in a commercial environment. Operation of this equipment in a residential area is likely to cause interference, in which case the user at his own expense will be required to take whatever measures may be required to correct the interference. The user is cautioned that any changes or modifications not expressly approved by General DataComm void the user’s authority to operate the equipment.
This digital apparatus does not exceed Class A limits for radio noise emissions from digital apparatus described in the Radio Interference Regulations of the Canadian Department of Communications.
Le présent appareil numérique n’émet pas de bruits radioélectriques dépassant les limites applicables aux appareils numériques de la classe A prescrites dans le Règlement sur le brouillage radioélectrique édicté par le ministère des Communications du Canada.
Warranty
General DataComm warrants that its equipment is free from defects in materials and workmanship. The warranty period is one year from the date of shipment. GDC's sole obligation under its warranty is limited to the repair or replacement of the defective equipment provided it is returned to GDC, transportation prepaid, within a reasonable period. This warranty will not extend to equipment subjected to accident, misuse, or alterations or repair not made by GDC or authorized by GDC in writing. The foregoing warranty is exclusive and in lieu of all other warranties, express or implied, including but not limited to, warranties of merchantability and fitness for purpose.
Trademarks and Patents
General DataComm, the General DataComm logo and the following are trademarks of General DataComm, Inc. in the United States and other countries: ACCULINE, ANALOOP, AUTOFRAME, BERT 901, DATACOMM SECURE-PAK, DATALOOP, DIGIDIAL, ENmacs, FASTPRO, FIRST RESPONSE, GDC, GDC APEX, GENERAL DATACOMM X-PRESS, GEN*NET, GEN*PAC, IMAGE*TMS, KILOMUX, LAN*TMS, MEGA*BRIDGE, MEGAMUX, MEGAMUX TMS, MEGANET, MEGASPLIT, MEGASWITCH, MEGAVIEW, MULTIMODEM, NETCON, NETSWITCH, NMC, QUIKSHIPPERS, SERVI-CHECK, SERVI-SNAP.
Ethernet is a trademark of the Xerox Corporation. HP OPENVIEW is a trademark of Hewlett-Packard Company. IBM PS/2 is a trademark of International Business Machines Corporation. Microsoft is a trademark of the Microsoft Corporation. NetWare is a trademark of Novell, Inc. Novell is a trademark of Novell, Inc. XENIX is a trademark of Microsoft Corporation.
Copyright
© 1996 General DataComm, Inc. All rights reserved.
P.O. Box 1299, Middlebury, Connecticut 06762-1299 U.S.A.
This publication and the software it describes contain proprietary and confidential information. No part of this document may be copied, photocopied, reproduced, translated or reduced to any electronic or machine-readable format without prior written permission of General DataComm, Inc. The information in this document is subject to change without notice. General DataComm assumes no responsibility for any damages arising from the use of this document, including but not limited to, lost revenue, lost data, claims by third parties, or other damages. If you have comments or suggestions concerning this manual, please write to Technical Publications or call 1-203-758-1811.

Table of Contents
....... iii
...... iii
....... iv
..... iv
.. 1 - 1
.. 1 - 1
. 1 - 1
. 1 - 2
... 1 - 2
... 1 - 2
. 2 - 1
.. 2 - 1
... 2 - 1
.. 2 - 1
.. 2 - 2
.. 2 - 2
. 2 - 2
... 2 - 3
.. 2 - 5
... 2 - 6
.. 2 - 7
.. 2 - 8
2 - 9
.. 2 - 9
. 2 - 13
. 2 - 14
2 - 28
2 - 30
2 - 30
PrefaceScope ................................................................................................................................
Organization ......................................................................................................................
Document Conventions .....................................................................................................
Service and Support.............................................................................................................
Chapter 1 System DescriptionOverview ...........................................................................................................................
Basic Design......................................................................................................................
Theory of Operation ...........................................................................................................
700 Unit Capabilities..........................................................................................................
SpectraComm Manager Card and 700-Managed Units....................................................
Accessing Team 700.........................................................................................................
Chapter 2 OperationsIntroduction to Operations..................................................................................................
Accessing 700 Application ..........................................................................................
Performance ................................................................................................................
Configuration ...............................................................................................................
Fault .............................................................................................................................
Misc..............................................................................................................................
Map Window Menu Bar Access.........................................................................................
700 Front Panel.................................................................................................................
LEDs of the Front Panels.............................................................................................
Select Menu ................................................................................................................
GDC Logo....................................................................................................................
Common Window Features...............................................................................................
Performance Functions........................................................................................................
Alarms..........................................................................................................................
Status...........................................................................................................................
Reports ........................................................................................................................
Current Interval Reports ..............................................................................................
Configuration Functions....................................................................................................
Configure .....................................................................................................................
GDC 058R707-V100

ii Table of Contents
- 31
- 31
- 31
- 31
- 32
- 33
3 - 1
3 - 1
3 - 1
- 2
- 2
3 - 5
3 - 5
3 - 7
3 - 8
- 10
- 11
- 12
- 13
4 - 1
4 - 1
4 - 2
5 - 1
5 - 1
5 - 5
5 - 6
Maintenance................................................................................................................. 2
Diagnostics ........................................................................................................................ 2
Miscellaneous Functions ................................................................................................... 2
Information .................................................................................................................. 2
Front Panel Poll Rate ................................................................................................... 2
Note Pad....................................................................................................................... 2
Chapter 3 Configuration
Introduction .........................................................................................................................
Templates ............................................................................................................................
Configuration Procedure .....................................................................................................
Configuration Option Values......................................................................................... 3
Main Configuration Window .............................................................................................. 3
Unit Options ........................................................................................................................
T1 Interface .........................................................................................................................
E1 Options...........................................................................................................................
Alarms Reported..................................................................................................................
DTE Options...................................................................................................................... 3
RDL Options ..................................................................................................................... 3
Add Remote...................................................................................................................... 3
Circuit Configuration ........................................................................................................ 3
Chapter 4 Maintenance
Introduction .........................................................................................................................
Maintenance Window Buttons ............................................................................................
Reset Alarms Button......................................................................................................
Chapter 5 Diagnostics
Overview .............................................................................................................................
Diagnostics Window ...........................................................................................................
Test Instructions ..................................................................................................................
700 Diagnostics History.................................................................................................
GDC 058R707-V100

The
Preface
ScopeThis manual describes how to operate the Team 700 High Bit Rate Digital Subscriber Line (HDSL) Network Manager, Version 1.0.0. It assumes familiarity with HP OpenView.
The Team 700 software is an HP OpenView application that employs the Simple Network Management Protocol (SNMP) to configure and control the operation of GDC HDSL Data Service Units (DSUs). The DSUs support DTE interface functions and provide fractional T1/E1 capability on the network.
This manual assumes a working knowledge of DSU functions and operation.
OrganizationThis manual has five chapters. The information is arranged as follows:
• Chapter 1 - System Description describes the product and its features.
• Chapter 2 - Operation provides directions for accessing the smaller individual applications that are responsible for the Team 700 functions. It describes how to access the functions from a shelf map window menu bar, and from the Select menu of a DSU front panel display.chapter provides full descriptions of the Team 700 applications that display read-only windows. It provides access information for the applications that display read/write windows and require greater operator interaction.
• Chapter 3 - Configuration provides instructions for accessing the Configuration application and using it to set operating parameters in a selected DSU. The chapter covers how to save configuration changes to the unit or as templates at the controller workstation, and defines the parameters you can set.
• Chapter 4 - Maintenance provides instructions for accessing the Maintenance application andusing it to control functions of the DSU.
• Chapter 5 - Diagnostics provides instructions for accessing the Diagnostics application window and using it to perform test procedures.
The Index contains topics on the Team 700 with page numbers.
GDC 058R707-V100
Document Conventions iv
ers use
sion is
,
rvice
c
Document Conventions
Level 1 paragraph headers introduce major topics.
Level 2 paragraph headers introduce subsections of major topics.
Level 3 paragraph headers introduce subsections of secondary topics.
GDC publication numbers are used to track and order technical manuals. Publication numbthe following format:
GDC NNNRnnn-000 or GDC NNNRnnn-Vnnn
NNN identifies the product family
R denotes a technical publication
nnn a number assigned by Technical Publications
000 identifies a hardware product and does not change
Vnnn the software version associated with a product may be updated periodically
The issue number changes when a manual is revised or reprinted with changes for some other reason; it does not automatically change when the software is updated. A new software veralways Issue 1. Other specialized publications such as Release Notes or Addenda may be available depending on the product.
Service and Support
General DataComm is committed to providing the service and support needed to install, manageand maintain your equipment. For information about service programs or for assistance with your support requirements, contact your local Sales Representative or call General DataComm Seat the 24-hour toll free number listed below.
• in the U.S. dial 1-800-243-1030
• outside the U.S. dial 1-203-598-7526
Be ready with the site name and phone number and a description of the problem and the next available support representative will promptly return your call.
Hands-on training courses are provided by GDC Educational Services. Courses range from basidata communications, modems and multiplexers, to complex network and ATM systems and are taught in Connecticut or at a customer location. Call 1-800-243-1030 and follow the menu instructions to discuss educational services or to receive a course schedule.
Notes present special instructions, helpful hints or general rules.
NOTE
GDC 058R707-V100

its
ol
n the
e remote
eens
Chapter 1 System Description
Overview
This manual covers the TEAM 700 Unix Application for HP OpenView. You should be familiar with HP OpenView and with the operation of SpectraComm Units (SCU) and DataComm Un(DCU) to use this manual effectively.
The TEAM 700 Application is actually a collection of integrated applications for the HP OpenView Network Management Platform. The applications use the Simple Network Management Protoc(SNMP) to manage GDC 700 SCUs and DCUs.
TEAM 700 applications enable you to:
• Configure 700 SCUs and DCUs.
• Monitor the operation of the SCUs and DCUs through displays of Alarms and DTE Interface States, and through a Front Panel display that shows LED indicators as they appear ofront panel of the physical unit.
• Diagnose suspected problems using local and remote loops (with or without an internally generated test pattern).
Basic Design
The SpectraComm HDSL (High Bit Rate Digital Subscriber Line) is designed as a flexible and versatile connection to the T1/E1 or Fractional T1/E1 telecommunications network.
Referred to as the master unit, the SC701 T2, SC700 G2, SC700 G3, SC702 G2, and SC710 D2 arSpectraComm units installed in the SpectraComm shelf and can accommodate up to three units. These remotes include the DataComm Units DC721 T2, DC730 D1, DC730 D2, DC 720 G1, DC720 G2, and DC731 D2, which can be used in a point-to-point or a multipoint configuration. You can operate the SC701 T2, SC700 G2, SC700 G3, SC702 G2, and SC710 D2 with either one loop or all loops enabled. When you work in a multi-point configuration, only like units can be added as remotes (two DC 721 T2s or two DC 731 D2s).
Up to 15 700-managed SC701 T2, 700 G2, 700 G3, 702 G2, and 710 D2 units can be accommodatedin a single shelf, and up to 31 of them in a dual shelf. The 700 is fully network managed by the shelf resident SpectraComm Manager (SCM) and an associated SNMP manager.
Theory of Operation
The TEAM Application Components are your gateway to the TEAM system which carries out eachtask while being user-friendly. All of the TEAM Controller application interfaces use the HP OpenView APIs (Application Programmer Interfaces) to integrate with HP OpenView Windows and other network management applications. Menus are pulled down from the appropriate OpenView submap or are activated from the front panel button. The TEAM Controller GUI scrmeet HP OpenView premier partner requirements.
GDC 058R707-V100

1-2 700 Unit Capabilities
anager
s. The
rate as
adings
t panel
700 Unit Capabilities
With the Team 700 application, DataComm and SpectraComm units provide:
• Local loop transmission for full and fractional T1/E1 services
• Telephone company/carrier or end-user transmission
• Internal testing
SpectraComm Manager Card and 700-Managed Units
The SpectraComm and DataComm 700-managed units work with the GDC SpectraComm M(SCM) card to give you comprehensive network management using the Simple Network Management Protocol (SNMP). The SCM acts as the SNMP agent through which TEAM management applications communicate with these 700-managed units and other compatible equipment.
All management communications are directed to the SCM card Internet Protocol (IP) addresSCM card relays commands and responses between management applications and hardware components, using a slot addressing scheme to communicate over the SpectraComm shelfbackplane with the other components. The SCM is transparent to the applications, which opethough they were communicating directly with the hardware units. The SCM card is managed by the TEAM Core application, which is also responsible for the Discovery and Mapping functions bywhich HP OpenView keeps track of the devices being managed.
Accessing Team 700
The applications that make up the Team 700 manager are grouped on menus under the hePerformance , Configuration , Fault , and Misc (Miscellaneous). Menus for the applications are available in two ways:
• From the menu bar of the HPOV Map window when an 700-managed unit is selected in the window
• From the Select button on the 700 Front Panel display.
700 front panel displays current status information on the 700-managed unit by displaying the states of the LED indicators on the front panel of the unit. The managed-unit has Select button menus where you can access all other functions of the TEAM 700 manager. You can select the fronfrom the Performance menu in the HPOV Map window menu bar. You can also launch the front panel display from that window by double-clicking on the shelf icon of the unit or device you needto work with.
The following TEAM 700 applications appear on both the Map window and Select button menus:
• Performance :
Alarms – furnishes detailed information about alarm state changes
Status – presents information on the status of signals in the DTE interface
Reports – displays statistical reports
GDC 058R707-V100

Accessing Team 700 1-3
r
ch
ou ides
Current Interval Reports – displays current 15-minutes of statistical information
• Configuration :
Configure – enables you to configure a selected 700 unit
Circuit Configuration - Allows configuration of DS0s or time slots.
Maintenance – enables you to set device specific attributes that are not set as configu-ration options
• Fault :
Diagnose – lets you run diagnostic tests on a selected 700 unit
• Misc :
Information – displays revision level information on the TEAM 700 software
The Misc menu in the Map window menu bar offers you two selections that do not appeain the front panel Select button menu:
Front Panel Poll Rate – lets you set a default polling interval to be in effect eatime the front panel display is opened.
Note Pad – opens a shell tool on the workstation running the TEAM software. Ycan use the shell tool to run a text editor, mail tool, or any other software that reson the workstation. The note pad application is useful for keeping system records.
GDC 058R707-V100

ults.
o a
ese
Chapter 2 Operations
Introduction to Operations
The Team 700 operates by giving you easy access to its fundamental tools when you run the application. You can see how it constantly gives you feedback on status and alarms, allows you freedom to configure and maintain the application, and advises you of immediate testing res
Accessing 700 Applic ation
The Team 700 controller application consists of a group of smaller applications, each devoted tspecific aspect of controlling or monitoring 700 units. As mentioned in Chapter 1, you can access the Team 700 applications by:
• the map window menu bar, or
• the front panel window Select button menus.
This chapter describes both ways.
Performance
There are five performance applications described in this chapter:
• Alarms gives you alarm information in a read-only window.
• Status gives you the status of signals in the DTE interface.
• Reports displays information on a variety of error conditions that may be experienced bythe unit over a 24-hour period.
• Current Interval Reports displays the most recent 15 minutes of information concerning error conditions.
• Front Panel displays the front panel of an unit.
Configuration
Configuration has three parts: Configure , Circuit Configuration , and Maintenance . Each supports read/write windows so that you can review and change unit operating parameters. This chapter describes how to access Configure , Circuit Configuration and Maintenance . Separate chapters are devoted to showing you how thapplications work.
GDC 058R707-V100

2-2 Map Window Menu Bar Access
the
0 since ith n the
next
Fault
The Fault menu lets you access Diagnose . With the Diagnose application you can commandthe test functions of the units and see the test results. This chapter describes how to accessDiagnose application. A later chapter shows you how to use Diagnose .
Misc
Three items appear under the menu Misc (miscellaneous): Information , Front Panel Poll Rate , and Note Pad. Only Information appears on the Select button menu of the front panel display.
Map Window Menu Bar Access
The table below illustrates how the Team 700 application functions are arranged on the menu barat the top of the HPOV Map window and shows only the menu selections for the Team 700 applications. The map window menus include selections besides those that apply to Team 70the window also lets you access other applications. You must select the unit you intend to work wbefore you open the intended menu. Select the unit by clicking the mouse once on its icon ishelf slot.
The menu item Agent Templates, which appears under Misc in the menu listing on thepage, does not apply to SCM-based applications such as Team 700. The use of that func-tion is therefore not documented in this manual.
Its functionality is employed by standalone Team application products such as Team 540 and Team 553. The Agent Templates function is documented in the manuals for those products.
Menu Bar Menu Selections
Performance
Front Panel...
Alarms...
Status...
Reports...
Current Interval Reports...
Configuration
Configure...
Circuit Configuration...
Maintenance...
NOTE
GDC 058R707-V100

700 Front Panel 2-3
bove,
nch a
unit:
The Performance menu Front Panel selection opens the front panel display window. The Select button menus in the front panel display window include the selections that appear awith the exceptions of Front Panel under Performance, and Front Panel Poll Rate and Note Pad under Misc .
700 Front PanelThe 700 front panel display windows provide a graphical interface to a selected DSU. To laufront panel, choose the unit that you want to work with in the HPOV Map window. Then, either
• Select Front Panel from the Performance menu for that window, or
• Double click the mouse on the icon for the selected unit.
The application responds by displaying a window that depicts the front panel of the selected721-T2 , 731-D2 , 730-D1 , 730-D2 , 720-G1 , or 720-G2 (See Figure 2-1). For the 700-G2 , 700-G3 , 702-G2 , 710-D2 , or 701-T2 , see Figure 2-2.
Fault
Diagnose...
Misc
Information...
Front Panel Poll Rate...
Note Pad...
Menu Bar Menu Selections
GDC 058R707-V100

2-4 700 Front Panel
Figure 2-1 700 Front Panel Series: 721-T2, 731-D2, 730-D1, 730-D2, 720-G1, or 720-G2
GDC 058R707-V100

700 Front Panel 2-5
Figure 2-2 700 Front Panel Series: 700-G2, 700-G3, 702-G2, 710-D2, or 701-T2
LEDs of the Front Pa nels
The LEDs shown in a front panel display reflect the states of the actual indicators on the physical unit:
LED LED Indicates:
ON Power on.
ES1 Error seconds on any given loop or T1/E1 lines.
NORM Normal operation on given loop or T1/E1 lines.
T1 Indicators
If ER Indicator is: and NORM Indicator is: Then, that indicates:
Off On Normal operation
On Off LOS, OOF, or AIS
On On ER--Errored seconds on the T1/E1 line.
GDC 058R707-V100

2-6 700 Front Panel
t. The ime is
error
est of t
The application polls the unit to keep the states of the LEDs in the front panel display currentime of the most recent poll appears in the bottom left corner of the front panel display. The tdisplayed in white when Auto Poll is enabled and in yellow when it is disabled. LEDs are displayed as ON (bright green or bright red), or as OFF (dark green or dark red). In the case of errors or a non-response, all LEDs are displayed in the off-state and that is when you observe an footer message.
Select Menu
The Select button, at the bottom of the front panel displays, lets you access menus for the rthe Team 700 application functions. The following table, differing somewhat from the arrangemenon the shelf map window menu bar, shows the arrangement of the Select button menus.
LED LED Indicates:
TM Test Mode is red while the unit performs a diagnostic test.
ALM A major alarm. If a failure is detected during self-test, this LED is on. It also blinks when LOS, LOSW, or UAS exists on any 700 loop.
SD Send Data, when lit, means that a space is detected in transmit data.
RD Receive Data, when lit, means that a space is detected in receive data.
Select Menu Items Menu Selections
Performance
Alarms...
Status... (loop and channel)
Reports...
Current Interval Reports...
Configuration
Configure...
Maintenance...
Fault
Diagnose...
Misc
Information...
Demand Poll
GDC 058R707-V100

700 Front Panel 2-7
tes .
Polling
Two poll selections in the Select button menu determine (for the current session) when the application is to collect new information from the unit to update the front panel window:
• Demand Poll which gives you an immediate display
• Auto Poll which enables you to select updates at 15, 30, or 60-second intervals or disables automatic polling.
If you select Disable , the front panel window displays a static snapshot of the LED staas of their last poll: at the time the window was launched or a subsequent demand poll
Each time the front panel display is opened, its initial polling rate is determined by the front panelPoll Rate selection of the HPOV map window Misc menu.
Exit
The menu selection Exit dismisses the front panel window when you click on it.
All the front panel button applications are also available through HPOV pull-down menus on the Team 700 Shelf submap.
GDC Logo
The GDC logo on the front panel is actually a push-button which spawns off an informational screen containing Team 700 Controller version information.
Auto Poll(Displays Off or poll interval)
15 seconds
30 seconds
60 seconds
Off
Exit
Help (Displays help information)
Select Menu Items Menu Selections
GDC 058R707-V100

2-8 Common Window Features
umber
t
Common Window FeaturesEach Team 700 application you select opens an on-screen window in which to operate. A nof features are common to many of the windows:
Descriptions in this manual of the individual Team 700 applications identify window features thaare specific to the applications, such as selections in the Menu bar and menus, and buttons.
Trianglebutton
Found in the title bar, which reduces the window to an icon when you click on it and select Close . Double-clicking on icon restores the window. This button appears on the top level window for each application.
Title bar Identifies the specific Team 700 application running in the window. For example: Team 700 Main Configuration or Team 700 Diagnostics
Menu bar Always contains the selections File , on the far left, and Help , on the far right. File menu always contains the selection Exit , where you can dismiss the window. Some window File menus contain selections peculiar to the window. Help menu gives you information concerning the window. Some windows have additional Menu bar selections.
The Menu bar appears on the top level window for each application. A Menu bar appears in the Main Configuration window, for example, but not in the windows that you access from Main Configuration.
Name field Identifies the 700 the application that is currently connected to by displaying the user-configured shelf name, followed by the DSU slot number, and the user-configured device name.
GDC 058R707-V100

Performance Functions 2-9
Performance F unctions
Alarms
You can launch the Team 700 Alarms application from the Performance menu of the HPOV Map window menu bar or of the front panel display Select button menu. The application displays the read-only Alarm Detail windows for the selected unit(s); in this case, we have the Team 701 T2,721 T2, 731 D2, and 700 G2 (See Figure 2-3) units. The Team 700 application gets alarm indications from the unit in two ways:
• Receiving traps sent automatically in response to alarm conditions at the unit. Or,
• initially, polling the unit for alarm conditions.
Figure 2-3 Alarm Detail Window (701 T2, 721 T2, 731 D2, and 700 G2)
Figure 2-4 displays the alarm detail windows for the 700 G3, 702 G2, 710 D2, and 720 G1, followed by Figure 2-5, giving you the alarm detail windows for the 720 G2, 730 D1, and 730 D2.
GDC 058R707-V100

2-10 Performance Functions
Figure 2-4 Alarm Detail Window (700 G3, 702 G2, 710 D2, and 720 G1)
GDC 058R707-V100

Performance Functions 2-11
Figure 2-5 Alarm Detail Window (720 G2, 730 D1, and 730 D2)
GDC 058R707-V100

2-12 Performance Functions
The Alarm Detail window displays alarms grouped into three categories:
• Line - displays T1/E1 alarms
• Loop - displays HDSL individual loop alarms
• Unit - displays unit alarms
Selectable Alarm Detail Window Items
The Alarm Detail window has selections File and Help in its menu bar, with the File menu containing only one choice, Exit , which you click to dismiss the window.
Line Alarms (T1/E1)
Loss of Signal Declared upon reception of 175 +/- 75 consecutive zeros. This is a loss of signal on the T1/E1 interface. Major Alarm: on=orange, off=dark green.
Unavailable Signal State Declared after 10 consecutive severely errored seconds.Major Alarm: on=orange, off=dark green.
Errored Seconds Seconds with a least one CRC error event Minor Alarm: on=yellow, off=dark green.
Loss Of Frame AlignmentOut of Frame
Declared when any two out of six consecutive received frame synchronizing bits are errored. Major Alarm: on=orange, off=dark green.
All Ones An unframed, all ones signal Minor Alarm: on=yellow, off=dark green.
Remote Loss Of Signal Reception of remote loss-of-T1/E1 signal report via the 700 interfaceMajor Alarm: on=orange, off=dark green.
Remote Alarm Indication Reception of remote alarm indication signal on the T1/E1 interfaceMinor Alarm: on=yellow, off=dark green.
Loop Alarms (HDSL)
Loss of Signal Declared upon reception of 175 +/- 75 consecutive zeros. This is a loss of signal on the loop. Major Alarm: on=orange, off=dark green.
Unavailable Signal State Unit has detected at least 10 severely errored seconds at its network interface.Major Alarm: on=orange, off=dark green.
Errored Seconds Errored second is defined as a second with a least one CRC error event.Minor Alarm: on=yellow, off=dark green.
Loss of Sync Word Loss of synchronization word on the corresponding loopMajor Alarm: on=orange, off=dark green.
Major BER Incoming 700 bit error rate exceeds selected major alarm thresholdMajor Alarm: on=orange, off=dark green.
Minor BER Incoming 700 bit error rate exceeds selected minor alarm thresholdMinor Alarm: on=yellow, off=dark green.
Unit Alarms (700)
Unit Failure Unit has failed its power on self-test. Major Alarm: on=orange, off=dark green.
Checksum Corrupt Indicates that the non-volatile memory, which stores the configuration of the unit, has become corrupted. Major Alarm: on=orange, off=dark green.
Power Up Occurs each time power is cycled or a reset is performed at the unit.Warning Alarm: on=bright green, off=dark green.
GDC 058R707-V100
Performance Functions 2-13
s ll. The in
l in-
.
/
ge
Status
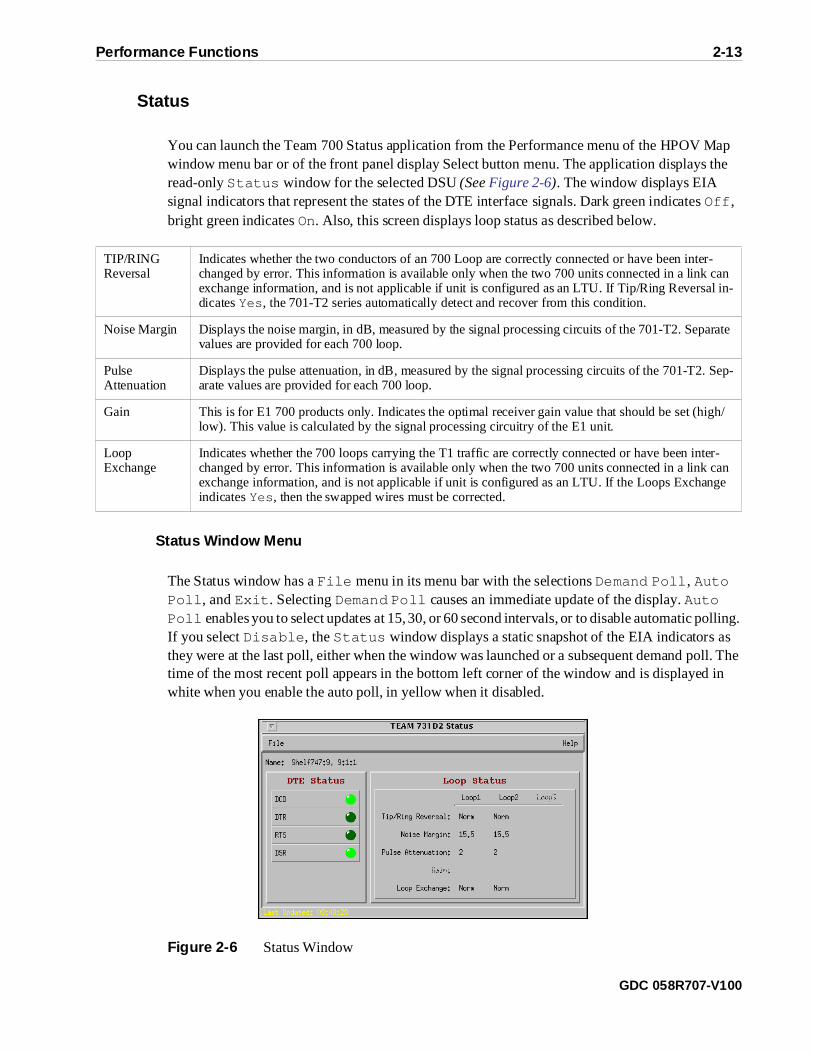
You can launch the Team 700 Status application from the Performance menu of the HPOV Mapwindow menu bar or of the front panel display Select button menu. The application displays the read-only Status window for the selected DSU (See Figure 2-6). The window displays EIA signal indicators that represent the states of the DTE interface signals. Dark green indicates Off , bright green indicates On. Also, this screen displays loop status as described below.
Status Window Menu
The Status window has a File menu in its menu bar with the selections Demand Poll , Auto Poll , and Exit . Selecting Demand Poll causes an immediate update of the display. Auto Poll enables you to select updates at 15, 30, or 60 second intervals, or to disable automatic polling. If you select Disable , the Status window displays a static snapshot of the EIA indicators athey were at the last poll, either when the window was launched or a subsequent demand potime of the most recent poll appears in the bottom left corner of the window and is displayedwhite when you enable the auto poll, in yellow when it disabled.
Figure 2-6 Status Window
TIP/RINGReversal
Indicates whether the two conductors of an 700 Loop are correctly connected or have been inter-changed by error. This information is available only when the two 700 units connected in a link canexchange information, and is not applicable if unit is configured as an LTU. If Tip/Ring Reversadicates Yes, the 701-T2 series automatically detect and recover from this condition.
Noise Margin Displays the noise margin, in dB, measured by the signal processing circuits of the 701-T2. Separate values are provided for each 700 loop.
PulseAttenuation
Displays the pulse attenuation, in dB, measured by the signal processing circuits of the 701-T2Sep-arate values are provided for each 700 loop.
Gain This is for E1 700 products only. Indicates the optimal receiver gain value that should be set (highlow). This value is calculated by the signal processing circuitry of the E1 unit.
LoopExchange
Indicates whether the 700 loops carrying the T1 traffic are correctly connected or have been inter-changed by error. This information is available only when the two 700 units connected in a link canexchange information, and is not applicable if unit is configured as an LTU. If the Loops Exchanindicates Yes, then the swapped wires must be corrected.
GDC 058R707-V100

2-14 Performance Functions
plays
e
,
Reports
You can launch the Team 700 Reports application from the Performance menu of the HPOV Shelf-Map window menu bar or of the front panel display Select button menu. The application disstatistics accumulated by the DSU concerning seven types of error conditions.
When you launch the Report application, it initially displays an Error Reports summary window(See Figure 2-7) that displays statistics for all the error conditions the application tracks. The Navigate menu of the summary window lets you access individual windows that furnish mordetailed statistics on each error condition.
The statistics displayed in the Error Reports summary window cover the current 24 hours of operation (excluding the current, incomplete 15-minute interval). The application indicates how often each of the eight error types took place during the period:
• Errored Seconds (ES)
• Severely Errored Seconds (SES)
• Bursty Errored Seconds (BES)
• Unavailable Seconds (UAS)
• Controlled Slip Seconds (CCS)
• Loss of Frame Count (LOFC)
• Far End Block Error Count (FEBE)
• Severely Degraded Minutes (SDM) (E1 only--currently not supported)
Figure 2-7 shows you the window or screen display of the results of these eight error events, recorded by the application. The eight error events reflect the outcomes from one of four selectable categories: line (E1/T1 ) or one of the 700 loops (Loops 1, 2, or 3). Below the selectable categoriesare three bar graphs, where the vertical axis shows you units and minutes ; and where the horizontal axis shows you the distribution of the eight error events. Selectable limits for each scale are designated as Set Vertical Scale at the top of bar graphs. Just click on a particular category and vertical scale for times and occurrences.
GDC 058R707-V100

Performance Functions 2-15
reflect
Figure 2-7 Error Reports Window
Error Reports Window Menus
The Error Reports window has File and Navigate menus in its menu bar (Figure 2-7). The File menu consists of Refresh and Exit selections. The Refresh selection updates the display tochanges that have occurred since the window was opened or since the last Refresh , and the Exit selection dismisses the Error Reports window. The Navigate menu has ten selections:
Errored Seconds (Graph)...
Severely Errored Seconds (Graph)...
Bursty Errored Seconds (Graph)...
Unavailable Seconds (Graph)...
Controlled Slip Seconds (Graph)...
Loss of Frame Count (Graph)...
Far End Block Error Count...(Graph)
GDC 058R707-V100

2-16 Performance Functions
xt
that
Severely Degraded Minutes...(Graph)
Errors (Text)...
All Screens....
The first eight selections access graphic screens that are detail displays of the information as it is presented in the main Error Reports window. The ninth option in the Navigate menu accesses a tescreen that displays the exact numbers of error event occurrences. The tenth selection opens all theReports windows at once.
Errored Seconds Display Screen
The Errored Seconds display screen graphically illustrates the number of errored secondsoccurred during a four hour period selected from the last 24 hours (Figure 2-8). You select the period to be displayed by clicking on the Select 4 Hour Period check-box next to 0 to 4 (the most recent), 5 to 8, 9 to 12, 13 to 16, 17 to 20, or 21 to 24.
The application keeps the selections for earlier periods grayed out until it has been running long enough to have data that corresponds to those periods.
Figure 2-8 Errored Seconds Reports Display Screen
GDC 058R707-V100

Performance Functions 2-17
,
rent,
r
le t
rely
Time intervals are the horizontal axis of the bar graph display. There are 18 sets of graph barsidentified as 0 through 16 and Avg:
• 0 always indicates the number of errored seconds that have occurred so far in the curincomplete 15-minute interval, regardless of which four-hour period is being displayed.
• 1 through 16 represent a four-hour time span, divided into 15-minute intervals (when data is not yet available for the entire four-hour period, the application displays only the intervals fowhich it has data).
• Avg illustrates the averages of the values for completed intervals.
The vertical axis of the bar graph displays the number of errored seconds against a selectable scaof 0 to 900, 450, or 225. Click on the appropriate check-box above the bar graph display to selecthe vertical scale.
Click on the OK button to dismiss the window when done viewing it.
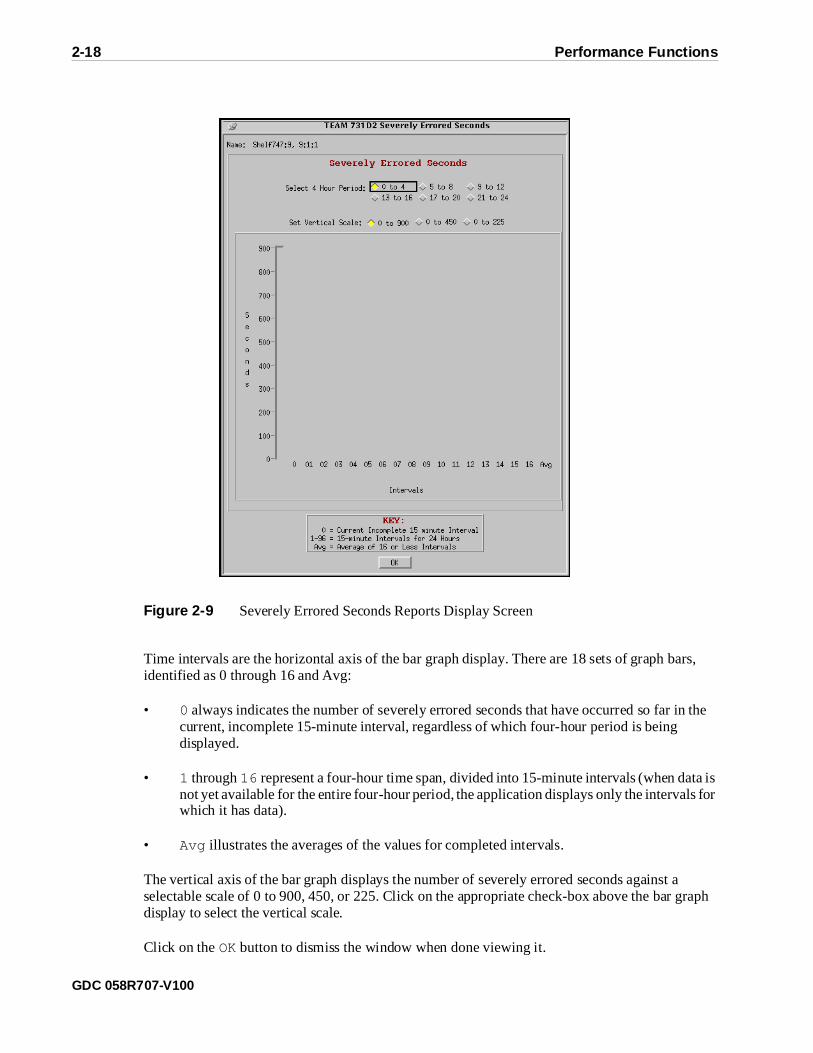
Severely Errored Seconds Dis play Screen
The Severely Errored Seconds display screen graphically illustrates the number of seveerrored seconds that occurred during a four hour period selected from the last 24 hours(Figure 2-9). You select the period to be displayed by clicking on the Select 4 Hour Period check-box next to 0 to 4 (the most recent), 5 to 8, 9 to 12, 13 to 16, 17 to 20, or 21 to 24.
The application keeps the selections for earlier periods grayed out until it has been running long enough to have data that corresponds to those periods.
GDC 058R707-V100
2-18 Performance Functions
,
r
graph
Figure 2-9 Severely Errored Seconds Reports Display Screen
Time intervals are the horizontal axis of the bar graph display. There are 18 sets of graph barsidentified as 0 through 16 and Avg:
• 0 always indicates the number of severely errored seconds that have occurred so far in the current, incomplete 15-minute interval, regardless of which four-hour period is being displayed.
• 1 through 16 represent a four-hour time span, divided into 15-minute intervals (when data is not yet available for the entire four-hour period, the application displays only the intervals fowhich it has data).
• Avg illustrates the averages of the values for completed intervals.
The vertical axis of the bar graph displays the number of severely errored seconds against a selectable scale of 0 to 900, 450, or 225. Click on the appropriate check-box above the bar display to select the vertical scale.
Click on the OK button to dismiss the window when done viewing it.
GDC 058R707-V100

Performance Functions 2-19
Bursty Errored Seconds Display Screen
The Bursty Errored Seconds display screen graphically illustrates the number of bursty errored seconds that occurred during a four hour period selected from the last 24 hours(Figure 2-10). You select the period to be displayed by clicking on the Select 4 Hour Period check-box next to 0 to 4 (the most recent), 5 to 8, 9 to 12, 13 to 16, 17 to 20, or 21 to 24.
The application keeps the selections for earlier periods grayed out until it has been running long enough to have data that corresponds to those periods.
Figure 2-10 Bursty Errored Seconds Reports Display Screen
GDC 058R707-V100

2-20 Performance Functions
,
the
r
ble lay to
e
Time intervals are the horizontal axis of the bar graph display. There are 18 sets of graph barsidentified as 0 through 16 and Avg:
• 0 always indicates the number of bursty errored seconds that have occurred so far in current, incomplete 15-minute interval, regardless of which four-hour period is being displayed.
• 1 through 16 represent a four-hour time span, divided into 15-minute intervals (when data is not yet available for the entire four-hour period, the application displays only the intervals fowhich it has data).
• Avg illustrates the averages of the values for completed intervals.
The vertical axis of the bar graph displays the number of bursty errored seconds against a selectascale of 0 to 900, 450, or 225. Click on the appropriate check-box above the bar graph dispselect the vertical scale.
Click on the OK button to dismiss the window when done viewing it.
Unavailable Seconds Display Screen
The Unavailable Seconds display screen graphically illustrates the number of unavailablseconds that occurred during a four hour period selected from the last 24 hours (Figure 2-11). You select the period to be displayed by clicking on the Select 4 Hour Period check-box next to 0 to 4 (the most recent), 5 to 8, 9 to 12, 13 to 17, 17 to 21, or 21 to 24.
The application keeps the selections for earlier periods grayed out until it has been running long enough to have data that corresponds to those periods.
GDC 058R707-V100

Performance Functions 2-21
,
rent,
r
ctable lay to
Figure 2-11 Unavailable Seconds Reports Display Screen
Time intervals are the horizontal axis of the bar graph display. There are 18 sets of graph barsidentified as 0 through 16 and Avg:
• 0 always indicates the number of unavailable seconds that have occurred so far in the curincomplete 15-minute interval, regardless of which four-hour period is being displayed.
• 1 through 16 represent a four-hour time span, divided into 15-minute intervals (when data is not yet available for the entire four-hour period, the application displays only the intervals fowhich it has data).
• Avg illustrates the averages of the values for completed intervals.
The vertical axis of the bar graph displays the number of unavailable seconds against a selescale of 0 to 900, 450, or 225. Click on the appropriate check-box above the bar graph dispselect the vertical scale.
Click on the OK button to dismiss the window when done viewing it.
GDC 058R707-V100

2-22 Performance Functions
ed
Controlled Slip Seconds Display Screen
The Controlled Slip Seconds display screen graphically illustrates the number of controllslip seconds that occurred during a four hour period selected from the last 24 hours (Figure 2-12). You select the period to be displayed by clicking on the Select 4 Hour Period check-box next to 0 to 4 (the most recent), 5 to 8, 9 to 12, 13 to 16, 17 to 20, or 21 to 24.
The application keeps the selections for earlier periods grayed out until it has been running long enough to have data that corresponds to those periods.
Figure 2-12 Controlled Slip Seconds Reports Display Screen
GDC 058R707-V100

Performance Functions 2-23
,
r
ble y to
that
Time intervals are the horizontal axis of the bar graph display. There are 18 sets of graph barsidentified as 0 through 16 and Avg:
• 0 always indicates the number of controlled slip seconds that have occurred so far in the current, incomplete 15-minute interval, regardless of which four-hour period is being displayed.
• 1 through 16 represent a four-hour time span, divided into 15-minute intervals (when data is not yet available for the entire four-hour period, the application displays only the intervals fowhich it has data).
• Avg illustrates the averages of the values for completed intervals.
The vertical axis of the bar graph displays the number of controlled slip seconds against a selectascale of 0 to 250, 130, or 65. Click on the appropriate check-box above the bar graph displaselect the vertical scale.
Click on the OK button to dismiss the window when done viewing it.
Loss of Frame Count Display Screen
The Loss of Frame Count display screen graphically illustrates the number of frame losses occurred during a four hour period selected from the last 24 hours (Figure 2-13). You select the period to be displayed by clicking on the Select 4 Hour Period check-box next to 0 to 4 (the most recent), 5 to 8, 9 to 12, 13 to 16, 17 to 21, or 21 to 24.
The application keeps the selections for earlier periods grayed out until it has been running long enough to have data that corresponds to those periods.
GDC 058R707-V100
2-24 Performance Functions
,
r
of
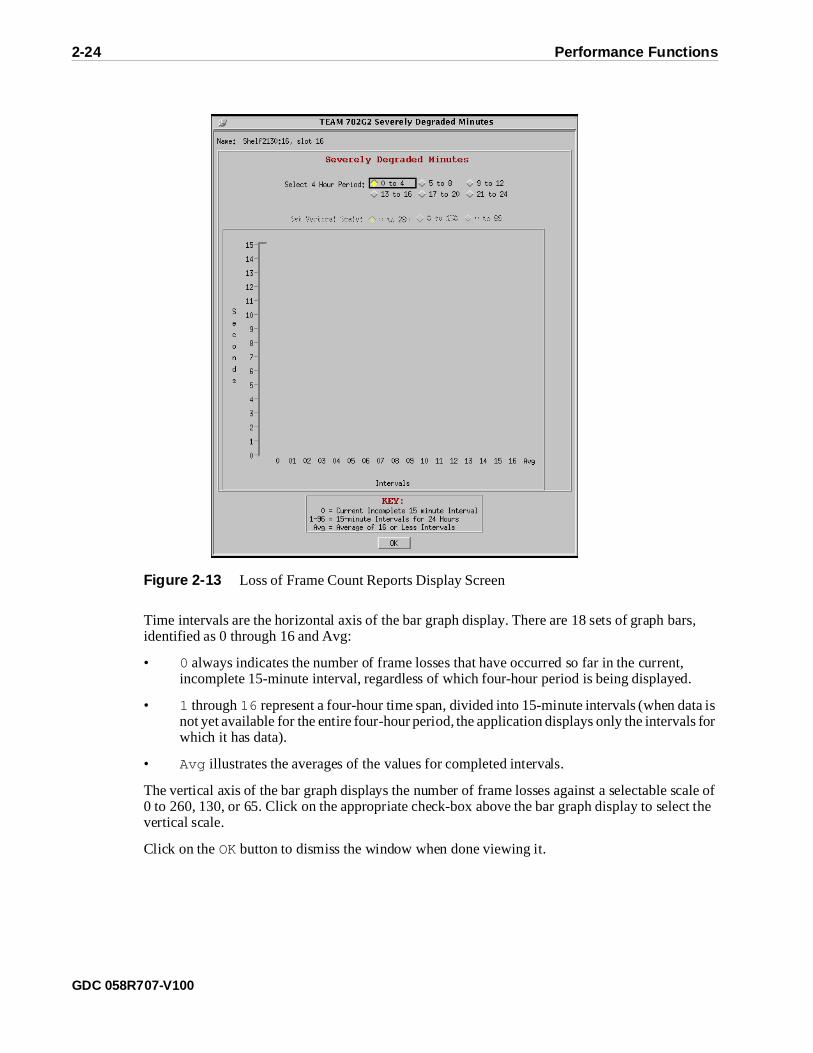
Figure 2-13 Loss of Frame Count Reports Display Screen
Time intervals are the horizontal axis of the bar graph display. There are 18 sets of graph barsidentified as 0 through 16 and Avg:
• 0 always indicates the number of frame losses that have occurred so far in the current, incomplete 15-minute interval, regardless of which four-hour period is being displayed.
• 1 through 16 represent a four-hour time span, divided into 15-minute intervals (when data is not yet available for the entire four-hour period, the application displays only the intervals fowhich it has data).
• Avg illustrates the averages of the values for completed intervals.
The vertical axis of the bar graph displays the number of frame losses against a selectable scale0 to 260, 130, or 65. Click on the appropriate check-box above the bar graph display to select thevertical scale.
Click on the OK button to dismiss the window when done viewing it.
GDC 058R707-V100

Performance Functions 2-25
rror
Far End Block Errors Display Screen
Far End Block Errors is defined as the parameter that indicates whether a CRC block ewas detected in a preceding frame in the opposite direction of transmission (Figure 2-14). In Set Vertical Scale you have three vertical scales of seconds intervals to choose from. The screen shows also numeric displays for the current 24-hour period. This screen graphically shows the number of Far End Block Errors that have taken place in one of six four-hours periods.
Figure 2-14 Far End Block Errors Display Screen
GDC 058R707-V100

2-26 Performance Functions
5-
cale of
Time intervals are the horizontal axis of the bar graph display. There are 18 graph bars, each displaying bars for the TEAM 700 application. The pairs of graph bars are identified as 0 through 16 and Avg:
• 0 is the number of FEBE counts that have occurred so far in the current, incomplete 1minute interval.
• Selecting a 4-hour period allows the user to choose a four-hour period of the current 24 hours; 0 to 4 selects the number of errors occurred in the latest 4-hour period.
• 1 through 16 spans the four-hour period selected, divided into 15-minute intervals.
• Avg is the mean for the 16 values of completed intervals.
The vertical axis of the bar graph displays the number of FEBE counts against a selectable s0 to 65000 , 32500 , or 16250 ; click on a preferred vertical scale in Set Vertical Scale above the bar graph. The unit lets you view four hours of error reports, while non-applicable intervals are grayed-out.
When you are finished with this screen, click on the OK button to dismiss the window.
Severely Degraded Min utes Display Screen (E1 Only)
The Severely Degraded Minutes Errors display screen graphically shows you the seconds with seven or more CRC error events, or with one or more OOFs (out-of-frames). See Figure 2-15. You select the period to be displayed by clicking on the Select 4 Hour Period check-box next to 0 to 4 (the most recent), 5 to 8, 9 to 12, 13 to 16, 17 to 20, or 21 to 24.
The application keeps the selections for earlier periods grayed out until it has been running long enough to have data that corresponds to those periods.
GDC 058R707-V100

Performance Functions 2-27
,
r
of
It
Figure 2-15 Severely Degraded Minutes Reports Display Screen
Time intervals are the horizontal axis of the bar graph display. There are 18 sets of graph barsidentified as 0 through 16 and Avg:
• 0 always indicates the number of frame losses that have occurred so far in the current, incomplete 15-minute interval, regardless of which four-hour period is being displayed.
• 1 through 16 represent a four-hour time span, divided into 15-minute intervals (when data is not yet available for the entire four-hour period, the application displays only the intervals fowhich it has data).
• Avg illustrates the averages of the values for completed intervals.
The vertical axis of the bar graph displays the number of frame losses against a selectable scale0 to 260, 130, or 65. Click on the appropriate check-box above the bar graph display to select thevertical scale.
Click on the OK button to dismiss the window when done viewing it.
Errors Display Screen
The Errors Display screen is the text version of the Error Reports graphic representations. tabulates data on the eight types of error events that have occurred. (Figure 2-16).
GDC 058R707-V100

2-28 Performance Functions
iew
Figure 2-16 Errors Reports Display Screen
The screen displays the Current 24 Hour Error Totals for the current 24-hour period (without the current interval).
The display headed Current 15 Minute Interval Errors shows the error events accumulated thus far in the uncompleted current interval. For the 15-minute boundary, the accumulation is transferred to the Current 24 Hours count and a new current interval begins.
The Cumulative Error Events display at the bottom of the screen gives you a detailed vof error events that have happened over the most recent 24 hours. Each interval corresponds to 15-minute durations. The Number Of Valid Intervals indicates the number of intervals, which could be 96 or less, completed by the unit in the past 24 hours.
Click on the OK button to dismiss the window when you are finished with it.
Current Interval Reports
You can launch the Team 700 Current 15 Minute Interval Error Report application from the Shelf Map Performance Menu or from the front panel display Select button menu(Figure 2-17). The purpose of the application is to display snapshot views of statistics accumulated by the DSU during the incomplete current interval.
The application acquires the statistics it displays on operator command, rather than automatically. The window provides two buttons for this purpose below the display area: Read Unit . The display shows only the most recently read information for the far-end data.
GDC 058R707-V100
Performance Functions 2-29
ns
ds and
ch
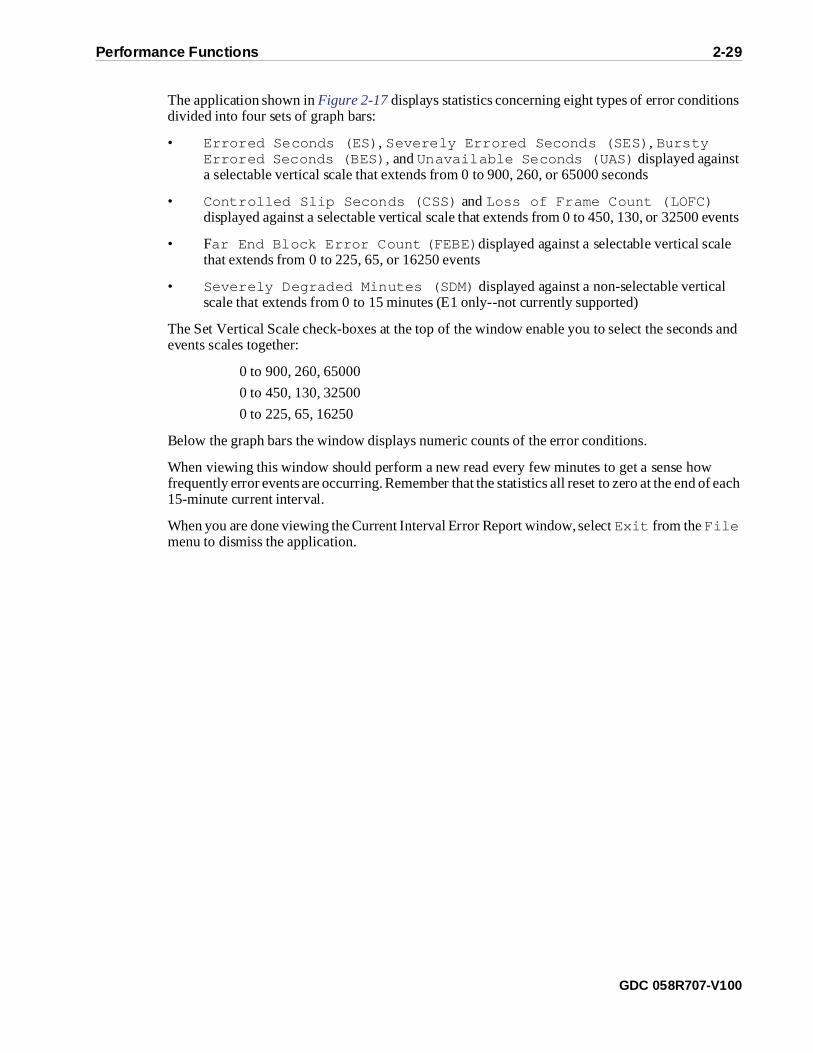
The application shown in Figure 2-17 displays statistics concerning eight types of error conditiodivided into four sets of graph bars:
• Errored Seconds (ES) , Severely Errored Seconds (SES) , Bursty Errored Seconds (BES) , and Unavailable Seconds (UAS) displayed against a selectable vertical scale that extends from 0 to 900, 260, or 65000 seconds
• Controlled Slip Seconds (CSS) and Loss of Frame Count (LOFC) displayed against a selectable vertical scale that extends from 0 to 450, 130, or 32500 events
• Far End Block Error Count (FEBE) displayed against a selectable vertical scalethat extends from 0 to 225, 65, or 16250 events
• Severely Degraded Minutes (SDM) displayed against a non-selectable vertical scale that extends from 0 to 15 minutes (E1 only--not currently supported)
The Set Vertical Scale check-boxes at the top of the window enable you to select the seconevents scales together:
0 to 900, 260, 65000
0 to 450, 130, 32500
0 to 225, 65, 16250
Below the graph bars the window displays numeric counts of the error conditions.
When viewing this window should perform a new read every few minutes to get a sense how frequently error events are occurring. Remember that the statistics all reset to zero at the end of ea15-minute current interval.
When you are done viewing the Current Interval Error Report window, select Exit from the File menu to dismiss the application.
GDC 058R707-V100

2-30 Configuration Functions
ich
Figure 2-17 Current Interval Error Report Window
Configuration Functions
Configure
You can launch the Team 700 Configure application from the HPOV Map Configuration Menu or from the front panel menu.
When you launch the application, it initially displays the Team 700 Configuration window, whhas a File menu and a Navigate menu in its menu bar.
GDC 058R707-V100

Diagnostics 2-31
d
on
m the
l
The File menu contains the selections:
• Refresh , which discards all unsaved changes and restores all options in the displayeconfiguration windows to the values they are assigned by the current operating configuration
• Save to Unit , which puts the new configuration into use by the unit
• Load Template , where you can recall a stored configuration template that you can then save to the unit either with or without modifications
• Save to Template , where you can store the current configuration on the workstation for future use as a template
• Compare to Template , where you can identify differences between the configuratidisplayed on-screen and a selected template
• Exit , where you can dismiss the window.
The Navigate menu enables you to access the read/write windows where you can configure various aspects of DSU operation:
• Network Interface
• DS0/Time Slot Allocation
• Channel Interface
• Alarms Reported
The Team 700 Configure application is fully described in Chapter 3, Configuration.
Maintenance
You can launch the Team 700 Maintenance application from the HPOV Map Configuration Menu or from the front panel menu.
The application displays one read/write window by which you can control some aspects of operation that fall outside the scope of the Configure function. The Team 700 Maintenance application is fully described in Chapter 4, Maintenance.
Diagnostics
You can launch the Team 700 Diagnostics application from the Shelf Map Fault Menu or frofront panel display Select button menu.
The application displays one read/write window by which you can control a variety of test functions on a selected DSU. The Team 700 Diagnostics application is fully described in Chapter 5, Diagnostics.
Miscellaneous Functions
Information
You can launch the Team 700 Information window by clicking on the GDC logo in a front panedisplay (Figure 2-18).
GDC 058R707-V100

2-32 Miscellaneous Functions
re
or
ssion t
Information displays one read-only window that contains the name of the application, softwarevision level information, and copyright information. The File menu in the menu bar contains only the selection Exit , where you can dismiss the window.
Figure 2-18 Team 700 Information Window
Front P anel Poll Rate
You can open the Front Panel Poll Rate window (See Figure 2-19) from the shelf submap Misc Menu . The setting you select in this window determines the initial polling rate for front panel displays each time they are opened.
The rate selection is a global function. It selects initial polling rate for all front panel displays linked to a Team Core application, regardless of which individual application you access it from.
There are four selections, each accompanied by a check-box:
Slow (60 seconds)
Normal (30 seconds)
Fast (15 seconds)
Demand Poll Only (Disable)
The File menu in the menu bar contains two selections: Save to File and Exit .
To set the desired polling rate, first click on the appropriate check-box and then select Save to File from the File menu. Saving to file means that you are setting aside polling instructions or data for future us. The precise polling frequency that results from a setting of Slow , Normal , or Fast depends on a number of factors. The higher the rate, the more communication and processcapacity is devoted to maintaining the display.
The polling rate for an individual front panel display can be changed for the duration of a seby means of the Auto Poll selection in the Select button menu. Changes you make with thamenu selection are not retained when the display is closed.
To dismiss the window, select Exit from the File menu.
GDC 058R707-V100

Miscellaneous Functions 2-33
Figure 2-19 Front Panel Poll Rate Window
Note Pad
You can launch the Note Pad application from the shelf submap Misc Menu . The application opens a shell tool on the workstation running the Team software. You can use the shell tool to run a text editor, mail tool, or any other software that resides on the workstation. The Note Pad application provides this access for keeping records on the system.
GDC 058R707-V100


rough
e.
you
a ed
e t
Chapter 3 Configuration
Introduction
The Team 700 Configuration application enables you to set all the options in an 700 DSU tha convenient group of configuration windows.
You can start the Team 700 Configuration application by either of two methods:
• Select a DSU symbol on the shelf submap in OpenView , then select the Configure option from the Configuration menu.
• Click on the Select button of the Front Panel display, then click on Configuration and select Configure from the resulting menu.
Templates
You can store configuration settings as templates on the workstation that runs the Team 700 application. A template stores a configuration for the unit options, and you can store as many templates as you need.
To load configuration settings from a template into the DSU you must perform the following steps:
1. Select Load Template from the File menu and select the template from the resultingdialog window. The application retrieves the configuration settings of the selected templat
2. Select Save to Unit from the File menu. The application makes the template configuration settings the current operating configuration for the unit.
Configuration Procedure
The following steps describe how to use the configuration application, and illustrate the functions of the Main Configuration window menus.
1. Access the Main Configuration window, either from the submap or from the Front Panel display. The application reads the current main configuration from the unit whenopen the main window.
You can select to base your configuration changes on either the current configuration or stored configuration template. In either case, the unit continues to operate using its unchangcurrent configuration.
The Refresh selection on the main window File menu causes the application to read thcurrent configuration from the unit. All changes to all configuration windows that have nopreviously been saved to the unit or to a template are lost when you select Refresh .
2. To edit the current configuration of the unit, proceed directly to the Navigate menu as described below.
GDC 058R707-V100

3-2 Main Configuration Window
ation
r
. A thout
h
To edit a template, select Load Template from the File menu and select a template from the resulting list.
3. Click on the Navigate button to display a menu of the configuration windows, and select the one in which you intend to make changes.
4. Make changes as needed in the configuration window. When you click on the input field for an option, a window opens to display all the values the field can be set to. Click the mouse on the value you select. When you change the value or setting of an option, the applicdisplays the option name and the new value in white, rather than black, type. They remain white until you either save the changes to the unit or a template by means of the Main window File menu, or restore the option to its last stored value or setting.
You can discard changes to a configuration window and return all its fields to their stored val-ues in two ways:
• Click on the Reset button to discard changes while keeping the window open
• Click on the Cancel button to discard changes and close the window.
You can close a configuration window without losing changes by clicking on either the OK button or the push-pin glyph, which is located in the upper left corner of the window.
You can keep multiple configuration windows open on-screen and move between them byclicking the mouse on the one in which you intend to operate. The main configuration win-dow remains on-screen throughout the configuration process.
5. When you have accessed all the configuration windows that you need to and made all of your changes, click on the File menu button of the Main Configuration window. From that menu you can select Save to Unit to save the new configuration in the unit, oselect Save to Template to save it as a template in the workstation.
6. When you select Save to Unit, the changed configuration becomes the current configuration for the DSU you are configuring.
7. When you select Save to Template , a window appears containing a list of existing templates and a field for entering a new template name. You can select an existing template to be overwritten with the new configuration, or enter a name to create a new templatestored template is available to be loaded by the application and then saved, with or wifurther modification, to any unit of the same type.
Configuration Option Va lues
When you click the mouse on the entry field for a configuration item, a window opens containingall the values that are permitted for that configuration item. Hold down the mouse button until thehighlight is on the value you intend to configure, then release the button. The newly selected valueappears in the entry field for the configuration item.
Main Configuration WindowThe Main Configuration window (Figure 3-1) has two pull down menus, File and Navigate , that are the means by which you carry out the actual process of configuring the selected unit. From the Navigate menu you select the individual configuration windows in whicyou make changes. The File menu commands the storage and retrieval of configuration settings. The contents of the two menus appear below.
GDC 058R707-V100

Main Configuration Window 3-3
.
.
The Main Configuration window title bar displays the application name, Team 700 ConfigurationThe main body of the window has items that point out the selected unit and furnish information about its operations. Below, we have the Team 700 Configuration main window (Figure 3-1) which is launched from the HPOV Shelf Map Configuration Menu. The application is made up ofone main window and a set of transient windows giving you unit optioning, described below
Figure 3-1 Main Configuration Window
Specifically, this main window has four areas:
• Title bar, providing application name
• Menu bar, providing file operations, navigation through subordinate screens, and basic help
• Main body, providing administrative read-only fields
• Status messages, footer area, providing application data on activity and unit interaction
Details of this window (Figure 3-1) follow.
Menu Buttons Menu Selections Description Further Selections
File
Refresh All options are read from the unit and out-standing edits are lost.
Save to Unit All outstanding edits are sent to the unit.
Load Template Allows you to select an existing 700 template to be applied as edits to the current applica-tion. Your next File-->Save to Unit implements the template changes.
dialog window
Save to Template Configuration data is saved as a specific tem-plate.
dialog window
Compare to Template You can select an existing 700 template to be compared with the screen display.
dialog window
Exit Terminates application with outstanding edits discarded first.*
GDC 058R707-V100

3-4 Main Configuration Window
*Note: If the configuration application is exited while pending edits exist on the configuration screens, you are prompted that Pending edits exist, do you want to save or exit without saving the changes?
Navigate
Unit Configuration... Displays the Team 700 Unit Configuration Option window.
TI Options...EI Options...
Displays the Team 700 T1 Option window.E1 Option window.
Alarms Reported... Displays the Team 700Alarms Reported window.
DTE Options... Displays the Team 700 DTE Option window.
RDL Options... Displays the Team 700 RDL Option window.
Add Remote... Displays the Team 700Associated Remote window.
All Screens... Displays all subordinatewindows of the application
Help Displays Help screen.
Menu Buttons Menu Selections Description
Fields(Read-Only)
Name This is the shelf name, identified by slot number and symbol label.
Slot State Gives you the state of the shelf slot, either as Active or Inactive .
Operational Status Shows you the state of the current unit, either as Up or Down.
Serial Number Presents the serial number of the unit.
Firmware Revision Shows latest firmware revision on the unit.
Configuration Mode Tells you if the unit configurable through hardware or software.
Mib Version Shows mib version of the unit.
Alarm Mib Version Displays alarm mib version of the unit.
Note: The Team 700 application relies on the 700 DSU to indicate when a configuration problem has caused an SNMP set error.
Menu Buttons Menu Selections Description Further Selections
GDC 058R707-V100

Unit Options 3-5
n
three es
Unit OptionsThe Team 700 Unit Options window (Figure 3-2) lets you define unit interface characteristics for the unit and assign the DS0s that carry unit data on the T1/E1 line. This screen is presented wheyou choose Navigate-->Unit Configuration on the 700 configuration main window.
Figure 3-2 Team 700 Unit Options Window
Figure 3-2 shows you the window that allows you to configure unit options, such as Unit Type and Number of Loops with LTU and Two-Loop as defaults for this application. Name is a read-only field on this and appears with the same designation on all other subordinate screens.
T1 InterfaceThis screen (Figure 3-3) is shown when Navigate->T1 Options is selected on the 700 Configuration main window and lets you configure with T1 options. The screen is divided into functional areas: Name, T1 Options , and action buttons. In the descriptions below, default valuare in bold typeface.
Unit Options Description
Unit Type Indicates whether the unit is an LTU (Line Terminating Unit) or NTU (Networking Terminating Unit)
Number of Loops
Selects the number of loops in service.
Data Type Tells you whether the unit is for Data Only or Voice . This field is read-only.
ActionButtons
OK Dismisses the windows with edits retained. Same function as the mouse click-on, pin-pull.
Reset Undoes pending edits since last the File-->Save to Unit .
Cancel Same as Reset , it dismisses the screen.
GDC 058R707-V100

3-6 T1 Interface
Figure 3-3 Team 700 T1 Interface Options Window
Name: This is the shelf name, identified by slot number and symbol label.
T1 Options Description
Line Code AMI: Alternate Mark Inversion, or B8ZS: Bit 8 Zero Suppression
Frame Mode ESF ANSI, ESF 54016, SF, or Unframed
TX Clock Mode Selects the timing of the unit. Loop, Internal, or External
TX Pre-Equalization Length of pre-equalization required for the T1 cable when operating as a DSX-1 inter-face: 0-133ft, 133-266ft, 266-399ft, 399-533ft, or 533-655ft.
Inband Loopback Type
Selects the desired loopback when receiving inband loop-up code. It can be Inhibit, Line Loopback, or Payload Loopback.
Interface type Type is either DSX-1 or DS-1; defaults are SC701-DSX; DC721 - DS-1.
TX Line Buildout Line buildout required for the T1 cable when operating as a DS-1 interface: 0, -7.5dB, -15dB, or -22.0dB
AIS Loopdown This is the time required for an all ones (1s) pattern to deactivate an inband loop-back. Time can be Inhibit , 5, 10, 20, 40, or 60 secs
Note: There are some gray rules attached to the T1 options screen:
1. If the product is a 701T2, then Interface Type can be only DSX-1, therefore, the Interface Type and Tx Line Buildout selections are grayed out.
2. If the product is a DC721T2, then the Interface Type can be DSX-1 or DS-1 . If optioned as DSX-1, then Tx Pre-Equalization is used and Tx Line Buildout is grayed out. If optioned as DS-1 , then Tx Line Buildout is used and Tx Pre-Equalization is grayed out.
3. On Units 701T2 and DC721T2, if Framing Mode is selected as Unframed or SF, then FDL Mode is disabled and grayed out.
4. If Loop Provision is Multipoint, then DTE Rate is disabled.
5. For the 731D2, DTE Rate is 1-24 DS0s.
GDC 058R707-V100

E1 Options 3-7
E1 OptionsThis screen is shown when Navigate->E1 Options is selected on the 700 Configuration main window (Figure 3-4). This screen allows configuration of E1 options. The screen is divided into three functional areas - Name, E1 Options , and action button area. In the descriptions below, default values are in bold typeface.
Figure 3-4 Team 700 E1 Options Window
Action Buttons Description
OK Dismisses the windows with edits retained. Same function as the mouse click-on, pin-pull.
Reset Undoes pending edits since last the File-->Save to Unit .
Cancel Same as Reset , it dismisses the screen.
Unit Options Description
Line Code Indicates whether the current line code is AMI (Alternate Mark Inversion) or HDB3.
Frame Mode Indicates the framing mode: Framed, where unit expects a framed E1 signal and processes the E1 data stream accordingly; unframed, where the unit transfers the E1 signal on a bit-by-bit basis.
Line Unit Indicates whether the unit is a TLU (Terminating Line Unit) or ILU (Intermediate Line Unit.)
Action Buttons
OK Dismisses the windows with edits retained. Same function as the mouse click-on, pin-pull.
Reset Undoes pending edits since last the File-->Save to Unit .
Cancel Same as Reset , it dismisses the screen.
GDC 058R707-V100

3-8 Alarms Rep orted
d.
Alarms ReportedThe Team 700 Alarms Reported window (Figure 3-5) lets you designate the alarms that are to be masked (not reported) or unmasked (reported). This screen is shown when Navigate->Alarms Reported is selected on the 700 Configuration main window. This screen lets you configure alarm reporting. But note that unit default values for all alarm masks are not reporte
Figure 3-5 Team 700 Alarms Reported Window
GDC 058R707-V100

Alarms Rep orted 3-9
ch
onds
-
T1/E1 Alarms Description
Loss of Signal Occurs when the unit detects an absence of network signal. Absence ofsignal for a time equivalent to 175 bits (± 75) is considered no signal.
Out of Frame (T1)
Loss of FrameAlignment (E1)
Occurs when the unit misses two out of four framing bits in the signal coming from the network. The count for this alarm increments by one eatime framing is lost, regardless of the number of frames affected.
All Ones An unframed, all ones signal
Unavailable Signal State Occurs in response to 10 consecutive severely errored seconds. The stateis considered cleared when the unit has processed 10 consecutive secof data without a severely errored second.
Errored Seconds Seconds with a least one CRC error event
Remote Loss of Signal Reception of remote loss-of-T1 signal report via the 700 interface
Remote Alarm Indication Reception of remote alarm indication signal on the T1 interface
Loop Alarms
Loss of Signal Occurs when the unit detects an absence of network signal. Absence ofsignal for a time equivalent to 175 bits (± 75) is considered no signal.
Unavailable Signal State Occurs in response to 10 consecutive severely errored seconds. The state is con-sidered cleared when the unit has processed 10 consecutive seconds of data without a severely errored second.
Loss of Sync Word Loss of synchronization word on the corresponding loop.
Errored Seconds Errored second is defined as a second with a least one CRC error event.
Major BER Incoming 700 bit error rate exceeds selected major alarm threshold.
Minor BER Incoming 700 bit error rate exceeds selected minor alarm threshold.
Threshold Values forDetermining Major/Minor
Alarms
1E-04 1 x 10-4 bit error rate, threshold = 1 x 10⁻⁴, i.e.,
bit error rate exceeds 1 x 10⁻⁴--maj/min alarm declared
1E-05 1 x 10-5bit error rate, threshold = 1 x 10⁻⁵, i.e.,bit error rate exceeds 1 x 10⁻⁵--maj/min alarm declared
1E-06 1 x 10-6 bit error rate, threshold = 1 x 10⁻⁶, i.e.,bit error rate exceeds 1 x 10⁻⁶--maj/min alarm declared
1E-07 1 x 10-7 bit error rate, threshold = 1 x 10⁻⁷, i.e.,
bit error rate exceeds 1 x 10⁻⁷--maj/min alarm declared
GDC 058R707-V100

3-10 DTE Options
e
DTE Options
This screen is shown when Navigate->DTE Options is selected on the 700 Configuration main window (Figure 3-6). This screen allows configuration of DTE options. The screen is divided into three functional areas: Name, DTE Options , and action button area. In the descriptions below, default values are in bold typeface. Name is a read-only field on this and appears with thsame designation on all other subordinate screens.
Figure 3-6 Team 700 DTE Options Window
1E-08 1 x 10-8 bit error rate, threshold = 1 x 10⁻⁸, i.e.,
bit error rate exceeds 1 x 10⁻⁸--maj/min alarm declared
Action Buttons
OK Dismisses the windows with edits retained. Same function as the mouse click-on,pin-pull.
Reset Undoes pending edits since last the File-->Save to Unit .
Cancel Same as Reset , it dismisses the screen.
The DTE configuration is applicable on the DC730D1, DC730D2, DC731D2and SC710D2.
Unit Options Description
TX Clock Mode
Internal: The transmit clock is derived from the internal clock oscillator of the 700 module.External: The DCE interface uses its external clock provided by the customer’s DTE.Looped: The transmit clock is locked to the receive clock and is developed from the incoming timing of the remote unit.
CTS Mode Forced On: CTS is on as long as the 700 module is powered and operates normally.Normal: The CTS line tracks the state of the RTS line.
DTE Rate 731-D2: 1 - 24 DS0s (One loop max. is 12 DS0s)If # of LOOPS = 1 , DTE RATE = 1-12 . If # of LOOPS = 2 , DTE RATE = 1-24 .
730-D1/D2: 1 - 32 timeslots (One loop max. is 18 timeslots)If # of LOOPS = 1 , DTE RATE = 1-18 . If # of LOOPS = 2 , DTE RATE = 1-32 .
NOTE
GDC 058R707-V100

RDL Options 3-11
ed
RDL Options
This screen is shown when Navigate->RDL Options is selected on the 700 Configuration main window (Figure 3-7). This screen allows configuration of RDL options. The screen is dividinto three functional areas - Name, RDL Options , and action button area. In the descriptions below, default values are in bold typeface.
Figure 3-7 Team 700 RDL Options Window
Action Buttons
OK Dismisses the windows with edits retained. Same function as the mouse click-on, pin-pull.
Reset Undoes pending edits since last the File-->Save to Unit .
Cancel Same as Reset , it dismisses the screen.
The RDL configuration is only applicable on the DC730D1, DC730D2, DC731D2, and SC710D2.
Unit Options Description
V.54 Remote Loop Enable: Unit detects and responds to inband V.54 protocol.Disable: Unit does not respond to inband V.54 protocol.
Front Panel (F/P)Remote Loop Mode
EOC: Causes the unit to send a loopback command to the remote 700 unit.V.54: Initiates the V.54 protocol toward the 700 side of the unit.
RDL Timeout None: No loopback timeout.10 minutes: Once the loop is enabled, V.54 loopbacks are automatically terminated after ten minutes.
Unit Options Description
NOTE
GDC 058R707-V100
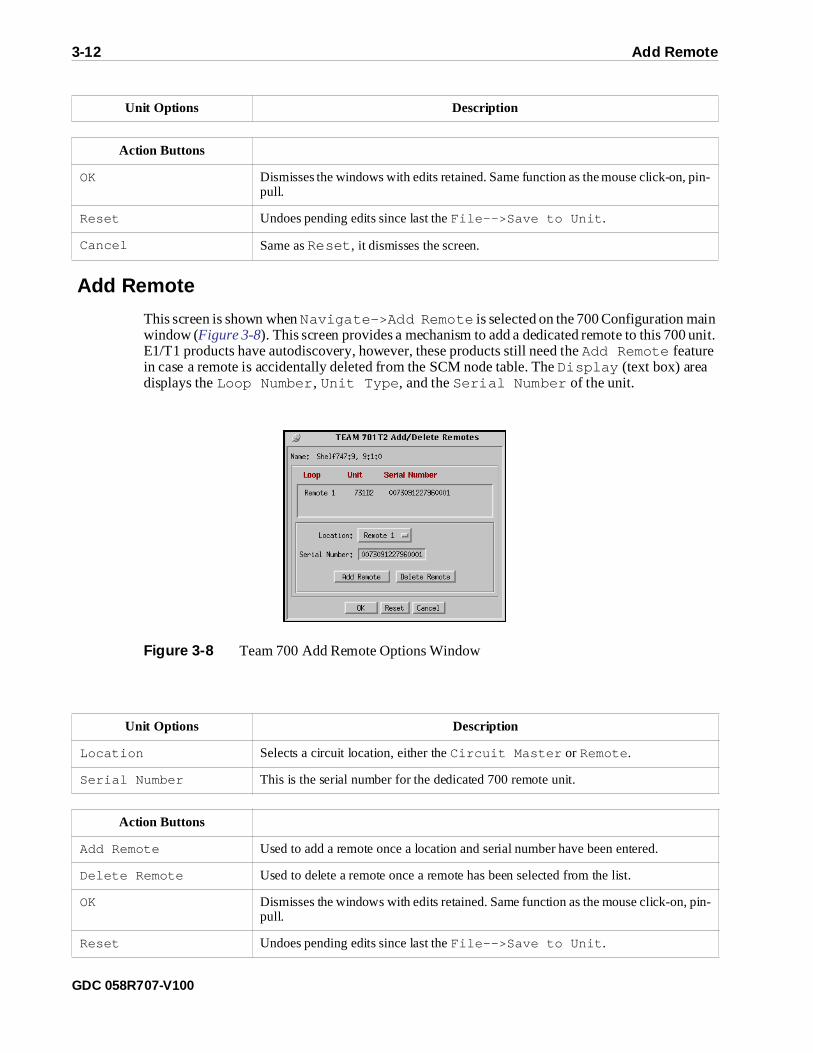
3-12 Add Remote
unit.
-
Add R emote
This screen is shown when Navigate->Add Remote is selected on the 700 Configuration main window (Figure 3-8). This screen provides a mechanism to add a dedicated remote to this 700E1/T1 products have autodiscovery, however, these products still need the Add Remote feature in case a remote is accidentally deleted from the SCM node table. The Display (text box) area displays the Loop Number , Unit Type , and the Serial Number of the unit.
Figure 3-8 Team 700 Add Remote Options Window
Action Buttons
OK Dismisses the windows with edits retained. Same function as the mouse click-on, pin-pull.
Reset Undoes pending edits since last the File-->Save to Unit .
Cancel Same as Reset , it dismisses the screen.
Unit Options Description
Location Selects a circuit location, either the Circuit Master or Remote .
Serial Number This is the serial number for the dedicated 700 remote unit.
Action Buttons
Add Remote Used to add a remote once a location and serial number have been entered.
Delete Remote Used to delete a remote once a remote has been selected from the list.
OK Dismisses the windows with edits retained. Same function as the mouse click-on, pinpull.
Reset Undoes pending edits since last the File-->Save to Unit .
Unit Options Description
GDC 058R707-V100

Circuit Configuration 3-13
Circuit ConfigurationThis screen is shown when Configuration->Circuit Configuration is selected on the Shelf Map menu or from the front panel select button (Figure 3-9). This screen allows configurationof timeslots or DS0s. The screen is divided into three functional areas - Name, Remote Status, Channel Mapping , and action button area.
Figure 3-9 Team 700 Circuit Configuration Options Window
Cancel Same as Reset , it dismisses the screen.
Unit Options Description
GDC 058R707-V100

3-14 Circuit Configuration
Menu Bar Description
Remote Status
The status box on the top with reading Loop Unit Serial Number shows the re-motes currently connected on the loops of the master unit and actively communicat-ing.
File-->Refresh
Fetches the information from unit and refreshes the screen.
File-->Save to Unit
Saves the new settings to the master and remotes.
File-->Exit
Exits from the application.
Unit Options Description
Time Slots, Loop Shows the DS0 allocation. Indicates the loop to where a DS0 is allocated.
Loop Number One (1), Two (2), or Three (3)
Number of Time Slots Maximum for T1 units only is 24--a maximum of 12 for one loop.Maximum for E1 units only is 32--a maximum of 18 for one loop.
Loop Provision Point-to-point or point-to-multipoint
Note: The gray rule is: When in point-to-point configuration, Loop Number and Number of Time Slots are grayed out with Loop Provision showing the point-to-point selection, with 12 time slots allocated per loop.
GDC 058R707-V100
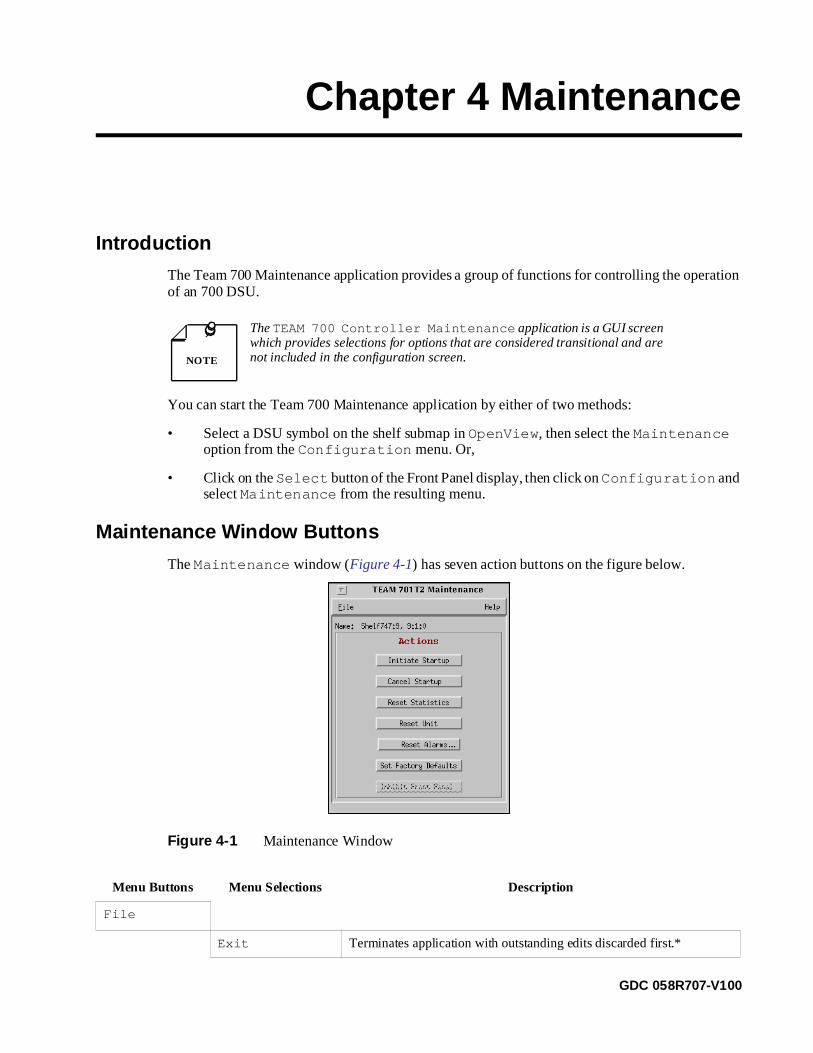
Chapter 4 Maintenance
Introduction
The Team 700 Maintenance application provides a group of functions for controlling the operation of an 700 DSU.
You can start the Team 700 Maintenance application by either of two methods:
• Select a DSU symbol on the shelf submap in OpenView , then select the Maintenance option from the Configuration menu. Or,
• Click on the Select button of the Front Panel display, then click on Configuration and select Maintenance from the resulting menu.
Maintenance Window Buttons
The Maintenance window (Figure 4-1) has seven action buttons on the figure below.
Figure 4-1 Maintenance Window
The TEAM 700 Controller Maintenance application is a GUI screen which provides selections for options that are considered transitional and are not included in the configuration screen.
Menu Buttons Menu Selections Description
File
Exit Terminates application with outstanding edits discarded first.*
NOTE
GDC 058R707-V100

4-2 Maintenance Window Buttons
te.
.
Reset Alarms Button
Featured in Figure 4-2 is the window for the TEAM 700 Maintenance Reset Alarms .
Figure 4-2 Maintenance: Reset Alarms Window
Menu
Action Buttons Description
Initiate Startup Initiates 700 start-up handshake. Data disrupted until handshake is comple
Cancel Startup Terminates the start-up sequence on the unit.
Reset Statistics Resets all statistics to zero for that unit.
Reset Unit Starts a board reset and disrupts data transfer.
Reset Alarms... Resets major and minor BER threshold alarms. See Figure 4-2 under Reset Alarms Button.
Set Factory Defaults Causes all options in the unit to return to their factory default settingsWhen you click on this button, the application displays a warning:Resetting to factory defaults will disrupt com-munications to the unit. Do you want to contin-ue? Continue or Cancel .
Enable/Inhibit Front Panel Enables or inhibits front panel push-buttons.
*Note: The front panel shows either Enable Front Panel or Inhibit Front Panel on the face of the button based on the current status of the front panel fetched from the unit. It is not supported for the 701-T2, which is grayed-out.
Reset Alarms button is grayed-out for T1 products. Loops 2 and 3 are grayed-out if only one loop is available on the unit. Loop 3 is grayed-out if only two loops are available on the unit.NOTE
GDC 058R707-V100

Maintenance Window Buttons 4-3
Action Buttons Description
OK Activates selections and dismisses the window.
Cancel Dismisses the screen.
GDC 058R707-V100

you
ry,
ile
status
Chapter 5 Diagnostics
OverviewThe Diagnose menu provides access to the Team 700 Diagnostic screen, which provides the command and results display functions for all tests you can perform on the DSU by means of the TEAM application. The diagnostics window displays the results of the most recent test until begin another one. 700 Diagnostics is launched from the Shelf Map Fault Menu . The application is made up of one main window and a transient window, giving you testing histowhich is called the Diagnostics History screen. It is accessible from the main Diagnostics window and displays the results of all tests performed during the current session.
The tests you can do from the Diagnostics window divided in two categories: Master Tests and Master-Remote Tests . When using the diagnostic functions you should have the 700 DSU Installation and Operation Manual available as a reference.
Diagnostics WindowThe Diagnostics window (Figure 5-1) is broken down into different areas. The menu has foperations, navigation through subordinate screens, and basic help, identified as File , Navigate , and Help. The only selection in the file menu is Exit for dismissing the application.The only selection in the Navigate menu is History , which causes the application to display the Diagnostics History window (Figure 5-1) holding the results of all tests done during thecurrent session.
Diagnostic test fields, test control buttons, graphic displays (test diagrams), test results, andmessages make up the main part of the window. Status reports or messages give the viewer up-to-date data on the application.
The Self Test pattern internal to the 700 units is always a 215 pattern.
NOTE
GDC 058R707-V100

5-2 Diagnostics Window
Figure 5-1 Team 700 Diagnostics Window
Menu Buttons Menu Selections Description
File
Exit Terminates application.
Navigate
History... Displays the 700 DiagnosticsHistory window
Help Displays Help screen.
GDC 058R707-V100

Diagnostics Window 5-3
-
, al
700
ce.
s-
is
c
Menu Buttons Menu Selections Description
Fields
Name This is the shelf name, identified by slot number and symbol label (readonly).
Master Tests
None No master test selected.
E1 Line Loopback
T1 Line Loopback
When the E1 (T1) line loopback is connected, the data signal received from the local E1 (T1) interface is returned to the transmit line interface; the framing portion of the T1 interface is regenerated by the unit. Thereforeduring normal operation the local equipment should receive its own signwithout errors. Local transmit signal is sent to the remote 700 system, how-ever, the signal received from the remote 700 system is lost. Line loopback is generally used to test connections between local equipment and the system module.
E1 Line Loopback applies only to E1 units and T1 line loopback applies only to T1 units.
T1 Payload Loop-back
The data portion (payload) of the T1 interface is returned to the data portion of the T1 transmit; the framing portion of the T1 interface is regenerated bythe unit.
ChannelLoopback
Activates a DTE loopback at the DTE interface of the master unit. Applies only if neither an E1 unit nor a T1 unit (for SC710D2 only).
Master-Remote Tests
Pertains to All = E1, T1, and DTE; or just DTE.
Select Remote Selects the remote number to be used for the test.
None No master-remote test selected.
Local Self Test (All) Activates the test pattern generator and checker in the local (master) unit. The test pattern is transmitted onto the 700 link, then checked for errors when it is received back. The user is responsible for establishing the loop-back - either physical or electronic - that returns the test pattern to its sour
Master to Remote Self Test
(All) Activates test pattern generators and checkers in both the mater unit and the selected remote unit. Each unit receives the test pat-tern transmitted by the other over the 700 link and checks it for errors.
Remote to Remote Self Test
(All) Activates the test pattern generator and checker in the selected remote unit, which then transmits its test pattern to the master unit in order for thtest to provide useful results it must also be commanded in a second remote unit: the one the first remote communicates with on the far side of the publinetwork. Once both remotes have been commanded to perform this test, each receives the test pattern transmitted by the other and checks it for er-rors.
GDC 058R707-V100

5-4 Diagnostics Window
ut ct-lost.
RemoteLoopback
(All) When the remote line loopback is connected, the data received by the remote module from the local is returned by the 700 system module on thereceive path, within the remote’s equipment interface. Therefore, duringnormal operation the local equipment should receive its own signal withoerrors. The local transmit signal is passed to the remote equipment conneed to the 700 system, however, the signal transmitted by the remote is
Remote line loopback is generally used to test the proper operation of the 700 link end-to-end, and therefore should be used after normal operation is obtained while the remote 700 loopback is connected.
Self Test with Re-mote Loopback
(All) Activates the test pattern generator and checker in the master unit and places the selected remote in Line Loopback.
Local Loopback (DTE) Applies only to the 710 (channel loopback on remote unit), which is not supported.
Self Test withLocal Loopback
(DTE) Applies only to the 710 (channel loopback on remote unit), which is not supported.
Test Buttons Description
Start Test Pressing this button starts the test selected in the menus.
Stop Test Pressing the button sends commands to stop all tests running in the unit.
Reset Mas-ter’s Bit Errors
This button enables you to reset the Bit Errors on the master unit individually.
Reset Re-mote’s Bit Errors
This button enables you to reset the Bit Errors on the remote unit individually.
GraphicalDisplay Area
This area contains a graphical representation of the selected 700 and its interface to the shelf and network. Arrows show the current data paths and are changed to show the loopback paths selected for each test.
Menu Buttons Menu Selections Description
GDC 058R707-V100

Test Instructions 5-5
te-site
Test InstructionsDo the following steps to carry out test:
1. If you are going to perform Line Loopback or Payload Loopback test make the nec-essary arrangements with the remote site. Arrangements may involve contacting remopersonnel or network management control of the remote DSU. You might have to arrange for loopback initiation or test signal generation, coordinating with a Line or Payload Loopback .
2. Select the test to be done by clicking on the check box to the left of its name.
3. Click on the Start Test button. The data path display panel exhibits the path for the test you have selected, the Test Status field changes from Idle to the test name.
4. If you are running a Self Test , the Reset Bit Errors button is available while the testruns. The reset button returns the error count to zero. The Stop Test button is available during any test.
While running a test, the application displays the results in the Test Results window area.
Test Results Description
Test Status Displays test currently running or idle.
Test Interval Displays test intervals for any given test.
Status Used for BER test to shown In-Sync or Out-of-Sync . Results are displayed until the be-ginning of the next test.
Bit Error Rate Displays the bit error rate for any self test.
Bit Errors Displays the bit error for any self test.
Status Message Area
The status message area presents messages which advise you application activity and unit inter-action. Examples might be: waiting for response form unit, initialization messages, and commu-nication errors.
The Team 700 application polls the DSU every 35 seconds while the Di-agnostics window is open. In order to reduce unnecessary LAN traffic, the Diagnostics window should be closed when it is not in use. NOTE
GDC 058R707-V100

5-6 Test Instructions
o you
700 Diagnostics History
You see the diagnostics history when you choose Navigate->History on the 700 Diagnostics main window. Results of diagnostics tests for a current session are shown t(Figure 5-2).
Figure 5-2 Team 700 Diagnostics Window
Fields (Read-Only) Description
Name Shelf name
Start Time Date and time the test started
Test The specific test done
Remote Particular remote unit being tested
Test Time Total time elapsed since the test started
Test Interval (Master and Remote) Displays test interval for any given test.
Status (Master and Remote) Tells you if the units are in-sync or not in-sync.
Bit Error Rate (Master and Remote) Displays the bit error rate for any self test.
Bit Errors (Master and Remote) Displays the bit errors for any self test.
Note: The history of tests which are performed during a single session of diagnostics are cap-tured in a scroll box. Information is lost when diagnostic application is exited.
Action Buttons
OK Dismisses the screen.
GDC 058R707-V100

Index
Numerics
700 Front Panel Series700-G2, 700-G3, 702-G2, 710-D2, or 701-T2 2 -
5721-T2, 731-D2, 730-D1, 730-D2, 720-G1, or
720-G2 2 - 4700 Unit Capabilities 1 - 2700-Managed Unit 1 - 2
A
Accessing HDSL Application 2 - 1Accessing Team HDSL 1 - 2Add Remote 3 - 12Alarm Detail Window (700 G3, 702 G2, 710 D2, and
720 G1) 2 - 10Alarm Detail Window (701 T2, 721 T2, 731 D2, and
700 G2) 2 - 9Alarms 2 - 9Alarms Reported 3 - 8
B
Basic Design 1 - 1Bursty Errored Seconds Display Screen 2 - 19
C
Circuit Configuration 3 - 13Common Window Features 2 - 8Configuration 2 - 1Configuration Functions 2 - 30Configuration Option Values 3 - 2Configuration Procedure 3 - 1Configure 2 - 30Controlled Slip Seconds Display Screen 2 - 22Current Interval Reports 2 - 28
D
Design 1 - 1Diagnostics 2 - 31Diagnostics Window 5 - 1DTE Options 3 - 10
E
E1 Options 3 - 7E1 Tests 5 - 6Error Reports Window Menus 2 - 15Errored Seconds Display Screen 2 - 16Errors 2 - 27Errors Display Screen 2 - 27Exit 2 - 7
F
Far End Block Errors Display Screen 2 - 25Fault 2 - 2Front Panel Poll Rate 2 - 32
G
GDC Logo 2 - 7
H
HDSL Diagnostics History 5 - 6HDSL Front Panel 2 - 3HDSL-Managed Units under UNIX 1 - 1
I
Information 2 - 31Introduction 3 - 1, 4 - 1
L
LEDs of the Front Panels 2 - 5Loss 2 - 23Loss of Frame Count Display Screen 2 - 23
M
Main Configuration Window 3 - 2Maintenance 2 - 31Maintenance Window Buttons 4 - 1Map Window Menu Bar Access 2 - 2Misc 2 - 2Miscellaneous Functions 2 - 31
GDC 058R707-V100
In--2 Index
N
Note Pad 2 - 33
O
Overview 1 - 1, 5 - 1
P
Performance 2 - 1
Performance Functions 2 - 9
Polling 2 - 7
R
RDL Options 3 - 11
Reports 2 - 14
Reset Alarms Button 4 - 2
S
Select Menu 2 - 6
Selectable Alarm Detail Window Items 2 - 12
Severely Degraded Minutes Display Screen (E1Only) 2 - 26
Severely Errored Seconds Display Screen 2 - 17
SpectraComm Manager Card and 700-ManagedUnits 1 - 2
Status 2 - 13
Status Window Menu 2 - 13
T
T1 Interface 3 - 5
Team 700 E1 Options Window 3 - 7
Templates 3 - 1
Test Instructions 5 - 5
Theory of Operation 1 - 1
To Start Team HDSL for Unix Maintenance 4 - 1
U
Unavailable Seconds Display Screen 2 - 20
Unit Capabilities 1 - 2
Unit Options 3 - 5
GDC 058R707-V100


General DataComm


