4/20/2016 eCYBERMISSION Advisor Section http://www.ecybermission.com/Advisor/ViewMissionFolder_ReadOnly_ED/13175 1/5 Team Advisors HOME ABOUT MEDIA ROOM RESOURCES HELP NEWS Hello, Haruna Cofer Advisor Home My Info Logout BACK TO HOME Mission Folder : View Mission for 'StyroFilter' State Ohio Grade 8th Mission Challenge Environment Method Engineering Design Process Students Lemonhead AlmondJoy Jujube NestleCrunch Team Collaboration (1) Describe the plan your team used to complete your Mission Folder. Be sure to explain the role of each team member and how you shared and assigned responsibilities. Describe your team’s process to ensure that assignments were completed on time and deadlines were met. Our team has 4 members: Jujube, Lemonhead, AlmondJoy, and NestleCrunch. We have been meeting about 4 hours a week since August 2015 in order to make sure that we had enough time to design, test and analyze our idea. In order to complete our Mission Folder, we divided the work evenly, but we did have specific areas of focus based on our strengths: 1. Jujube led our testing when we tested StyroFilter on dirty water. She also led the development and construction of our prototype filter with our activated carbon derived from Styrofoam. 2. Lemonhead led the communication with experts. He set up meetings with them to discuss our project, and worked with Battelle for various aspects of testing and analysis. 3. NestleCrunch led our research in books, journal articles, and websites. She also coordinated all of our findings in Google Docs and was the main editor of the Mission Folder. 4. AlmondJoy led our experiments by melting down polystyrene and carbonizing it many times. He also led experiments to activate our carbon samples in our attempt to achieve high surface area. To make sure that the project tasks were completed on time, we posted each team member’s assignments and deadlines on a shared Google Doc. We always made sure to encourage each other to stay focused and on track. We also used Google Docs to record our research and to work on the Mission Folder outside of meetings. This way, if team members could not make it to a meeting, they could still work on the project from home and see the team’s progress (see attached Task Schedule). After working together to create and test our solution, we divided up the questions to complete each part of the Mission Folder. Uploaded Files: • [ View ] Task Schedule (By: Advisor, 02/29/2016, .pdf) Weekly team schedule for completing the Mission Folder Engineering Design Problem Statement (1) What problem in your community did your team try to solve? Why is this problem important to your community? The problem in our community that we tried to solve was the overwhelming amount of Styrofoam, or expanded polystyrene, that is discarded as trash. We found that every year in the US alone, 1.9 billion pounds of Styrofoam is thrown away, filling up a staggering 30% of landfills (Figure 1). This problem is also prevalent throughout the world, as it accumulates in the oceans and beaches (Figure 2). Much of the Styrofoam waste (1.7 billion pounds) is from packaging, plates,and over 25 billion Styrofoam cups. It costs a staggering $42 million annually to add all of this waste to landfills in the US. Furthermore, Styrofoam takes thousands of years to degrade. It is discarded in such high quantities because it is cheaper to produce new polystyrene than it is to collect, transport, and process material for recycling. Styrofoam is also very difficult to recycle because of its toxicity. The fumes released when Styrofoam is reprocessed are hazardous, and few places will accept Styrofoam without discarding it directly into landfills. This problem is important to our community because there are no Styrofoam recycling facilities in our state. When we toured our local recycling facility, we were surprised that this recycling company, along with most facilities throughout the country, took no effort to do anything with the Styrofoam except send it on to the landfill. This means that our community does not even attempt to recycle Styrofoam, resulting in more and more landfill volume being consumed. So we asked ourselves, “Is it possible to transform an environmental PROBLEM into an environmental SOLUTION?” And the answer was YES! (2) List at least 10 resources you used to complete your research (e.g., websites, professional journals, periodicals, subject matter experts).
HOME ABOUT MEDIA ROOM RESOURCES HELP NEWSHello, Haruna CoferAdvisor Home My Info Logout
BACK TO HOME
Mission Folder: View Mission for 'StyroFilter'
State Ohio
Grade 8th
Mission Challenge Environment
Method Engineering Design Process
Students
Lemonhead AlmondJoy Jujube NestleCrunch
Team Collaboration(1) Describe the plan your team used to complete your Mission Folder. Be sure to explain the role of each team member and how you shared and assignedresponsibilities. Describe your team’s process to ensure that assignments were completed on time and deadlines were met.
Our team has 4 members: Jujube, Lemonhead, AlmondJoy, and NestleCrunch. We have been meeting about 4 hours a week since August 2015 in order to make sure thatwe had enough time to design, test and analyze our idea. In order to complete our Mission Folder, we divided the work evenly, but we did have specific areas of focusbased on our strengths:
1. Jujube led our testing when we tested StyroFilter on dirty water. She also led the development and construction of our prototype filter with our activated carbon derivedfrom Styrofoam.
2. Lemonhead led the communication with experts. He set up meetings with them to discuss our project, and worked with Battelle for various aspects of testing andanalysis.
3. NestleCrunch led our research in books, journal articles, and websites. She also coordinated all of our findings in Google Docs and was the main editor of the MissionFolder.
4. AlmondJoy led our experiments by melting down polystyrene and carbonizing it many times. He also led experiments to activate our carbon samples in our attempt toachieve high surface area.
To make sure that the project tasks were completed on time, we posted each team member’s assignments and deadlines on a shared Google Doc. We always made sureto encourage each other to stay focused and on track. We also used Google Docs to record our research and to work on the Mission Folder outside of meetings. This way,if team members could not make it to a meeting, they could still work on the project from home and see the team’s progress (see attached Task Schedule). After workingtogether to create and test our solution, we divided up the questions to complete each part of the Mission Folder.
Weekly team schedule for completing the Mission Folder
Engineering Design
Problem Statement
(1) What problem in your community did your team try to solve? Why is this problem important to your community?
The problem in our community that we tried to solve was the overwhelming amount of Styrofoam, or expanded polystyrene, that is discarded as trash. We found that everyyear in the US alone, 1.9 billion pounds of Styrofoam is thrown away, filling up a staggering 30% of landfills (Figure 1). This problem is also prevalent throughout the world,as it accumulates in the oceans and beaches (Figure 2). Much of the Styrofoam waste (1.7 billion pounds) is from packaging, plates,and over 25 billion Styrofoam cups. Itcosts a staggering $42 million annually to add all of this waste to landfills in the US. Furthermore, Styrofoam takes thousands of years to degrade. It is discarded in suchhigh quantities because it is cheaper to produce new polystyrene than it is to collect, transport, and process material for recycling. Styrofoam is also very difficult to recyclebecause of its toxicity. The fumes released when Styrofoam is reprocessed are hazardous, and few places will accept Styrofoam without discarding it directly into landfills.
This problem is important to our community because there are no Styrofoam recycling facilities in our state. When we toured our local recycling facility, we were surprisedthat this recycling company, along with most facilities throughout the country, took no effort to do anything with the Styrofoam except send it on to the landfill. This meansthat our community does not even attempt to recycle Styrofoam, resulting in more and more landfill volume being consumed. So we asked ourselves, “Is it possible totransform an environmental PROBLEM into an environmental SOLUTION?” And the answer was YES!
(2) List at least 10 resources you used to complete your research (e.g., websites, professional journals, periodicals, subject matter experts).
Birbas, Daniella. Preparation of Activated Carbon: Forest Residues Activated with Phosphoric Acid and Zinc Sulfate. Thesis. Royal Institute of Technology of StockholmSweden, 2011.
Tan, I. A., A. L. Ahmad, and B. H. Hameed. “Preparation of activated carbon from coconut husk.” Journal of Hazardous Materials, 2008.
Toles, Christopher, Sue Rimmer, and James Hower. “Production of Activated Carbons from a Washington Lignite Using Phosphoric Acid Activation.” Carbon, 1996.
Volperts, Aleksandrs. “Synthesis and Application of Nanoporous Activated Carbon in Supercapacitors.” Material Science and Applied Chemistry 2015.
Yakout, S.M. “Characterization of Activated Carbon Prepared by Phosphoric Acid.” Arabian Journal of Chemistry, 2012.
Kiger, Patrick J. “10 Innovations in Water Purification.” HowStuffWorks. HowStuffWorks.com, n.d. Web. 12 Sept. 2015.http://science.howstuffworks.com/environmental/greentech/sustainable/10innovationswaterpurification.htm.
Reference books:
Connett, Paul. The Zero Waste Solution: Untrashing the Planet One Community at a Time. White River Junction: Chelsea Green Publishing, 2013.
Feed, Eric Corey, and Kevin Daum. Green $ense for the home : Rating the Real Payoff from 50 Green Home Projects. Newton: Taunton Press, 2010.
Mulder, Michelle. Trash Talk: Moving Toward a ZeroWaste World. Victoria: Orca Book Publishers, 2015.
Szaky, Tom. Make Garbage Great : The TerraCycle Family Guide to a ZeroWaste Lifestyle. New York: HarperCollins Publishers, 2015.
Szaky, Tom. Outsmart waste : The Modern Idea of Garbage and How to Think Our Way Out of It. San Francisco: BerrettKoehler Publishers, Inc., 2014.
Through journal articles, reference books, internet searches, and interviews with experts, we found interesting and intriguing information about Styrofoam: both how it ismade and how it is used. Because Styrofoam waste is a major problem in the US almost 2 billion pounds are thrown away every year and responsible for almost 30% ofspace in landfills we decided to research existing solutions for reusing or recycling Styrofoam.
We found several existing solutions. However, none of them were viable or cost effective. One solution is called Styrocrete, which is made by mixing new Styrofoam beadswith cement to make a lightweight concrete (Figure 3). The value and use of Styrocrete is unfortunately quite limited because it has low compressive strength and atendency to crack and break. Therefore, the opportunity to regrind and use waste Styrofoam in concrete is generally limited to nonstructural decorative applications.
Another existing solution is the reprocessing or reuse of polystyrene (Figure 3). This procedure can turn the used Styrofoam back into polystyrene pellets. However, thecollection and processing for recycling Styrofoam is very expensive and there are no means of automated separation. Moreover, the value of reprocessed polystyrene islow because of the danger of contaminants which cannot be avoided. In general, manufacturers prefer to use virgin or new polystyrene because of its extremely low cost(less than $1/kg).
Recently, researchers have discovered a mealworm that eats polystyrene (Figure 3). While the concept is very exciting, this process is extremely slow, with each wormeating only about 3.6mg of Styrofoam per day. Given the time and number of worms needed, this idea appears to be too inefficient to tackle the nearly 2 billion pounds ofStyrofoam that accumulate each year in US landfills.
Discovering that these existing solutions will likely not resolve the problem of Styrofoam waste, we further investigated the chemical makeup of polystyrene. We learnedthat polystyrene, or C8H8 , is a synthetic polymer composed of long chains of styrene and consists of more than 92% carbon (Figure 4). With such a high percentage ofcarbon, we started thinking that we might be able to utilize the carbon in a useful way. We eventually hypothesized that with heat and compression, we could possibly turnpolystyrene into pure carbon.
Common products made of pure carbon include graphite (e.g., pencil lead), diamonds, and activated carbon (major component in most water filters). While the creation of
graphite and diamond seemed a little out of reach, we thought we might be able to develop a process to convert Styrofoam into activated carbon. We learned that activatedcarbon can clean water or air through the filtration process of adsorption. When carbon is activated, it forms tiny micropores and small pockets that increase its surfacearea (Figures 5 and 6). In fact, one teaspoon of activated carbon can have a surface area that is equivalent to a football field! As water flows through, the tiny microporescatch and trap pollutants and contaminants. One drawback with activated carbon is that it can only be used until its pores have filled up, which is why the filter must befrequently replaced. An ongoing need therefore exists for new activated carbon to keep water filters working properly.
We reached out to several professors and experts about activated carbon, and we learned that activated carbon is usually made from wood or coal using a very hightemperature process. Every expert we talked to told us that they had never heard of anyone making activated carbon from Styrofoam, but that it could possibly work due toits unique chemical structure.
Experimental Design
(4) Develop a design statement. Be sure to describe what exactly your device should be able to do. Do not describe HOW it’s going to do what it needs to do.
Our goal is to design a cost effective process that will efficiently convert expanded polystyrene waste into activated carbon for water filtration. Our process will reclaim awaste material and produce an activated carbon material that will effectively filter water to remove contaminants. The process must be feasible and viable for anyoneacross the globe. We therefore aim to create a system that will reduce the amount of Styrofoam waste entering landfills and also filter dirty water, all through the process ofmaking activated carbon.
(5) Determine the criteria for a successful solution and identify constraints for your design. Discuss what the device must have in order to accomplish its job and therestrictions of the device (i.e. the size, the cost, the weight, etc.).
Our process must be designed such that it achieves several goals. First, we need to design a process which can convert Styrofoam into activated carbon at highefficiencies. We hope to convert at least 50% of the Styrofoam mass into carbon. Second, a successful process would result in an activated carbon that has a surface areathat corresponds to a high amount of microporosity. In other words, we hope to produce a carbon that has a surface area much greater than 1m2/g. Higher surface areawould indicate the presence of microporosity and the potential to effectively filter out contaminants in water. If microporosity can be demonstrated, then we will attempt toconfirm the effectiveness of our activated carbon product in filtering contaminants from water.
(6) Identify the relevant variables you will use to test your prototype or model and explain how you will measure your variables.
The most important variable that we will use to test our prototype is the specific surface area (square meters per gram) of our product. Surface area should be a directreflection of the effectiveness of our activated carbon samples. We will measure the surface area using a BET (Brunauer–Emmett–Teller) analyzer, which uses nitrogenadsorption to measure surface area.
In order to confirm the effectiveness of our activated carbon samples, we will measure the concentration of contaminants in water (parts per million) before and after beingfiltered with the activated carbon samples. For our control, we will use commercial grade activated carbon (supplied by Calgon Carbon) to compare with our activatedcarbon product. We will use chemical test strips to measure the reduction in contaminant concentration in the water after we run it through our activated carbon filter.
Build Prototype or Model
(7) Develop a design and list the materials you used in your design. Include technologies you used (e.g., scientific equipment, internet resources, computer programs,multimedia, etc.).
The materials used in our prototype were the following:
To analyze our results, we used the following laboratory instruments:
• BET Surface Area Analyzer Micromeritics ASAP 2020 (Figure 7)• Carolina Biological Water Test Kit Item # 652748 (Figure 8)
(8) Explain how you built your prototype(s) or model(s). Include each of the steps in your process.
To build our prototype, we first had to develop a process to densify and carbonize polystyrene. We started out with a large Styrofoam block. Since Styrofoam is over 95%air, we first compressed and densified the expanded polystyrene by heating it at 150°C to form a solid polystyrene mass that was hard and brittle (Figure 9). We thenperformed a series of experiments to develop a process to carbonize the polystyrene (Figure 10). We wanted to maximize the yield of carbon compared to the initialquantity of Styrofoam. After many hours of testing using different heating conditions, along with MANY failures, we found that the polystyrene could be converted to carbonby heating the Styrofoam at 300°C for 5 hours as our first heat treatment (Figure 11). We learned that it was critical to perform this heat treatment at relatively lowtemperatures in an enclosed container. These conditions minimized the amount of polystyrene that decomposed to form a gas. Once we formed the carbonized samples,we used a mallet to break the carbon into small sandsized granules for further processing.
Next, we experimented with different chemical reagents (potassium hydroxide and phosphoric acid) to etch the carbon and create the micropores for the activated carbonproduct. The best result (as outlined in Figure 12) was obtained by rinsing the carbon in phosphoric acid (H3PO4) as shown in Figure 13. Finally, we put the chemicallytreated carbon in a second heat treatment at 400°C for 5 hours. This resulted in activated carbon with a surface area of over 108 m2/g, which was measured using a BETsurface area analyzer (Figure 14). This surface area is equivalent to the area of a volleyball court, in only 1 gram of activated carbon!
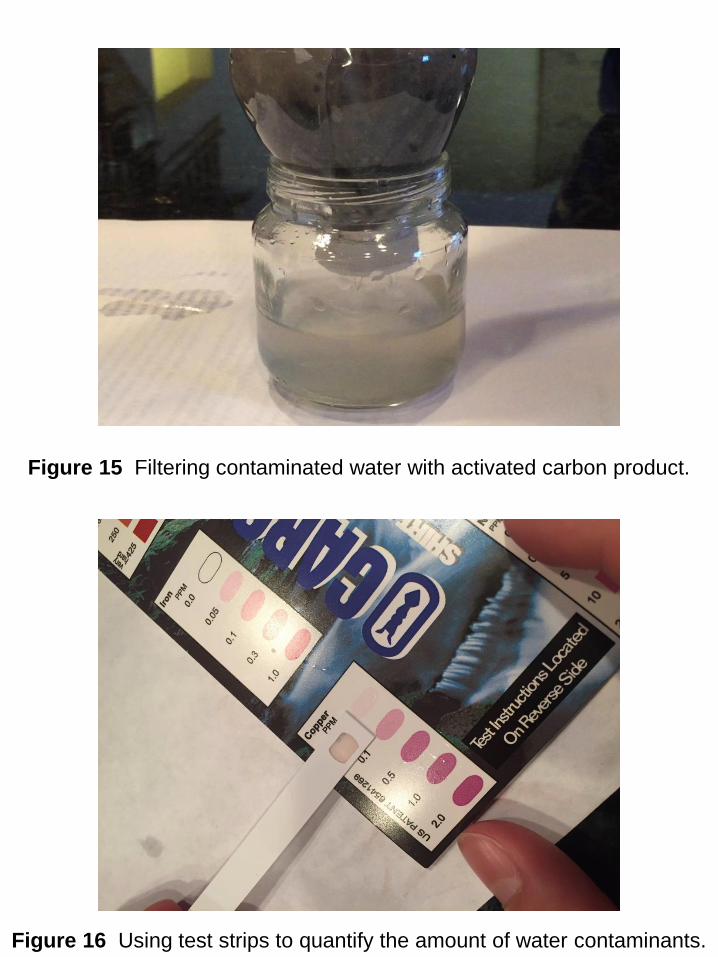
We then set out to prepare a simple prototype filter with our activated carbon samples. We first cut off the top of a PET water bottle, keeping the lid attached. We drilledthree holes (approx 1mm diameter) in the lid of the bottle. Next we inserted a coffee filter into the top of water bottle (oriented upside down) to keep the activated carboncontained (Figure 15). We carefully poured the activated carbon samples into the bottle so that it would sit within the coffee filter. Lastly, we added a second coffee filter ontop of the activated carbon to filter out any larger particles. We prepared side by side samples using both commercial grade activated carbon (Calgon Carbon Filtrasorb®F200) and our own activated carbon sample which a surface area of 108 m2/g.
Please see a video summary of our process at https://youtu.be/YbUSnhBeMA.
Test Prototype or Model
(9) Describe the data you collected and observed in your testing (use of data tables, charts, and/or graphs is encouraged).
Testing was critical during each stage of development of the StyroFilter project. We investigated several variables including the initial heating to carbonize thepolystyrene, chemical etching, and a second heat treatment to activate the carbon (Figure 14). We performed nine different tests using various combinations of heatingand chemical treatments, all with different outcomes. In our first three tests, we heated the densified polystyrene to extremely high temperatures of 800°C, 600°C, and500°C, all for 2 hours. The results for these three tests were very discouraging each polystyrene sample completely vaporized.
To prevent the decomposition and vaporization of the polystyrene, we decided to significantly reduce the initial heat treatment temperature. We tried a low temperature of300°C and found that it carbonized quite well in 5 hours. This result was very encouraging, and it allowed us to start investigating how to best produce high surface areas.
In our subsequent testing (Tests 49), we investigated various chemical etchants and heat treating conditions. For our fourth test, we rinsed the Styrofoam with potassiumhydroxide (KOH), but the surface area of this treated Styrofoam was less than 1 m2/g. For our fifth and sixth tests, we ran the Styrofoam through a second heat treatment.We rinsed both samples with potassium hydroxide, but the fifth test failed. For our sixth test, we heated the Styrofoam at a lower temperature than the fifth test, and heated itfor a longer period of time. This test turned out to be successful, but it only produced a surface area of 4 m2/g.
We continued to test, looking for a larger surface area. On our last three tests, we rinsed our samples with phosphoric acid (H3PO4) instead of potassium hydroxide. Ourseventh and eighth tests did not achieve measurable surface areas, but when we tested with the second heat treatment for 5 hours at 400°C, we successfully convertedthe Styrofoam into activated carbon, with a surface area of 108 m2/g!
After our very encouraging result, we set out to confirm whether our activated carbon derived from polystyrene could really work in a water filter. To test for chlorine, weadded chlorine bleach to a sample of distilled water. To test for iron and copper, we crushed a Centrum multivitamin and added various amounts to a sample of distilledwater. We tested various chlorine bleach and vitamin concentrations with Carolina Biological water test strips until we produced water samples at the high end of eachcontaminant scale: Iron (1 ppm), Copper (1 ppm), Chlorine (5 ppm).
We poured each water sample through two activated carbon filters: (1) a control filter made using Calgon Carbon Filtrasorb® F200, and (2) our own activated carbonsample with a surface area of 108 m2/g. We measured the change in concentration of each water sample by following instructions on the water test strips (Figure 16).While not quite as effective as the control samples, our results showed that the StyroFilter sample was still very effective in filtering and reducing the concentration of eachcontaminant (Figure 17).
(10) Analyze the data you collected and observed in your testing. Does your data support or refute your design statement? Do not answer with yes or no. Explain youranswer using 'Our data supports/refutes the design statement because...'
After reviewing all of our data, we concluded that the results clearly support our design statement because we successfully developed a process to convert Styrofoam intoactivated carbon at high efficiencies. In fact, we measured conversion efficiencies above 75% from the mass of Styrofoam to the mass of carbon. We furthermore producedactivated carbon with surface areas greater than 100 m2/g, so that it had sufficient microporosity to filter contaminants from water. Our water filtration tests in fact provedthat the activated carbon of StyroFilter removed high levels of contaminants from water (Figure 17).
We are confident that further development of our chemical etching and heat treatments would enable us to match the higher surface area of the commercial gradeactivated carbon. We would then expect to be able to match the higher filtration efficiencies of the commercial grade product.
(11) Explain any sources of error and how these could have affected your results
There could have been several sources of error during our experiments and analysis. Two key variables during our experiments were temperature and oxygen content. Ineach of our heat treatments, temperature was measured using a thermocouple. However, the thermocouples were not actually placed within the samples, but inside thefurnace (or grill for many experiments). There were likely differences between the sample temperature and the temperature at the thermocouples. In all of our laterexperiments which were performed in closed containers, there may also have been some differences in oxygen content from one test to the next. These differences couldcome from small variations in the containers themselves. These potential variabilities in temperature or oxygen content, however, should only affect our understanding ofthe process conditions. Our resultant samples are still valid regardless of these potential measurement errors..
Our primary measurement of the product was the BET surface area. Surface area measurements were made on a laboratory instrument at Battelle Labs. It is possible thatthere were errors in the calibration of this instrument. However, we relied on the generous support of technicians at Battelle to perform these measurements. Since Battelleis certified under various quality standards (ISO 9001:2008, AS9100C, and ISO13485), we believe that the BET instrument was properly calibrated.
Another potential source of error was related to our measurements of water contaminants before and after filtering. We used a water testing kit that relies on a visualmethod of determining the amount of each contaminant in the sample. Specifically, the method used test strips and reference charts to match the color of the strip with thecorresponding measurement on the chart. Sometimes the color of the strip was in between two colors on the reference chart, so we had to estimate the correspondingmeasurement. To minimize error, we made sure that we worked under a bright light and that all of us agreed on the measurement.
Drawing Conclusions
(12) Interpret and evaluate your results and write a conclusion statement that includes the following: Describe what you would do if you wanted to retest or further testyour design. Evaluate the usefulness of your prototype or model. What changes would you make to your prototype or model for the future, if any?
Our results are a positive proofofconcept that it is possible to convert Styrofoam waste into a useful product, activated carbon. We were also able to demonstrate that ourStyrofoamderived activated carbon sample was effective in reducing the quantities of several chemical contaminants in water.
To further test our design, we would like to conduct more accurate and sophisticated tests to understand the effectiveness of our activated carbon in reducing variouspollutants and contaminants in water and air.
We would also like to achieve a greater surface area with our activated carbon. To do this, we would experiment with different chemical concentrations and other chemicalreagents to further etch the carbon. We would also vary the temperature and time of the heat treatments. Since we have only tested a few conditions, we hope that moretesting could reveal other process conditions that would further increase the amount of surface area in our activated carbon.
Our prototype is very useful because we can take Styrofoam waste and turn it into activated carbon. We took a very challenging environmental problem and transformed itinto an environmental solution that can help reduce Styrofoam trash AND filter dirty water with a single innovative approach!
Community Benefit(1) How could your design help solve your problem and benefit your community? Describe next steps for further research/design and how you have or how you couldimplement your solution in the future.
Our design could help solve the problem of excessive, nonrecyclable Styrofoam waste by turning discarded Styrofoam into activated carbon for water purification. Thisinnovative approach would not only reduce the amount of Styrofoam trash that fills over 25% of landfills in our community, but also create a low cost and effective methodof producing activated carbon. Furthermore, our solution has the potential to benefit third world countries, where there are large amounts of Styrofoam trash, but limitedways of purifying water.
One of our future research steps is to optimize our chemical reagents and heat treatments to further increase the surface area of our activated carbon product. We wouldalso like to promote our solution in the community to raise awareness of the growing problem of Styrofoam trash and to present a feasible solution of converting Styrofoamwaste into activated carbon. Our design and prototype, at the moment, is just a proof of concept on a laboratory scale. However, we would like to conduct further researchand tests to see if this process can be scaled up to handle a larger amount of Styrofoam as part of an industrial waste stream.
We talked with a variety of experts in the fields of activated carbon and of Styrofoam waste, and they were all very enthusiastic about StyroFilter. They were optimistic thatStyroFilter could be easily scaled up and implemented commercially. With this confirmation from university professors and industry researchers in the fields of chemistry,chemical engineering, and the activated carbon industry, we believe that we have developed a very unique and revolutionary innovation to deal with one of the mostchallenging environmental waste problems today.
Mission Verification(1) Does your Mission Folder project involve vertebrate testing, defined as animals with backbones and spinal columns (which include humans)? If yes, team mustcomplete and attach an IRB approval form.
No
(2) Did your team use a survey for any part of your project? If yes, team must complete and attach a survey approval form.
No
(3) You will need to include an abstract of 250 words or less. As part of the abstract you will need to describe your project and explain how you used STEM (Science,Technology, Engineering and Mathematics) to improve your community
Every year in the US alone, 1.9 billion pounds of Styrofoam is thrown away, and it fills up a staggering 30% of landfills. The US disposes over 25 billion Styrofoam cupsalone every year. These high statistics usually occur because it is cheaper to produce new polystyrene than it is to collect, transport, and process material for recycling.Through our research, we found that there were no good existing solutions for Styrofoam waste.
Using STEM, we developed an innovative solution to this growing problem. Our solution is called StyroFilter, in which we successfully convert Styrofoam waste(expanded polystyrene) into activated carbon that can be used to filter water. Because polystyrene is composed of over 92% carbon, we performed a series of experimentsto convert polystyrene into carbon. After many failures and over 50 hours of experiments, we were able to successfully convert polystyrene into carbon with over 75%efficiency. We then investigated several chemical reagents including phosphoric acid and potassium hydroxide which, coupled with heating, effectively etched the carbonto achieve a surface area of over 100 m2/g!
We then made a prototype water filter using a disposable water bottle filled with the activated carbon we made from Styrofoam. By measuring the reduction of variouschemical contaminants, we found that our StyroFilter was very effective for filtering water. In summary, we took a very difficult problem and established a proofofconcepton a laboratory scale. With StyroFilter, we can convert dirty waste into clean water!