Page 1
TEAMPOWERANDHIERARCHY:UNDERSTANDINGTEAMSUCCESS
1
Team Power and Hierarchy: Understanding Team Success
Huimin Xu
School of Journalism and Communication, Nanjing University, Nanjing 210023, China
Yi Bu Department of Information Management, Peking University, Beijing 100871, China
Meijun Liu Institute for Global Public Policy, Fudan University, Shanghai 200433, China
Chenwei Zhang Faculty of Education, The University of Hong Kong, Hong Kong 999077, China
Mengyi Sun Department of Ecology and Evolutionary Biology, University of Michigan, MI 48109,
USA
Yi Zhang Faculty of Engineering and IT, University of Technology Sydney, NSW 2007, Australia
Eric Meyer School of Information, University of Texas at Austin, Austin, TX 78701, USA
Eduardo Salas Department of Psychological Science, Rice University, Houston, TX 77005, USA
Ying Ding School of Information, University of Texas at Austin, Austin, TX 78701, USA
Corresponding author: Ying Ding ([email protected] ).
Page 2
TEAMPOWERANDHIERARCHY:UNDERSTANDINGTEAMSUCCESS
2
Team Power and Hierarchy: Understanding Team Success
Abstract: Teamwork is cooperative, participative and power sharing. In science of
science, few studies have looked at the impact of team collaboration from the
perspective of team power and hierarchy. This research examines in depth the
relationships between team power and team success in the field of Computer Science
(CS) using the DBLP dataset. Team power and hierarchy are measured using
academic age and team success is quantified by citation. By analyzing 4,106,995 CS
teams, we find that high power teams with flat structure have the best performance.
On the contrary, low-power teams with hierarchical structure is a facilitator of team
performance. These results are consistent across different time periods and team sizes.
Keywords: Team Power; Power Hierarchy; Power level; Team Success; Scientific
Collaboration; Artificial Intelligence
INTRODUCTION
To understand teamwork and its success, it is imperfect if we ignore the notion of
power. As the prominent social scientist Bertrand Russell highlighted in his book that
power is a fundamental concept in social science “in the same sense that energy is the
fundamental concept in physics” (Russell, 1938, p.10). Power is manifested through
cooperation (Blau, 1964, 1977). As long as more than one person works on a given
task, power starts to influence every step of the process and the ultimate performance.
Power is pervasive and often camouflaged in our society (French & Raven, 1959).
But power is an essential, unavoidable, yet unrecognized element of collaboration
(Galinsky et al., 2008).
Scientific teams have increasingly dominated the process of knowledge production
(Wuchty et al., 2007). Individuals with different skills and diverse levels of
Page 3
TEAMPOWERANDHIERARCHY:UNDERSTANDINGTEAMSUCCESS
3
experience need to form a team to tackle complex problems and stay competitive
(Becker & Murphy, 1992). When collaboration is increasingly common, power
dynamics are consistently present in team activities (Dahl, 1957). Researchers are
eager to find out the best way to form teams and improve team effectiveness in
scientific settings (for review, Hall et al., 2018), but few pay attention to the role of
power dynamics in scientific endeavors. John Heider once emphasized the importance
of power in collaboration, saying, “Since all creation is a whole, separateness is an
illusion. Like it or not, we are team players. Power comes through cooperation,
independence through service, and a greater self through selflessness” (Heider 1997,
p.77). For effective and successful scientific collaborations, all types of power should
be recognized, acknowledged, and balanced to avoid power struggles and achieve
optimal performance.
Greer et al. (2017) conceptualized team power as the combination of two variables:
power hierarchy and power level. Hierarchy can help or hurt team effectiveness in
different contexts and task types (Anderson & Brown, 2010; Bunderson et al., 2016).
Hierarchy can improve cooperation, coordination, and role clarity, but it can also
breed inequality and resentment. Greer and van Kleef (2010) found that power level
moderates the effect of power hierarchy on team performance in their study of a
single multinational financial company. When team power is at its lowest, some group
members have substantially more power than others have, power hierarchy may
facilitate conflict resolution by creating order and improving coordination. On the
other hand, power hierarchy can create a perception of inequality and injustice
between high-power individuals, heightening intragroup competition. Whether the
findings on the complex relationships between team power and success from
organizational science and behavioral science can be generalized to teams in science
is still unknown.
Page 4
TEAMPOWERANDHIERARCHY:UNDERSTANDINGTEAMSUCCESS
4
This paper takes Computer Science (CS) as the test field to study the relationships
between team power and team success. CS, especially data science and Artificial
Intelligence (AI), has been widely applied in various domains, ranging from drug
discovery (Gao et al., 2019), medical imaging diagnosis (Han et al, 2021), to fraud
detection (Dunis et al., 2016). CS has been developed by teams of scientists, thus
team power dynamics are inevitable. Power can play a crucial role to empower or
disarm team members. Hierarchy can improve the coordination efficiency of a team,
but it can also diminish the capability for solving conflicts, making the
communication from bottom to top ineffective (Leavitt, 2003). Both highly flexible
coordination and communication are key to building confidence when facing the
uncertainty of CS research (Fountaine et al., 2019; Thamhain et al. 2004). Team
power and hierarchy are highly sensitive to the size of a team, which is shaped by the
tradeoff between benefits and risks (Fortunato et al., 2018). An interview with
Andrew Ng, founder and CEO of Landing AI and former lead of the Google Brain AI
research team, shows that a small team with AI experts and domain specialists to act
quickly and fail fast is the good way to start (Insights Team, 2019). Fierce competition
in CS also demands the quick turnover of tested experiments and requires adaptability
to unknown future directions. However, big teams are more capable of solving “big
problems.” For example, the breakthrough discovery of Higgs boson relied on CERN,
the largest particle physics research center hosting thousands of scientists from all
over the world. AI research is experiencing a rapid shift (Tang et al., 2020), reaching
the stage of deep learning (Tang et al., 2020), and becomes more method-oriented
(Frank et al., 2019b) and application-driven (Yuan et al., 2020). Thus, CS teams need
to adapt to the changes of topics and directions over time.
Practicing modern science requires an unprecedented level of teamwork (Bozeman &
Youtie, 2017). This project is among the first to use large-scale datasets to study the
dynamics of team power from millions of scientific teams. This paper aims to
Page 5
TEAMPOWERANDHIERARCHY:UNDERSTANDINGTEAMSUCCESS
5
understand the complex relationships between team power and success in the field of
Computer Science from the following three perspectives: (1) power and hierarchy in
teams, (2) power and hierarchy in teams of different sizes, and (3) power and
hierarchy in different time stages of CS. This paper starts with the introduction and
definition of team power. The literature review section outlines related work from
behavioral science, management science, philosophy in science, and science of
science. The methodology section details data collection and measures for team power
and hierarchy. The result section illustrates patterns of combinations of team power
and hierarchy, as well as their relationships with team success. The conclusion section
summarizes the findings and highlights future directions.
THE DEFINITION OF TEAM POWER
Team power can be defined as whether one team member will obey/agree or
resist/disagree with the thoughts/activities of others in the same team (Magee &
Galinsky, 2008). There are three types of team power: power over, power with/to, and
power for (Boulding, 1989). Power over is to control over resources for collaboration
using force, coercion or threat, this is adversarial rather than collaborative. Power
over is a tool to benefit the needs of a smaller group rather than the whole. Power
with/to is to draw the collective capabilities of members to accomplish things together.
It can be enacted by building and strengthening shared power for a team. Power for
extends the collaborative membership to stakeholders who are not team members. It
builds capacity for underpowered stakeholders. These three types of power exist in
almost all collaborative endeavors which means that most collaborations use some
force, some mutual exchange or negotiation, or some additional inclusion. There are
two additional types of power that can affect team work: personal and positional
(French & Raven, 1959). Personal power includes expertise (e.g., expert power when
a person has knowledge or expertise which is valued by organizations or individuals),
Page 6
TEAMPOWERANDHIERARCHY:UNDERSTANDINGTEAMSUCCESS
6
referent authority (e.g., referent power when an individual can generate admiration
and loyalty of others, such as charismatic leaders), and rights to access resources (e.g.,
informational power that a person has control and access to important resources,
connections and information). Positional power (e.g., leaders) is acquired by a person
through a position within an organization which can be used to punish or reward team
members.
In team collaboration, there are two primary types of team power structures: team
power hierarchy and team power level (Greer et al., 2017). Hierarchy is defined as an
implicit or explicit rank order of individuals or groups with respect to a valued social
dimension (Magee & Galinsky, 2008) or as vertical differences between team
members in their possession of team resources and their levels of authority for
decision making (Greer et al., 2018). Team power hierarchy can be hierarchical (e.g.,
top down or concentrated power) or flat (e.g., everyone holds similar levels of power).
Power level is conceptualized as the average control of resources (e.g., important
decision-making), average expertise level, or average position (Greer et al., 2011;
Groysberg et al., 2011; Greer & Van Kleef, 2010). Team power level can be high (e.g.,
manager teams) or low (e.g., entry-level employee teams).
RELATED WORK
Power and Hierarchy in Teams
Despite strongly expressed beliefs in many societies that emphasize equality of
opportunity, hierarchy is a persistent and possibly unavoidable part of social life
(Bunderson et al., 2016). The extent to which hierarchy is beneficial or harmful for
teams is an unsettled debate in current literature. The functionalist view (for reviews,
see Anderson & Brown, 2010; Greer et al., 2018) highlights the functional benefits of
hierarchy as: 1) creating a psychologically safe environment so that lower power
Page 7
TEAMPOWERANDHIERARCHY:UNDERSTANDINGTEAMSUCCESS
7
members have less responsibility; 2) motivating performance through
hierarchy-related incentives (e.g., promotions, economic benefits, admiration); and 3)
supporting division of labor and coordination (e.g., people with higher or lower
powers work on different tasks). Meta-analytic evidence shows that through
coordination-enabling processes, hierarchy can be beneficial to team performance.
For example, in a lab experiment, when members had collaborative planning, teams
with a clear expertise hierarchy could integrate information more effectively to
analyze problems in a terrorist plot (Woolley et al., 2008). Also, age-diverse teams
were shown to have in-depth discussions and share task-relevant information when
team need for cognition was high (Kearney et al., 2009).
However, these coordination-enabling results from controlled contexts do not
necessarily exist in complex and dynamic real-world settings. The negative sides of
the hierarchy are based on: 1) conflict theory, which argues that inequality over
limited resources is more likely to trigger struggles in teams (for review, see Greer et
al., 2017); and 2) the salience of power, which suggests that subordinates might not
want to voice their opinions even though hierarchy can give people safety and
certainty. Especially when leaders’ power over others is salient, members can be
afraid to speak up and thus risk inhibiting the collective learning and information
sharing needed to make adaptive changes (Edmondson, 2002). Indeed, equal and
turn-taking communication can contribute to collective intelligence because people
can take full advantage of their skills and knowledge (Woolley et al, 2010).
Whether hierarchy is beneficial to team performance depends, in part, on task type.
Greer et al. (2018) reviewed three aspects of team tasks which would influence the
function of hierarchy: task ambiguity, task complexity, and task interdependence.
When tasks are more predictable, routine, and stable, teams prefer hierarchical
structures (Anderson & Brown, 2010). In contrast, if tasks are ambiguous, requiring
Page 8
TEAMPOWERANDHIERARCHY:UNDERSTANDINGTEAMSUCCESS
8
more flexibility and creativity, flatter structures are better. Ronay et al. (2012) showed
that hierarchy can improve team performance if team members deal with
interdependent tasks (e.g., basketball), but can decrease team performance if team
members perform independent tasks (e.g., baseball). Compared with baseball
(Simmons, 2012), basketball requires more coordination and cooperation among team
members. In professional basketball teams from the NBA, differentiation of players’
pay and participation (e.g., playing time and starting lineup), a proxy of power
hierarchy, can increase team performance by enhancing team processes (Halevy et al.,
2012).
Whether developing a new algorithm, or applying existing algorithms to a specific
domain, scientific research is non-routine and complex, and it requires demonstrating
novelty by advancing the state of the art. In such scientific tasks, member voice and
participation are critical, and power dispersion could be flat to allow members with
complementary skills to work together. But, the situation is not fully true in academia
because power hierarchy is pervasive in academic activities. Merton (1973) claimed
that scientific community is controlled by gerontocracy, where the elderly sets the
rules in scientific domains. As scientists become more senior, their positions in the
hierarchy tends to rise, they gain access to more resources, and thus can increase their
productivity and impact, following the principles of the Matthew effect (Merton,
1973). Researchers of different ages have different roles in the division of labor, with
younger scholars often making more “technical” contributions while senior ones focus
on “conceptual” tasks (Larivière et al., 2016). In some scientific fields, junior
researchers appear in the first position whereas veteran or highly ranked ones tend to
appear in the last, usually playing the supervisory roles (Costas & Bordons, 2011).
Another key to reconciling the two different perspectives on the effect of power
hierarchy is power level. By considering power level and power hierarchy together,
Page 9
TEAMPOWERANDHIERARCHY:UNDERSTANDINGTEAMSUCCESS
9
Greer and Van Kleef (2010) found that hierarchy was useful for teams with low power,
but problematic for teams with high power. In the low-power teams, individuals are
more likely to accept hierarchy because clear roles could help them better know what
to do. For low-power individuals, a lack of hierarchy creates a power vacuum that
gives rise to conflicts and power struggles. However, in high-power teams, members
prefer balanced power without hierarchy because members with high power are more
prone to be competitive, aggressive, jealous, and sensitive when power differences
exist within the team (Greer et al., 2011). For example, in science, if a senior full-time
professor is paired with several junior students, then the paper is more likely to be in
the high-impact publications (Bales et al., 2014), which stresses the importance of
mentorship. Mentoring in academia is dominated by the intergenerational relationship
that mentor and mentee are from different generations with a wide age gap (Satterly et
al., 2018). In the organizational behavior field, Greer et al. (2011) did field studies
within a financial company to test the effect of power level on team performance.
They found that a team made up of high power people (e.g., a management team),
performs worse than a team consisting of low position power people (e.g., secretarial
teams) while collaborating in a logic puzzle game. This is because, when people with
high power work together, they are more likely to have intragroup conflicts. For lower
power level teams, like aircrews or rifle squads, a highly hierarchical setting with
military leaders and commands is necessary (Goodwin et al., 2018). To avoid the
disadvantages of power centralization, they design effective training interventions to
improve coordination and performance across units (Salas et al., 1995).
Power and Hierarchy in Large Teams and Small Teams
Team size plays an important role in team performance. As a parameter in a model for
the assembly of creative teams, team size could determine team outcomes (Guimera et
al., 2015). As team size becomes larger (Wuchty et al., 2007), there is a trade-off
Page 10
TEAMPOWERANDHIERARCHY:UNDERSTANDINGTEAMSUCCESS
10
between solving big problems and having practical burdens (Fortunato et al., 2018).
Large teams enable clear division of labor and specialization in complex tasks
particularly when there is a high degree of certainty about the tasks to be
accomplished (Meyer & Schroeder, 2015; Whitley, 2000). Small teams are more agile,
which can lead to more effective communication and adaptability (Katzenback &
Smith, 1993). Large teams tend to have more citations (Wuchty et al., 2007; Larivière
et al., 2014), earn prestigious awards, and receive more funding (Adams et al., 2005).
Even though large teams may receive more attention, Wu et al. (2019) showed that
innovation does not scale up with large teams. Hall et al., (2018) reviewed that the
ideal team size is six to nine members, which is a manageable size.
Large teams have extra cognitive resources because they can be more diverse in skills
and knowledge than small teams (Bantel & Jackson, 1989). However, large teams
likely produce additional affective conflicts (Amason & Sapienza, 1997) and process
conflicts (Behfar et al., 2011) due to increased communication costs (Staats et al.,
2012) and decreased relational support (Mueller, 2012). Conflicts and struggles
mediate the interactive effects of team power level and hierarchy on team
performance (Greer & Van Kleef, 2010). Therefore, we need to exclude the effect of
team size to study the relationship between hierarchy and team performance. For
example, Woolley et al. (2010) found that collective intelligence is strongly correlated
with equity rather than hierarchy in their experiments. They also replicated the same
result in teams consisting of two to five people. Similarly, when examining the role of
team power and hierarchy amidst team conflicts, Greer et al. (2011) and Bunderson et
al. (2016) controlled team size. Team performance might be influenced by other
factors besides the team power indicators proposed in this paper, and here we control
team size as a possible influential factor of papers’ citations.
Power and Hierarchy over Time
Page 11
TEAMPOWERANDHIERARCHY:UNDERSTANDINGTEAMSUCCESS
11
According to Yin & Wang (2017), time helps us understand paradigm shifts, identify
breakthroughs and sleeping beauties, understand resource allocation, and predict
future citation impact. In the AI field, by analyzing AI research from arXiv between
1993 and 2019, Tang et al. (2020) observed the pace of AI innovations from four
stages: embryo, stable, machine-learning and deep-learning stage. Before 1980, AI
research typically made references not only to computer science, mathematics, but
also to social sciences, including philosophy, geography and arts. However, after that
time, AI has relied more heavily on mathematics and computer science, indicating
more emphasis on developing methods. Other social science disciplines find that it is
difficult to track AI papers that are increasingly published in highly specialized outlets
(Frank et al., 2019b). Therefore, we need to consider the temporality of CS teams, i.e.,
how teams evolve over time.
As McGrath et al. argued, “Rather than static, groups are inherently dynamic systems,
operating via processes that unfold over time”. (McGrath et al., 2000, p.98).
Accordingly, a holistic and longitudinal design may best capture group process and
performance. As time goes by, the effect of surface-level diversity (e.g., demographic
variables) on team outcomes would diminish compared with deep-level diversity (e.g.,
psychological variables) (Harrison et al., 2002). Since we measure team power and
hierarchy via career age, we need to consider how this demographic characteristic
affects team performance over time. Laboratory studies have several constraints,
which are different from “real-world” team processes over time. Even though
researchers design games to illustrate how equal or hierarchical team power
influences the process of cooperation in lab experiments (Woolley et al., 2008; Greer
et al., 2011), limited time is available to observe their long-term performance.
However, time might influence the performance of power hierarchy on team function
(Martínez-Córcoles et al., 2021). At an early stage, teams might need a hierarchical
structure, like a powerful leader, for close guidance. But the process is gradual, since
Page 12
TEAMPOWERANDHIERARCHY:UNDERSTANDINGTEAMSUCCESS
12
team members need some time to adapt to each other. In later stages, members could
be involved naturally in communication, sharing decision-making under the guidance
of a leader. Therefore, a long-term experiment observation could provide us more
fine-grained metadata about user behaviors and far more valid results. In the
regression analyses, we overcome time effects to capture more accurate associations
between team power indicators and team success.
Team Success in Computer Science
Many studies have examined the success of Computer Science teams from the
perspective of the individual, publication, and institution (Fiala & Tutoky, 2017).
Yuan et al. (2020) found that CS, especially AI, is experiencing a shift from
theory-oriented to application-driven. Also, distinguished CS scientists have high
mobility in job positions which spark their productivity in publications after changing
institutions. In addition to talents, Tang et al. (2020) analyzed the rapid pace of AI
innovation using another two indicators: AI publication number and publication
updates. Firstly, as more newcomers join the AI community, they breed more
innovative ideas. Secondly, the number of AI preprints in arXiv has increased
dramatically over time. Thirdly, the acceleration of refining, improving, and updating
processes suggests that AI researchers have frequent trail-and-error lifecycles. Frank
et al. (2019b) calculated the Gini coefficient of AI papers, authors, and citations
across institutions. They found that the diversity of AI research decreases based on
these metrics. This reflects the power concentration of AI, which is caused by
preferential attachment between privileged institutions and conferences. The CS field
is becoming exceedingly hierarchical and is dominated by a few organizations.
CS is a knowledge intensive field and is fully driven by innovations (Zhai et al., 2021).
AI is one critical subfield of CS. AI teams focus on AI+X, where X is a domain or an
application which AI will be applied to. AI teams typically contain data scientists,
Page 13
TEAMPOWERANDHIERARCHY:UNDERSTANDINGTEAMSUCCESS
13
data engineers, and applied scientists; sometimes even product managers and end
users are included (Insights Team, 2019). How to incorporate these members with
diverse skills and backgrounds into CS teams deserves our attention. Previous
research focuses on the patterns of scientific collaboration in computer science teams
from different perspectives. For example, Bu et al. (2018a) concluded that
heterogeneous teams (e.g., diverse career age) benefit more from persistent
collaboration than homogenous teams. By tracing the entire career stage of
researchers in the field of computer science, Bu et al. (2018b) concluded that young
scholars could maximize their success if they can accumulate some experience before
working with ‘giants’. The most famous AI scientists are clustered in the same
community in a cooperation network (Yuan et al., 2020). Meanwhile, collaboration
between industry and academia in teams is becoming more frequent (Frank et al.,
2019b).
For CS teams in tech companies, the working environment is shifting towards
self-driven and self-managed rather than a traditional hierarchical team structure.
Thamhain et al. (2004) surveyed 80 teams in 27 technology companies over five years.
These teams were made up of managers, scientists, engineers, and technicians. They
found that team structure, like power sharing among team members, is important to
team effectiveness. The authors suggest that workers in tech teams prefer autonomy
and freedom compared with the formal command, control and managerial power
(Thamhain et al., 2003). CS teams should have the test-and-learn mentality that can
turn mistakes into new discoveries. Therefore, CS teams should be agile and ready to
fail (Fountaine et al., 2019). Adaptability and flexibility of teams would enable CS
teams, especially AI teams, to possess a competitive edge. Just as we have
summarized in the section Power and Hierarchy in Teams, researchers have conducted
experiments, surveys, and observations to unpack the complex relationships between
team power and success in science, sports, healthcare, organizations, and the military.
Page 14
TEAMPOWERANDHIERARCHY:UNDERSTANDINGTEAMSUCCESS
14
However, the patterns of team power and hierarchy for successful CS teams are not
yet explored using a large-scale quantitative lens.
METHODS
Data
We use DBLP April 2020 version (https://dblp.org/), which contains journal and
conference papers in computer science (Tang et al., 2008). The citation data is
extracted by Tang et al. (2008) from DBLP, ACM, and MAG (i.e., Microsoft
Academic Graph). First, Tang et al. (2012) disambiguated the author names in the
DBLP dataset, reaching a precision rate of 83.01%. Given there still exists limitations
in the name disambiguation, we delete those papers with authors’ career age above 80
based on the fact that individual scientists do not have active careers longer than most
people’s lifespan. Then, we choose papers with complete information, including
4,894,063 unique paper IDs, 4,398,138 unique author IDs, and 82,226,114 total
citations ranging from 1800 to 2020. Finally, by excluding solo-authored papers, we
get a final dataset, providing 4,106,995 co-authored papers, 4,099,577 unique authors,
68,965,173 citations from 1800 to 2020.
Measures
The Conceptualization of Power and Hierarchy
Power can be conceptualized as job position, expertise, age, wealth, gender, race or
ethnicity, ability, physical stature, and perceived intelligence (Greer & Van Kleef,
2010; Groysberg et al., 2011; Piercy, 2019). Although power can be rooted in various
sources, this paper primarily focuses on age differences as a demonstration of power
hierarchy in academia. Age has been historically emphasized as the basis of
hierarchical power (Linton, 1936, p.118). Members may be presumably conferred
Page 15
TEAMPOWERANDHIERARCHY:UNDERSTANDINGTEAMSUCCESS
15
power based on age (Piercy, 2019). When people of different ages work together, old
people would be given higher power or status in the hierarchy because they might
have more experience, knowledge and wisdom (Harrison & Klein, 2007; Gingras et al.
2008). The gap between mentor and mentee in academia can be further enlarged by
the personal power of mentors, such as knowledge, expertise, collaboration networks,
access to resources, and reputation/authority (Anderson et al., 2011).
Harrison and Klein (2007) suggested that the variable age distributed within a unit,
might indicate different diversities in different contexts. Prior research on age effects
has considered either variety-based or separation-based diversity, but it has ignored
disparity diversity. For example, age-diverse teams consist of team members who can
exchange and integrate diverse task-relevant information, knowledge, or experience to
enhance performance (Kearney et al., 2009). In this case, they categorize participants
into different age groups and measure diversity using Blau’s (1977) index of
heterogeneity. However, the isolation of some age groups from others might
discourage the exchange of information and cause conflicts (Bayazit & Mannix, 2003).
The separation of opinions regarding a particular event is thus measured as the
standard deviation. Compared with variety-based or separation-based diversity,
disparity diversity (hierarchy) emphasizes more vertical differences, which means
higher-level people might have more influence on lower-level ones.
In science, we focus more on career age rather than chronological age (Amjad et al.,
2017; Bu et al., 2018b). On the one hand, it is easier to measure scientists’ career age
in the large-scale publication datasets compared to asking their ages directly. On the
other hand, compared with physical age, career age is a better indicator for seniority
since the age of earning a terminal degree varies significantly by field and by personal
circumstances. In this research, we conceptualize career age differences as evidence
of a power hierarchy and examine how seniority-based hierarchy affects team success.
Page 16
TEAMPOWERANDHIERARCHY:UNDERSTANDINGTEAMSUCCESS
16
The Operationalization of Power, Hierarchy and Team Success
Hierarchy also has other synonyms, such as disparity, dispersion, inequality,
centralization, steepness, inequality, and asymmetry. Even though all of these
concepts concern vertical differences within teams, the operationalization is quite
different (Bunderson et al., 2016). The most common approach measuring hierarchy
is centralization, which views hierarchy as the concentration of valued social assets or
sources in a small group. Harrison and Klein (2007) suggested that power hierarchy
belongs to disparity and should be operationalized with the Gini coefficient (Gini,
1936) or the coefficient of variation (Bedeian & Mossholder, 2000) to represent the
concentration degree and vertical differences. He and Huang (2011) used the Gini
coefficient to represent age inequality. The second common approach is steepness.
Steepness is referred to as separation by Harrison and Klein (2007), which represents
horizontal differences in positions or opinions. For example, Greer and Van Kleef
(2010) measured power dispersion with the standard deviation of members’ positions
in the organizational hierarchy. The difference between these two measures is that
centralization focuses on the concentration of valued assets in a few members,
whereas steepness is the difference aggregated across all members (Anderson &
Brown, 2010). Based on the definition of hierarchy (Bunderson et al., 2016; Harrison
& Klein, 2007), hierarchy not only stresses vertical difference but also the control of
resources in the minority relative to the majority. Therefore, we choose to
operationalize hierarchy with the Gini coefficient since this measure meets these two
requirements.
In sum, we use career age (from the researcher’s first paper until the focal one) to
represent his or her power in a team. The average career age of team members can
serve as a proxy to measure team power. The power hierarchy is quantified by the
Gini coefficient of career age of team members. Team performance is measured by the
Page 17
TEAMPOWERANDHIERARCHY:UNDERSTANDINGTEAMSUCCESS
17
average citations per year since the paper was published, which is a normalization of
citations based on time (Abbasi & Jaafari, 2013; Zhang et al., 2019). The descriptive
statistics of these variables are shown in Table 1.
Table 1. Descriptive statistics of team performance, power level and power hierarchy
Variable Mean Std. Dev. Min Max Q1 Q2 Q3
Team size 3.44 1.79 2.00 398.00 2.00 3.00 4.00
Year 2010 8.00 1800 2020 2006 2012 2016
Annual average citation 1.47 7.82 0.00 3104.70 0.00 0.38 1.25
Mean career age/power
level 7.38 5.06 1.00 79.00 3.40 6.86 10.50
Gini coefficient of career
age/power hierarchy 0.30 0.17 0.00 0.80 0.17 0.33 0.43
Note. Q1 is 1st Quartile, 25% of the numbers in the dataset; Q2 is 2nd Quartile, 50% of the numbers in
the dataset; Q3 is 3rd Quartile, 75% of the numbers in the dataset.
RESULTS
Team Power, Hierarchy and Team Success
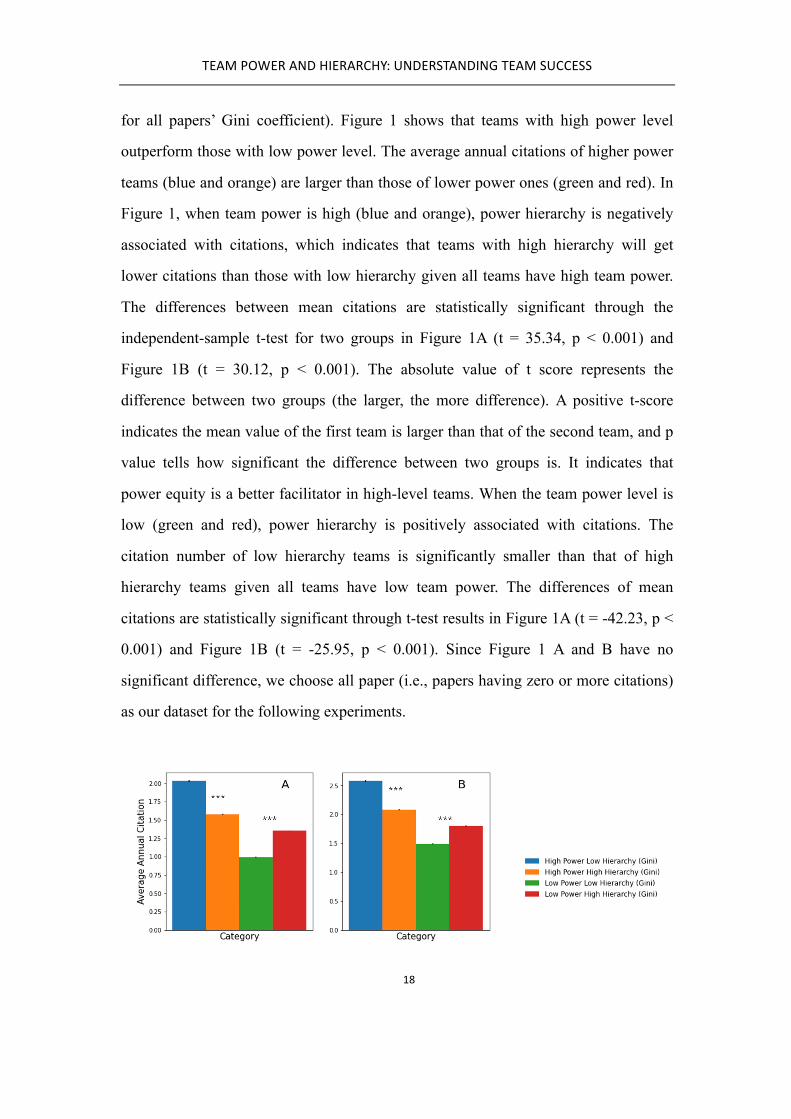
Figure 1 presents the average number of citations per year for a paper conditional on
the combinations of its power level and hierarchy of team members. Since 26.16% of
papers do not have any citation, we consider all papers including those without
citations (Figure 1A) and papers with citations (Figure 1B) separately. The horizontal
axis in Figure 1A-B shows 2×2 categories indicating the paper’s power level (i.e.,
whether this paper’s mean career age of authors is higher or lower than the median
value for all papers’ mean career age) and power hierarchy (i.e., whether this paper’s
Gini coefficient of career ages of its authors is higher or lower than the median value
Page 18
TEAMPOWERANDHIERARCHY:UNDERSTANDINGTEAMSUCCESS
18
for all papers’ Gini coefficient). Figure 1 shows that teams with high power level
outperform those with low power level. The average annual citations of higher power
teams (blue and orange) are larger than those of lower power ones (green and red). In
Figure 1, when team power is high (blue and orange), power hierarchy is negatively
associated with citations, which indicates that teams with high hierarchy will get
lower citations than those with low hierarchy given all teams have high team power.
The differences between mean citations are statistically significant through the
independent-sample t-test for two groups in Figure 1A (t = 35.34, p < 0.001) and
Figure 1B (t = 30.12, p < 0.001). The absolute value of t score represents the
difference between two groups (the larger, the more difference). A positive t-score
indicates the mean value of the first team is larger than that of the second team, and p
value tells how significant the difference between two groups is. It indicates that
power equity is a better facilitator in high-level teams. When the team power level is
low (green and red), power hierarchy is positively associated with citations. The
citation number of low hierarchy teams is significantly smaller than that of high
hierarchy teams given all teams have low team power. The differences of mean
citations are statistically significant through t-test results in Figure 1A (t = -42.23, p <
0.001) and Figure 1B (t = -25.95, p < 0.001). Since Figure 1 A and B have no
significant difference, we choose all paper (i.e., papers having zero or more citations)
as our dataset for the following experiments.
Page 19
TEAMPOWERANDHIERARCHY:UNDERSTANDINGTEAMSUCCESS
19
Note. * P < 0.05; ** P < 0.01; *** P < 0.001.
Figure 1. Team power level and hierarchy and their relationships with team success
In Figure 1, we divide high/low team power and hierarchy using the 50th percentile. In
Figure 2, we show the cutoff for high and low at different percentiles of all papers’
mean career age and Gini index: the 20th, 40th, 60th, 80th, and 100th. As the power level
increases and the hierarchy decreases, the surface becomes dark red and the average
annual citation number becomes larger. As the power level decreases and the
hierarchy decreases, the surface becomes dark blue and the average annual citation
number becomes smaller. Therefore, hierarchy empowers low power teams but
disarms high power teams. These patterns suggest that the association is not sensitive
to the percentile of cutoff.
Figure 2. The relationship between team success and power according to different percentile cutoffs
Results Considering Control Variables: Time and Team Size
Page 20
TEAMPOWERANDHIERARCHY:UNDERSTANDINGTEAMSUCCESS
20
Further analyses verify the universality of these associations for scientific teams
across different time periods and team sizes. We bin the time periods with 10-year
windows and merge the scientific papers before 1990 since these papers only occupy
1.96% of all papers. Figure 3 indicates that the results in Figure 1 still exist across all
time periods. The citation of high power low hierarchy group is significantly higher
than that of high power high hierarchy group at four stages using t-test, before 1990 (t
= 3.57, p < 0.001), 1990-2000 (t = 9.55, p < 0.001), 2000-2010 (t = 19.55, p < 0.001),
2010-2020 (t = 26.25, p < 0.001). By contrast, the citation of low power low hierarchy
teams is significantly lower than that of low power high hierarchy teams in four
different time periods using t-test, before 1990 (t = -8.86, p < 0.001), 1990-2000 (t =
-13.57, p < 0.001), 2000-2010 (t = -24.25, p < 0.001), 2010-2020 (t = -32.59, p <
0.001). We can see that the absolute value of t becomes larger with time, which
suggests that hierarchy brings larger differences to teams’ citations over time.
Especially when CS enters the 2010s, hierarchical structure produces dramatic
increases of citations for low power teams, whereas flat structure leads to the highest
citations for high power teams.
Note. * P < 0.05; ** P < 0.01; *** P < 0.001.
Figure 3. The relationship between team success and power across time periods
Page 21
TEAMPOWERANDHIERARCHY:UNDERSTANDINGTEAMSUCCESS
21
Regardless of the team size, the findings in Figure 1 are consistent in Figure 4 as well.
For papers with more than seven authors (2.38% of all papers), we merge them into
one category. The impact of high power low hierarchy group is significantly higher
than that of high power high hierarchy group across different team sizes: two
members (t = 26.50, p < 0.001), three members (t = 20.69, p < 0.001), four members
(t = 19.40, p < 0.001), five members (t = 16.12, p < 0.001), six members (t = 9.52, p <
0.001), seven members (t = 5.91, p < 0.001), and more than eight members (t = 4.38,
p < 0.001). On the contrary, the impact of low power low hierarchy teams is
significantly lower than that of low power high hierarchy teams in both small and
large teams: two members (t = -16.81, p < 0.001), three members (t = -19.82, p <
0.001), four members (t = -18.17, p < 0.001), five members (t = -13.97, p < 0.001),
six members (t = -8.93, p < 0.001), seven members (t = -5.53, p < 0.001), and more
than eight members (t = -7.89, p < 0.001). We can see that as the size of the team
grows, the t score becomes smaller for teams with high power. The results show that
teams consisting of two members most need equal communication and teams with
three to four scholars especially need hierarchy in order to achieve success.
Note. * P < 0.05; ** P < 0.01; *** P < 0.001.
Figure 4. The relationship between team success and power across different team sizes
Page 22
TEAMPOWERANDHIERARCHY:UNDERSTANDINGTEAMSUCCESS
22
In the previous analysis, we consider each variable: percentile cutoffs, time, and team
size separately. To check the robustness of our results, we run a regression model with
all variables considered in Table 2. Power level (t = 0.11, p < 0.001) and hierarchy (t =
0.51, p < 0.001) are positively related to team success. When we do not consider the
cutoff of power level and hierarchy, the coefficient of the interaction effect between
these two variables is significant (t = -0.13, p < 0.001). The negative coefficient
suggests that in teams with relatively high power, hierarchy is negatively related to
citation, whereas in teams with low power, hierarchy is positively related to citation.
The effects of hierarchy on team success is contingent on the level of team power.
Larger teams have more citations (t = 0.23, p < 0.001). Even when we include fixed
effects regarding year, the results are consistent with those previously reported.
Table 2. Linear regression results for team success based on team power and hierarchy
Variable Coef. Std. Dev.
Power level (Mean) 0.11*** 0.001
Hierarchy (Gini) 0.51*** 0.037
Power level * Hierarchy -0.13*** 0.005
Team size 0.23*** 0.001
Fixed effect: Year Yes
R2 0.01
N 4,106,991
Note. * P < 0.05; ** P < 0.01; *** P < 0.001.
DISCUSSION AND CONCLUSION
Science is no longer an individual endeavor. Countless scientific adventures and
breakthroughs have been achieved by teams of scientists. Power is pervasive in all
kinds of team collaboration and is absolutely critical for effective collaboration. Even
Page 23
TEAMPOWERANDHIERARCHY:UNDERSTANDINGTEAMSUCCESS
23
though team power has developed a rich literature in other domains, such as
healthcare (Arslanian-Engoren, 1995; Lockhart-Wood, 2000), sports (Halevy et al.,
2012; Ronay et al., 2012), the military (Goodwin et al., 2018; Salas et al., 1995), and
business management (Greer et al., 2011, 2017, 2018), understanding team power
dynamics in team collaboration is relatively new in science of science, especially on
the side of scientific collaboration (Chi & Glänzel, 2017; Wagner et al., 2011; Wang
& Wei, 2016; Zhang et al., 2018). Power in scientific teams can be manifested by
seniority, scientific status, and scholarly impact. The imbalance in power is an
intrinsic feature of scientific teams. The dispersion of team power forms hierarchies,
which can be viewed as vertical differences between team members in their
possession of team resources and their levels of authority for decision making.
Hierarchy in science is prevalent given the pervasiveness of mentoring in our
education systems. Supervisors (e.g., faculty) and subordinates (e.g., graduate
students) have significant differences in personal power in academia (Green and
Bauer, 1995). Even though a growing literature focuses on power differences from the
single dyadic relationship between mentor and mentee, it does not take the whole
team into account, like the average team power level and power hierarchy within
teams. In this paper, we clarify these concepts of team power and hierarchy with
authors’ career age. This paper can help us understand the characteristics of team
power in scientific teams and provide guidance for building successful teams.
There are two different accounts about the effects of power hierarchy: the conflict
(Anderson & Brown, 2010) and functional perspectives (Greer et al., 2017).
Hierarchy provides the mechanism to facilitate team member interactions by
clarifying expectations, roles, and members’ placement in the ranks as well as by
guiding resource allocation. However, it can also create a negative pathway to team
effectiveness by heightening conflict-enabling states, such as highlighting differences
between members, opposing interests among leadership, and provoking contests and
Page 24
TEAMPOWERANDHIERARCHY:UNDERSTANDINGTEAMSUCCESS
24
conflicts within the pecking order of the team. This paper is among the first to use a
large-scale dataset to reconcile these two opposing lines of thoughts from millions of
scientific teams. The rapid rise of Computer Science has been heavily driven by
research teams in academia and industry. How to form effective AI teams is now one
of the most critical questions that executives, administrators, and leaders need urgent
answers. Therefore, it is critical to understand the recipe of success for Computer
Science teams, especially AI teams, from the power perspective. We unpack the
complex relationships between team power and success by introducing power-level as
the key moderator that determines whether hierarchy enhances or inhibits team
outcomes, inspired by Greer & Van Kleef (2010). They show that power level
moderates the effect of power dispersion on conflict resolution in business
management. In low-power groups, members accept hierarchy, thereby reducing
power struggles. When multiple high-power team members share similar resources,
egos and power competition can create conflicts and harm team function (Greer et al.,
2011). Prior research primarily relies on survey or experimental methods to explore
team hierarchy and performance. As a result, the sample size, space and time are often
limited. It is also problematic to rely on these methods since it is difficult to simulate
real-life task settings. With millions of CS papers in the DBLP dataset, we find that
power hierarchy is a two-sided sword. In different power-level teams, hierarchy plays
different roles. Compared with low-level teams, power equity is a better facilitator in
high-level teams. Our findings are consistent with the results from the study
conducted by Greer and van Kleef (2010), whose results were based on only one
international company. We also test the universality of these results in small and large
teams and in different time spans. The results tell us that a team consisting of young
students especially needs a powerful supervisor to lead to success. However, in the
teams with all-star researchers, they would need equal cooperation relationships.
These findings suggest important consequences of hierarchy in academia and point
out directions of future CS collaboration.
Page 25
TEAMPOWERANDHIERARCHY:UNDERSTANDINGTEAMSUCCESS
25
There are several limitations in this research. First, career age is a simple proxy of
power in scientific teams. We must admit there are few cases that people who are
young in the academia are more senior than the elderly in terms of knowledge and
creativity. As we have reviewed in the conceptualization of power, power can be
represented with position, expertise, ability, and perceived intelligence (Greer & Van
Kleef, 2010; Groysberg et al., 2011; Piercy, 2019). In the operationalization part, we
can consider using other variables, like h-index (Egghe & Rousseau, 2008) to measure
team power level and hierarchy. All other alternative measures could provide a
baseline for the power measurement based on career age. Second, the measure of
citation is just one dimension to evaluate scientific success. It would be interesting to
measure success using disruptive innovation (e.g., new knowledge overshadowing
past ideas) (Wu et al., 2019) or combinational novelty (e.g., atypical combination of
pre-existing knowledge components) (Uzzi et al., 2013; Liu et al., 2020). Thirdly, we
only discuss the power dynamics in CS teams. In the future, we would test the
relationship between team power and success in other domains in order to see whether
this pattern is still consistent in different disciplines.
REFERENCES
Abbasi, A., & Jaafari, A. (2013). Research impact and scholars’ geographical
diversity. Journal of Informetrics, 7(3), 683-692.
Adams, J. D., Black, G. C., Clemmons, J. R., & Stephan, P. E. (2005). Scientific
teams and institutional collaborations: Evidence from US universities, 1981–
1999. Research policy, 34(3), 259-285.
Amason, A. C., & Sapienza, H. J. (1997). The effects of top management team size
and interaction norms on cognitive and affective conflict. Journal of
management, 23(4), 495-516.
Page 26
TEAMPOWERANDHIERARCHY:UNDERSTANDINGTEAMSUCCESS
26
Amjad, T., Ding, Y., Xu, J., Zhang, C., Daud, A., Tang, J., & Song, M. (2017).
Standing on the shoulders of giants. Journal of Informetrics, 11(1), 307-323.
Anderson, C., & Brown, C. E. (2010). The functions and dysfunctions of
hierarchy. Research in organizational behavior, 30, 55-89.
Anderson, C., John, O.P., & Keltner, D. (2011). The personal sense of power. Journal
of Personality, 80(2), 313-344.
Arslanian-Engoren, C. M. (1995). Lived experiences of CNSs who collaborate with
physicians: A phenomenological study. Clinical nurse specialist CNS, 9(2), 68-74.
Bales, M. E., Dine, D. C., Merrill, J. A., Johnson, S. B., Bakken, S., & Weng, C.
(2014). Associating co-authorship patterns with publications in high-impact
journals. Journal of biomedical informatics, 52, 311-318.
Bantel, K. A., & Jackson, S. E. (1989). Top management and innovations in banking:
Does the composition of the top team make a difference?. Strategic management
journal, 10(S1), 107-124.
Bayazit, M., & Mannix, E. A. (2003). Should I stay or should I go? Predicting team
members' intent to remain in the team. Small group research, 34(3), 290-321.
Becker, G. S., & Murphy, K. M. (1992). The division of labor, coordination costs, and
knowledge. The Quarterly Journal of Economics, 107(4), 1137-1160.
Bedeian, A. G., & Mossholder, K. W. 2000. On the use of the coefficient of variation
as a measure of diversity. Organizational Research Methods, 3: 285–297.
Behfar, K. J., Mannix, E. A., Peterson, R. S., & Trochim, W. M. (2011). Conflict in
small groups: The meaning and consequences of process conflict. Small Group
Page 27
TEAMPOWERANDHIERARCHY:UNDERSTANDINGTEAMSUCCESS
27
Research, 42(2), 127-176.
Blau, P. M. (1964). Exchange and power in social life. New Brunswick.
Blau, P. M. (1977). Inequality and heterogeneity. New York: Free Press.
Boulding, K. (1989). Three faces of power. Newbury Park: Sage.
Bozeman, B., & Youtie, J. (2017). The strength in numbers: The new science of team
science. Princeton University Press, Princeton, NJ.
Bu, Y., Ding, Y., Liang, X., & Murray, D. S. (2018a). Understanding persistent
scientific collaboration. Journal of the Association for Information Science and
Technology, 69(3), 438-448.
Bu, Y., Murray, D. S., Xu, J., Ding, Y., Ai, P., Shen, J., & Yang, F. (2018b). Analyzing
scientific collaboration with “giants” based on the milestones of career. Proceedings
of the Association for Information Science and Technology, 55(1), 29-38.
Bunderson, J. S., Van Der Vegt, G. S., Cantimur, Y., & Rink, F. (2016). Different
views of hierarchy and why they matter: Hierarchy as inequality or as cascading
influence. Academy of Management Journal, 59(4), 1265-1289.
Chi, P. S., & Glänzel, W. (2017). An empirical investigation of the associations among
usage, scientific collaboration and citation impact. Scientometrics, 112(1), 403-412.
Costas, R., & Bordons, M. (2011). Do age and professional rank influence the order
of authorship in scientific publications? Some evidence from a micro-level
perspective. Scientometrics, 88(1), 145-161.
Dahl, R. A. (1957). The concept of power. Behavioral science, 2(3), 201-215.
Page 28
TEAMPOWERANDHIERARCHY:UNDERSTANDINGTEAMSUCCESS
28
Dunis, C., Middleton, P. W., Karathanasopolous, A., & Theofilatos, K.
(2016). Artificial intelligence in financial markets. London: Palgrave Macmillan.
Edmondson, A. C. (2002). The local and variegated nature of learning in
organizations: A group-level perspective. Organization science, 13(2), 128-146.
Egghe, L., & Rousseau, R. (2008). An h-index weighted by citation
impact. Information Processing & Management, 44(2), 770-780.
Fiala, D., & Tutoky, G. (2017). Computer science papers in Web of Science: A
bibliometric analysis. Publications, 5(4), 23.
Fortunato, S., Bergstrom, C. T., Börner, K., Evans, J. A., Helbing, D., Milojević, S., ...
& Barabási, A. L. (2018). Science of science. Science, 359(6379).
Fountaine, T., McCarthy, B., & Saleh, T. (2019). Building the AI-powered
organization. Harvard Business Review, July-August,
https://hbr.org/2019/07/building-the-ai-powered-organization.
Frank, M. R., Autor, D., Bessen, J. E., Brynjolfsson, E., Cebrian, M., Deming, D. J., ...
& Rahwan, I. (2019a). Toward understanding the impact of artificial intelligence on
labor. Proceedings of the National Academy of Sciences, 116(14), 6531-6539.
Frank, M. R., Wang, D., Cebrian, M., & Rahwan, I. (2019b). The evolution of citation
graphs in artificial intelligence research. Nature Machine Intelligence, 1(2), 79-85.
French, J. R. P., Raven, B. (1959). The bases of social power. In D. Cartwright and A.
Zander. Group dynamics. New York: Harper & Row.
Galinsky, A. D., Magee, J. C., Gruenfeld, D. H., Whitson, J. A., & Liljenquist, K. A.
(2008). Power reduces the press of the situation: Implications for creativity,
Page 29
TEAMPOWERANDHIERARCHY:UNDERSTANDINGTEAMSUCCESS
29
conformity, and dissonance. Journal of Personality and Social Psychology, 95(6),
1450.
Gao, Z., Fu, G., Ouyang, C., Tsutsui, S., Liu, X., Yang, J., Gessner, C., Foote, B., Wild,
D., Ding, Y., & Yu, Q. (2019). Edge2vec: Representation learning using edge
semantics for biomedical knowledge discovery. BMC Bioinformatics, 20:306.
Gingras, Y., Larivière, V., Macaluso, B., & Robitaille, J. P. (2008). The effects of
aging on researchers' publication and citation patterns. PloS one, 3(12), e4048.
Gini, C. (1936). On the measure of concentration with special reference to income and
statistics. Colorado College Publication, General Series No. 208, 73–79.
Goodwin, G. F., Blacksmith, N., & Coats, M. R. (2018). The science of teams in the
military: Contributions from over 60 years of research. American Psychologist, 73(4),
322.
Green, S. G., & Bauer, T. N. (1995). Supervisory mentoring by advisers:
Relationships with doctoral student potential, productivity, and commitment.
Personnel Psychology, 48(3), 537-562.
Greer, L. L., & Van Kleef, G. A. (2010). Equality versus differentiation: The effects of
power dispersion on group interaction. Journal of Applied Psychology, 95(6), 1032.
Greer, L. L., Caruso, H. M., & Jehn, K. A. (2011). The bigger they are, the harder they
fall: Linking team power, team conflict, and performance. Organizational Behavior
and Human Decision Processes, 116(1), 116-128.
Greer, L. L., Van Bunderen, L., & Yu, S. (2017). The dysfunctions of power in teams:
A review and emergent conflict perspective. Research in Organizational Behavior, 37,
103-124.
Page 30
TEAMPOWERANDHIERARCHY:UNDERSTANDINGTEAMSUCCESS
30
Greer, L.L., De Jong, B.A., Schouten, M.E., & Dannals, J. (2018). Why and when
hierarchy impacts team effectiveness: A meta-analytic integration. Journal of Applied
Psychology, 103, 591-613.
Groysberg, B., Polzer, J. T., & Elfenbein, H. A. (2011). Too many cooks spoil the
broth: How high-status individuals decrease group effectiveness. Organization
Science, 22(3), 722-737.
Guimera, R., Uzzi, B., Spiro, J., & Amaral, L. A. N. (2005). Team assembly
mechanisms determine collaboration network structure and team
performance. Science, 308(5722), 697-702.
Halevy, N., Chou, E. Y., Galinsky, A. D., & Murnighan, J. K. (2012). When hierarchy
wins: Evidence from the national basketball association. Social Psychological and
Personality Science, 3(4), 398-406.
Hall, K. L., Vogel, A. L., Huang, G. C., Serrano, K. J., Rice, E. L., Tsakraklides, S. P.,
& Fiore, S. M. (2018). The science of team science: A review of the empirical
evidence and research gaps on collaboration in science. American Psychologist, 73(4),
532.
Han, Y., Chen, C., Tewfik, A. H., Ding, Y., & Peng, Y. (2021). Pneumonia detection
on chest x-ray using radiomic features and contrastive learning. International
Symposium on Biomedical Imaging (IEEE ISBI 2021). April 13-16, 2021, Nice,
France.
Harrison, D. A., & Klein, K. J. (2007). What's the difference? Diversity constructs as
separation, variety, or disparity in organizations. Academy of management review,
32(4), 1199-1228.
Page 31
TEAMPOWERANDHIERARCHY:UNDERSTANDINGTEAMSUCCESS
31
Harrison, D. A., Price, K. H., Gavin, J. H., & Florey, A. T. (2002). Time, teams, and
task performance: Changing effects of surface-and deep-level diversity on group
functioning. Academy of management journal, 45(5), 1029-1045.
He, J., & Huang, Z. (2011). Board informal hierarchy and firm financial performance:
Exploring a tacit structure guiding boardroom interactions. Academy of Management
Journal, 54(6), 1119-1139.
Heider, J. (1997). The tao of leadership. Atlanta: Humanics New Age.
Insights Team (2019). How to build a great AI team. Forbes, May 22, 2019.
Katzenbach, J., & Smith, D. (1993). The Wisdom of Teams. Boston, MA: Harvard
Business School Press.
Kearney, E. , Gebert, D. , & Voelpel, S. C. . (2009). When and how diversity benefits
teams: the importance of team members' need for cognition. Academy of
Management Journal, 52(3), 581-598.
Larivière, V., Desrochers, N., Macaluso, B., Mongeon, P., Paul-Hus, A., & Sugimoto,
C. R. (2016). Contributorship and division of labor in knowledge production. Social
Studies of Science, 46(3), 417-435.
Larivière, V., Gingras, Y., & Sugimoto, C.R. (2014). Team size matters: Collaboration
and scientific impact since 1900. Journal of the Association for Information Science
and Technology, 66(7), 1323-1332.
Leavitt, H. J. (2003). Why hierarchies thrive. Harvard business review, 81(3), 96-112.
Linton, R. (1936). The study of man. New York: Appelton-Century.
Liu, M., Bu, Y., Chen, C., Xu, J., Li, D., Leng, Y., ... & Ding, Y. (2020). Can
Page 32
TEAMPOWERANDHIERARCHY:UNDERSTANDINGTEAMSUCCESS
32
pandemics transform scientific novelty? Evidence from COVID-19. arXiv preprint
arXiv:2009.12500.
Lockhart-Wood, K. (2000). Collaboration between nurses and doctors in clinical
practice. British Journal of Nursing, 9(5), 276-280.
Magee, J. C., & Galinsky, A. D. (2008). Social hierarchy: The self‐reinforcing
nature of power and status. Academy of Management annals, 2(1), 351-398
Martínez-Córcoles, M., Tomás, I., Gracia, F. J., & Peiró, J. M. (2021). The power of
empowering team leadership over time: A multi-wave longitudinal study in nuclear
power plants. Safety Science, 133, 105015.
McGrath, J. E., Arrow, H., & Berdahl, J. L. (2000). The study of groups: Past, present,
and future. Personality and social psychology review, 4(1), 95-105.
Merton RK (1973) The Sociology of Science: Theoretical and Empirical
Investigations. Chicago, IL; London: Chicago University Press.
Meyer, E., & Schroeder R. (2015). Knowledge machines: Digital transformations of
the sciences and humanities. MIT Press, Cambridge, Massachusetts.
Mueller, J. S. (2012). Why individuals in larger teams perform worse. Organizational
behavior and human decision processes, 117(1), 111-124.
Piercy, C. W. (2019). Problem Solving in Teams and Groups. University of Kansas
Libraries.
Ronay, R., Greenaway, K., Anicich, E. M., and Galinsky, A. D. (2012). The path to
glory is paved with hierarchy when hierarchical differentiation increases group
effectiveness. Psychological Science, 23(6), 669–77.
Page 33
TEAMPOWERANDHIERARCHY:UNDERSTANDINGTEAMSUCCESS
33
Russell, B. (1938). Power: A new social analysis. London: Allen and Unwin.
Salas, E., Bowers, C. A., & Cannon-Bowers, J. A. (1995). Military team research: 10
years of progress. Military Psychology, 7(2), 55-75.
Satterly, B. A., Cullen, J., & Dyson, D. A. (2018). The intergenerational mentoring
model: An alternative to traditional and reverse models of mentoring. Mentoring &
Tutoring: Partnership in Learning, 26(4), 441-454.
Simmons, B. (2012, July 10). A-Rod is a clubhouse guy? In a manner of speaking, yes?
ESPN.com. Retrieved from http://sports.espn.go.com/espn/magazine/archives/news/
story?page=magazine-20090420-article3.
Staats, B. R., Milkman, K. L., & Fox, C. R. (2012). The team scaling fallacy:
Underestimating the declining efficiency of larger teams. Organizational Behavior and
Human Decision Processes, 118(2), 132-142.
Tang, J., Fong, A. C., Wang, B., & Zhang, J. (2012). A unified probabilistic
framework for name disambiguation in digital library. IEEE Transactions on
Knowledge and Data Engineering, 24(6), 975-987.
Tang, J., Zhang, J., Yao, L., Li, J., Zhang, L., & Su, Z. (2008). Arnetminer: extraction
and mining of academic social networks. In Proceedings of the 14th ACM SIGKDD
international conference on Knowledge discovery and data mining (pp. 990-998).
Tang, X., Li, X., Ding, Y., Song, M., & Bu, Y. (2020). The pace of artificial
intelligence innovations: Speed, talent, and trial-and-error. Journal of
Informetrics, 14(4), 101094.
Thamhain, H. J. (2003). Managing innovative R&D teams. R&d Management, 33(3),
297-311.
Page 34
TEAMPOWERANDHIERARCHY:UNDERSTANDINGTEAMSUCCESS
34
Thamhain, H. J. (2004). Team leadership effectiveness in technology-based project
environments. Project Management Journal, 35(4), 35-46.
Uzzi, B., Mukherjee, S., Stringer, M., & Jones, B. (2013). Atypical combinations and
scientific impact. Science342, 468-472.
Wagner, C. S., Roessner, J. D., Bobb, K., Klein, J. T., Boyack, K. W., Keyton, J., ... &
Börner, K. (2011). Approaches to understanding and measuring interdisciplinary
scientific research (IDR): A review of the literature. Journal of informetrics, 5(1),
14-26.
Wang, Q., & Wei, S. (2016). Heterogeneous expertise, knowledge spillover and
productivity: Does cognitive distance in research collaboration matter.
Whitley, R. (2000). The Intellectual and Social Organization of the Sciences (2nd ed.).
Oxford: Oxford University Press.
Woolley, A. W., Chabris, C. F., Pentland, A., Hashmi, N., & Malone, T. W. (2010).
Evidence for a collective intelligence factor in the performance of human groups.
science, 330(6004), 686-688.
Woolley, A. W., Gerbasi, M. E., Chabris, C. F., Kosslyn, S. M., & Hackman, J. R.
(2008). Bringing in the experts: How team composition and collaborative planning
jointly shape analytic effectiveness. Small Group Research, 39(3), 352-371.
Wu, L., Wang, D., & Evans, J. A. (2019). Large teams develop and small teams
disrupt science and technology. Nature, 566(7744), 378-382.
Wuchty, S., Jones, B. F., & Uzzi, B. (2007). The increasing dominance of teams in
production of knowledge. Science, 316(5827), 1036-1039.
Page 35
TEAMPOWERANDHIERARCHY:UNDERSTANDINGTEAMSUCCESS
35
Yin, Y., & Wang, D. (2017). The time dimension of science: Connecting the past to
the future. Journal of Informetrics, 11(2), 608-621.
Yuan, S., Shao, Z., Wei, X., Tang, J., Hall, W., Wang, Y., ... & Wang, Y. (2020).
Science behind AI: the evolution of trend, mobility, and
collaboration. Scientometrics, 124(2), 993-1013.
Zhai, Y., Ding, Y., & Zhang, H. (2021). Innovation adoption: Broadcasting vs. Virality.
Journal of the Association for Information Science and Technology, 72(4), 403-416.
Zhang, C., Bu, Y., & Ding, Y. (2019). Does diversity of team members affect
scientific success of a team? A preliminary study. iConference 2019 Proceedings.
Zhang, L., Sun, B., Chinchilla-Rodríguez, Z., Chen, L., & Huang, Y. (2018).
Interdisciplinarity and collaboration: on the relationship between disciplinary
diversity in departmental affiliations and reference lists. Scientometrics, 117(1),
271-291.