14
TEAP STUDY IA 44 CORRIDOR STUDY BETWEEN Y AVE/COUNTY LINE ROAD AND BROOKSIDE DRIVE Grimes/Polk County, Iowa | April 27, 2018

TEAP STUDY
IA 44 CORRIDOR STUDY
BETWEEN Y AVE/COUNTY LINE ROAD AND BROOKSIDE DRIVE
Grimes/Polk County, Iowa | April 27, 2018
TEAP STUDY IA 44 Traffic Study
Between Y Ave/County Line Road and Brookside Drive
Grimes/Polk County, Iowa | April 27, 2018
Prepared for:
IOWA DOT
City of Grimes 101 NE Harvey St
Grimes, Iowa 50111
Snyder & Associates, Inc. Project No. 115.1000.01K Prepared by: I hereby certify that this Engineering Document was prepared by me or
under my direct personal supervision and that I am a duly Licensed Professional Engineer under the Laws of the State of Iowa.
Mark A. Perington, P.E. Date License Number 12399 My License Renewal Date is December 31, 2019.
Pages or sheets covered by this seal:
V:\Projects\2015\115.1000.01K\StudiesReports\TEAP_2018-05-31_IA44-Grimes_DRAFT.docx
May 31, 2018 Mr. Jake Anderson City Administrator City of Grimes 101 NE Harvey St Grimes, IA 50111 RE: IA 44 CORRIDOR STUDY BETWEEN Y AVE/COUNTY LINE ROAD AND
BROOKSIDE DRIVE GRIMES, IOWA IOWA TRAFFIC ENGINEERING ASSISTANCE PROGRAM S&A PROJECT NO: 115.1000.01K
Dear Mr. Anderson, Snyder & Associates has completed the IA 44 Corridor Study. Enclosed, for your use, is a draft of the final report. The study was requested by the City of Grimes and completed as part of Iowa’s Traffic Engineering Assistance Program (TEAP). TEAP is managed by the Iowa Department of Transportation and is partially funded through the Iowa Governor’s Traffic Safety Bureau, as provided by the U.S Department of Transportation, in accordance with the provisions of Section 402, Title 23, United States Code. The opinions, findings and conclusions expressed in this report are those of Snyder & Associates, Inc. We are pleased to provide assistance to the City of Grimes through the completion of this study. Please contact us if you have any questions regarding this study. Sincerely, Snyder & Associates, Inc. Mark Perington, P.E., PTOE Project Manager Enclosures cc: Tim Crouch, P.E., Iowa DOT, Office of Traffic & Safety Scott Dockstader, P.E., Iowa DOT District 1 Kurt Bailey, P.E. Polk County Engineer

SNYDER-ASSOCIATES.COM V:\Projects\2015\115.1000.01K\StudiesReports\TEAP_2018-05-31_IA44-Grimes_DRAFT.docx
TABLE OF CONTENTS LIST OF TABLES ......................................................................................................................... i 1. Introduction ............................................................................................................................. 1 2. Existing Conditions ................................................................................................................. 1 3. Data Collection ........................................................................................................................ 2 4. Crash History ........................................................................................................................... 3 5. Speed Data ............................................................................................................................... 6 6. Traffic Signal Warrants ........................................................................................................... 7 7. Recommendations ................................................................................................................... 8 LIST OF FIGURES Figure 1: Study Area ...................................................................................................................... 1 Figure 2: 2017 Peak Hour Traffic Volumes – Brookside Dr Intersection ..................................... 2 Figure 3: 2013-2017 Collision Diagram – IA 44 & Brookside Drive ............................................ 4 Figure 4: 2013-2017 Collision Diagram – IA 44 & Y Ave/County Line Rd ................................. 5 Figure 5: Road Tube Placements .................................................................................................... 6 LIST OF TABLES Table 1: IA 44 & Brookside Drive Intersection Volumes ............................................................. 2 Table 2: Crashes by Severity (2013-2017) .................................................................................... 3 Table 3: 2017 Speed Data .............................................................................................................. 6 Table 4: Comparison of Both-Direction IA 44 85th %tile Speed Data .......................................... 7 Table 5: MUTCD Signal Warrant Analysis................................................................................... 7 APPENDIX Road tube speed data across the IA 44 corridor Road tube volume data across the IA 44 corridor 24 hour Turning movement counts at the IA 44 and Brookside Drive intersection 2012 Iowa DOT Speed Study Figures Peak hour delay report at the IA 44 and Brookside Drive intersection. Record of crashes within the study area from the year 2013 to 2017 Traffic Signal Warrant study report
IA 44 Traffic Study | 1
SNYDER-ASSOCIATES.COM V:\Projects\2015\115.1000.01K\StudiesReports\TEAP_2018-05-31_IA44-Grimes_DRAFT.docx
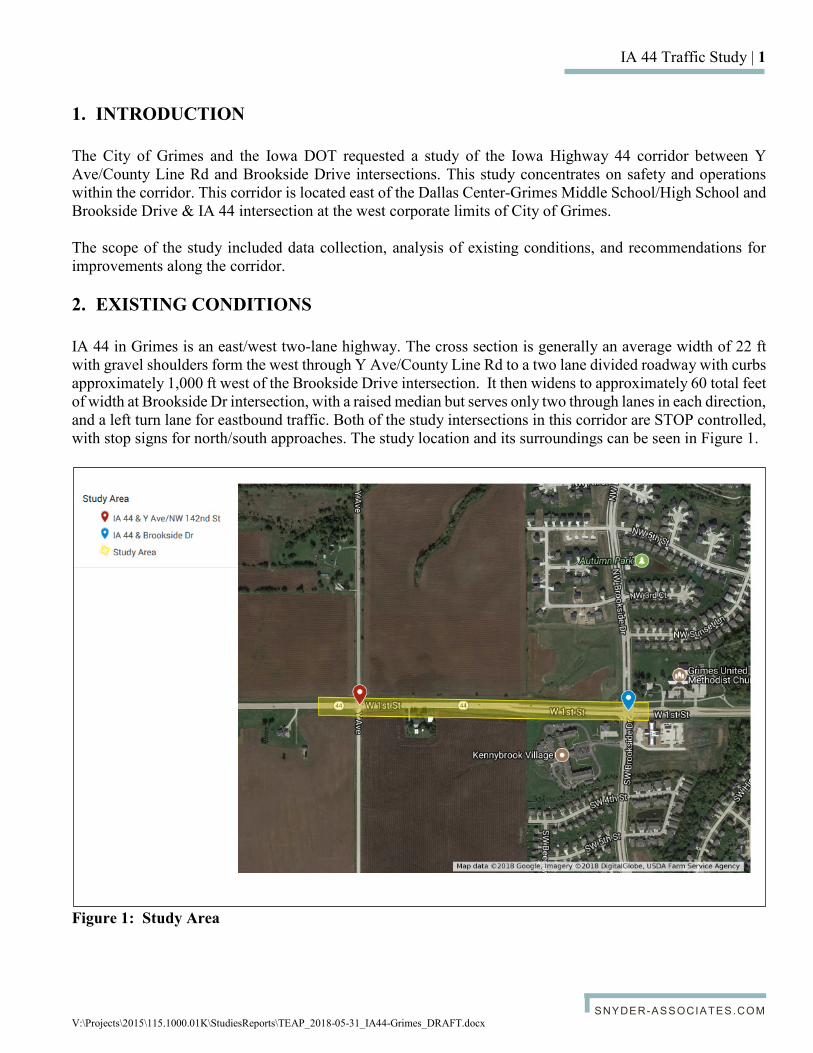
1. INTRODUCTION The City of Grimes and the Iowa DOT requested a study of the Iowa Highway 44 corridor between Y Ave/County Line Rd and Brookside Drive intersections. This study concentrates on safety and operations within the corridor. This corridor is located east of the Dallas Center-Grimes Middle School/High School and Brookside Drive & IA 44 intersection at the west corporate limits of City of Grimes. The scope of the study included data collection, analysis of existing conditions, and recommendations for improvements along the corridor. 2. EXISTING CONDITIONS IA 44 in Grimes is an east/west two-lane highway. The cross section is generally an average width of 22 ft with gravel shoulders form the west through Y Ave/County Line Rd to a two lane divided roadway with curbs approximately 1,000 ft west of the Brookside Drive intersection. It then widens to approximately 60 total feet of width at Brookside Dr intersection, with a raised median but serves only two through lanes in each direction, and a left turn lane for eastbound traffic. Both of the study intersections in this corridor are STOP controlled, with stop signs for north/south approaches. The study location and its surroundings can be seen in Figure 1.
Figure 1: Study Area

IA 44 Traffic Study | 2
SNYDER-ASSOCIATES.COM V:\Projects\2015\115.1000.01K\StudiesReports\TEAP_2018-05-31_IA44-Grimes_DRAFT.docx
The posted speed limit of IA 44 transitions through the study area. For eastbound drivers, the speed limit decreases from 55 mph to 50 mph just east of Y Ave/County Line Rd and then 40 mph approximately 150 ft west of the Brookside Drive intersection. Similarly, the westbound posted speed limit increases from 40 mph to 50mph just west of Brookside Dr and then 55 mph just east of Y Ave/County Line Rd. The posted speed limit on Brookside Drive is 25 mph in both direction. Land uses at the IA 44 and Brookside Drive intersection include a Church in the northeast quadrant, medical clinic in the southeast quadrant, and retirement community in the southwest quadrant and residential in surrounding neighborhoods. 3. DATA COLLECTION Data collection was a group effort through sources by Iowa DOT, Polk County Engineering Department, the City of Grimes, and the Engineer. Iowa DOT provided historic traffic counts, prior 2012 speed study, crash data from Iowa DOT Saver, and crash history at intersections within the corridor. The Engineer coordinated data collection, observed traffic operations, conducted spot-speed and intersection delay studies, and analyzed crash data. Traffic data was collected on a Wednesday, December 20th 2017 for a 24-hour period representative of a typical weekday with DCG Schools in session. Detailed traffic data can be found in the Appendix. Table 1 below shows daily traffic totals (two way vehicles per day, vpd) for the year 2016, per Iowa DOT counts, and 2017. Figure 2 summarizes typical weekday peak hour turn movements at Brookside Dr intersection (vehicle per hour, vph). Table 1: IA 44 & Brookside Drive Intersection Volumes
Approach 2016 Total vpd
2017 Total vpd
North approach (NW Brookside Drive) -- 1,740 South approach (SW Brookside Drive) -- 2,019 East approach (IA 44) 9,930 10,548 West approach (IA 44) 8,600 8,636
Figure 2: 2017 Peak Hour Traffic Volumes – Brookside Dr Intersection

IA 44 Traffic Study | 3
SNYDER-ASSOCIATES.COM V:\Projects\2015\115.1000.01K\StudiesReports\TEAP_2018-05-31_IA44-Grimes_DRAFT.docx
4. CRASH HISTORY Safety analysis of the study intersections and corridor was conducted to further understand current conditions and identify any predominant safety issues or potential correctable crash patterns. Iowa DOT crash data for the 2013-2017 five-year period was analyzed. Intersection crash rates were calculated as the number of crashes per million entering vehicles (CR/MEV) for the analysis period. Crash rates were then compared to the statewide average intersection crash rate established by the Iowa DOT for similar facilities which is 0.9 CR/MEV. Table 2 summarizes crash frequency by severity, injuries by severity, crash rates, and predominant major causes of reported crashes within the study area. Table 2: Crashes by Severity (2013-2017)
Study Area (Intersection/ Corridor)
Crash Severity (Injuries) Crash Rate CR/MEV
Predominant Major Cause (# Crashes) Fatal Major
Injury Minor Injury
Possible Injury PDO Total
IA 44 & Brookside Drive - - 1 (2) 1 (0) 7 9 (2) 0.43 Followed too close (4)
FTYROW: Making left turn (2)
IA 44 & County Line Rd - 2(2) 1(1) 2(3) 14 19(6) 1.01
Followed too close (6) Driving too fast for conditions (4)
IA 44 Corridor - 2(2) 3(4) 5(9) 29 39 (15) -
Followed too close (15) Driving too fast for conditions (5) FTYROW: Making left turn (3)
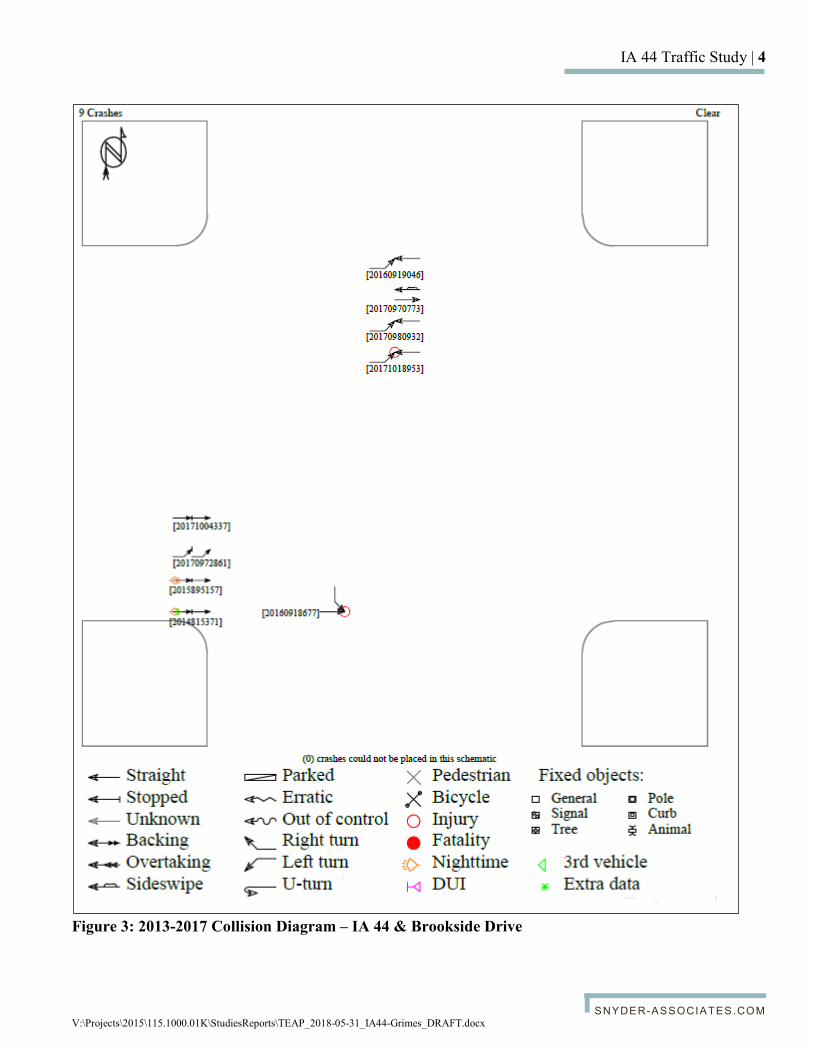
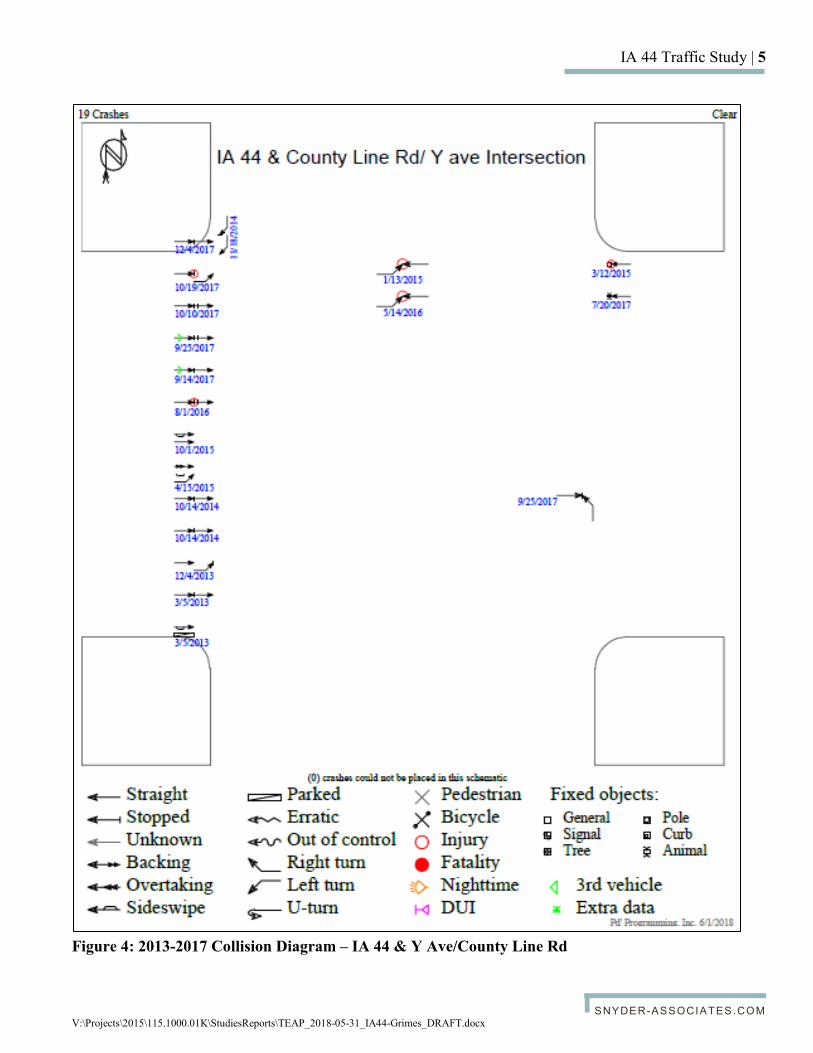
*FTYROW – Failure to yield right-of-way There were a total of 23 rear-end type of crashes along the corridor from 2013-2017. This crash pattern indicates a frequent conflict between through vehicles traveling at or above the posted speed coming into conflict with decelerating right turn vehicles or stopped vehicles making a left turn movement. Figure 3 shows the collision diagram for the IA 44 & Brookside Drive intersection. This diagram shows a pattern of rear end and left turn crashes at the intersection. 4 of the 9 crashes were rear end crashes between two westbound vehicles, and 3 of the 9 crashes were left turn angle crashes involving eastbound left turning vehicles and westbound through vehicles. These crashes are consistent with the existing lack of an eastbound left turn lane. A left turn lane would provide space for deceleration and storage of eastbound left turning vehicles, and provide an improved line of sight for left turning vehicles to see westbound conflicting vehicles and choose safe gaps to complete the left turn maneuver. As seen in Figure 2, eastbound left turn volumes are currently moderate (13-60 per hour), but will increase as development continues. Additional crash data are included in the Appendix. Figure 4 shows the collision diagram for the IA 44 & Y Ave/county Line Rd intersection. This diagram shows a pattern of rear end crashes at the intersection. 13 of the 19 crashes were between two eastbound vehicles. Notable contributing factors include citations related to driving too fast, or following too close. The driver age of 18 years or less was involved in half of the crashes, and 13 of the 19 crashes occurred between after school and evening peak hours (between 2-6pm).
IA 44 Traffic Study | 4
SNYDER-ASSOCIATES.COM V:\Projects\2015\115.1000.01K\StudiesReports\TEAP_2018-05-31_IA44-Grimes_DRAFT.docx
Figure 3: 2013-2017 Collision Diagram – IA 44 & Brookside Drive
IA 44 Traffic Study | 5
SNYDER-ASSOCIATES.COM V:\Projects\2015\115.1000.01K\StudiesReports\TEAP_2018-05-31_IA44-Grimes_DRAFT.docx
Figure 4: 2013-2017 Collision Diagram – IA 44 & Y Ave/County Line Rd
IA 44 Traffic Study | 6
SNYDER-ASSOCIATES.COM V:\Projects\2015\115.1000.01K\StudiesReports\TEAP_2018-05-31_IA44-Grimes_DRAFT.docx
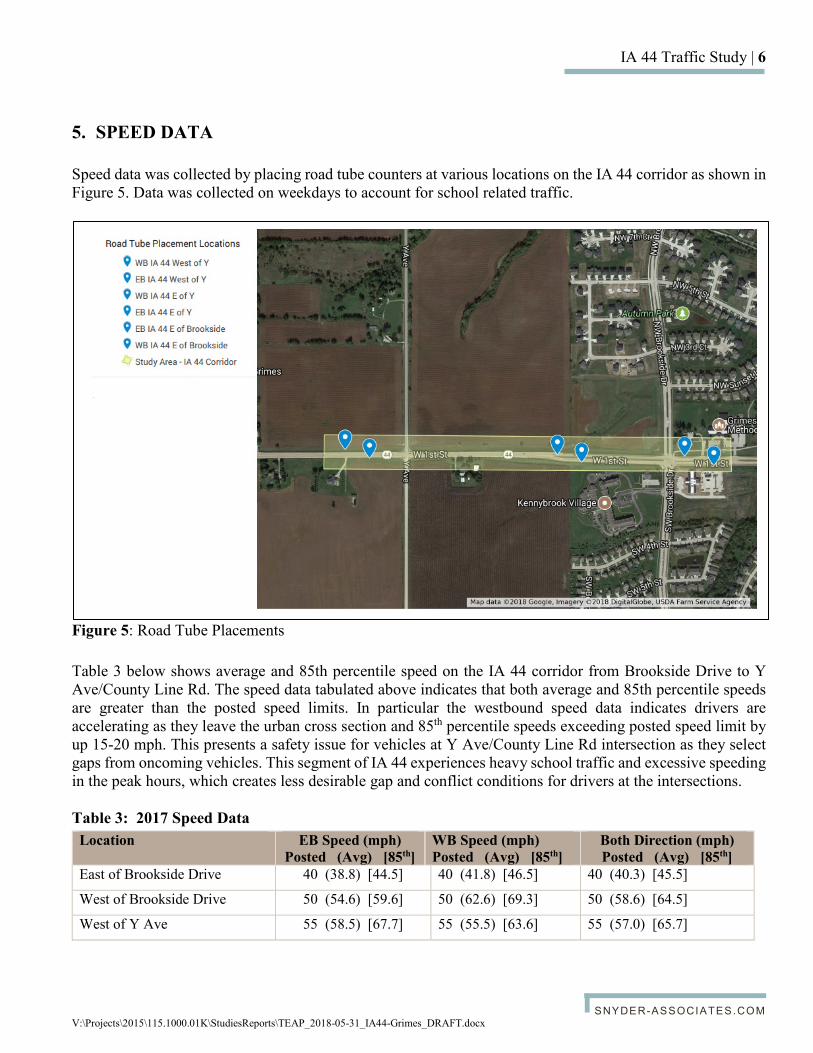
5. SPEED DATA Speed data was collected by placing road tube counters at various locations on the IA 44 corridor as shown in Figure 5. Data was collected on weekdays to account for school related traffic.
Figure 5: Road Tube Placements Table 3 below shows average and 85th percentile speed on the IA 44 corridor from Brookside Drive to Y Ave/County Line Rd. The speed data tabulated above indicates that both average and 85th percentile speeds are greater than the posted speed limits. In particular the westbound speed data indicates drivers are accelerating as they leave the urban cross section and 85th percentile speeds exceeding posted speed limit by up 15-20 mph. This presents a safety issue for vehicles at Y Ave/County Line Rd intersection as they select gaps from oncoming vehicles. This segment of IA 44 experiences heavy school traffic and excessive speeding in the peak hours, which creates less desirable gap and conflict conditions for drivers at the intersections. Table 3: 2017 Speed Data
Location EB Speed (mph) Posted (Avg) [85th]
WB Speed (mph) Posted (Avg) [85th]
Both Direction (mph) Posted (Avg) [85th]
East of Brookside Drive 40 (38.8) [44.5] 40 (41.8) [46.5] 40 (40.3) [45.5]
West of Brookside Drive 50 (54.6) [59.6] 50 (62.6) [69.3] 50 (58.6) [64.5]
West of Y Ave 55 (58.5) [67.7] 55 (55.5) [63.6] 55 (57.0) [65.7]
IA 44 Traffic Study | 7
SNYDER-ASSOCIATES.COM V:\Projects\2015\115.1000.01K\StudiesReports\TEAP_2018-05-31_IA44-Grimes_DRAFT.docx
Table 4 compares speed data from a 2012 DOT speed study and the data collected for this TEAP study. Following the 2012 speed study, posted speed limits were generally increased by 5 mph. In the year 2012, 85th percentile speeds were 7 mph over posted speed limit east of Brookside Drive, and 7 mph over posted speed limit west of Brookside Drive. In the 2017 data, 85th percentile speeds were 6 mph over posted speed limit east of Brookside Drive, and 14 mph over posted speed limit west of Brookside Drive Table 4: Comparison of Both-Direction IA 44 85th %tile Speed Data
Location DOT Study 2012 Posted [85th]
TEAP Study 2017 Posted [85th]
East of Brookside Drive 35 [42] 40 [45.5]
West of Brookside Drive 45 [52] 50 [64.5]
West of Y Ave (near School) 55 [59] 55 [65.7]
6. TRAFFIC SIGNAL WARRANTS Following the revised 2009 Edition of the Manual on Uniform Traffic Control Devices (MUTCD), traffic signal warrant criteria were evaluated at the intersection of IA 44 & Brookside Drive based on a request from the City about potential need for signalization. Traffic data utilized in this analysis included 24 hour turning movement counts collected in 2017 by Snyder & Associates using video traffic counting equipment. Table 5 summarizes the results of Traffic Signal Warrant Analysis. The analysis indicates that traffic volumes do not satisfy the traffic volume minimum criteria for warrants 1, 2 and 3. A report on the warrant analysis can be found in the Appendix. Table 5: MUTCD Signal Warrant Analysis
Traffic Signal Warrant Satisfied? (Current)
Warrant 1 (Eight Hour Vehicular Volume) No Warrant 2 (Four Hours Vehicular Volume) No Warrant 3(Peak Hour Vehicular Volume) No Warrant 4 (Pedestrian Volume) No Warrant 5 (School Crossing) N/A Warrant 6 (Coordinated Signal System) N/A Warrant 7(Crash Experience) No Warrant 8(Roadway Network) N/A Warrant 9(At-Grade Crossing) N/A
Note: A follow up spot speed study was conducted during peak hour period on a weekday to verify accuracy of road tube collected date accuracy of road tube speed data.

IA 44 Traffic Study | 8
SNYDER-ASSOCIATES.COM V:\Projects\2015\115.1000.01K\StudiesReports\TEAP_2018-05-31_IA44-Grimes_DRAFT.docx
Detailed warrant notes include: • Warrant 1 – Eight hour: The 2017 turning movement counts collected 24 hours of data and it does not
satisfy the minimum vehicular volumes for warrant 1A, 1B & 1C. Zero of eight required hours for Warrant 1A, two of eight hours for Warrant 1B are satisfied.
• Warrant 2 – Four hour: Four hours of minimum volume required but only one hour of traffic volume satisfied warrant criteria.
• Warrant 3 – Warrant 3A (Peak hour Delay) requires the minimum volume and delay on minor approach to be 150 Veh/Hr and 5 Veh-Hrs respectively. Southbound (Brookside Drive) approach volume and cumulative delay do not satisfy these criteria. Warrant 3B (Peak Hour Volume) was not satisfied for any single hour periods during the day.
• Warrant 4 – Based on traffic volumes and approach lanes at this location, this warrant would require at least 75 pedestrians per hour for four different hours or greater than 93 pedestrians in a peak hour. The pedestrian volumes collected are very low and do not satisfy the warrant criteria.
• Warrant 7 – In order to meet this warrant, a minimum of 5 correctible crashes need to have occurred within the last 12 months. Crash data obtained from the Iowa DOT indicate a total of 2 correctible crashes within the 2017 year, which does not satisfy the warrant criteria.
7. RECOMMENDATIONS Based on the analysis described above, it is recommended that increased speed enforcement be present on IA 44 between Brookside Drive and Y Ave/County Line Rd. A speed feedback sign may also be considered for installation along the corridor for both directions of traffic. This sign displays the drivers’ speeds as well as the posted speed limit, and has been shown to reduce driver’s average speeds and in particular, excessive speeding, by alerting drivers of their current speed. This would be similar to “speed feedback trailer” type devices used on a temporary basis by local law enforcement, but would be a more permanent mounting of device to a street light pole, or other pole installation adjacent to roadway. However, the increased enforcement will be necessary along with any sort of display signage to influence driver behavior. The City or County would need to work with the Department to follow appropriate permitting process for device(s) to be added to the roadway. It is also recommended that signing and lane pavement markings be placed on Brookside Drive. Indicating a right turn lane on both northbound and southbound approach while the intersection operates as a STOP controlled intersection. This would clarify lane utilization and reduce delays and improve traffic flow. Constructing a left turn only lane in the existing median on eastbound approach at the IA 44 & Brookside Drive intersection is strongly recommended. Left-turn lanes remove vehicles waiting to turn left from the through-traffic stream, thus reducing the potential for rear-end crashes. Since they provide a sheltered location for drivers to wait for a gap in opposing traffic, left-turn lanes may encourage drivers to be more selective in
IA 44 Traffic Study | 9
SNYDER-ASSOCIATES.COM V:\Projects\2015\115.1000.01K\StudiesReports\TEAP_2018-05-31_IA44-Grimes_DRAFT.docx
choosing a gap to complete the left-turn maneuver. This would also reduce the potential for crashes between left-turn and opposing through vehicles. Given operating speeds in the corridor it is recommended this turn lane be introduced with a 15:1 taper, and provide a minimum of 200 feet length to allow for proper deceleration as well as vehicle storage for current and future conditions that may include signalization. A traffic signal at the IA 44 & Brookside Drive intersection is not currently recommended. However, considering the development growth in the next few years, planning and budgeting for installation of a traffic signal in 2019 or 2020 at the intersection is recommended pending coordination with the Iowa DOT, and traffic volumes should continue to be monitored for MUTCD signal warrants. Warrants are still a criteria for installation of the traffic signal. Although Y Ave/County Line Rd does not experience excessive turning traffic demand or observed operational issues, it is clear from the crash patterns that conflicts exist with the higher operating speeds, and any slowing or stopped traffic waiting to make a left turn eastbound or right turn westbound from IA 44. With rapid growth of the community and continued growth of the school district, this intersection should be planned for improvements in the next two to five years. Improvements at a minimum would include left turn lane and right turn lanes on IA 44, and then pending development of adjacent land use the potential for a minimum of three total lanes on Y Ave/County Line Rd (an aligned left turn lane north/south with adjacent shared through/right lane, and then one receiving lane). Signalization is not recommended prior to any roadway geometric improvements unless there would be sharp increase in right angle/broadside crashes at the intersection. Most of the crashes occur during daylight hours, even during winter months, but the intersection could be evaluated by County for a possible roadway light to improve identification of the intersection. The creation of left and right turn deceleration lanes at the intersection would reduce rear end crash potential thus improvements might be eligible for Traffic Safety Improvement Program funding thought the Iowa DOT. Longer term traffic signalization of the corridor will continue to follow with adjacent land development and increased side road traffic. It is also assumed the City will work with the Iowa DOT to continue the reconstruction/widening of IA 44 westward. The urbanization of the roadway with curbs and raised median should help to impact operating speeds, which in turn may lead to continued reevaluation of the posted speed limit in the area based on driver behavior.

IA 44 Traffic Study | Appendix
SNYDER-ASSOCIATES.COM V:\Projects\2015\115.1000.01K\StudiesReports\TEAP_2018-05-31_IA44-Grimes_DRAFT.docx
APPENDIX
• Road tube speed data across the IA 44 corridor • Road tube volume data across the IA 44 corridor • 24 hour Turning movement counts at the IA 44 and Brookside Dr intersection • Peak hour delay report at the IA 44 and Brookside Dr intersection • Record of crashes within the study area from the year 2013 to 2017 • Delay report at IA 44 & Brookside Dr intersection • Traffic Signal Warrant study report


