1 TEC Trilateral Euregio Cluster S. Brezinsek InstitutfürPlasmaphysik Assoziation E UR ATO M -Forschungszentrum Jülich Spectroscopic determination of carbon erosion yields and the composition of chemically eroded molecular carbon species S. Brezinsek Institut für Plasmaphysik, Forschungszentrum Jülich GmbH, EURATOM Association, Trilateral Euregio Cluster, D-52425 Jülich, Germany to: A. Pospieszczyk, M. Stamp, G. Sergienko, A. Kirschner, P.T. Greenland, P. Wienhol ler, U. Fantz, the TEXTOR-group and JET-EFDA contributors
Transcript
1
TEC
Trilateral Euregio Cluster
S. Brezinsek
Institut für PlasmaphysikAssoziation EURATOM-Forschungszentrum Jülich
Spectroscopic determination of carbon erosion yields and the composition of chemically eroded
Thanks to: A. Pospieszczyk, M. Stamp, G. Sergienko, A. Kirschner, P.T. Greenland, P. Wienhold I. Möller, U. Fantz, the TEXTOR-group and JET-EFDA contributors
2
TEC
Trilateral Euregio Cluster
S. Brezinsek
Institut für PlasmaphysikAssoziation EURATOM-Forschungszentrum Jülich
Outline
Motivation Methods Absorption spectroscopy on hydrocarbon molecules Emission spectroscopy on hydrocarbon molecules
CD emission spectroscopy C2 emission spectroscopy
C3 emission spectroscopy
Importance of C2 - intrinsic hydrocarbon source at JET
Conclusion
3
TEC
Trilateral Euregio Cluster
S. Brezinsek
Institut für PlasmaphysikAssoziation EURATOM-Forschungszentrum Jülich
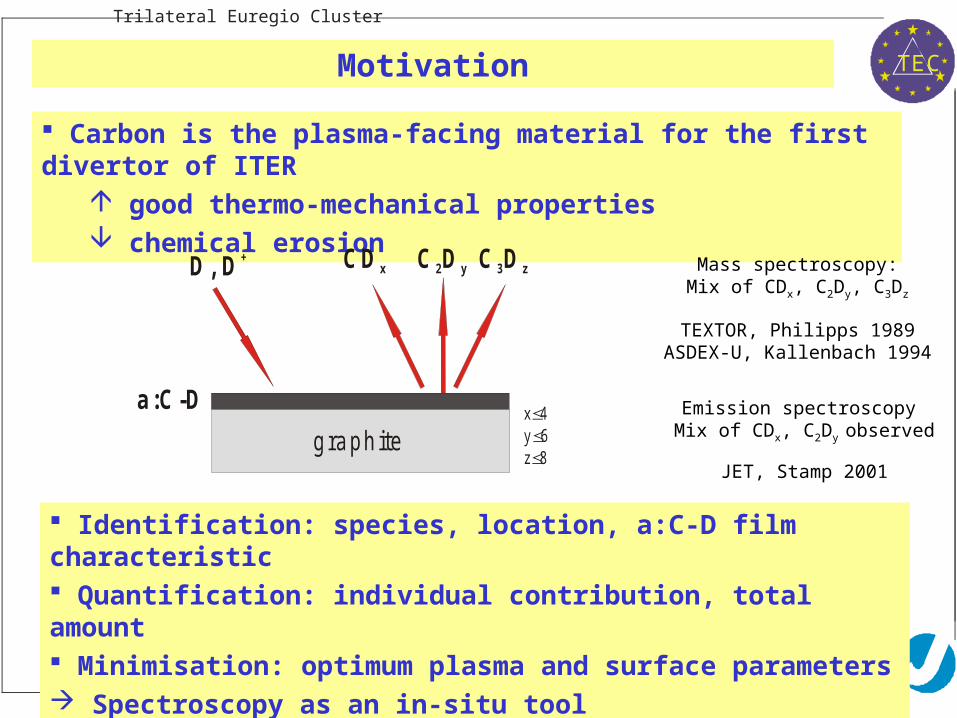
Motivation
Carbon is the plasma-facing material for the first divertor of ITER good thermo-mechanical properties chemical erosion
Mass spectroscopy:Mix of CDx, C2Dy, C3Dz
TEXTOR, Philipps 1989ASDEX-U, Kallenbach 1994
Emission spectroscopy Mix of CDx, C2Dy observed
JET, Stamp 2001
Identification: species, location, a:C-D film characteristic Quantification: individual contribution, total amount Minimisation: optimum plasma and surface parameters Spectroscopy as an in-situ tool
D, D +
graph ite
a:C-D
CD x C D2 y C D3 z
x 4y 6z 8
4
TEC
Trilateral Euregio Cluster
S. Brezinsek
Institut für PlasmaphysikAssoziation EURATOM-Forschungszentrum Jülich
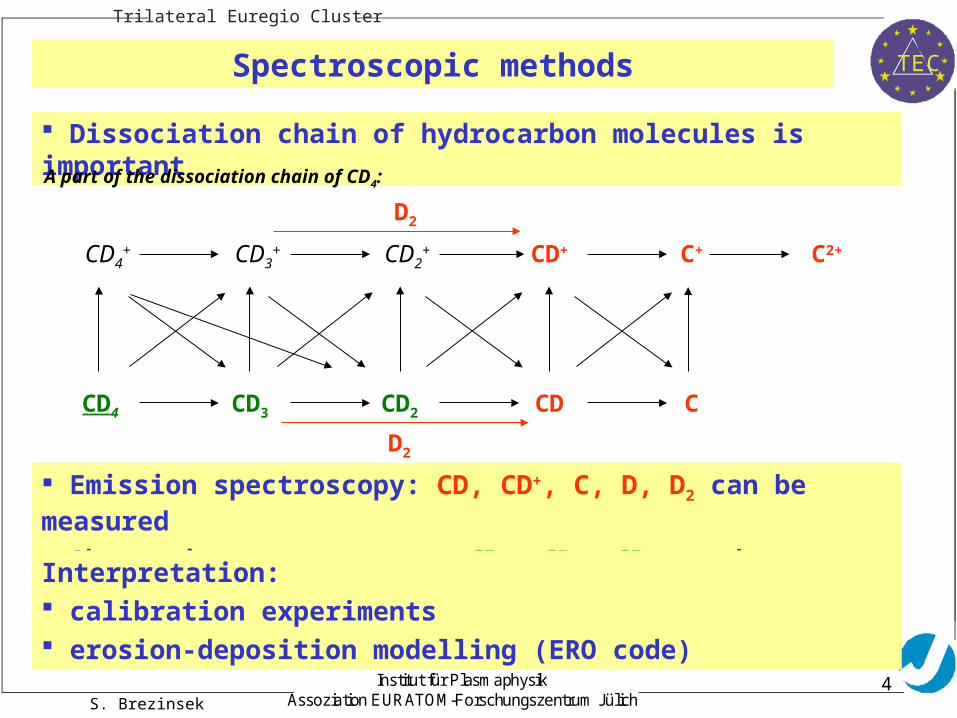
Spectroscopic methods
Dissociation chain of hydrocarbon molecules is important
CD4+
CD4
CD3+
CD3 CD2 CD C
CD2+ CD+ C+ C2+
D2
D2
A part of the dissociation chain of CD4:
Emission spectroscopy: CD, CD+, C, D, D2 can be measured
Absorption spectroscopy: CD2, CD3, CD4 can be measured
Institut für PlasmaphysikAssoziation EURATOM-Forschungszentrum Jülich
Absorption spectroscopy
Not yet tested in a tokamak – only in laboratory experiments
Absorption experiment
in TEXTOR in preparation
Database extended for CD3 and CD4
Detection of CD3 (4.8 µm) and CD4 (4.2 µm) in front of the inner limiter (graphite)
6
TEC
Trilateral Euregio Cluster
S. Brezinsek
Institut für PlasmaphysikAssoziation EURATOM-Forschungszentrum Jülich
Emission spectroscopy - CD
Calibration: CD4 injection through a gas inlet (stainless steel)
390 400 410 420 430 440
0
5
10
15
20
25
30
35
40
CD A-X transitionCD B-X transition
CD+ A-X transition
CD
CDCD+
CD4 puff - gas inlet
DD
CD+
CD
CD
CII
inte
nsi
ty /
arb
. un
its
/ nmTEXTOR # 93694
DHigh resolution survey spectrometer
simplified chain
CD4
CD3
CD2
CD
C D
gas inlet
LCFS
SOL
7
TEC
Trilateral Euregio Cluster
S. Brezinsek
Institut für PlasmaphysikAssoziation EURATOM-Forschungszentrum Jülich
Determination of the chemical erosion yield
- accessible photon flux
CD: A-X band
- inverse photon efficiencies
D CD CD4
A-X band
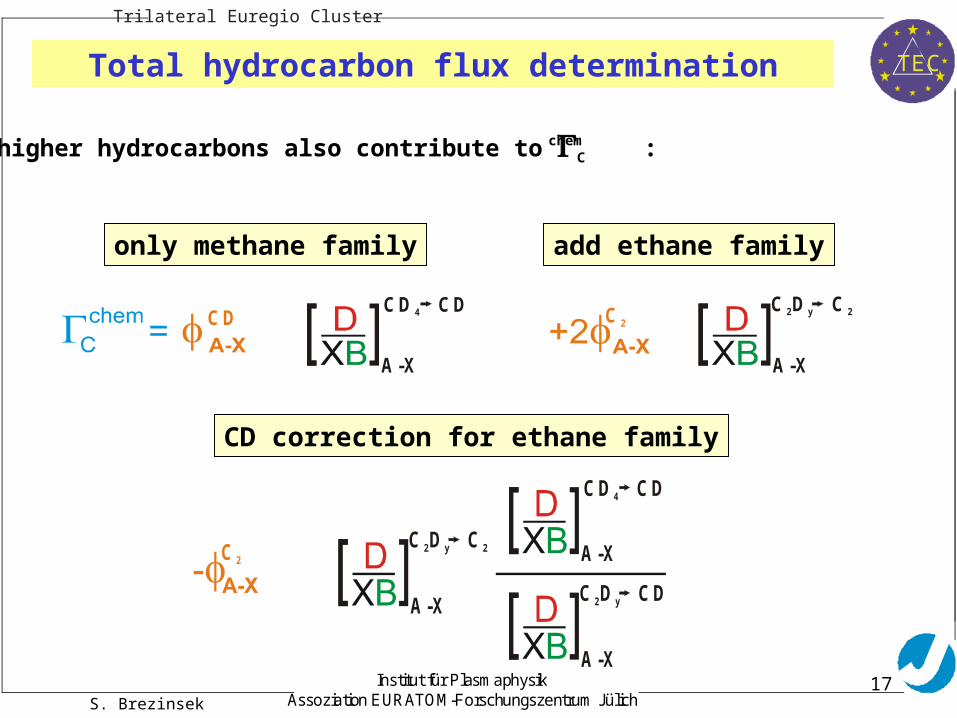
Chydrocarbon flux chem
Y =chem
C
D
chem
t
T =T =3500 Krot vib
(2-2) band
420.0 424.0 428.0 432.0 436.0
inte
ns
ity
/ ar
b. u
nit
s
/ nm
0.0
0.8
1.4
0.2
0.6
1.0
1.2
PR
Q
(1-1) band
0.4
(0-0) band
1.6Assumption: only CD4
- total photon flux
A-X spectrum simulation
XB
8
TEC
Trilateral Euregio Cluster
S. Brezinsek
Institut für PlasmaphysikAssoziation EURATOM-Forschungszentrum Jülich
Interaction with the surface (i)
450 460 470 480 490 500 510 520
0
5
10
15
C2 v=1)
C2 d-a transition
CD+ A-X transition
CD+
CD4 puff - gas inlet
D
C2 v=0)
CIII
inte
nsi
ty /
arb
. un
its
/ nmTEXTOR # 93694
CIIHigh resolution survey spectrometer
Calibration: CD4 injection through a gas inlet (stainless steel)
ion side CD 4a-C :Dlayer
After several shots: C2 appeared in the spectrum!a-C:D layer is built up
on the protection shield
Additional parameters:- surface layer growth- geometry- temperature
9
TEC
Trilateral Euregio Cluster
S. Brezinsek
Institut für PlasmaphysikAssoziation EURATOM-Forschungszentrum Jülich
Interaction with the surface (ii)
Calibration: CD4 injection through a test limiter (graphite)
C2 always detectable in the spectrum (in correlation with the injection)
500 510 520 530 540 550 560
0
500
1000
1500
2000
C2
C2
inte
nsity
/ a
rb. u
nits
/ nm
390 400 410 420 430 440
0
1000
2000
3000
4000
5000
6000
CD
inte
nsity
/ a
rb. u
nits
/ nm
TEXTOR #93732
CD
TEXTOR gas inlet
LCFS
SOL
TEXTOR limiter
LCFS
SOL
Interpretation: release of CD4 from the secondary source (film) intrinsic background conversion factors? yield determination?
More data has to be analysed!
10
TEC
Trilateral Euregio Cluster
S. Brezinsek
Institut für PlasmaphysikAssoziation EURATOM-Forschungszentrum Jülich
Emission spectroscopy – C2 (i)
Indirect measurement of C2Dy via C2 radicals
Dissocation of C2Dy can lead to CD radicals
C2D6
CDC2dissociation
chain
H H D D H e H e
0.5
1.0
1.5
0
C H (C D )
A 2" - X 2!
A S D E X U p g rad e
gas puff
m a in gas
C 2H 6C 2H 6CD 4 CD 4 CH 4CH 4
pho
ton
flux
CH
(CD
) [1
017 s
-1]
H H D D H e He
0 .5
1 .0
1 .5
0
C 2 / C H
A S D E X U p gra de
gas puff
m a in gas
C 2H 6C 2H 6CD 4 CD 4 CH 4CH 4
pho
ton
flux
ratio
C2/C
H
ASDEX-U (outer divertor, L-mode) U. Fantz 2003
C2 can be used to determine the contribution of C2Dy
significant amount of C2Dy ends up as CD
Absorption spectroscopy:
direct measurement ofC2Dy with y=1,2,4,5,6
CD C2
11
TEC
Trilateral Euregio Cluster
S. Brezinsek
Institut für PlasmaphysikAssoziation EURATOM-Forschungszentrum Jülich
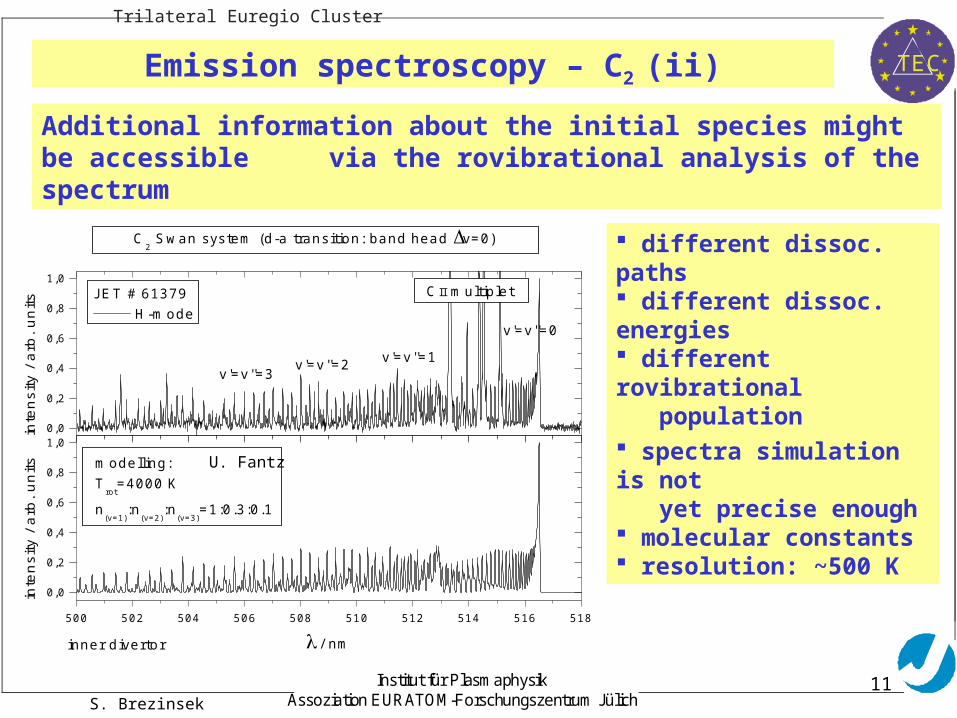
Emission spectroscopy – C2 (ii)
Additional information about the initial species might be accessible via the rovibrational analysis of the spectrum
500 502 504 506 508 510 512 514 516 518
0,0
0,2
0,4
0,6
0,8
1,0
modelling: T
rot=4000 K
n(v=1)
:n(v=2)
:n(v=3)
=1:0.3:0.1
inte
nsi
ty /
arb
. un
its
/ nm
C2 Swan system (d-a transition: band head v=0)
JET # 61379 H-mode
CII multiplet
v'=v''=1
v'=v''=0
v'=v''=3v'=v''=2
inner divertor
0,0
0,2
0,4
0,6
0,8
1,0
inte
nsi
ty /
arb
. un
its
different dissoc. paths different dissoc. energies different rovibrational population
spectra simulation is not yet precise enough molecular constants resolution: ~500 K
U. Fantz
12
TEC
Trilateral Euregio Cluster
S. Brezinsek
Institut für PlasmaphysikAssoziation EURATOM-Forschungszentrum Jülich
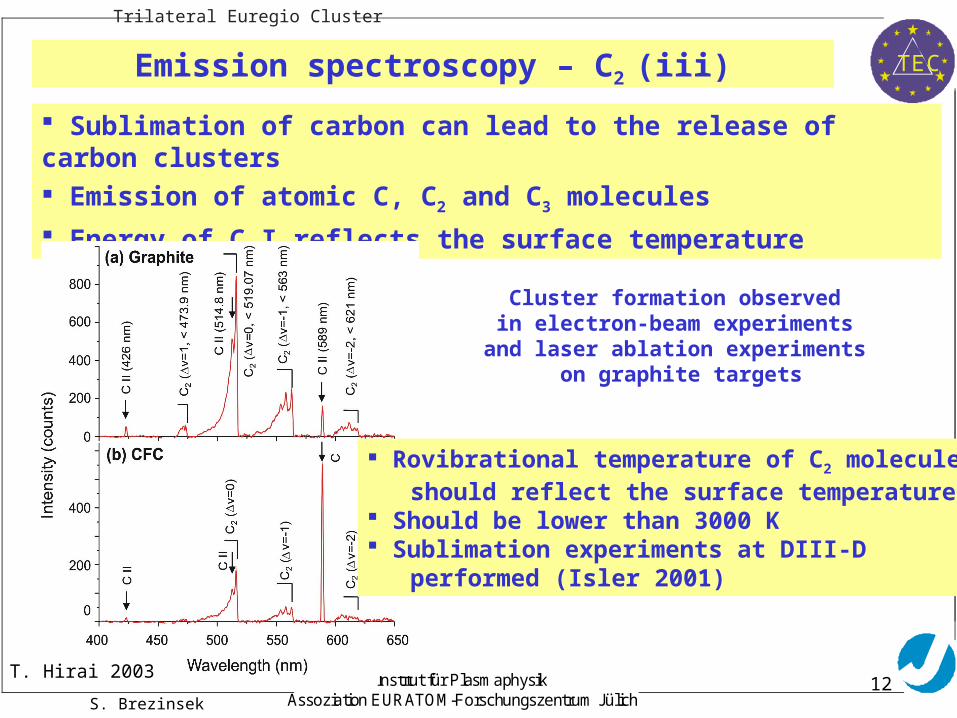
Emission spectroscopy – C2 (iii)
Sublimation of carbon can lead to the release of carbon clusters Emission of atomic C, C2 and C3 molecules
Energy of C I reflects the surface temperature
Cluster formation observed in electron-beam experiments and laser ablation experiments
on graphite targets
T. Hirai 2003
Rovibrational temperature of C2 molecules should reflect the surface temperature! Should be lower than 3000 K Sublimation experiments at DIII-D performed (Isler 2001)
13
TEC
Trilateral Euregio Cluster
S. Brezinsek
Institut für PlasmaphysikAssoziation EURATOM-Forschungszentrum Jülich
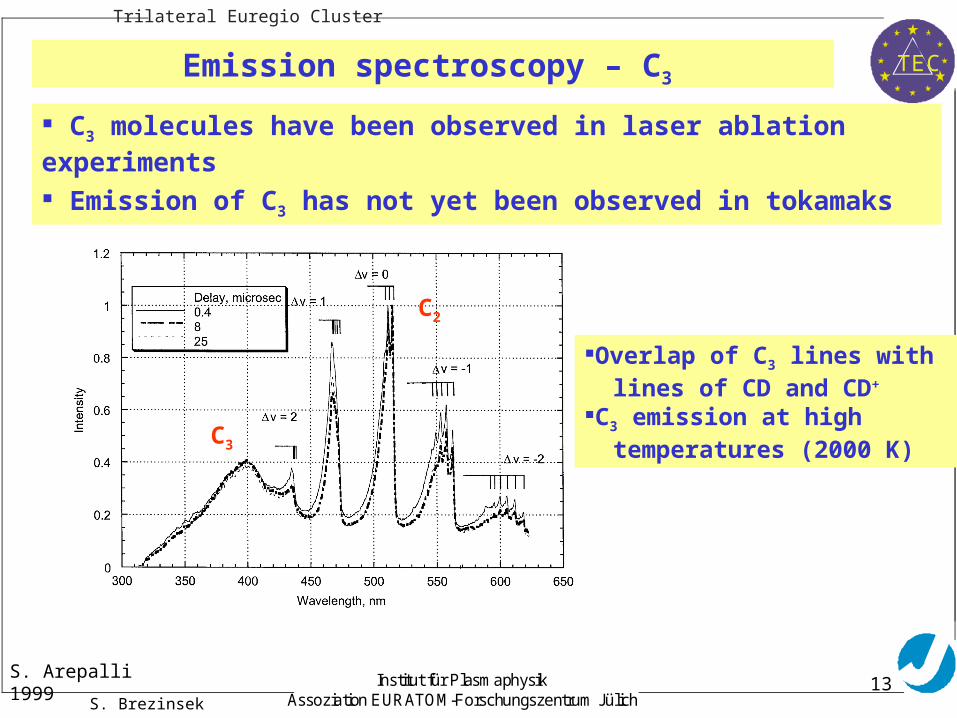
Emission spectroscopy – C3
C3 molecules have been observed in laser ablation experiments
Emission of C3 has not yet been observed in tokamaks
S. Arepalli 1999
C3
C2
Overlap of C3 lines with lines of CD and CD+
C3 emission at high temperatures (2000 K)
14
TEC
Trilateral Euregio Cluster
S. Brezinsek
Institut für PlasmaphysikAssoziation EURATOM-Forschungszentrum Jülich
JET divertor
Strong C2 emission observed at different locations in the JET divertor
here: corner region of the inner divertor
Normal spectrum Strong C2 emission spectrum
425 450 475 500 525 550 575 600
0,0
2,0x10⁴
4,0x10⁴
6,0x10⁴
8,0x10⁴
1,0x10⁵
1,2x10⁵
1,4x10⁵
1,6x10⁵
d-av=-1
d-av=-2
d-av=-1
D
CII
CII
CII
C2
C2
C2
CIII
CII
D
inte
nsity
/ ar
b. u
nits
/ nm
JET # 56975 KS3A ch4 t=54.7 sinner divertor
CD
C2
d-av=0
425 450 475 500 525 550 575 600
0,0
2,0x10⁴
4,0x10⁴
6,0x10⁴
8,0x10⁴
1,0x10⁵
1,2x10⁵
1,4x10⁵
1,6x10⁵
inte
nsi
ty /
arb
. un
its
/ nm
JET # 56975 KS3A ch4 t=62.5 sinner divertor
CII
D
CIII
CDCII D
CII
C2
15
TEC
Trilateral Euregio Cluster
S. Brezinsek
Institut für PlasmaphysikAssoziation EURATOM-Forschungszentrum Jülich
JET divertor
Strong C2 emission observed at different locations in the JET divertor
Always: on the shoulder of the inner divertor
Near to the strike point: L-mode: corner region of the inner divertor H-mode: horizontal plate inner and outer divertor
C2
C2
C2
P. Coad 2003
radius / m
16
TEC
Trilateral Euregio Cluster
S. Brezinsek
Institut für PlasmaphysikAssoziation EURATOM-Forschungszentrum Jülich
Conclusion
Emission spectroscopy can provide information about a-C:D layers Observation of different molecular species is necessary: CD, C2 ...
Interpretation is challenging owing to the indirect measurement In-situ calibration of photon fluxes is important
Main release of CD4 and C2Dy from a-C:D layers likely (no C3)
Contribution of C2Dy to the formation of CD has to be considered for
total hydrocarbon flux determination erosion yield determination
Rovibrational analysis has to be improved (molecular data) to give
information about the initial hydrocarbon species
17
TEC
Trilateral Euregio Cluster
S. Brezinsek
Institut für PlasmaphysikAssoziation EURATOM-Forschungszentrum Jülich