Procedia Computer Science 00 (2012) 1–10 Procedia Computer Science International Conference on Computational Science, ICCS 2012 TECA: A Parallel Toolkit for Extreme Climate Analysis Prabhat, Oliver R¨ ubel, Surendra Byna, Kesheng Wu, Fuyu Li, Michael Wehner and Wes Bethel Lawrence Berkeley National Laboratory Abstract We present TECA, a parallel toolkit for detecting extreme events in large climate datasets. Modern climate datasets expose parallelism across a number of dimensions: spatial locations, timesteps and ensemble members. We design TECA to exploit these modes of parallelism and demonstrate a prototype implementation for detecting and tracking three classes of extreme events: tropical cyclones, extra-tropical cyclones and atmospheric rivers. We process a modern TB-sized CAM5 simulation dataset with TECA, and demonstrate good runtime performance for the three case studies. Keywords: Feature Detection and Tracking, Parallel Analysis, Climate Analysis 1. Introduction Modern climate simulations produce massive amounts of data. Commonly used models such as the Community Earth System Model (CESM) and Weather Research and Forecasting model (WRF) routinely produce tens of GBs of data. Next generation Global cloud resolving simulations will soon produce TBs of data on a per-timestep basis. Coordinated multi-model ensembles of climate model simulations such as the Coupled Model Intercomparison Project (CMIP3) [1] contain hundreds of GBs today, CMIP5 [2] will contain tens of TBs in the near future. Such datasets have presented tremendous opportunities in terms of sophisticated analysis (time-series, geo-spatial, pattern detection, etc.) to further our understanding of the climate system. Indeed such ensembles are a crucial tool for international and national organizations, such as the Intergovernmental Panel on Climate Change (IPCC), tasked to assess the human role in climate change and the potential of adaptation and mitigation strategies. While valuable insight has been gained from such datasets, the sheer size of the CMIP3 archive has present signif- icant challenges to the climate science community. The increased magnitude of CMIP5 in terms of both data volume as well as complexity is limiting it potential uses. Conventional visualization and analysis tools, such as CDAT [3], ferret [4], and nco [5], continue to rely on a serial execution model, fundamentally limiting the applicability of such tools to large datasets. As higher resolution climate models enter the mainstream, insurmountable obstacles will face the climate community if these limitations are not removed. While efforts, such as UV-CDAT [6], ParCAL [7] and PAGODA [8] are currently underway, advanced capabilities, such as machine learning and spatio-temporal analysis, remain out of reach for most tools. Such limitations on the ability of climate scientists to exploit these large datasets are unnecessary, as large supercomputing systems and commodity clusters are now commonly available and provide ample horsepower to facilitate sophisticated analysis. In this work, we build on current parallel computing hardware and distributed memory programming models to develop capabilities for analyzing modern massive climate datasets.
Transcript
Procedia Computer Science 00 (2012) 1–10
Procedia ComputerScience
International Conference on Computational Science, ICCS 2012
TECA: A Parallel Toolkit for Extreme Climate Analysis
Prabhat, Oliver Rubel, Surendra Byna, Kesheng Wu, Fuyu Li, Michael Wehner and Wes Bethel
Lawrence Berkeley National Laboratory
Abstract
We present TECA, a parallel toolkit for detecting extreme events in large climate datasets. Modern climate datasetsexpose parallelism across a number of dimensions: spatial locations, timesteps and ensemble members. We designTECA to exploit these modes of parallelism and demonstrate a prototype implementation for detecting and trackingthree classes of extreme events: tropical cyclones, extra-tropical cyclones and atmospheric rivers. We process amodern TB-sized CAM5 simulation dataset with TECA, and demonstrate good runtime performance for the threecase studies.
Keywords:Feature Detection and Tracking, Parallel Analysis, Climate Analysis
1. Introduction
Modern climate simulations produce massive amounts of data. Commonly used models such as the CommunityEarth System Model (CESM) and Weather Research and Forecasting model (WRF) routinely produce tens of GBsof data. Next generation Global cloud resolving simulations will soon produce TBs of data on a per-timestep basis.Coordinated multi-model ensembles of climate model simulations such as the Coupled Model Intercomparison Project(CMIP3) [1] contain hundreds of GBs today, CMIP5 [2] will contain tens of TBs in the near future. Such datasetshave presented tremendous opportunities in terms of sophisticated analysis (time-series, geo-spatial, pattern detection,etc.) to further our understanding of the climate system. Indeed such ensembles are a crucial tool for international andnational organizations, such as the Intergovernmental Panel on Climate Change (IPCC), tasked to assess the humanrole in climate change and the potential of adaptation and mitigation strategies.
While valuable insight has been gained from such datasets, the sheer size of the CMIP3 archive has present signif-icant challenges to the climate science community. The increased magnitude of CMIP5 in terms of both data volumeas well as complexity is limiting it potential uses. Conventional visualization and analysis tools, such as CDAT [3],ferret [4], and nco [5], continue to rely on a serial execution model, fundamentally limiting the applicability of suchtools to large datasets. As higher resolution climate models enter the mainstream, insurmountable obstacles will facethe climate community if these limitations are not removed. While efforts, such as UV-CDAT [6], ParCAL [7] andPAGODA [8] are currently underway, advanced capabilities, such as machine learning and spatio-temporal analysis,remain out of reach for most tools. Such limitations on the ability of climate scientists to exploit these large datasetsare unnecessary, as large supercomputing systems and commodity clusters are now commonly available and provideample horsepower to facilitate sophisticated analysis. In this work, we build on current parallel computing hardwareand distributed memory programming models to develop capabilities for analyzing modern massive climate datasets.
/ Procedia Computer Science 00 (2012) 1–10 2
Climate model output exposes ample parallelism across multiple dimensions. Typically, it is possible to run theanalysis code across individual ensemble members, timesteps, spatial regions and individual grid points. For instance,hurricane detection can be performed independently across models with perturbed physics (ensembles), years, spatialregions (northern hemisphere vs. southern hemisphere) and grid locations. Therefore, it is imperative that we designand develop analysis capabilities that exploit the high degree of parallelism in climate datasets, and overcome thelarge data challenges in the climate community.
TECA (Toolkit for Extreme Climate Analysis) is our first step in this direction. We are interested in the charac-terization of extreme climate events (tropical cyclones, extra-tropical cyclones, atmospheric rivers, etc.). While thesespecific events may be characterized by different features (which we discuss Section 3), we note that the majority ofthe runtime is dominated by the feature detection step, which can exploit temporal and spatial parallelism to goodeffect. Moreover, the specifics of implementing these flavors of parallelism are independent of the feature in consid-eration; therefore, we designed TECA to do the heavy lifting in terms of loading data and providing spatial/temporalparallelism, allowing developers to concentrate on implementing the particulars for each feature/event type.
To summarize, we prescribed the following design goals for TECA:
• The toolkit should provide support for spatial and temporal parallelism• It should be easy to create an end-to-end custom analysis application• It should be easy to add new feature detection algorithms• The toolkit should provide climate-specific convenience functions, e.g., for loading NetCDF files, supporting
calendars, etc.
We have achieved a number of these goals in the current TECA implementation. In the following we first discussthe TECA software design (Section 2) and present three use cases that illustrate the toolkit in action (Section 3).We present related work and discuss the current state of TECA and avenues for future work in Sections 4 and 5,respectively.
2. TECA Software Design
As outlined in the previous section, our design goal for TECA was to design a general framework for handlingvarious flavors of data parallelism (spatial, temporal) and to implement common features required by every featuretracking/detection algorithm (e.g. loading NetCDF files, handling multiple calendaring systems, etc). We designedand implemented TECA in C++; the distributed features were implemented using MPI.
From the perspective of a developer who wants to implement a new feature detection and tracking algorithm inTECA, he/she needs to be able to specify a sequence of tasks and the input (data) and output (results) to/from the task.Within a task, the developer has access to a 1D/2D/3D sub-block of data, and can implement the particulars of thefeature detection technique. Note that the developer does not make distributed MPI calls, nor does he/she have to bebogged down with details of how the data was made available to the tasks. All he/she has to do is to iterate over theirlocal sub-block and process the data.
Results of the detection technique are typically stored in a local table, which can be subsequently aggregated to aglobal table on a serial post-processing task. The developer writes custom code to analyze the contents of the tableand generate the final results (statistics, tracks, etc).
We now examine the specifics of the TECA software design illustrated by Figure 1:
• Custom analysis tasks, such as feature detection and trajectory analysis, can be developed by inheriting fromT ECA base task. To interface the analysis with TECA and to define the data exchanged between consecutiveanalysis tasks, the developer needs to implement three virtual functions of T ECA base task to: i) prepare theinput data, ii) analyze the input data, and iii) prepare the output data. To ease parallelization of the analysis,TECA already provides a set of derived standard task-types (e.g., T ECA base f iletask), which implement thesplitting of the analysis into subtasks.• Each task has access to local data via T ECA base data, this includes information about local subtasks as well
associated user data. T ECA base data is used to specify the input and output of an analysis task.
+synchronizeTable() +sortTable() +add/get data functions …
Comment: The synchronize and sort functionality of the TECA_MPI_table make Concat obsolete
mAnalysisTasks <>
Figure 1: Class diagram of TECA and illustration of a parallel implementation of the tropical cyclone detection.
• Output from each task is typically written to T ECA MPI table. T ECA MPI table implements a general dis-tributed data table, which allows subtasks to store their results —such as cyclone locations— to the table whilethe table provides functionality for synchronization of the table data (i.e., gather/collect the data across MPItasks) as well as for sorting the data records according to a user-defined subset of data dimensions (columns),e.g., yy:mm:dd. The structure of the table is defined by the application code itself. A column can be addedto the table via a simple function call specifying the name and data type (e.g. double, int, char) for the newcolumn. To populate the table with data, T ECA MPI table provides addRow(...) and setItem(...) functions tocreate new data records and to define the value for a particular data item, respectively.• A custom application is designed by inheriting from T ECA base and specifying a series of tasks, and their
serial or parallel execution modes.
This design provides flexibility to the developer in implementing the serial analysis code independent of TECA,and then parallelizing the analysis by defining simple T ECA base task wrappers. This approach can be readilyutilized for porting existing serial analysis applications to parallel platforms. At the same time, a developer can easilyimplement new analysis methods directly in TECA with minimal overhead. Consequently, developers can betterfocus on the analysis problem at hand while TECA manages aspects of parallelization, data aggregation and chainingmultiple analysis tasks in a pipelined fashion.
In the current implementation, TECA enables task classes to natively support parallelization over time (file+timestep)and data records (rows) of a data table. While it is preferable to have a 1-1 mapping between processing cores andtimesteps, TECA enables users to process an arbitrary number of timesteps on each processing core. In the future,we plan to enable task classes to support spatial and spatio-temporal parallelism in addition. Currently, interfaces forloading NetCDF metadata are provided, but individual tasks make I/O calls on their own; we will address this in thefuture.
/ Procedia Computer Science 00 (2012) 1–10 4
3. Application Case Studies
We now apply the TECA framework for three large scale climate analysis problems, namely those of automaticallydetecting and tracking tropical cyclones, extra-tropical cyclones, and atmospheric rivers in climate model output. Thegoal of the analysis is to characterize frequency and distribution of these important extreme events. The results ofsuch analysis is useful for validating the accuracy of climate models in reproducing these events and investigating thechanges in such events under different future scenarios.
All three case studies process high frequency output data from the Community Atmospheric Model (CAM5.1) at0.25 degree resolution or approximately 28km at the equator. Data is stored at a temporal frequency of 3-hours. Eighttime steps, corresponding to a single day, are stored in individual NetCDF files. The typical size of a single NetCDFfile is 430MB; a year corresponds to roughly 156GB. The entire simulation output available to us is 4.2TB in sizeand corresponds to 27 simulated years (1979-2005). However, not all of the data is read and processed by differentanalysis problems. All analysis is performed on hopper, a Cray XE6 system at NERSC. Each node of the hoppersystem consists of 24 AMD cores with 32GB of memory. The system uses a Seastar network as the communicationinterconnect, and a lustre filesystem for parallel I/O. We use a simple file-per-process I/O strategy for the readingstage.
3.1. Tropical Cyclones
3.1.1. Scientific MotivationTropical storms are one of the most damaging climate events in terms of monetary destruction and loss of human
life [9]. Better understanding of the future trend of frequency and severity of the tropical storms is critical to assessingimpacts of climate change. High resolution climate models run under different scenarios of human activity provide atool to project these trends [9, 10, 11]. These models are tested by performing simulations of the recent past, so theiroutput can be compared against available observations. After assessing a model against these observations, they arerun far into the future to investigate how tropical storm characteristics might change.
3.1.2. AlgorithmWe begin our investigation by considering the TSTORMS code, originally developed at the Geophysical Fluid
Dynamics Library [11] for detecting tropical storms. The TSTORMS code is representative of many such climateanalysis programs: it processes climate model output one time step at a time, reads a handful of variables from themodeling output and then performs a series of computations to produce a relatively small set of candidate points. Thedetection step requires the majority of the computation time, and is characterized by the following conditions outlinedin [11]:
1. Vortex is defined as the local relative vorticity maximum at the 850 hPa pressure isosurface. To be consideredas a tropical storm, the maximum vorticity must exceed 1.6 × 10⁻⁴s−1, where the vorticity is the curl of windvelocity, and s denotes time in seconds.
2. Low pressure core is defined as a local minimum of the sea surface pressure. From the low pressure coreoutward, the surface pressure must increase by at least 4 hPa within a radius of 5 degrees. The local pressureminimum must be within a distance of 2 degrees latitude and longitude from the vorticity maximum. Thispressure minimum is generally regarded as the storm center.
3. Warm-core is a local maximum of average temperature between 300 and 500 hPa. From the center of thewarm-core outward, the temperature must decrease by at least 0.8 degrees Celsius in all directions within adistance of 5 degrees. The distance of the warm-core center from the storm center may not exceed 2 degrees.
All grid points that satisfy these multi-variate conditions form candidates for the next processing step. A stitchingphase is now invoked, which essentially places spatio-temporal constraints involving the speed of tropical storms,the tendency to move poleward and westward and a specified minimum temporal duration. Such criteria are used toassign candidate points to individual tracks and resolve ties. The final output are individual storm tracks which canthen be counted and categorized based on maximum wind speed. Note that the computationally expensive detectionstep is embarrassingly parallel across timesteps. The stitching step is harder to parallelize, but takes up little runtime,permitting execution in a serial mode.
/ Procedia Computer Science 00 (2012) 1–10 5
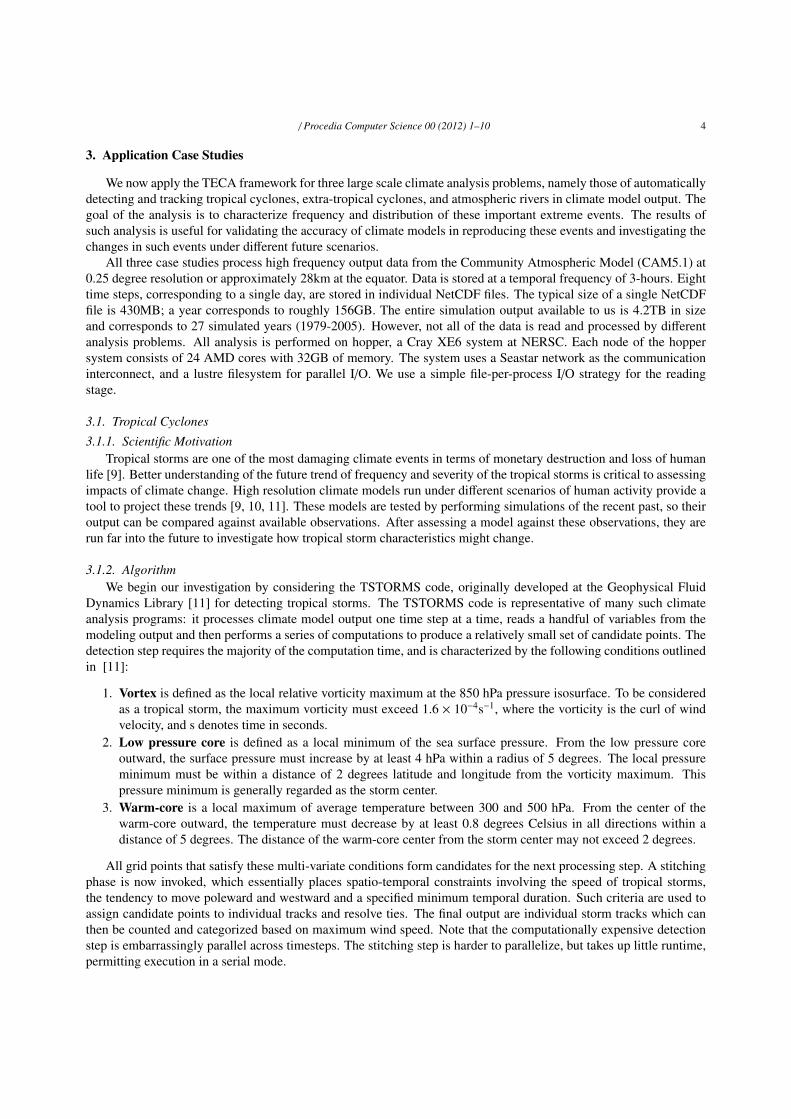
Figure 2: Tropical cyclone tracks for 19 years of CAM5 output. Tracks are colored by storm categories on theSapphir-Simpson scale. Results were obtained by applying the parallel tropical cyclone analysis.
The original TSTORMS is a single thread sequential program written in Fortran 77. It is fairly compute intensive:serial execution on 500GB of modeling output took many days [12]. Doubling the horizontal resolution causes thedetection step to require 16 times more computations. In this work, we have re-implemented the tropical stormdetection algorithm in C and integrated the tropical storm detection capability into the proposed TECA toolkit.
3.1.3. TECA integrationThe design of the implementation of the cyclone detection analysis using TECA is illustrated in Figure 1. The
initial detection of tropical storms at a single timestep is implemented in Ana T stormsTimestep. The storm detectionis automatically split by TECA into concurrent subtasks, each of which processes one timestep. The computation ofstorm trajectories is then implemented as a serial task which operates on the T ECA MPI table data table generatedby the storm detection.
Only minimal changes to the original analysis code are needed in order to integrate the analysis with TECA. Thebase analysis consists of three separate applications —TstormsTimestep, Concat, and Trajectories— which interactthrough the use of intermediate files. A preliminary implementation in TECA —which preserved the communicationbetween tasks via intermediate files— did not require any changes to the original analysis code. The implementationdescribed here required only few changes to the analysis code to allow the storm detection (TstormsTimestep) tooutput its results to a T ECA MPI table and enable the trajectories analysis (Trajectories) to operate on the table.Using T ECA MPI table for data exchange made the Concat step obsolete and removed the need for intermediatefiles for data exchange.
Integration of the tropical cyclone detection with TECA required implementation of the following main usercode. For each main analysis task we defined a corresponding task class in TECA. The task classes implementthe preparation of input and output data while using the original analysis code to perform the analysis task. Inaddition, the task classes specify how TECA should decompose the task into subtasks and how these subtasks shouldbe executed. The main application class T ECA CycloneTracking (which inherits from T ECA base), then links thedifferent analysis tasks together to define a single coherent application. Here we mainly need to implement the init()function, which instantiates the different analysis tasks and adds them to the analysis pipeline.
3.1.4. ResultsWe processed 19 years of CAM5 output (1982-2000) with the tropical cyclone detection code. Data corresponding
to the various fields used in the analysis amounted to ≈ 200GB in size. A plot of the resulting Category 1-5 trajectoriesis shown in Figure 2. We ran the detection step on 6935 cores of the hopper Cray XE6 system at NERSC. The detectionstep was completed in ≈ 2 hours. The results of the detection step was processed by the serial trajectory stitching step,which took ≈ 10 seconds. This result highlights the power of data parallel computing: a task that would take ≈ 583days to run on completion on a single core can now be completed in a few hours.
/ Procedia Computer Science 00 (2012) 1–10 6
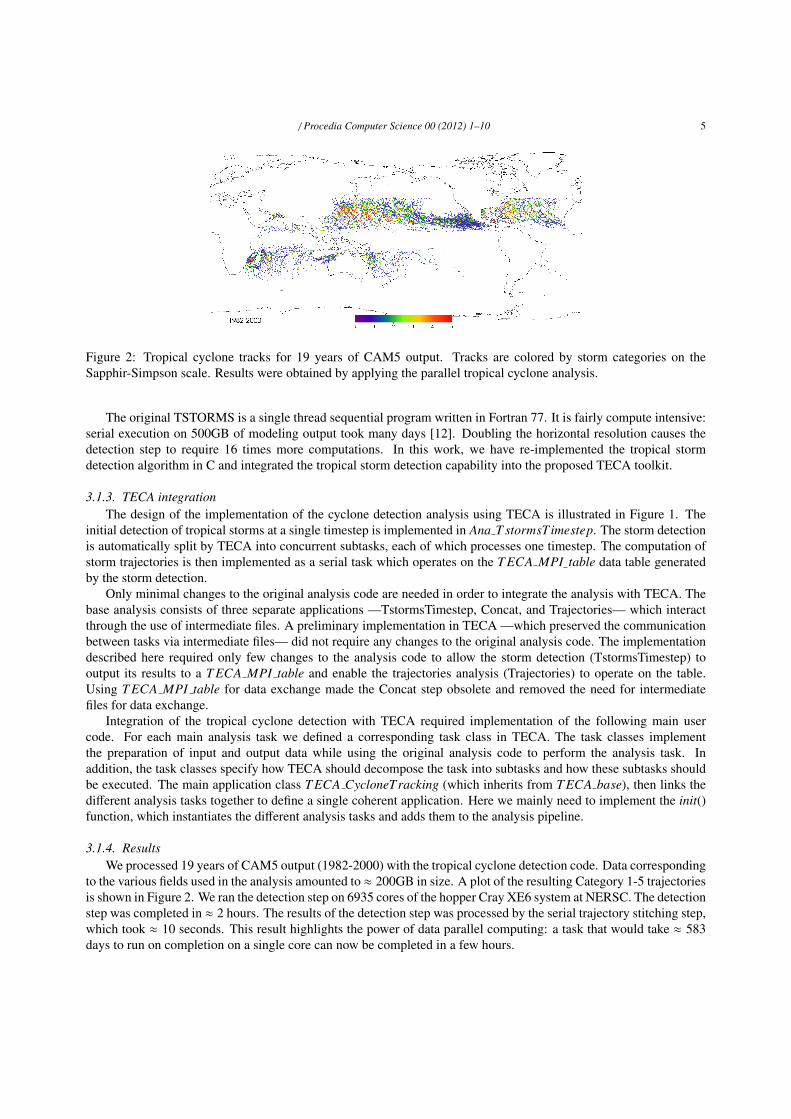
Figure 3: Snapshot of Extra-Tropical cyclone tracks for the month of January 2000. Tracks are colored based onindividual storm systems. Results were obtained by applying the parallel extra-tropical cyclone analysis.
Extra-tropical cyclones are of key importance to the climate at middle to high latitude regions. They determine thelocal weather systems and also have strong influence on the general circulation [13, 14, 15]. For instance, the travelingdirections of Atlantic cyclones have been shown to determine the precipitation and temperature in northwestern andsouthern Europe [16]. Extra-tropical cyclones are characterized by lower winds and less intense pressure minimathan their tropical counterparts, nevertheless they often result in heavy gales, thunderstorms and other severe weather.They are also generally much larger in their geographical extent than tropical storms and occur more frequently. Agood understanding of how the statistics of extra-tropical cyclones (intensity, frequency, or position) change with thechanging climate will be fundamental for the projection of the local climate in the middle to high latitude regions.
3.2.2. AlgorithmOur extra-tropical cyclone detection procedure is similar in spirit to cyclone detection albeit with a few differences.
We follow the approach of [13, 17] for the extra-tropical cyclone detection and tracking procedure:
1. Vortex is defined as the local relative vorticity maximum at the 850 hPa pressure isosurface. A region of 200km× 200km is considered for determining the vorticity minima.
2. Storm center is defined as a closest pressure minimum within a 5 degree radius of the vortex.
A stitching step is then invoked on candidate points that satisfy these criteria. The extra-tropical storm is con-strained to last for at least 2 days and travel at least 1000Km over the course of its duration. A maximum distanceconstraint of 600km is applied for every 6-hour interval, and a preference is given to storms that travel poleward andeastward during the trajectory creation process. Similar to the tropical cyclone analysis, we found that the detectionstep was the most expensive.
3.2.3. TECA IntegrationThe fundamental structure of the extra-tropical cyclone detection analysis is similar to the tropical cyclone de-
tection discussed in Section 3.1. The design of the implementation of both algorithms in TECA as well as the effortrequired for integrating the analysis with TECA are comparable (see Section 3.1.3 and Figure 1).
3.2.4. ResultsWe processed 16 years of CAM5 output (1991-2005) with the extra-tropical cyclone detection code. Figure 3
shows sample trajectories from a single month in that duration. The processing was completed in ≈ 6 hours on 5840cores. The larger runtime, especially compared to the tropical cyclones, is due to the wider latitude band that muchbe searched for these storms, typically 20N through 90N and 20S to 90S, as compared to 30N to 30S for tropicalcyclones. We note that a single core would take ≈ 1460 days to analyze the same dataset.
/ Procedia Computer Science 00 (2012) 1–10 7
3.3. Atmospheric Rivers
3.3.1. Scientific MotivationExtreme precipitation events on the western coast of North America are often traced to an unusual weather phe-
nomenon known as atmospheric rivers (ARs). These events refer to long and narrow structures in the lower atmospherethat transports tropical moisture to the far-flung regions outside of the tropical zone [18, 19]. In one of the earlieststudies on this phenomenon, it was determined that such a structure could carry more water than the great river Ama-zon [20, 21]. As they can be highly localized, river is an apt description of such a narrow stream of moisture movingat high speeds across thousands of kilometers. AR events occur in oceans around the globe, including the Atlanticbasin affecting the British Isles.
The key characteristic recognized in earlier studies of ARs is the moisture flux [22]. However, that quantity turnsout to be difficult to observe directly. In 2004, Ralph et al. [23] established a much simpler set of conditions toidentify atmospheric rivers in satellite observations. Their detection is primarily based on the total column IntegratedWater Vapor (IWV) content, which is measured in millimeters (mm) or centimeters (cm). They identify an AR asatmospheric feature with IWV > 2cm, more than 2000 km in length, and less than 1000 km in width. Satelliteobservations can direction measure IWV, however, the water vapor concentration in the model output files has to bevertically integrated in order to produce IWV. Some specific implementation details are as follows:
3.3.2. AlgorithmThe AR detection process has two phases: i) detection of AR events and ii) computation of AR statistics. The first
phase of our detection algorithm proceeds in four steps:
• The first step reads IWV data from a list of files. For climate model output, daily averaged values are read andthen converted to three day averages.• For a selected ocean basin, such as the northern Pacific Basin, select all mesh points where IWV is above a
specified threshold value. Our default threshold is 2cm of equivalent water as suggested by Ralph at al. [23].This step focuses our attention to a specific ocean basin. We also remove the tropical portion of the basin as ourattention is focused on the extra-tropical features.• Group the connected mesh points into regions in space through a connected component labeling algorithm. In
this process, we count each mesh point as connected to eight neighboring points adjacent to it. We use a two-pass algorithm that gathers the connectivity information among the foreground pixels and then assign the finallabels to each pixel [24]. The connectivity information is efficiently represented in a union-find data structure,which is known to be theoretically optimal in computational complexity measures. We refer to each connectedregion as a candidate.• For each candidate, we verify the criteria suggested by Ralph et al. to classify it as an atmospheric river or not.
We first verify whether a connected region originates from the tropical area and makes landfall on an appropriatecoast. In the case of north Pacific basin, this would be the west coast of North America from California to BritishColumbia. If these two conditions are met, then we measure the length and the width for the region. The lengthis measured as the maximum length of the median axis of the region and the width is computed as the ratiobetween the area covered by the connected region and its length. A candidate satisfying the length and widthconstraints is classified as an Atmospheric River. If the event passes over Hawaii, it is further denoted as a”Pineapple Express”. To evaluate the strength or other impacts, we compute quantities from additional modeloutput fields such as precipitation, wind speed, moisture flux at landfall and so on.
3.3.3. TECA IntegrationA standalone implementation of the above algorithm was presented in [25]. In this work, we enhance the im-
plementation by integrating it into the TECA framework. In particular, TECA is able to handle the tasks of spatio-temporal parallelism. After the candidate points satisfy the AR criterion, the date, length, width, and landfall informa-tion is stored using T ECA MPI table. The AR detection is implemented as a derived class of T ECA base f iletask.For each timestep of the data, a corresponding subtask is generated, while additional “ghost” timesteps may be in-cluded in each subtask to perform AR detection using, e.g, 3-day averages. Each of the subtasks is executed by TECA
/ Procedia Computer Science 00 (2012) 1–10 8
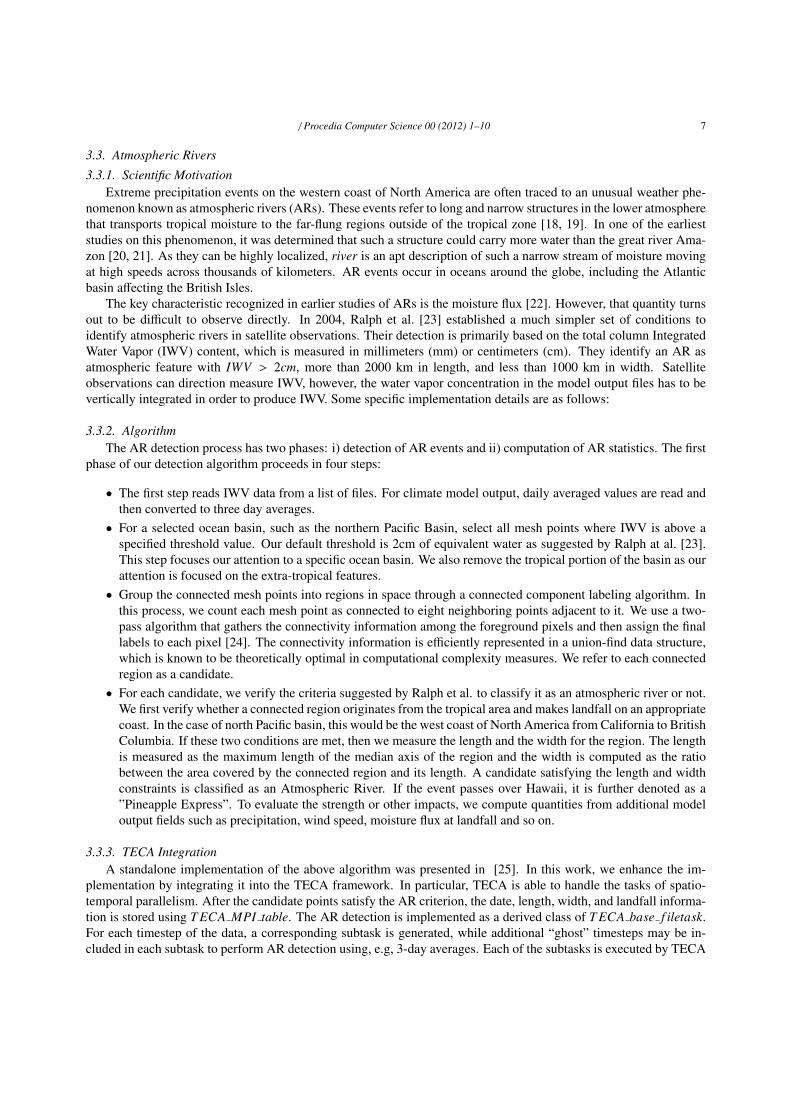
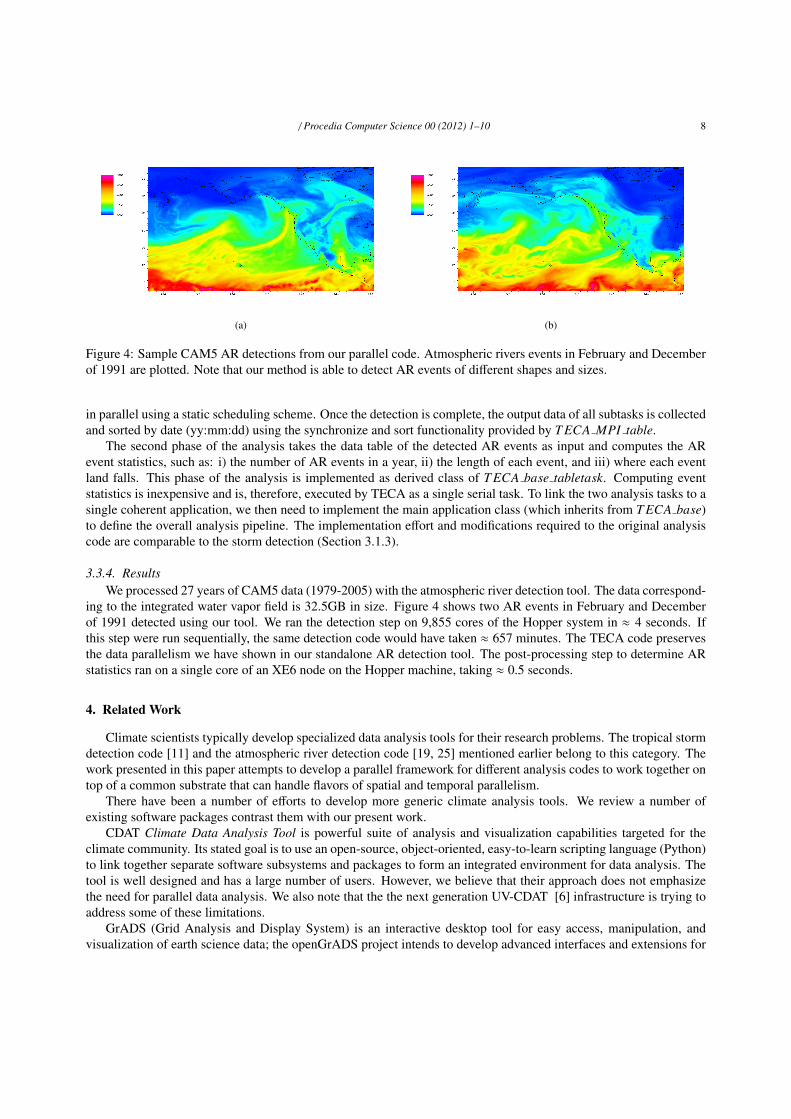
(a) (b)
Figure 4: Sample CAM5 AR detections from our parallel code. Atmospheric rivers events in February and Decemberof 1991 are plotted. Note that our method is able to detect AR events of different shapes and sizes.
in parallel using a static scheduling scheme. Once the detection is complete, the output data of all subtasks is collectedand sorted by date (yy:mm:dd) using the synchronize and sort functionality provided by T ECA MPI table.
The second phase of the analysis takes the data table of the detected AR events as input and computes the ARevent statistics, such as: i) the number of AR events in a year, ii) the length of each event, and iii) where each eventland falls. This phase of the analysis is implemented as derived class of T ECA base tabletask. Computing eventstatistics is inexpensive and is, therefore, executed by TECA as a single serial task. To link the two analysis tasks to asingle coherent application, we then need to implement the main application class (which inherits from T ECA base)to define the overall analysis pipeline. The implementation effort and modifications required to the original analysiscode are comparable to the storm detection (Section 3.1.3).
3.3.4. ResultsWe processed 27 years of CAM5 data (1979-2005) with the atmospheric river detection tool. The data correspond-
ing to the integrated water vapor field is 32.5GB in size. Figure 4 shows two AR events in February and Decemberof 1991 detected using our tool. We ran the detection step on 9,855 cores of the Hopper system in ≈ 4 seconds. Ifthis step were run sequentially, the same detection code would have taken ≈ 657 minutes. The TECA code preservesthe data parallelism we have shown in our standalone AR detection tool. The post-processing step to determine ARstatistics ran on a single core of an XE6 node on the Hopper machine, taking ≈ 0.5 seconds.
4. Related Work
Climate scientists typically develop specialized data analysis tools for their research problems. The tropical stormdetection code [11] and the atmospheric river detection code [19, 25] mentioned earlier belong to this category. Thework presented in this paper attempts to develop a parallel framework for different analysis codes to work together ontop of a common substrate that can handle flavors of spatial and temporal parallelism.
There have been a number of efforts to develop more generic climate analysis tools. We review a number ofexisting software packages contrast them with our present work.
CDAT Climate Data Analysis Tool is powerful suite of analysis and visualization capabilities targeted for theclimate community. Its stated goal is to use an open-source, object-oriented, easy-to-learn scripting language (Python)to link together separate software subsystems and packages to form an integrated environment for data analysis. Thetool is well designed and has a large number of users. However, we believe that their approach does not emphasizethe need for parallel data analysis. We also note that the the next generation UV-CDAT [6] infrastructure is trying toaddress some of these limitations.
GrADS (Grid Analysis and Display System) is an interactive desktop tool for easy access, manipulation, andvisualization of earth science data; the openGrADS project intends to develop advanced interfaces and extensions for
/ Procedia Computer Science 00 (2012) 1–10 9
GrADS. They emphasize ease of use on desktop computers and do not directly address the pressing issue of handlingmassive amounts of climate data.
Statistical Tool for Extreme Climate Analysis (STECA) provides a graphical user interface for users to computestatistics of daily atmospheric climate analysis, such as heat index, relative humidity, wind chill, etc. The GUI allowsusers to specify data files and select statistical functions. The extReams toolkit generates daily and seasonal statisticsof weather. In contrast to both these tools, TECA detects extreme climate events in large climate datasets by exploitingparallelism on supercomputing platforms.
The NCAR Command Language [26] and NetCDF Operators [27] are powerful, general utilities for performinga range of operations (examining, subsetting, averaging, plotting) on climate data. Efforts such as ParCAL [7] andPagoda [8] are developing parallel analogues of these utilities, enabling parallel processing on large datasets. Oureffort is fairly specialized in this regard, we are developing a framework for parallel feature tracking and analysis.
Kendall, et al. [28] present the DStep system which is similar in spirit to our work. Their system allows for sim-plified traversal of spatio-temporal domains across a large scale distributed memory system. They use a MapReducelike framework to process data and merge the results. They also use sophisticated data management and parallel I/Otechniques, and demonstrate teleconnection analysis on an ensemble dataset.
Finally, we note that a few visualization and analysis tools have been demonstrated to scale on large supercom-puting platforms and process massive datasets. VisIt [29] and Paraview [30] belong to this category. However, thesetools are designed to be general purpose, and are not specifically targeted for the climate community. It is possible toimplement the features in TECA within the VTK pipelines of VisIt and Paraview, and expose some climate-specificfeatures to users. We will explore this route in the future as a vehicle for production deployment to a broad usercommunity.
5. Discussion and Future Work
Using TECA greatly simplifies the parallel implementation of the tropical storm, extra-tropical cyclone and atmo-spheric river detection analyses described in the previous section. TECA handles many of the common tasks involvedwith parallelizing the analysis, in particular: i) splitting of analysis tasks into independent subtasks, ii) execution ofthe subtasks in parallel, iii) collecting data from all MPI ranks and sorting of the collected data by using TECA’sparallel table data structure for storage and exchange of analysis results, and iv) integration of different analysis task(e.g,. detection of storms and computation of storm trajectories) into a single analysis application. The object-orienteddesign of TECA provides developers with flexibility and and ease of integration of new features, such as new schemesfor decomposition of analysis into subtasks, without having to modify TECA itself.
The current implementation of TECA achieves a number of the goals we had proposed, such as ease of use and na-tive support for temporal parallelism; but it also has various limitations. While a developer may easily add new typesof tasks and task-decompositions, TECA currently does not provide native support for spatial parallelism, i.e., TECAcurrently does not implement subtasks based on spatial sub-regions of the globe. This will likely be a limitation whendata from kilometer scale atmospheric models becomes available. Simple forms of temporal parallelism, namelyassigning one timestep per core, will introduce load balancing problems, wherein only a small subset of the coreswill undertake a detailed search for sparse extreme events. This problem can be alleviated by assigning interleavedtimesteps (or spatial subsets) across cores, or a more elaborate workload-driven dynamic load balancing scheme. Fi-nally, TECA has little I/O support at the moment. TECA currently only provides a straightforward interface to climatedata, while I/O operations are largely performed by the analysis algorithms. We plan to address these limitations infuture work.
Our current performance numbers reflect tests at a single problem configuration: ≈ O(6000)-way concurrency andprimarily utilizing temporal parallelism. We would like to perform more extensive scalability tests by utilizing spatial,temporal and spatio-temporal parallelism across a variable number of cores. Mixing different parallel modalities willenable us to run at much larger concurrencies and will likely expose scalability bottlenecks.
6. Conclusion
In conclusion, we have presented a design for TECA that leverages different flavors of data parallelism currentlyavailable in large climate datasets. We have demonstrated the power of the toolkit by application to three important
/ Procedia Computer Science 00 (2012) 1–10 10
climate science problems, namely that of detecting tropical cyclones, extra-tropical cyclones and atmospheric rivers.We have tested these implementations on large TB sized climate datasets and demonstrated good runtime performanceon thousands of cores. The TECA toolkit provides for an extensible framework that can be leveraged for implementingdifferent feature detection and tracking algorithms for tackling large scale climate science problems.
7. Acknowledgement
This work was supported by the Regional and Global Climate Modeling Program and the Earth System ModelingProgram of the Office of Biological and Environmental Research, the Director, Office of Science, Office and AdvancedScientific Computing Research, of the U.S. Department of Energy under Contract No. DE-AC02-05CH11231. Thiswork used resources of the National Energy Research Scientific Computing Center (NERSC), which is supported bythe Office of Science of the U.S. Department of Energy under Contract No. DE-AC02-05CH11231.
References
[1] G. A. Meehl, C. Covey, T. Delworth, M. Latif, B. McAvaney, J. F. B. Mitchell, R. J. Stouffer, K. E. Taylor, The wcrp cmip3 multi-modeldataset: A new era in climate change research, Bulletin of the American Meteorological Society 88 (2007) 1383–1394.
[2] IPCC, Cmip5 - coupled model intercomparison project phase 5, http://cmip-pcmdi.llnl.gov/cmip5/.[3] Cdat, http://www-pcmdi.llnl.gov/software-portal/cdat.[4] Ferret data visualization and analysis, http://ferret.wrc.noaa.gov/Ferret/.[5] netcdf operator (nco), http://nco.sourceforge.net/.[6] Ultrascale visualization - climate data analysis tools, http://uv-cdat.llnl.gov/.[7] Parallel climate analysis library, http://trac.mcs.anl.gov/projects/parvis.[8] Pagoda: Parallel analysis of geoscience data, https://svn.pnl.gov/gcrm/wiki/Pagoda.[9] M. F. Wehner, G. Bala, P. Duffy, A. A. Mirin, R. Romano, Towards direct simulation of future tropical cyclone statistics in a high-resolution
global atmospheric model, Advances in Meteorology 2010 (2010) Article ID 915303.[10] P. J. Webster, G. J. Holland, J. A. Curry, H. Chang, Changes in tropical cyclone number, duration, and intensity in a warming environment,
Science 309 (5742) (2005) 1844–1846.[11] T. R. Knutson, J. J. Sirutis, S. T. Garner, I. M. Held, R. E. Tuleya, Simulation of the recent multidecadal increase of atlantic hurricane activity
using an 18-km-grid regional model, Bulletin of the American Meteorological Society 88 (10) (2007) 1549–1565.[12] D. Hasenkamp, A. sim, M. Wehner, K. Wu, Finding tropical cyclones on a cloud computing cluster: Using parallel virtualization for large-
scale climate simulation analysis, in: CloudCom, 2010.[13] L. Bengtsson, K. I. Hodges, E. Roeckner, Storm tracks and climate change, J. Climate 19 (2006) 3518–3543.[14] N. Lau, Variability of the observed midlatitude storm tracks in relation to low-frequency changes in the circulation pattern, J. Armos. Sci. 45
(1988) 2718–2743.[15] N. Lau, The stationary wave response to a tropical sst anomaly in an idealized gcm, J. Armos. Sci. 47 (1990) 2546–2566.[16] H. van Loon, J. C. Rogers, The seesaw in winter temperatures between greenland and northern europe. part i: General description, Mon. Wea.
Rev. 106 (1978) 296–310.[17] L. Bengtsson, K. I. Hodges, N. Keenlyside, Will extra-tropical storms intensify in a warmer climate?, J. Climate 22 (2009) 2276–2301.[18] F. M. Ralph, M. D. Dettinger, Storms, floods and the science of atmospheric rivers, EOS, Transactions of AGU 92 (32) (2011) 265–266.[19] M. D. Dettinger, F. M. Ralph, T. Das, P. J. Neiman, D. R. Cayan, Atmospheric rivers, floods and the water resources of california, Water 3 (2)
(2011) 445–478.[20] Y. Zhu, R. E. Newell, Atmospheric rivers and bombs, Geophysical Research Letters 21 (18) (1999-2002) 1994.[21] R. E. Newell, N. E. Newell, Y. Zhu, C. Scott, Tropospheric rivers? a pilot study, Geophysical Research Letters 19 (24) (24012404) 1992.[22] Y. Zhu, R. E. Newell, A proposed algorithm for moisture fluxes from atmospheric rivers, Monthly Weather Review - USA 126 (3) (725-735)
1998.[23] F. M. Ralph, P. J. Neiman, G. A. Wick, Satellite and caljet aircraft observations of atmospheric rivers over the eastern north pacific ocean
during the winter of 1997/98, Monthly Weather Review 132 (7) (2004) 1721–1745.[24] K. Wu, E. Otoo, K. Suzuki, Optimizing two-pass connected component labeling algorithms, Pattern Analysis & Applications 12 (2) (117135)
2009.[25] S. Byna, Prabhat, M. F. Wehner, K. Wu, Detecting atmospheric rivers in large climate datasets, in: Supercomputing 2011 Workshop on
Petascale Data Analytics: Challenges and Opportunities, 2011.[26] Ncar command language, http://www.ncl.ucar.edu/.[27] netcdf operator, http://nco.sourceforge.net/.[28] W. Kendall, J. Wang, M. Allen, T. Peterka, J. Huang, D. Erickson, Simplified parallel domain traversal, in: Proceedings of 2011 International
Conference for High Performance Computing, Networking, Storage and Analysis, SC ’11, ACM, New York, NY, USA, 2011, pp. 10:1–10:11.doi:10.1145/2063384.2063397.URL http://doi.acm.org/10.1145/2063384.2063397


![TECA: Petscale Pattern Recognition for Climate Sciencesbyna/research/papers/201508-CAIP-TECA.pdf · 3 2 Methods 2.1 TECA (Toolkit for Extreme Climate Analytics) TECA [10] is a climate-speci](https://static.documents.pub/doc/80x56/5be09b7009d3f28e5a8c5406/teca-petscale-pattern-recognition-for-climate-science-sbynaresearchpapers201508-caip-tecapdf.jpg)


