112
Tech 149: Unit 4 Lecture Network Systems, Quality Systems, Manufacturing Planning, Control and Scheduling in CIM Environment

Tech 149: Unit 4 Lecture
Network Systems, Quality Systems,
Manufacturing Planning, Control and
Scheduling in CIM Environment
Network Systems in CIM
For Connectivity and Communications in:
• CAD/CAM, CAE, CAPP, and other sub-systems
• Departmental activities
• Plant-wide activities
• Company-wide activities
• Global activities
• Executive planning and managerial activities
Types of CIM Network Systems
Local Area Network (LAN)
Metropolitan Area Network (MAN)
Wide Area Network (WAN)
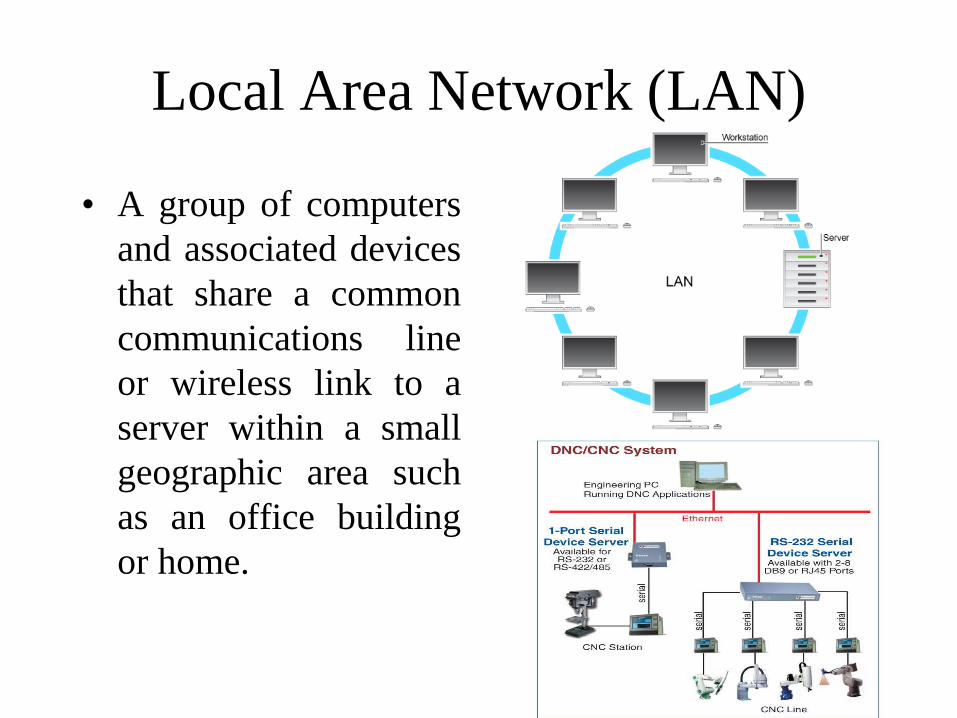
Local Area Network (LAN)
• A group of computers
and associated devices
that share a common
communications line
or wireless link to a
server within a small
geographic area such
as an office building
or home.
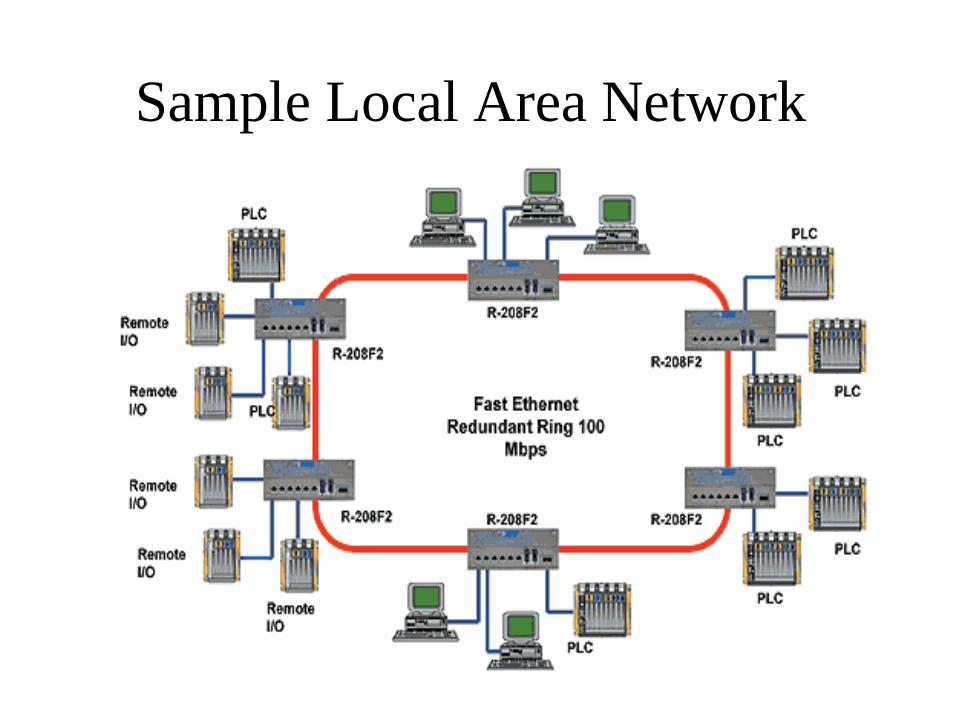
Sample Local Area Network
Chapter 9: Discrete Control Using
PLCs and PCs
Sections:
1. Discrete Process Control
2. Ladder Logic Diagrams
3. Programmable Logic Controllers
4. Personal Computers and Programmable
Automation Controllers
Logic Control
A switching system whose output at any moment
is determined exclusively by the values of
inputs
• No memory
• No operating characteristics that depend on
time
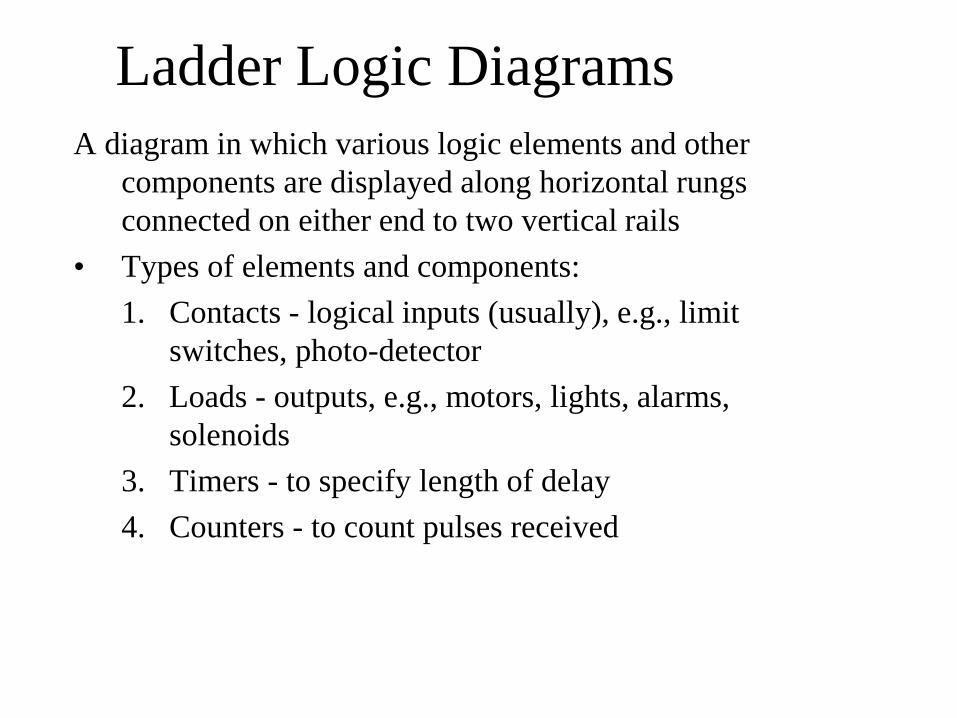
Ladder Logic Diagrams
A diagram in which various logic elements and other
components are displayed along horizontal rungs
connected on either end to two vertical rails
• Types of elements and components:
1. Contacts - logical inputs (usually), e.g., limit
switches, photo-detector
2. Loads - outputs, e.g., motors, lights, alarms,
solenoids
3. Timers - to specify length of delay
4. Counters - to count pulses received
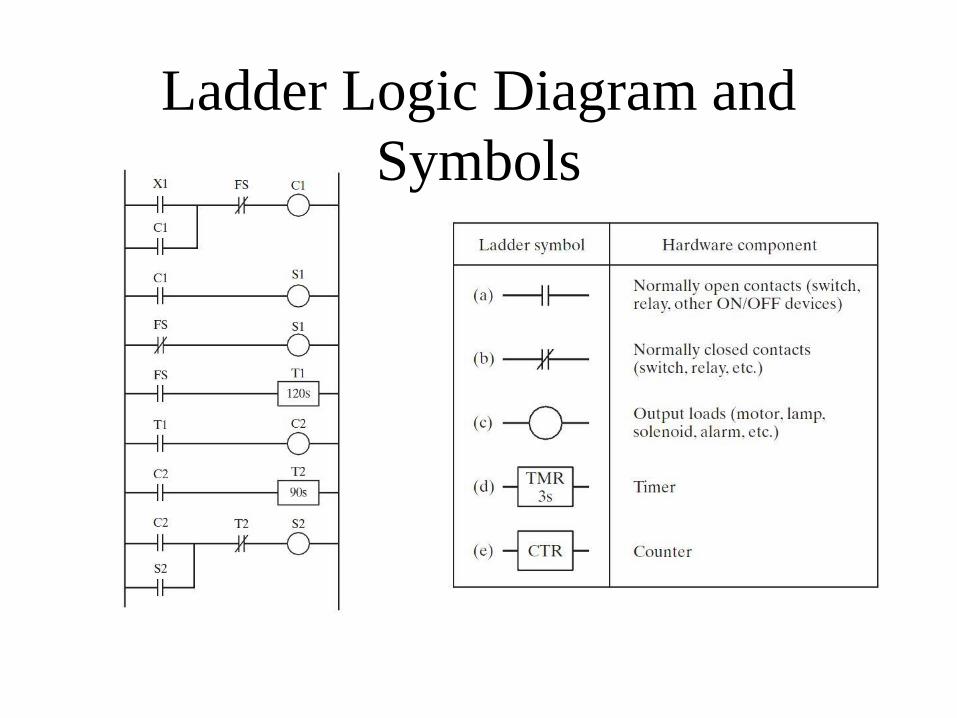
Ladder Logic Diagram and
Symbols
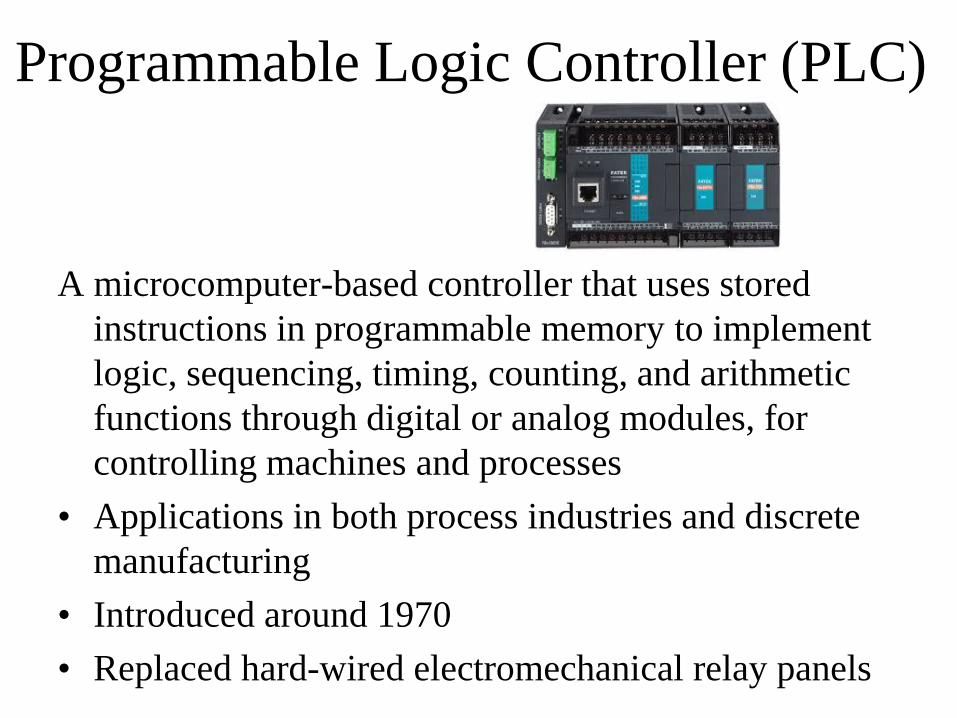
Programmable Logic Controller (PLC)
A microcomputer-based controller that uses stored
instructions in programmable memory to implement
logic, sequencing, timing, counting, and arithmetic
functions through digital or analog modules, for
controlling machines and processes
• Applications in both process industries and discrete
manufacturing
• Introduced around 1970
• Replaced hard-wired electromechanical relay panels

PLC Applications
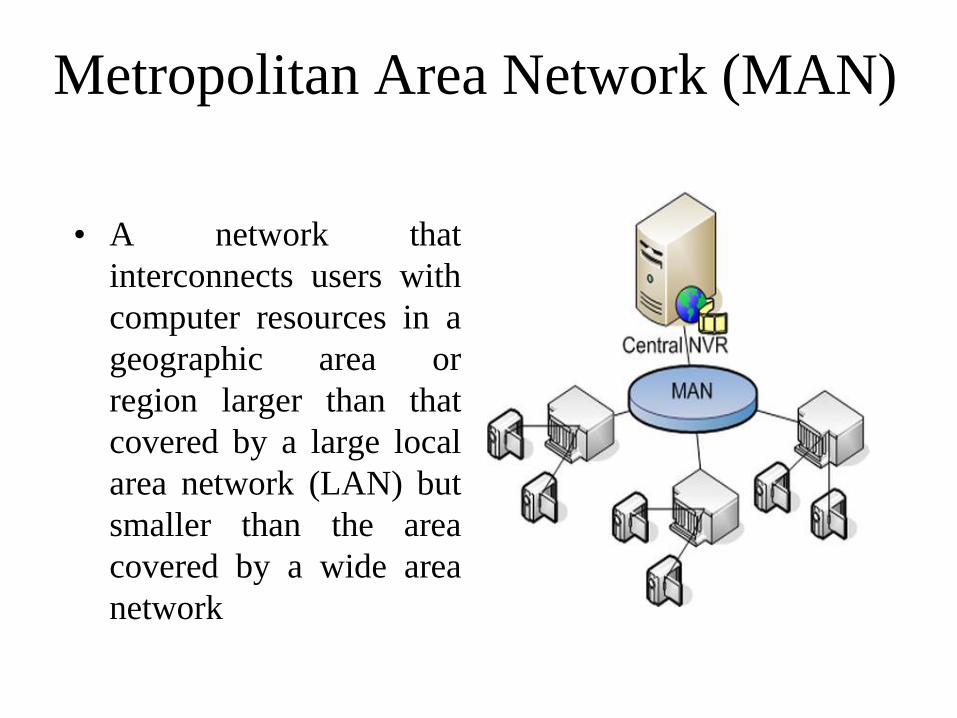
Metropolitan Area Network (MAN)
• A network that
interconnects users with
computer resources in a
geographic area or
region larger than that
covered by a large local
area network (LAN) but
smaller than the area
covered by a wide area
network

Sample Metropolitan Area Network

Wide Area Network (WAN)
• A computer network
that spans a large
geographical area of two
or more local-area
networks. These
computers are often
connected through
public networks, such as
the telephone system,
leased lines or satellites.
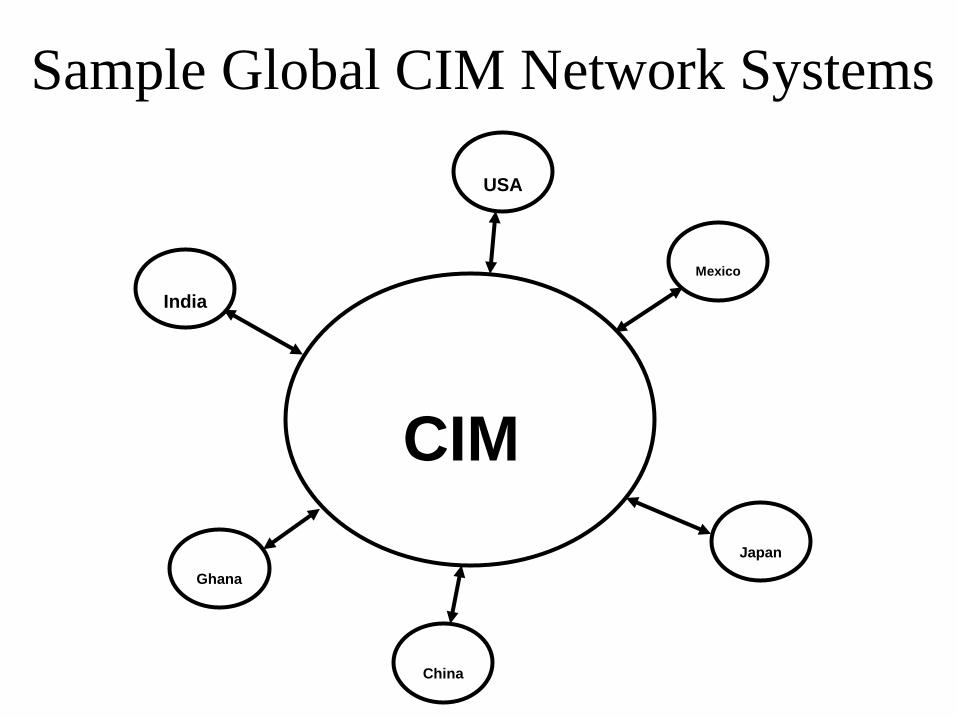
Sample Global CIM Network Systems
CIM
USA
China
India
Ghana
Mexico
Japan

Cloud-Based Computer Networking
The practice of using a
network of remote servers
hosted on the Internet to
store, manage, and process
data, rather than a local
server or a personal
computer.
Benefits of Cloud-Based Network Systems
1. It allows companies to avoid upfront
infrastructure costs, and focus on projects.
2. It allows enterprises to get their applications up
and running faster.
3. It allows for improved system manageability and
less maintenance.
4. It enables companies to more rapidly adjust
resources to meet fluctuating and unpredictable
business demand.

Chapter 25: Production Planning
and ControlSections:
1. Aggregate Production Planning and the
Master Production Schedule
2. Material Requirements Planning
3. Capacity Planning
4. Shop Floor Control
5. Inventory Control
6. Manufacturing Resource Planning (MRP II)
7. Enterprise Resource Planning (ERP)
Production Planning and Control
• Concerned with the logistics problems in
manufacturing:
– Managing the details of what, when, and how many
products to produce
– And obtaining the raw materials, parts, and
resources to produce them
• PPC solves these logistics problems by
managing information
• PPC is the integrator in computer integrated
manufacturing
Production Planning
• Concerned with:
1. Deciding which products to make, how many
of each, and when they should be completed
2. Scheduling the delivery and/or production of
the parts and products
3. Planning the manpower and equipment
resources needed to accomplish the production
plan
Activities in Production Planning• Aggregate production planning – planning the production
output levels for major product lines
– Must be coordinated with product design, production, marketing, and sales
• Master production planning – specific schedule (master production schedule) of the quantities of individual models in each major product line
• Material requirements planning (MRP) – detailed schedule of raw materials and parts production for models in master schedule
• Capacity planning – planning labor and equipment resources to achieve the master schedule
Production Control
• Concerned with determining whether the necessary resources to implement the production plan have been provided
– If not, it attempts to take corrective action to address the deficiencies
• Major topics in production control:
– Shop floor control
– Inventory control
– Manufacturing resource planning
– Enterprise resource planning
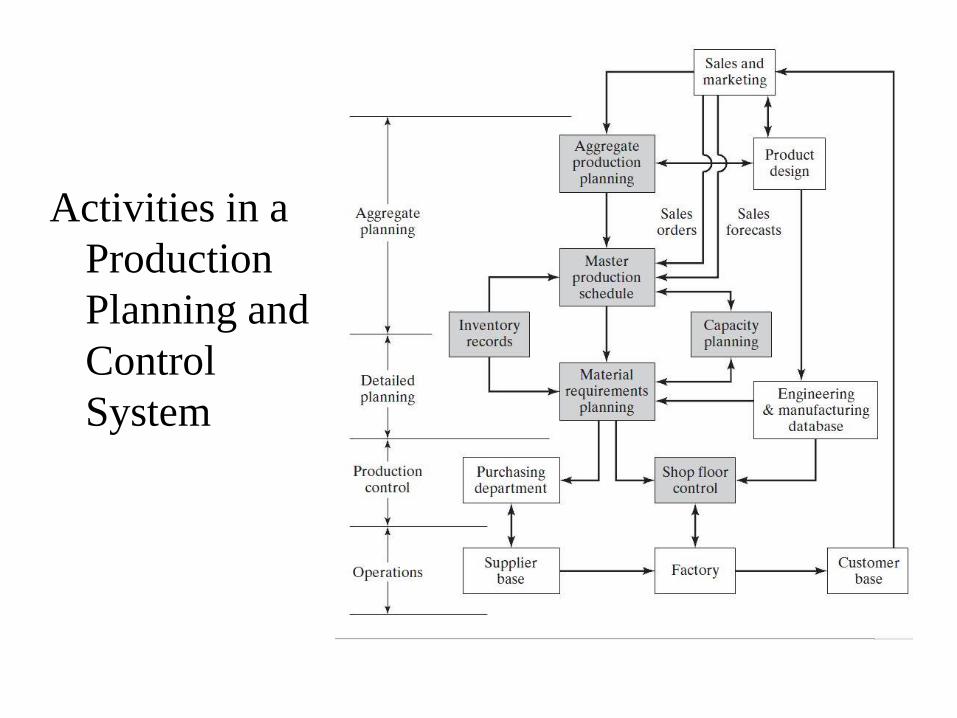
Activities in a
Production
Planning and
Control
System

Aggregate Production Planning
Planning the production output levels for major product lines
• High-level corporate planning activity
• Must be coordinated with the plans of the sales and marketing
departments
– Includes products that are currently in production
• Must consider current and future inventory levels of those
products
– Also includes new products currently being developed
• Marketing plans for current and new products must be
reconciled against total capacity resources of the company
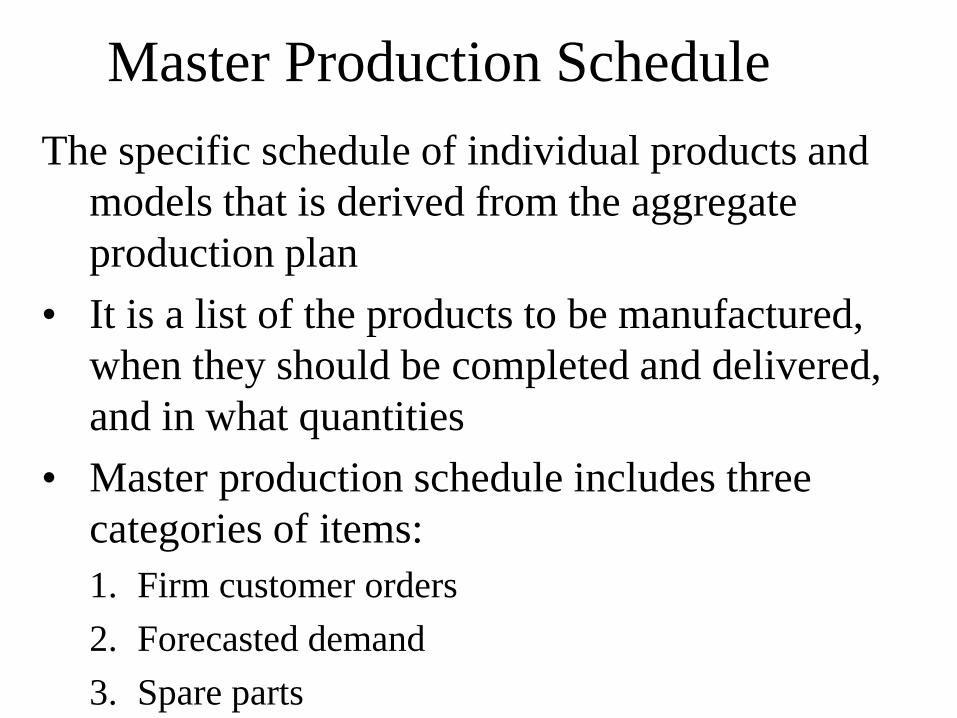
Master Production Schedule
The specific schedule of individual products and
models that is derived from the aggregate
production plan
• It is a list of the products to be manufactured,
when they should be completed and delivered,
and in what quantities
• Master production schedule includes three
categories of items:
1. Firm customer orders
2. Forecasted demand
3. Spare parts

Master Production Schedule
Specific schedule of individual products,
quantities and times

Materials Requirement
Is concerned with planning, organizing
and controlling the flow of materials from
their initial purchase through internal
operations to the service point through
distribution.
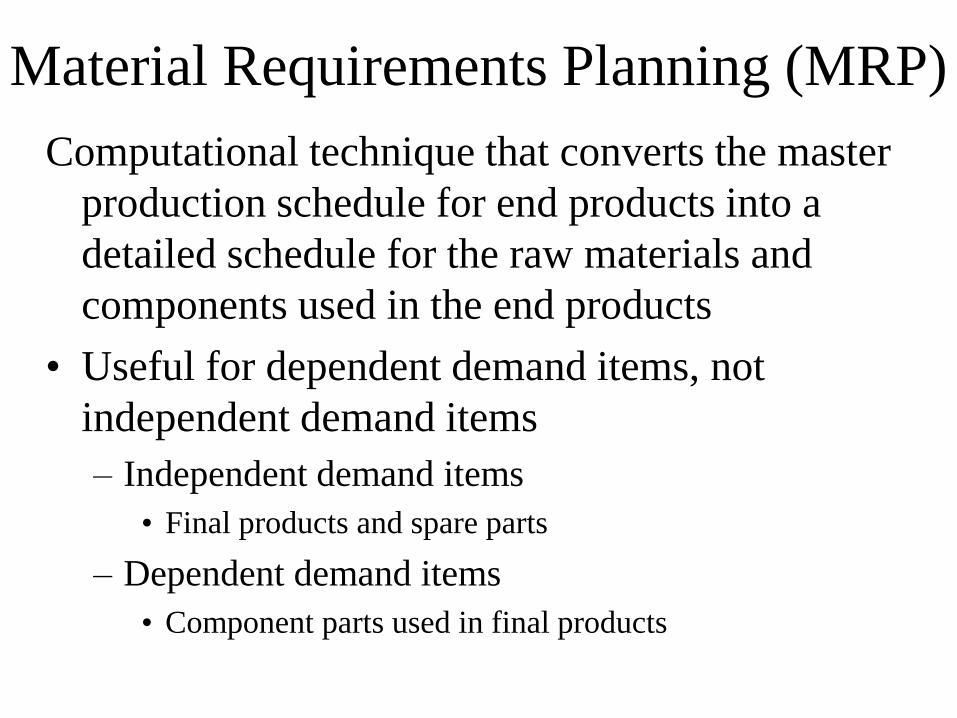
Material Requirements Planning (MRP)
Computational technique that converts the master
production schedule for end products into a
detailed schedule for the raw materials and
components used in the end products
• Useful for dependent demand items, not
independent demand items
– Independent demand items
• Final products and spare parts
– Dependent demand items
• Component parts used in final products

Inputs to the MRP System1. Master production schedule
– Expressed in terms of time buckets
2. Bill of materials file – product structure
and list of component parts in each product
3. Inventory record file (item master file) –
includes:
– Item master data – part number, order
quantities, lead times
– Inventory status – time-phased record of
inventory status
– Subsidiary data – purchase orders, engineering
changes

Inventory Record File
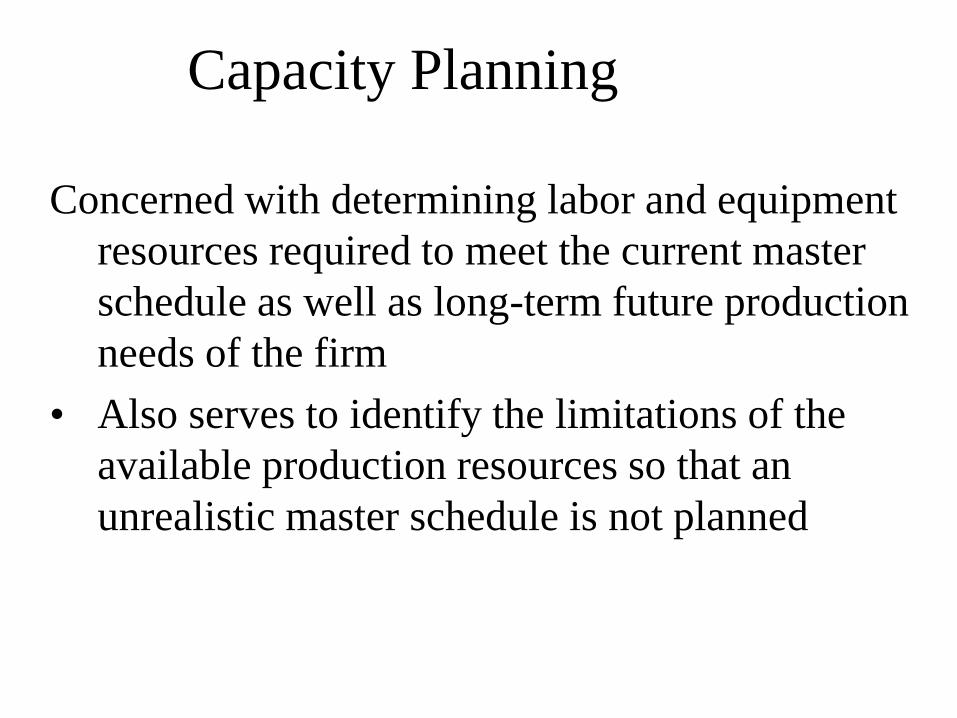
Capacity Planning
Concerned with determining labor and equipment
resources required to meet the current master
schedule as well as long-term future production
needs of the firm
• Also serves to identify the limitations of the
available production resources so that an
unrealistic master schedule is not planned
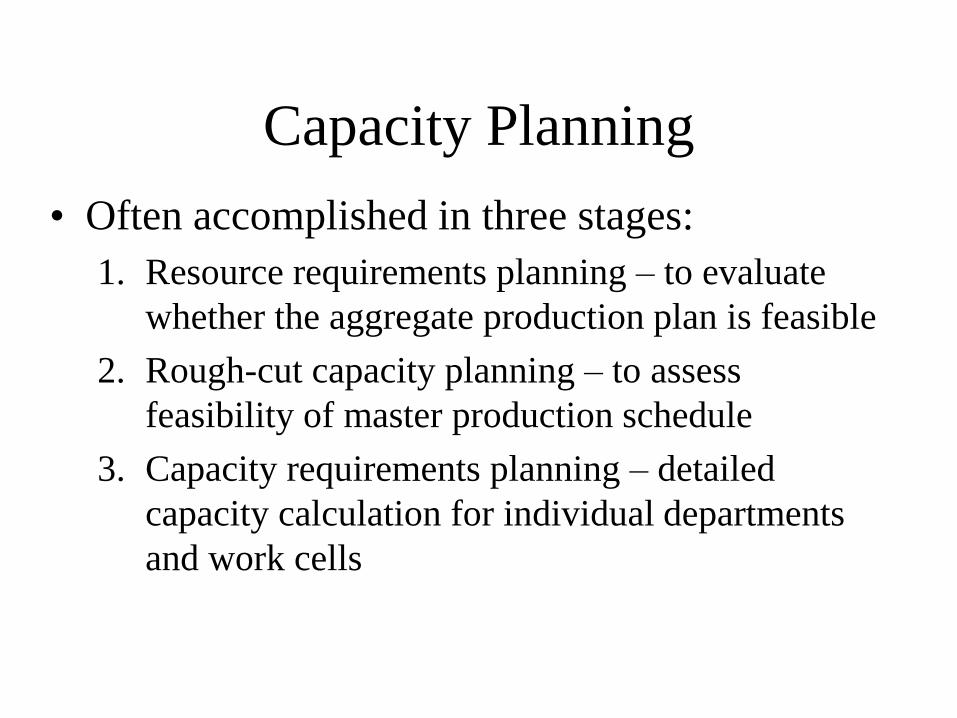
Capacity Planning
• Often accomplished in three stages:
1. Resource requirements planning – to evaluate
whether the aggregate production plan is feasible
2. Rough-cut capacity planning – to assess
feasibility of master production schedule
3. Capacity requirements planning – detailed
capacity calculation for individual departments
and work cells

Shop Floor ControlConcerned with releasing production orders to the
factory, monitoring and controlling the progress
of the orders through the plant, and acquiring
current information on the status of the orders
• Manufacturing execution system (MES) - the
computer software that supports shop floor
control
– Typically includes capability to respond to on-line
inquiries about the status of orders in the shop
– Other MES functions may include generation of
process instructions, real-time inventory control,
and labor tracking
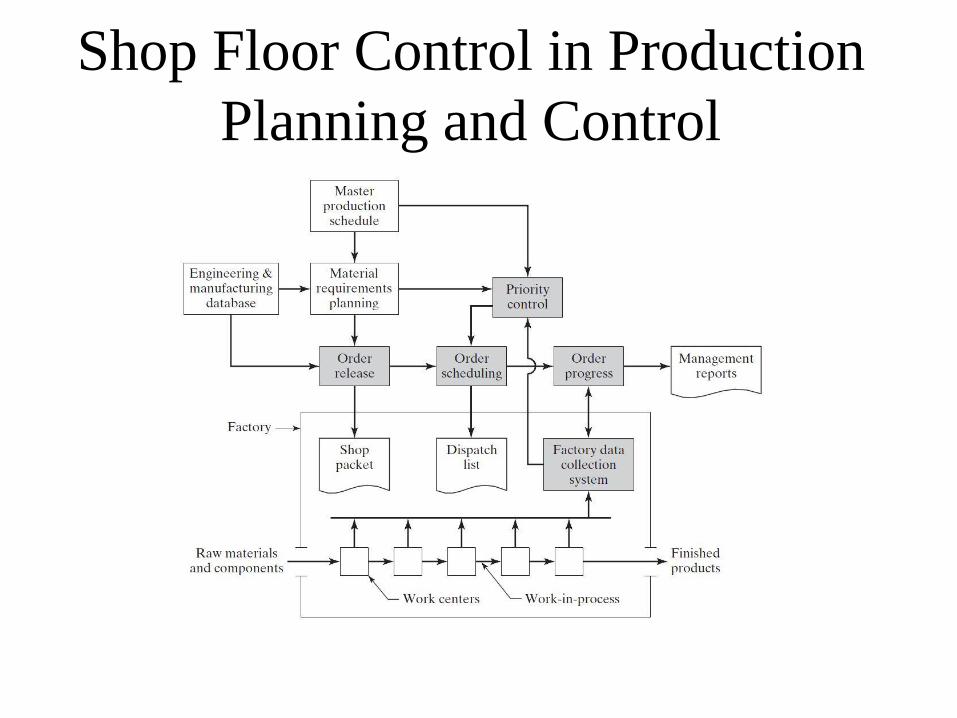
Shop Floor Control in Production
Planning and Control
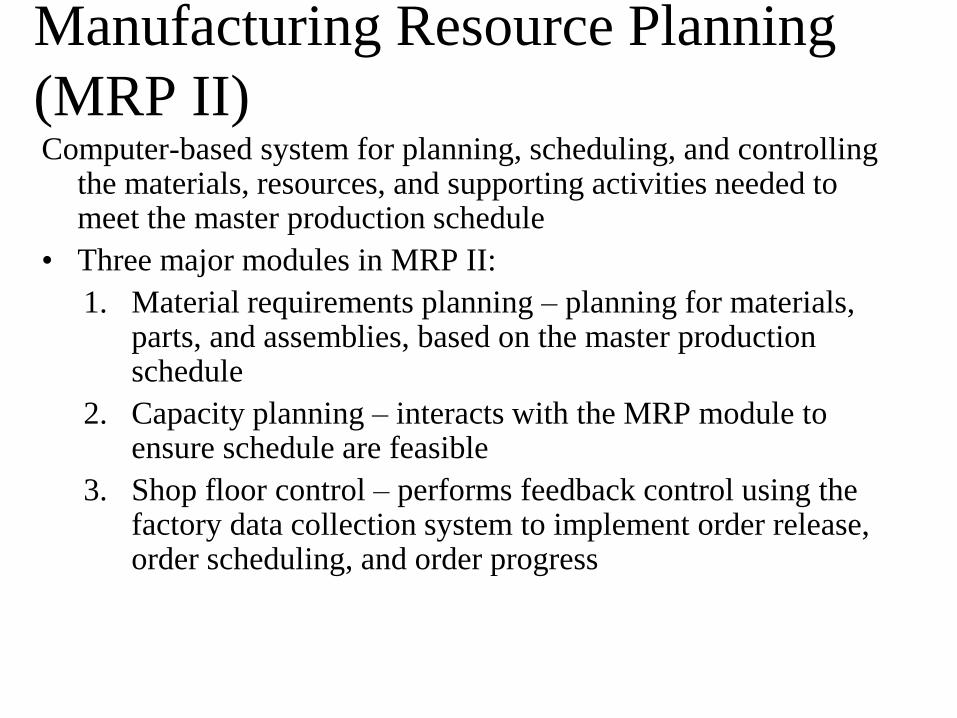
Manufacturing Resource Planning
(MRP II) Computer-based system for planning, scheduling, and controlling
the materials, resources, and supporting activities needed to meet the master production schedule
• Three major modules in MRP II:
1. Material requirements planning – planning for materials, parts, and assemblies, based on the master production schedule
2. Capacity planning – interacts with the MRP module to ensure schedule are feasible
3. Shop floor control – performs feedback control using the factory data collection system to implement order release, order scheduling, and order progress
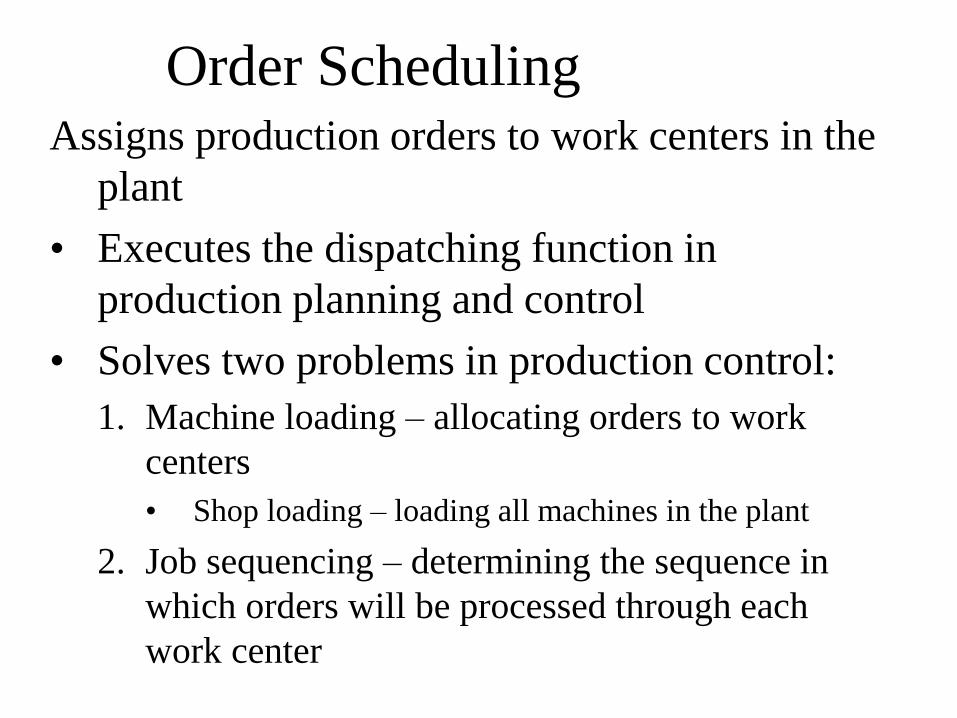
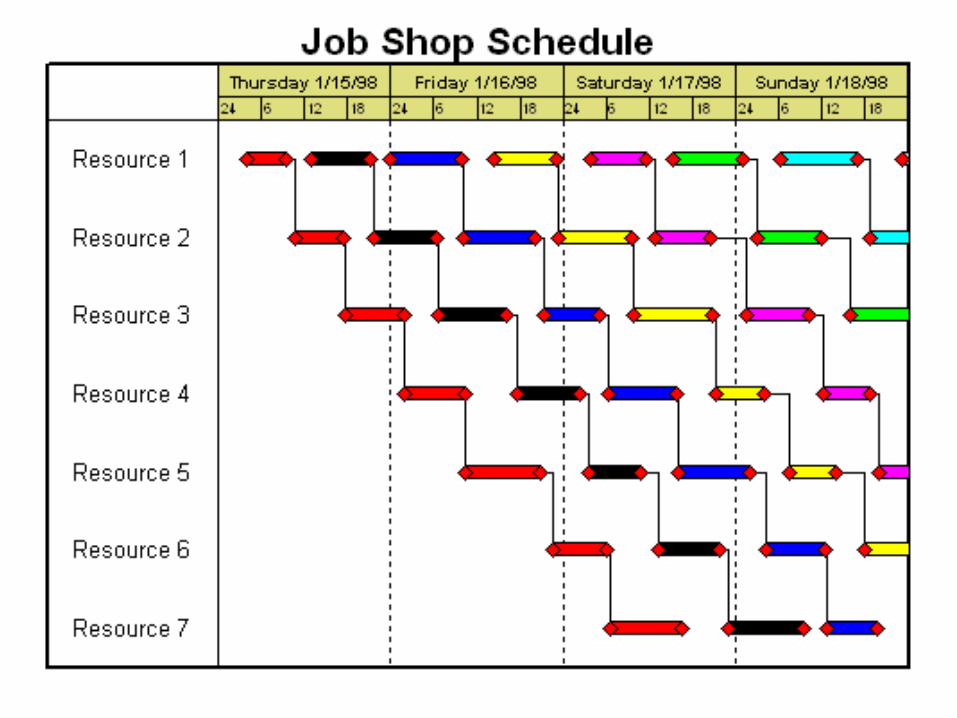
Order SchedulingAssigns production orders to work centers in the
plant
• Executes the dispatching function in
production planning and control
• Solves two problems in production control:
1. Machine loading – allocating orders to work
centers
• Shop loading – loading all machines in the plant
2. Job sequencing – determining the sequence in
which orders will be processed through each
work center
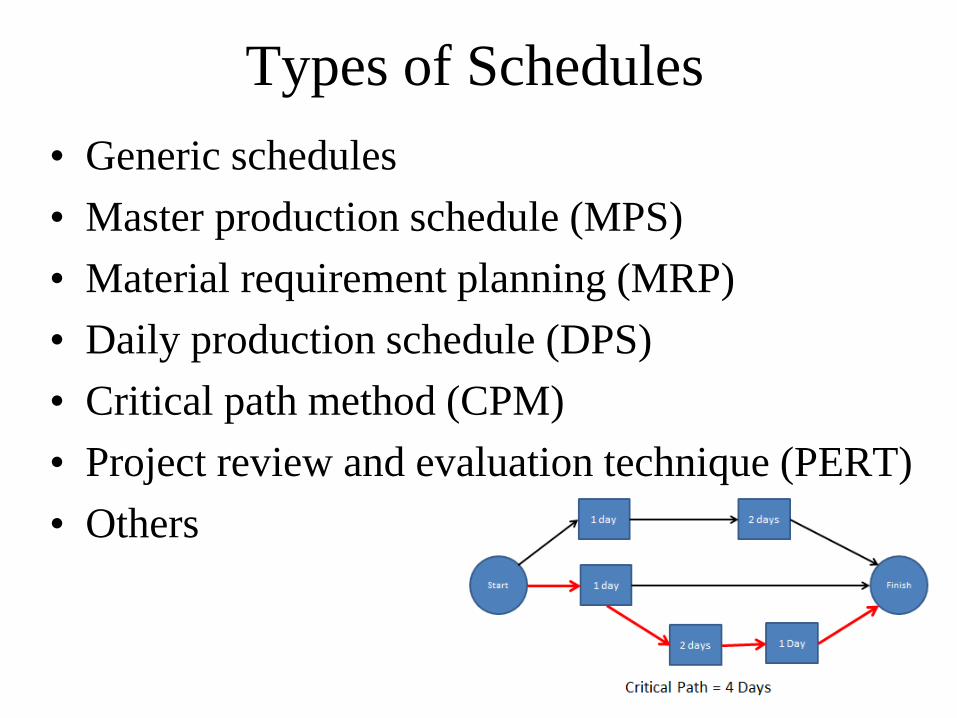
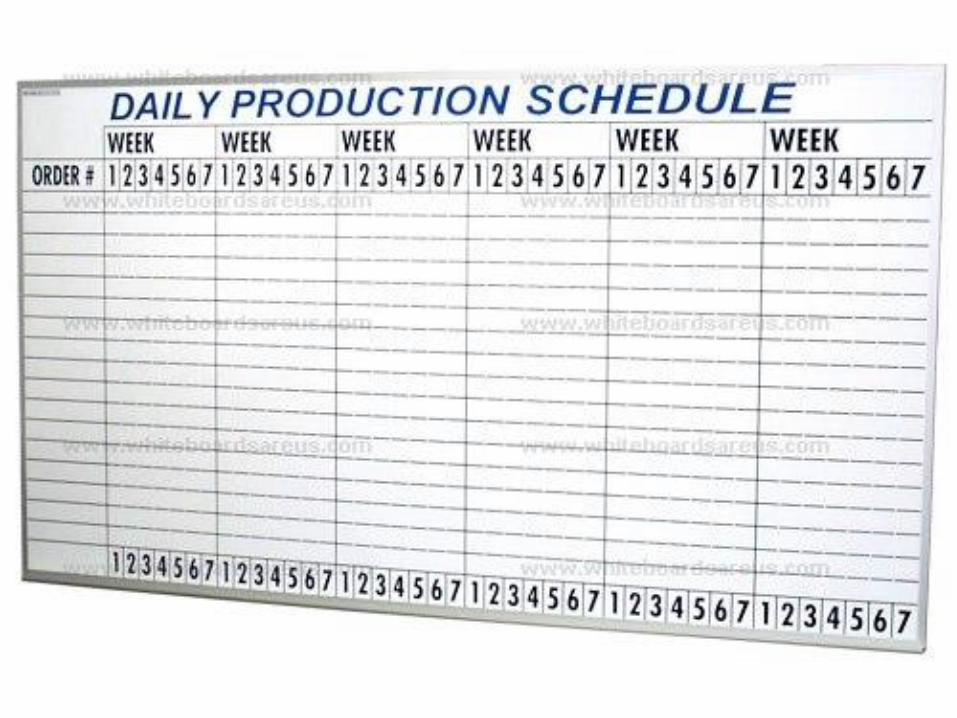
Types of Schedules
• Generic schedules
• Master production schedule (MPS)
• Material requirement planning (MRP)
• Daily production schedule (DPS)
• Critical path method (CPM)
• Project review and evaluation technique (PERT)
• Others

Scheduling in CIM Environment
• Scheduling information in CIM must be:
– Shared by all
– Seen by all
– Retrieved by all
– Contained in the Database
– Must be functional
– Must be in real time
– Must be self updating

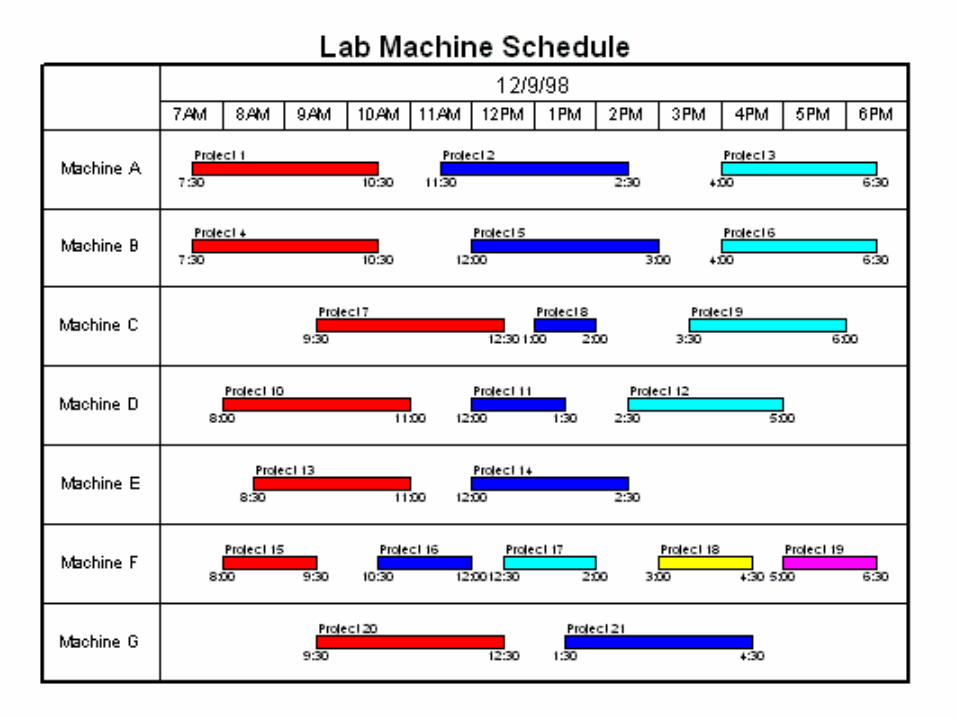
Sample Manufacturing Scheduling
Facilities
Processes
Materials Tooling
Equipment
Operations
People
Product
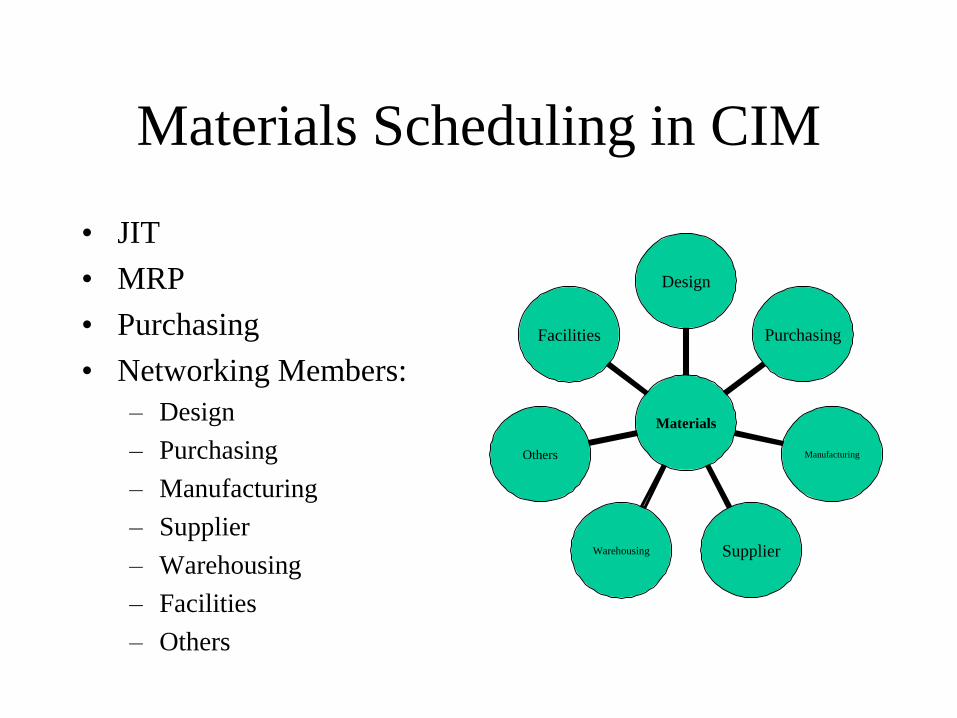
Materials Scheduling in CIM
• JIT
• MRP
• Purchasing
• Networking Members:
– Design
– Purchasing
– Manufacturing
– Supplier
– Warehousing
– Facilities
– Others
Facilities
Others
Warehousing Supplier
Manufacturing
Purchasing
Design
Materials
People Scheduling in CIM
• By job type
• By operation type
• By product type
• By shift


Equipment & Tooling Scheduling in
CIM
• Process types
• Number available
• Routing issues
• Maintenance issues
• Facilities
• Others
Facilities
Others
Maintena
nce
Routing
issues
Availability
Process
Equipment
and Tooling
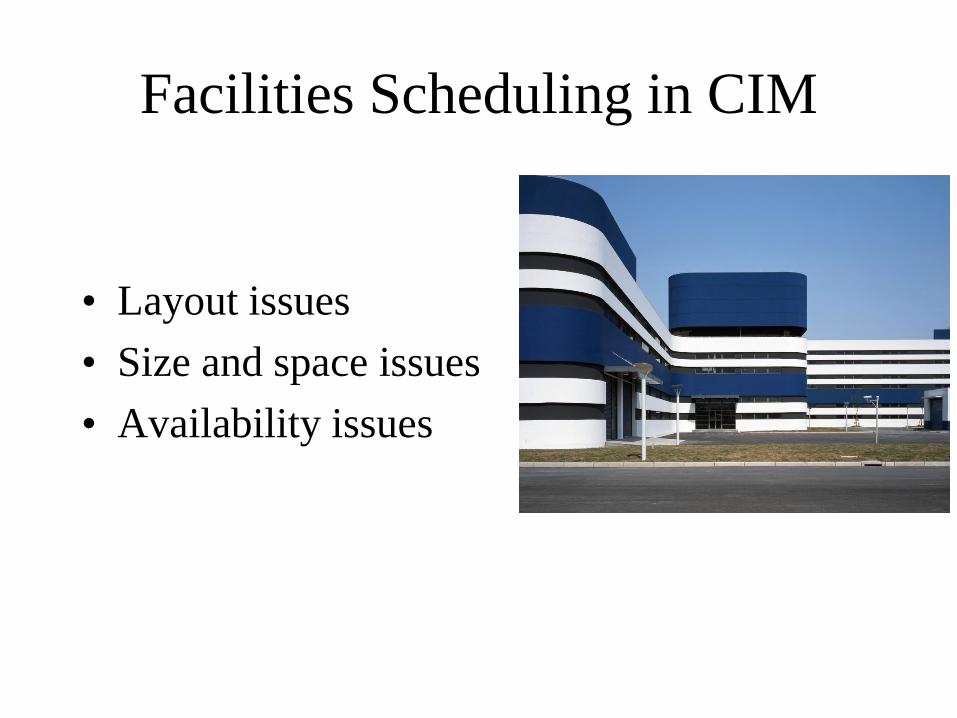
Facilities Scheduling in CIM
• Layout issues
• Size and space issues
• Availability issues
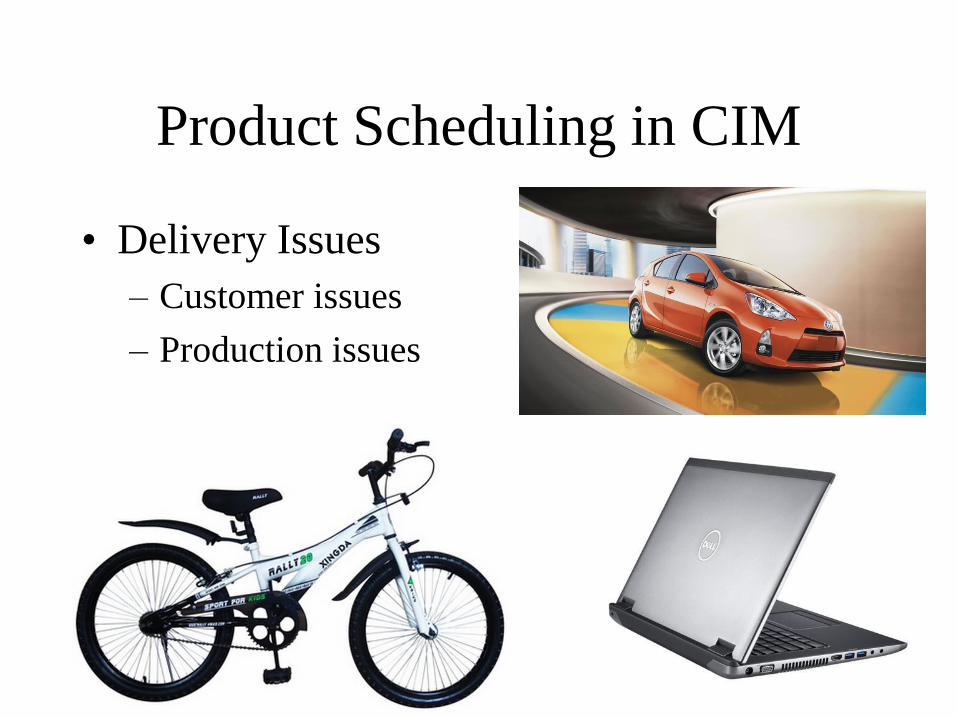
Product Scheduling in CIM
• Delivery Issues
– Customer issues
– Production issues


Inventory Control
• Concerned with achieving an appropriate
compromise between two opposing objectives:
1. Minimizing the cost of holding inventory
• Implies keeping inventory to a minimum
2. Maximizing customer service
• Implies keeping large stocks on hand so the customer
can immediately take possession
Costs of Holding Inventory
1. Investment costs
– Cost of money tied up in inventory until the
customer pays for the finished product
2. Storage costs
– Cost of space to store the inventory
3. Cost of possible obsolescence or spoilage
– Reduction in value of inventory when it cannot be
used
• Collectively, these costs are referred to as
carrying costs or holding costs
Order Point Inventory Systems
• Concerned with two related problems that must
be solved when managing inventories of
independent demand items:
1. How many units should be ordered?
• Often solved by using economic order quantity formulas
2. When should the order be placed?
• Can be solved using reorder point methods
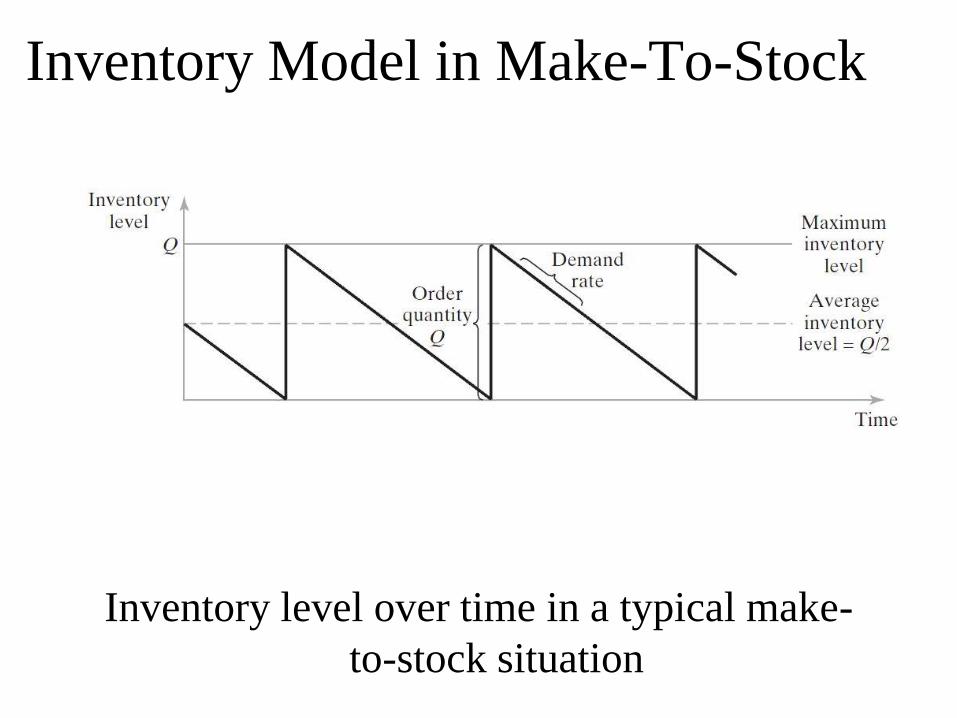
Inventory Model in Make-To-Stock
Inventory level over time in a typical make-
to-stock situation
Economic Order Quantity Formula
• Situations when EOQ formula is appropriate:
1. Demand rate for the item is fairly constant
2. Rate of production is significantly greater than the
demand rate
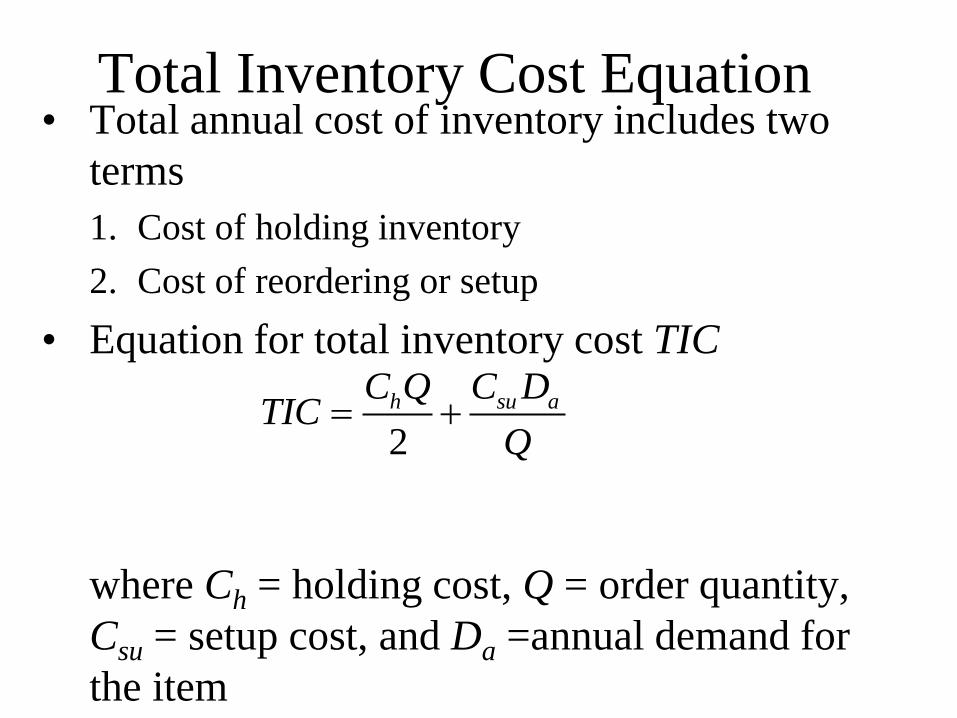
Total Inventory Cost Equation• Total annual cost of inventory includes two
terms
1. Cost of holding inventory
2. Cost of reordering or setup
• Equation for total inventory cost TIC
where Ch = holding cost, Q = order quantity,
Csu = setup cost, and Da =annual demand for
the item
2
h su aC Q C DTIC
Q

EOQ Formula
• By taking the derivative of TIC with respect to
Q and setting the derivative equal to zero, the
minimum cost order quantity can be determined
2 a su
h
D CQ EOQ
C

Reorder Point Systems
• The actual demand rate for the item is not
constant throughout the order cycle
• The time to reorder occurs when the actual
inventory level falls below a point known as the
reorder point
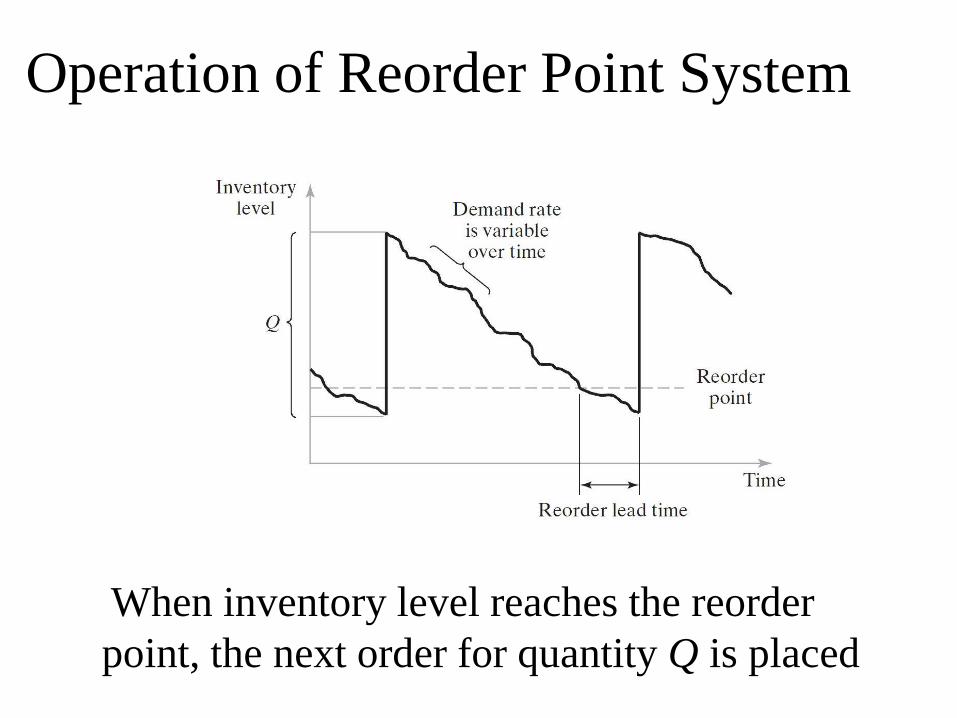
Operation of Reorder Point System
When inventory level reaches the reorder
point, the next order for quantity Q is placed
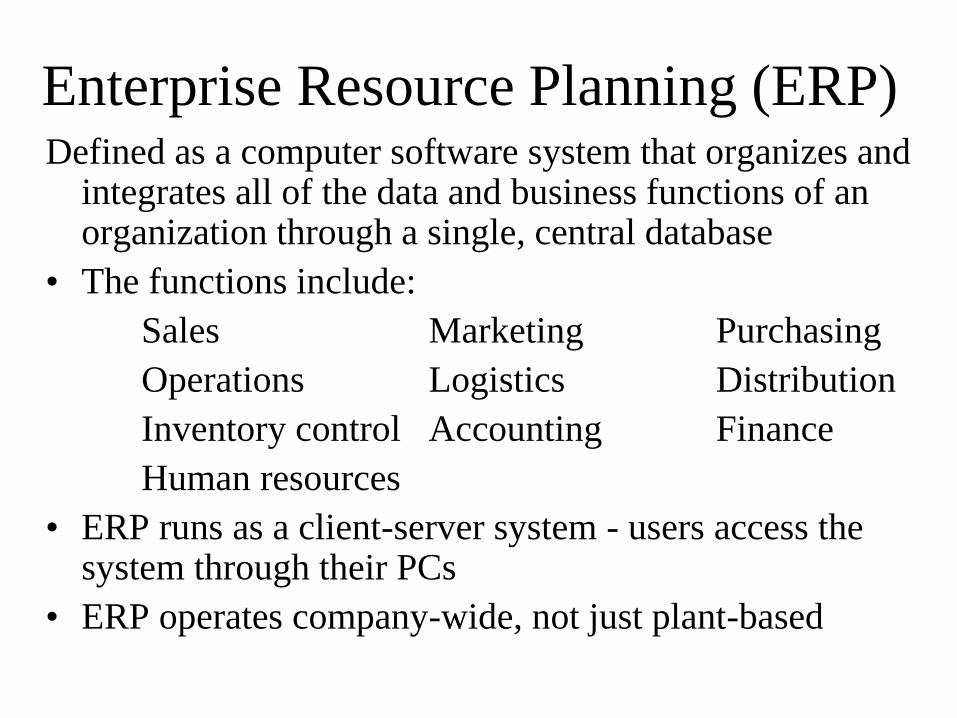
Enterprise Resource Planning (ERP)Defined as a computer software system that organizes and
integrates all of the data and business functions of an organization through a single, central database
• The functions include:
Sales Marketing Purchasing
Operations Logistics Distribution
Inventory control Accounting Finance
Human resources
• ERP runs as a client-server system - users access the system through their PCs
• ERP operates company-wide, not just plant-based
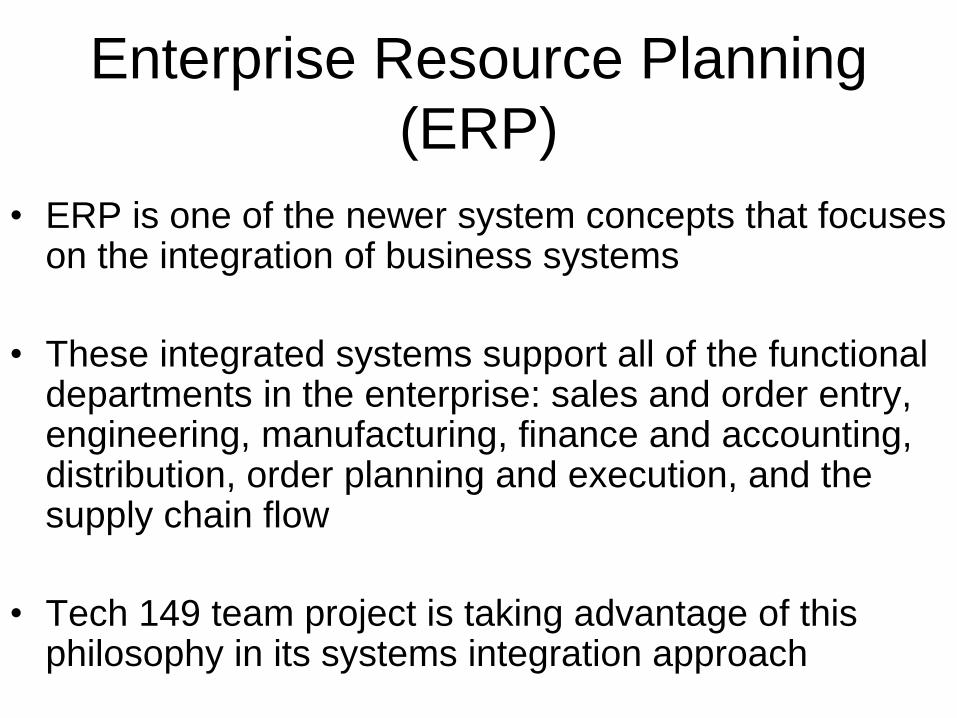
Enterprise Resource Planning
(ERP)
• ERP is one of the newer system concepts that focuses on the integration of business systems
• These integrated systems support all of the functional departments in the enterprise: sales and order entry, engineering, manufacturing, finance and accounting, distribution, order planning and execution, and the supply chain flow
• Tech 149 team project is taking advantage of this philosophy in its systems integration approach
Enterprise Resource Planning
(ERP)
Since businesses are increasingly focusing on
customers, customer relationship management
(CRM) systems are being developed to help
companies manage the information they have
about their customers, the products these
customers buy, and the way the customers
prefer to do business
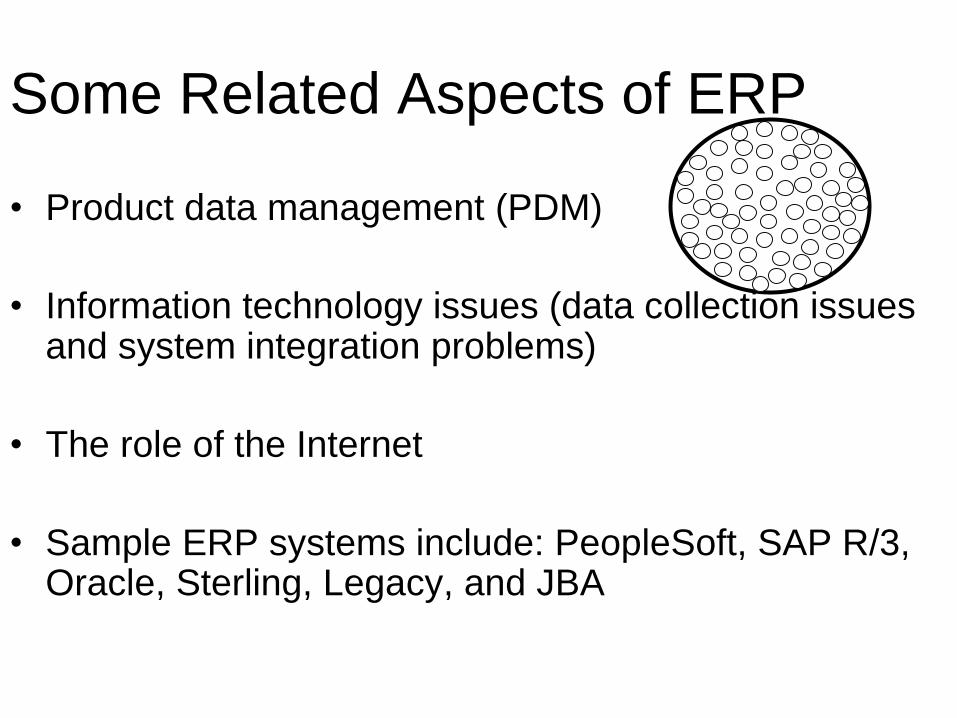
Some Related Aspects of ERP
• Product data management (PDM)
• Information technology issues (data collection issues and system integration problems)
• The role of the Internet
• Sample ERP systems include: PeopleSoft, SAP R/3, Oracle, Sterling, Legacy, and JBA
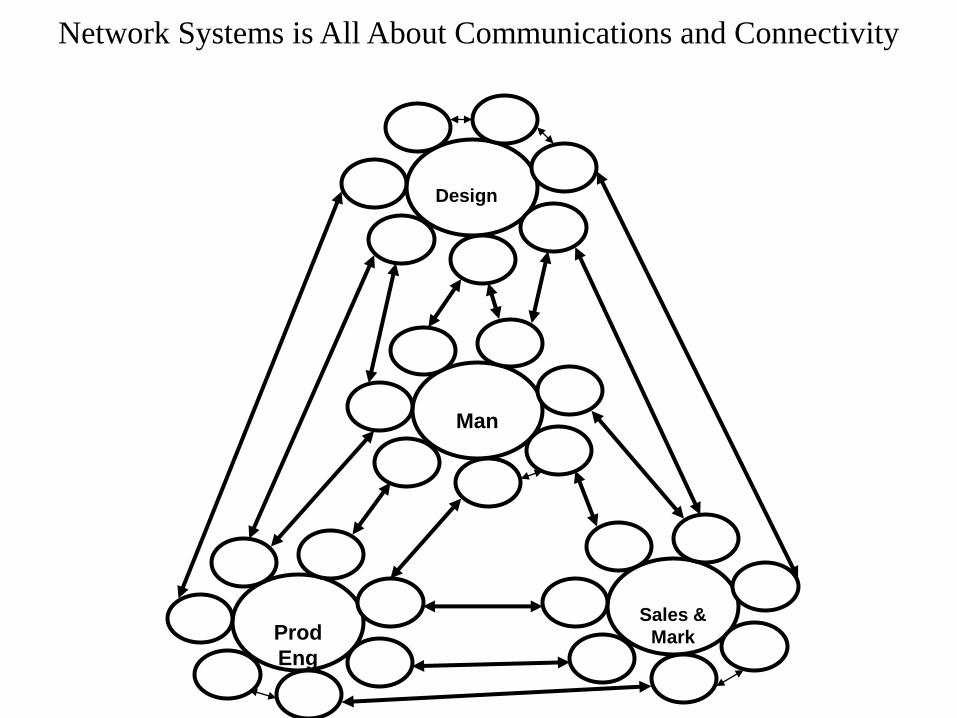
Network Systems is All About Communications and Connectivity
Design
Prod
Eng
Sales &
Mark
Man
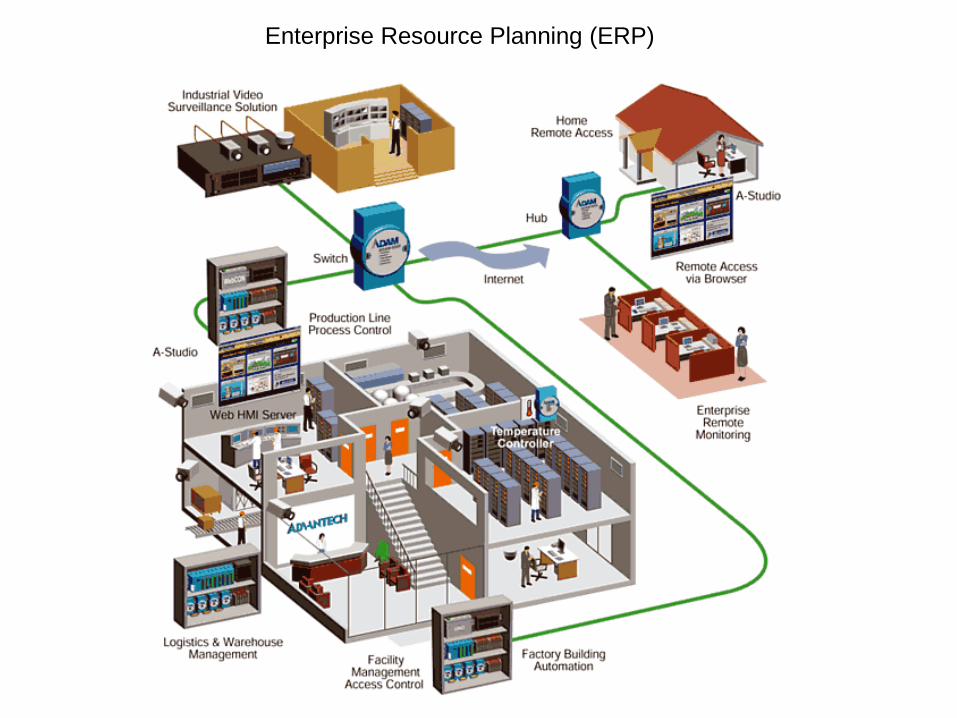
Enterprise Resource Planning (ERP)
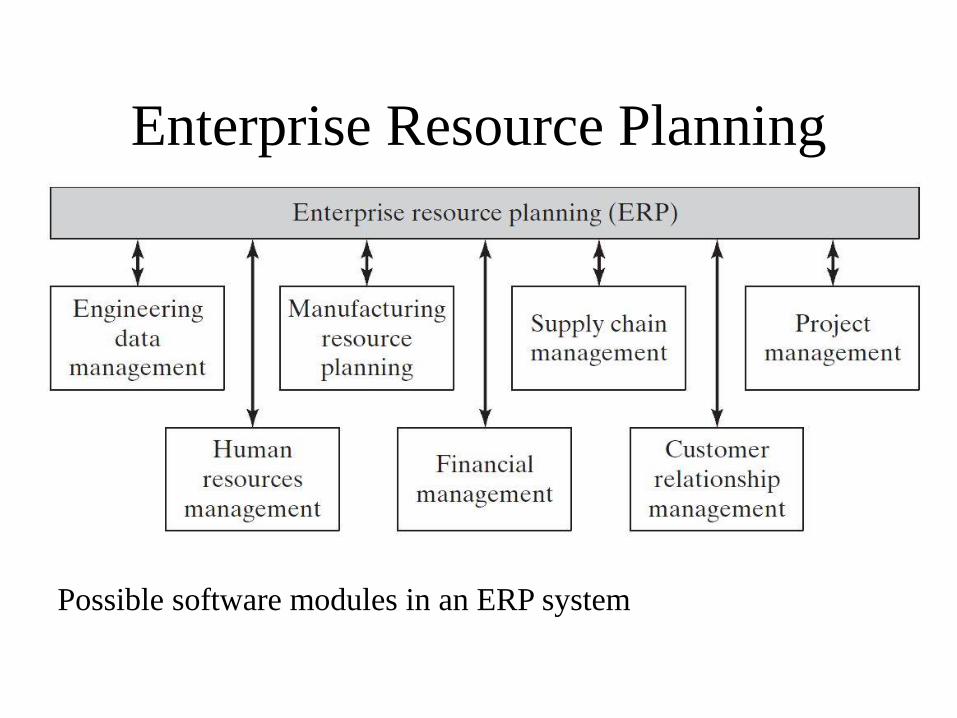
Enterprise Resource Planning
Possible software modules in an ERP system
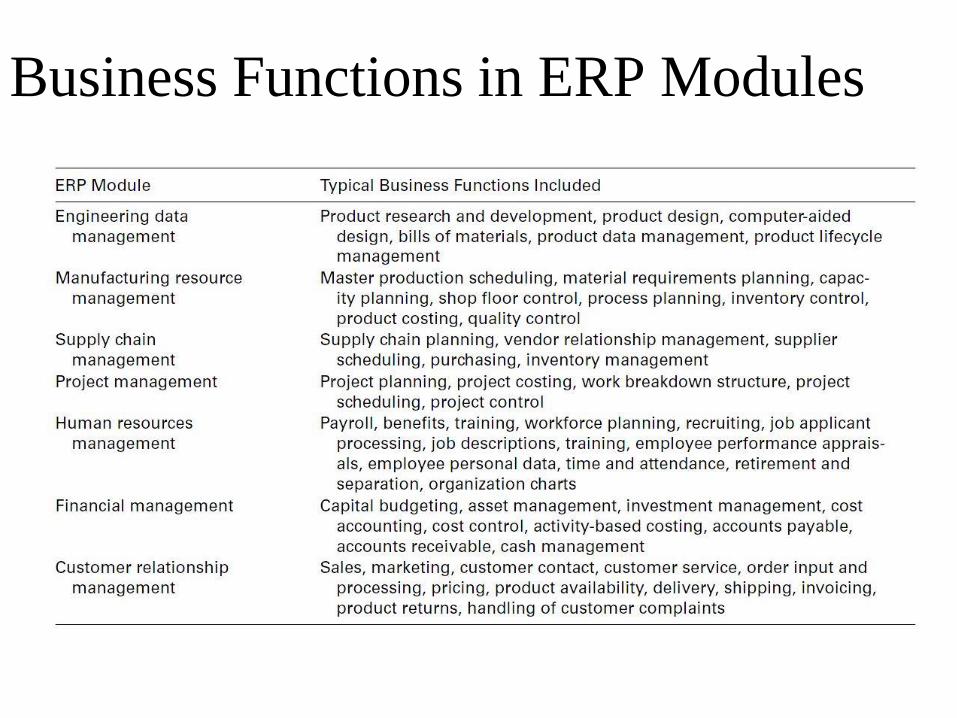
Business Functions in ERP Modules

ERP Uses a Single Database
• Avoids problems such as
– Data redundancy or conflicting data in different
databases
– Time delays in entering the data
– Communication issues between different databases
• Everyone in the organization has access to the
same sets of data according to their individual
job responsibilities
– Not all of the data can be accessed by all employees
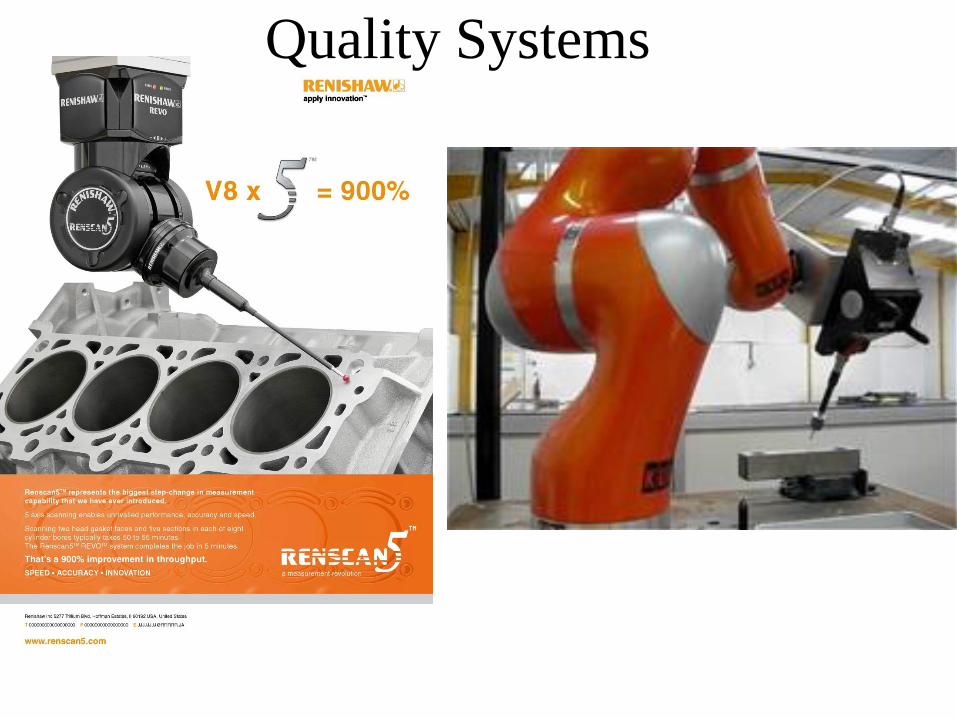
Quality Systems
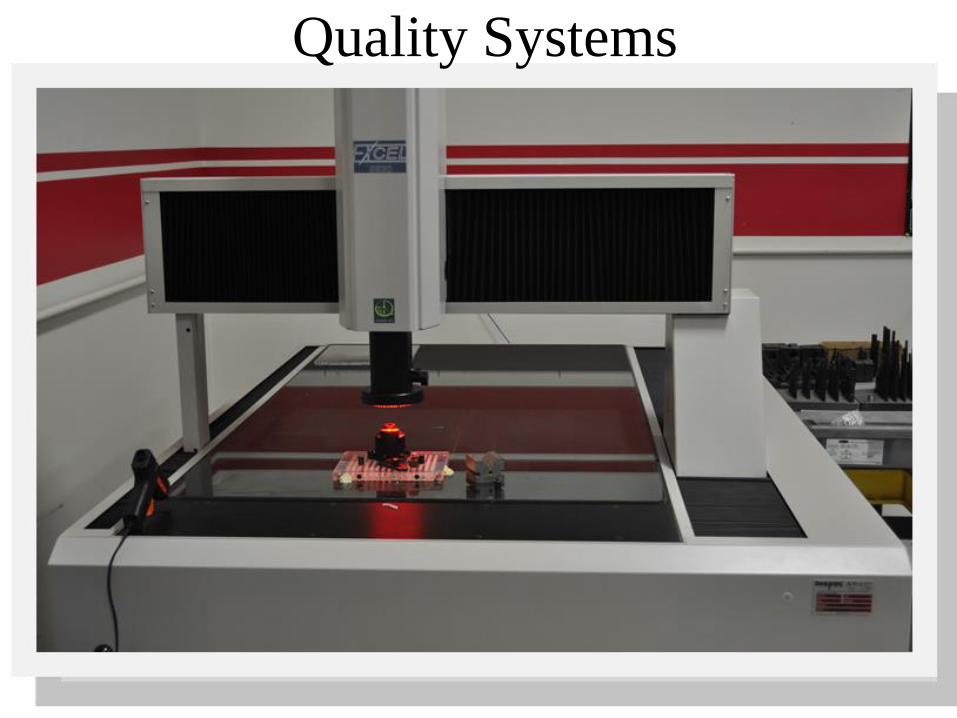
Quality Systems

Quality Systems
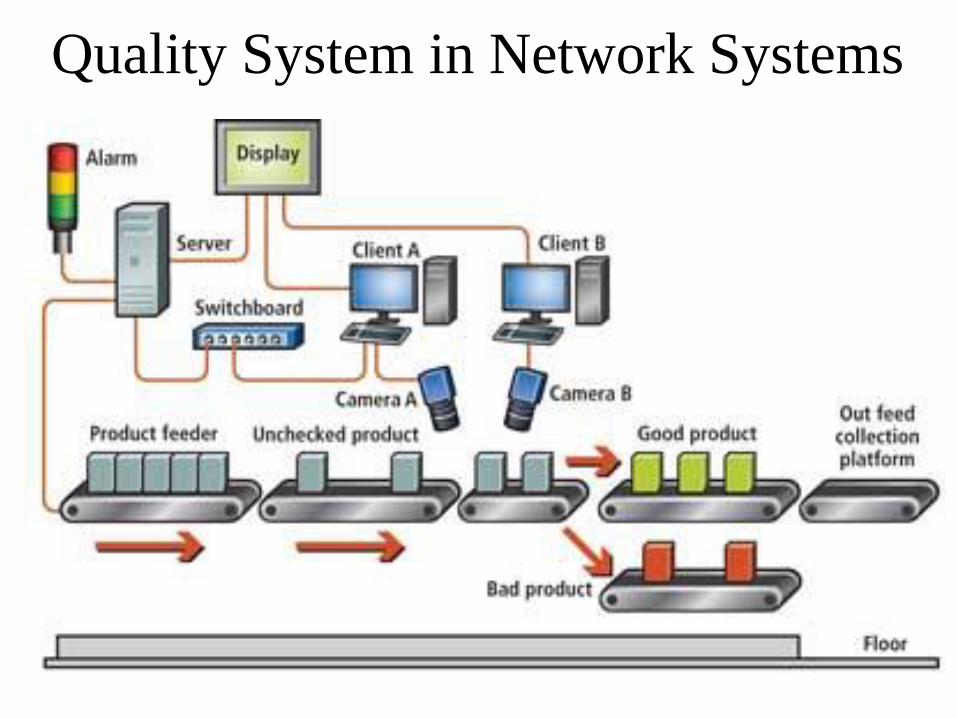
Quality System in Network Systems
Chapter 20: Quality Programs for
Manufacturing
Sections:
1. Quality in Design and Manufacturing
2. Traditional and Modern Quality Control
3. Process Variability and Process Capability
4. Statistical Process Control
5. Six Sigma
6. Taguchi Methods in Quality Engineering
7. ISO 9000

Two Aspects of Quality in Design and
Manufacturing1. Product features
– Characteristics that
result from design
– Functional and
aesthetic features that
appeal to the customer
– “Grade”
2. Freedom from Deficiencies
– Product does what it is
supposed to do
– Product is absent of defects
and out-of-tolerance
conditions

Aspects of Quality: Product Features• Design configuration, size, weight
• Function and performance
• Distinguishing features of the model
• Aesthetic appeal
• Ease of use
• Availability of options
• Reliability and dependability
• Durability and long service life
• Serviceability
• Reputation of product and producer
Aspects of Quality: Freedom from
Deficiencies
• Absence of defects
• Conformance to specifications
• Components within tolerance
• No missing parts
• No early failures
Traditional Quality Control• Widespread use of statistical quality control
(SQC), in which inferences are made about
the quality of the population of
manufactured parts and products based on a
sample
• Two principal sampling methods in SQC
– Control charts
• Graphical technique used to track measured variable
of interest over time
– Acceptance sampling
• If the sample passes, the batch is accepted
Traditional Quality ControlTypical management principles and practices:
• Customers are external to the organization
– The sales and marketing department are responsible
for customers
• Company is organized by functional
departments
• Inspection department is responsible for quality
• Inspection follows production
• Knowledge of SQC techniques resides only in
the minds of the QC experts in the organization
Modern View of Quality Control
High quality is achieved by a combination of:
• Good management – three objectives of
“total quality management”:
1. Achieving customer satisfaction
2. Continuous improvement
3. Encouraging involvement of entire work force
• Good technology – traditional statistical
tools combined with modern measurement
and inspection technologies

Total Quality Management (TQM)
Typical management principles and practices:
• Quality is focused on customer satisfaction
– Internal customers and external customers
• Quality goals are driven by top management
• Quality control is pervasive in the organization
• Quality must be built into the product, not inspected in afterward
– Production workers must inspect their own work
• Continuous improvement
– A never ending chase to design and produce better products
Process Variability
Manufacturing process variations are of two types:
1. Random variations – result from intrinsic
variability in the process
– Process is operating normally
– Human variations from cycle to cycle, minor
variations in starting materials, machine vibration
2. Assignable variations – indicate an exception
from normal operating conditions
– Operator errors, defective raw materials, tool
failures, equipment malfunctions
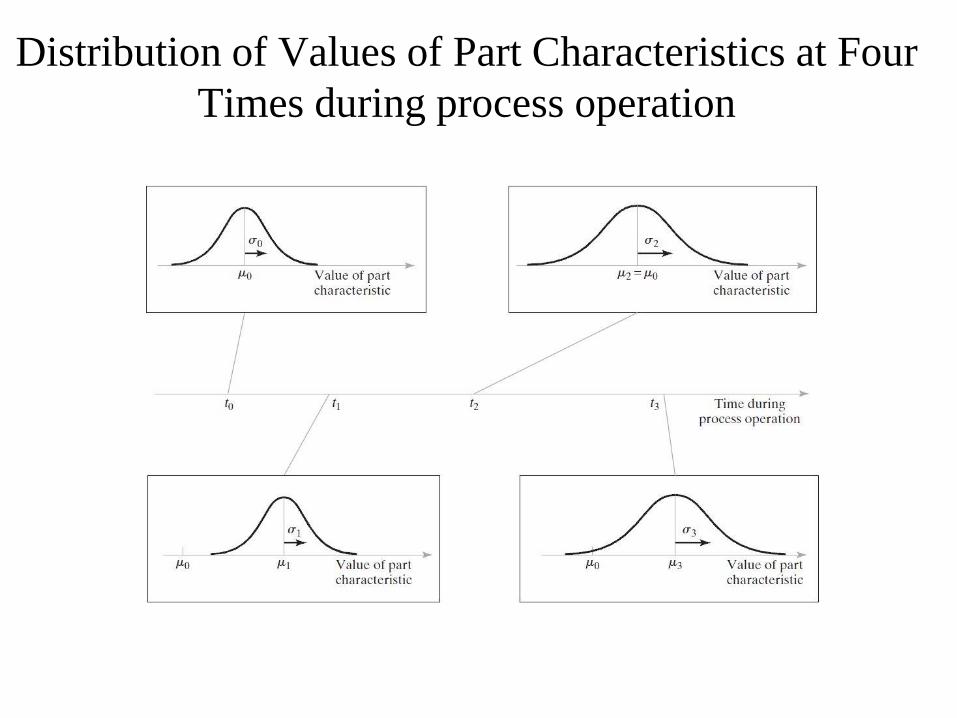
Distribution of Values of Part Characteristics at Four
Times during process operation

Process Capability
PC = 3
where PC = process capability, = process mean
set at nominal value of the parameter of interest
(bilateral tolerances assumed), = standard
deviation of the process
• Assumptions:
– Output is normally distributed
– Steady state operation
– Process is in statistical control
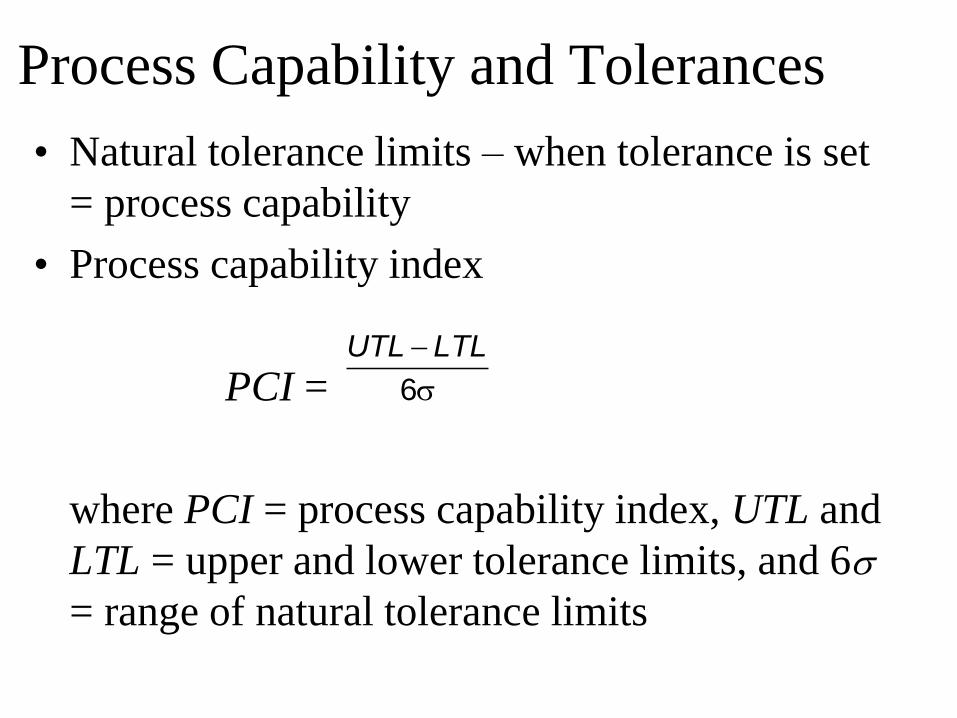
Process Capability and Tolerances
• Natural tolerance limits – when tolerance is set
= process capability
• Process capability index
PCI =
where PCI = process capability index, UTL and
LTL = upper and lower tolerance limits, and 6
= range of natural tolerance limits
UTL LTL
6

Statistical Process Control (SPC)
Use of various methods to measure and analyze a
process, either in manufacturing or non-
manufacturing situations
• Objectives of SPC:
1.Improve quality of process output
2.Reduce process variability and achieve process
stability
3.Solve processing problems

Seven Tools of SPCSometimes referred to as the "magnificent
seven"
1. Control charts
2. Histograms
3. Pareto charts
4. Check sheets
5. Defect concentration diagrams
6. Scatter diagrams
7. Cause and effect diagrams
Control Charts
A graphical technique in which statistics
computed from measured values of a process
characteristic are plotted over time to determine
if the process remains in statistical control
• Underlying principle is that the variations in a
process divide into two categories:
1.Random variations
2.Assignable variations
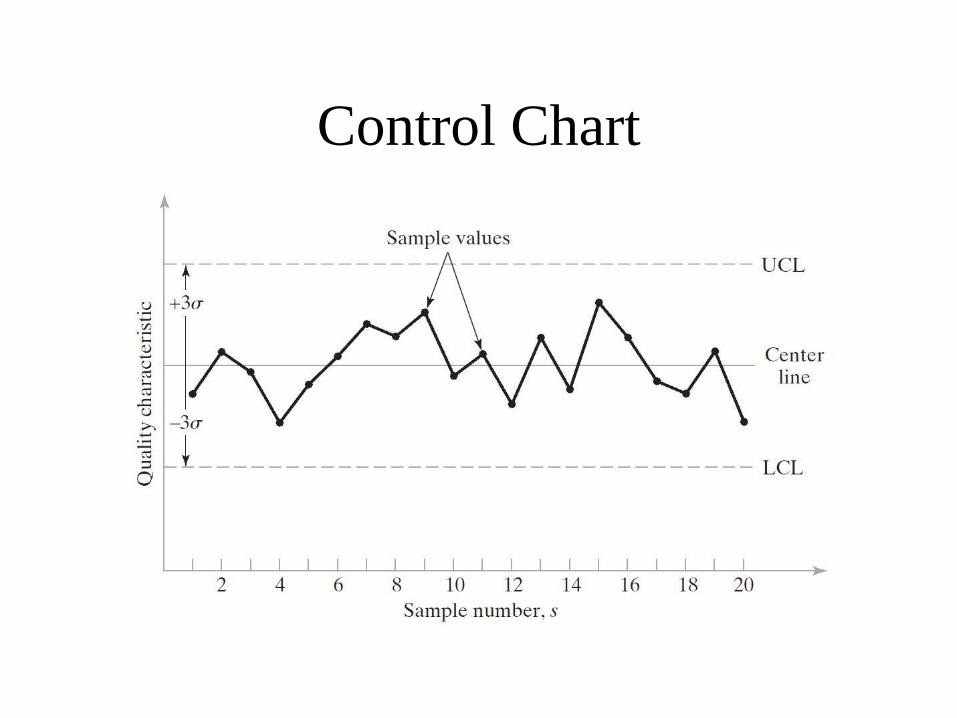
Control Chart
Two Basic Types of Control Charts
1. Control charts for variables
– Require a measurement of the quality characteristic
of interest
– Two principle types: (1) X-bar chart and (2) R chart
2. Control charts for attributes
– Require a determination of either fraction of
defects in the sample or number of defects in the
sample
– Two principle types: (1) p chart and (2) c chart
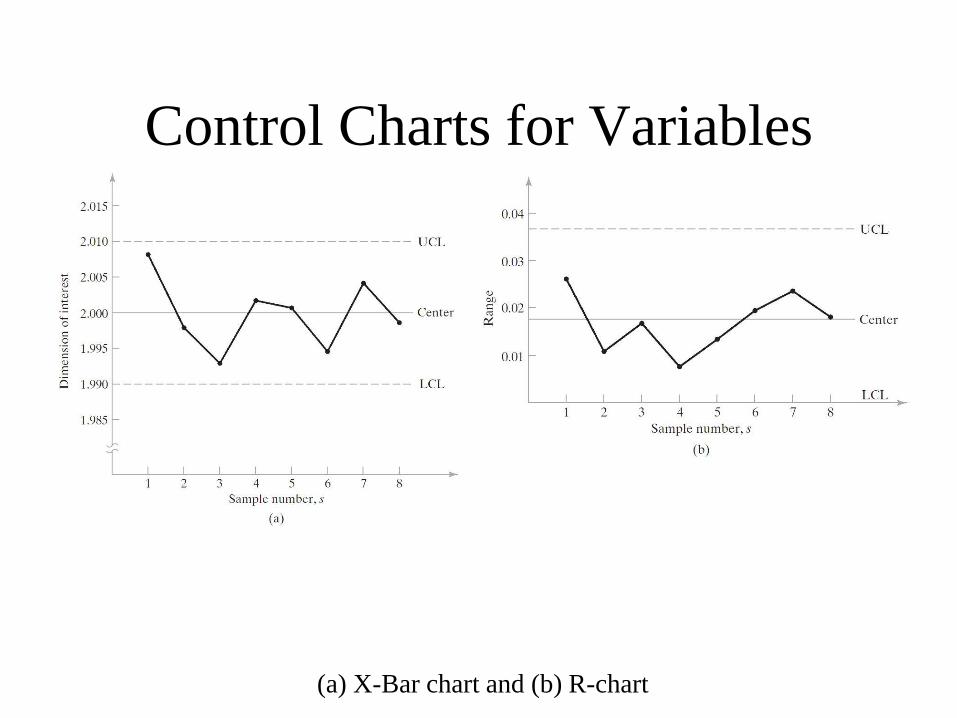
Control Charts for Variables
(a) X-Bar chart and (b) R-chart
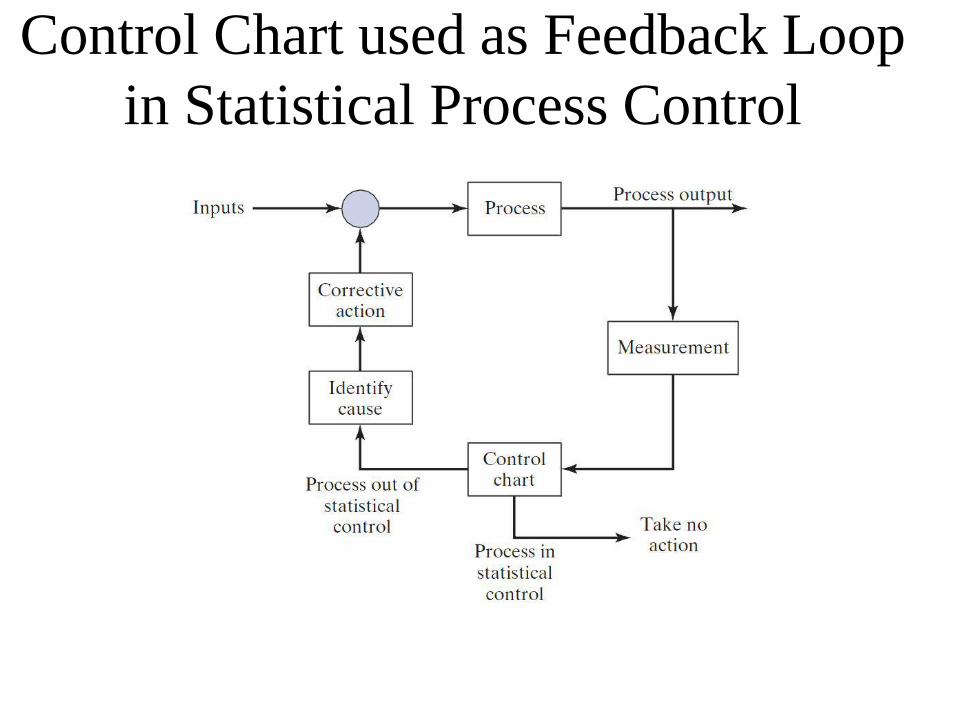
Control Chart used as Feedback Loop
in Statistical Process Control
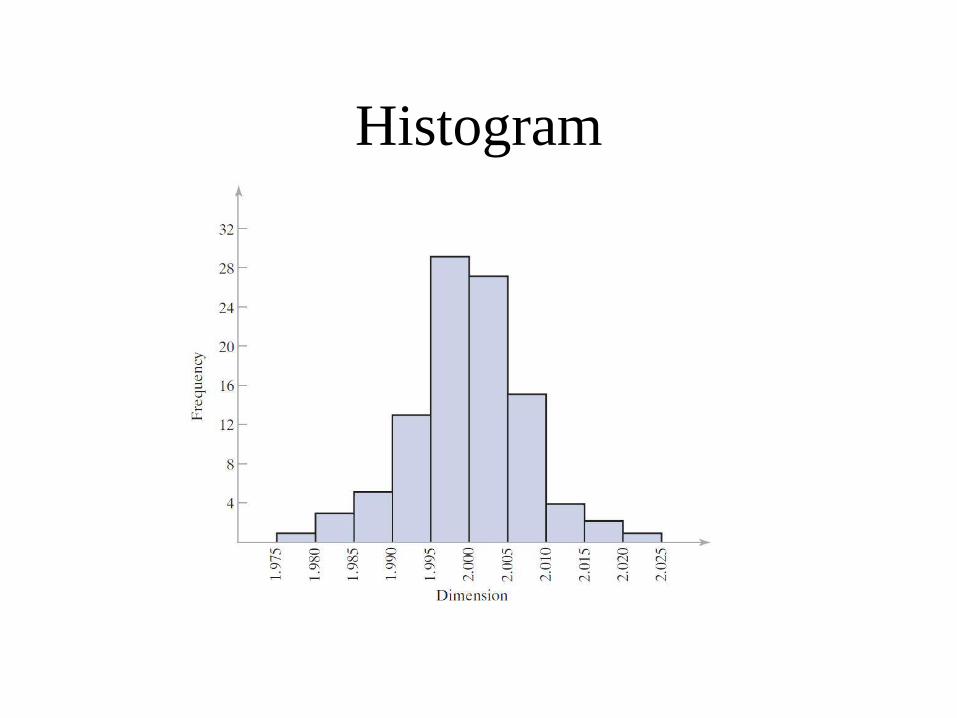
Histogram
Statistical graph consisting of bars representing
different members of a population, in which the
length of each bar indicates the frequency or
relative frequency of each member
• A useful tool because the analyst can quickly
visualize the features of the data, such as:
– Shape of the distribution
– Any central tendency in the distribution
– Approximations of the mean and mode
– Amount of scatter in the data
Histogram
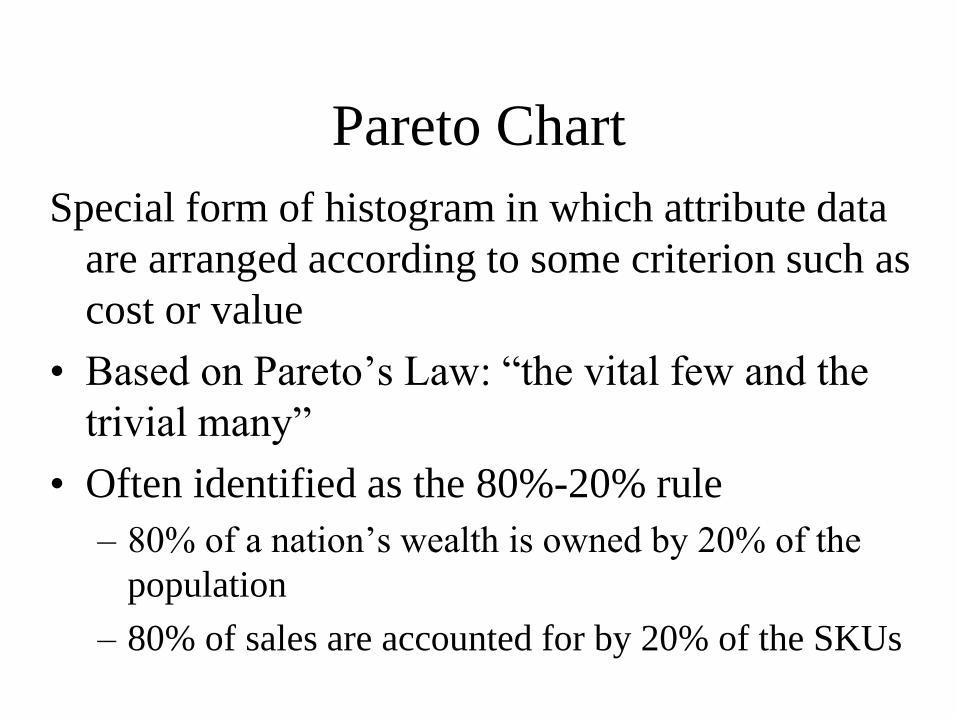
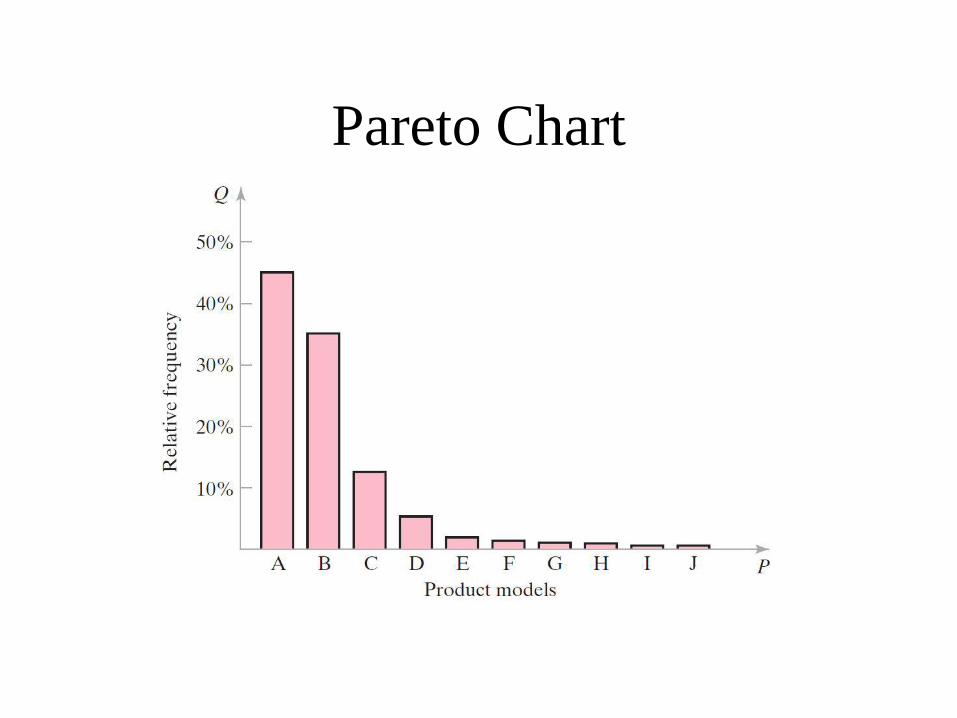
Pareto Chart
Special form of histogram in which attribute data
are arranged according to some criterion such as
cost or value
• Based on Pareto’s Law: “the vital few and the
trivial many”
• Often identified as the 80%-20% rule
– 80% of a nation’s wealth is owned by 20% of the
population
– 80% of sales are accounted for by 20% of the SKUs
Pareto Chart
Check SheetData collection tool generally used in the
preliminary stages of a study of a quality problem
• Data often entered by worker as check marks in a given category
• Examples:
– Process distribution check sheet - data on process variability
– Defective item check sheet – types and frequencies of defects on the product
– Defect location check sheet - where defects occur on the product
Defect Concentration Diagram
A drawing of the product (all relevant views), onto
which the locations and frequencies of various
defect types are added
• Useful for analyzing the causes of product or
part defects
• By analyzing the defect types and corresponding
locations, the underlying causes of the defects
can possibly be identified

Scatter Diagrams
An x-y plot of data collected on two variables,
where a correlation between the variables is
suspected
• The data are plotted as pairs; for each xi value,
there is a corresponding yi value
• The shape of the collection of data points often
reveals a pattern or relationship between the two
variables

Scatter Diagram
Effect of cobalt
binder content on
wear resistance
of a cemented
carbide cutting
tool insert
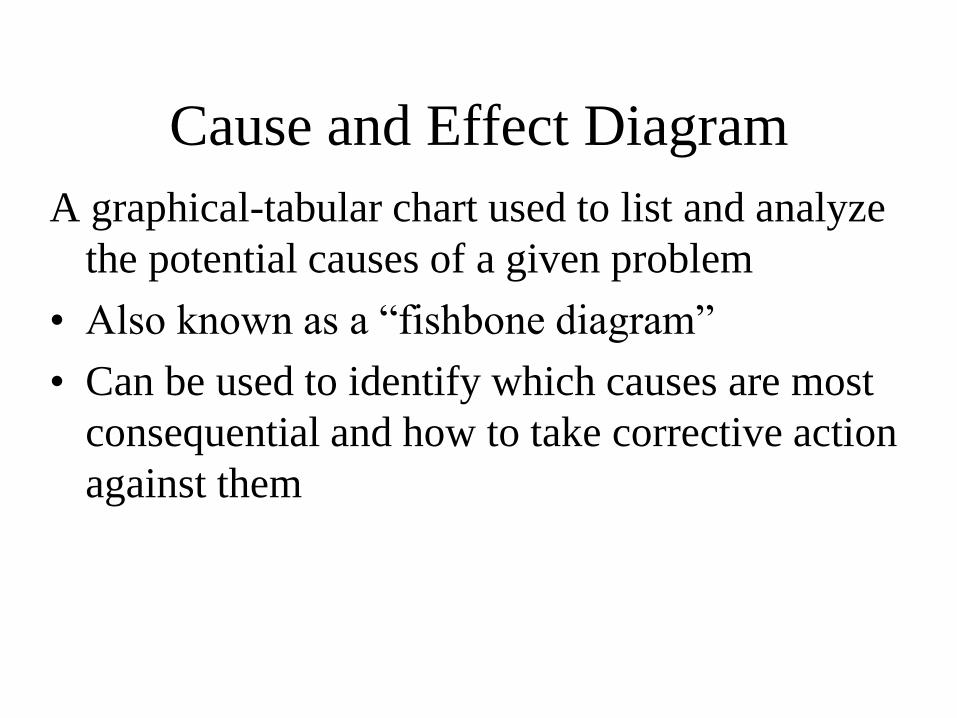
Cause and Effect Diagram
A graphical-tabular chart used to list and analyze
the potential causes of a given problem
• Also known as a “fishbone diagram”
• Can be used to identify which causes are most
consequential and how to take corrective action
against them
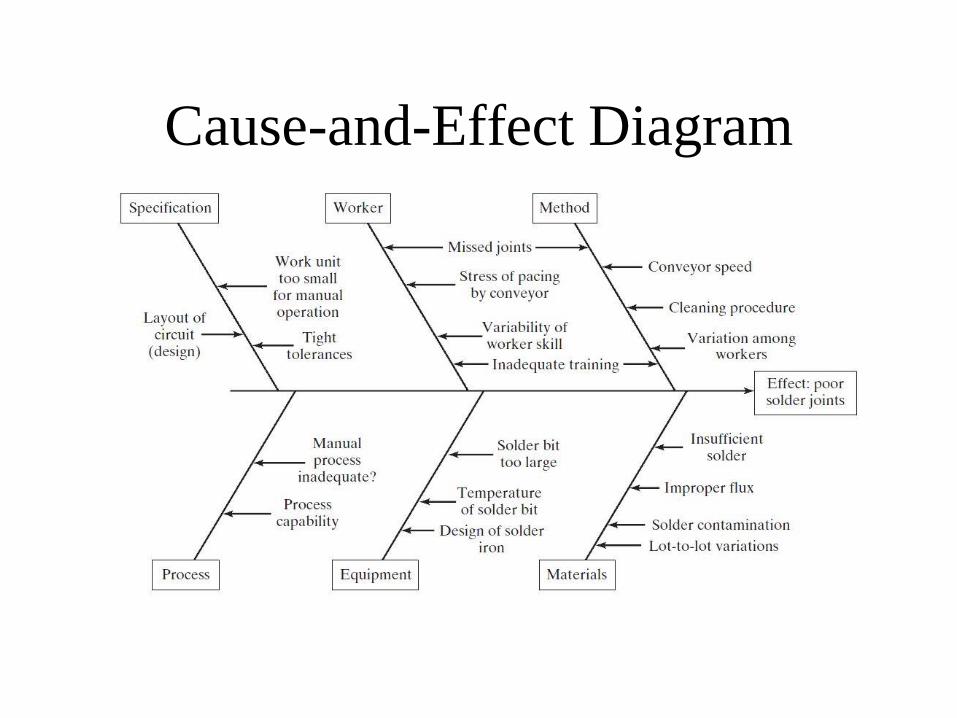
Cause-and-Effect Diagram

Implementing SPC
Five elements usually present in a successful SPC program:
1. Management commitment and leadership
– Management sets the example for others to follow
2. Team approach to problem solving
– Team members contribute a broad pool of knowledge
3. SPC training for all employees
4. Emphasis on continuous improvement throughout the
organization
5. A recognition and communication system to recognize
successful SPC efforts
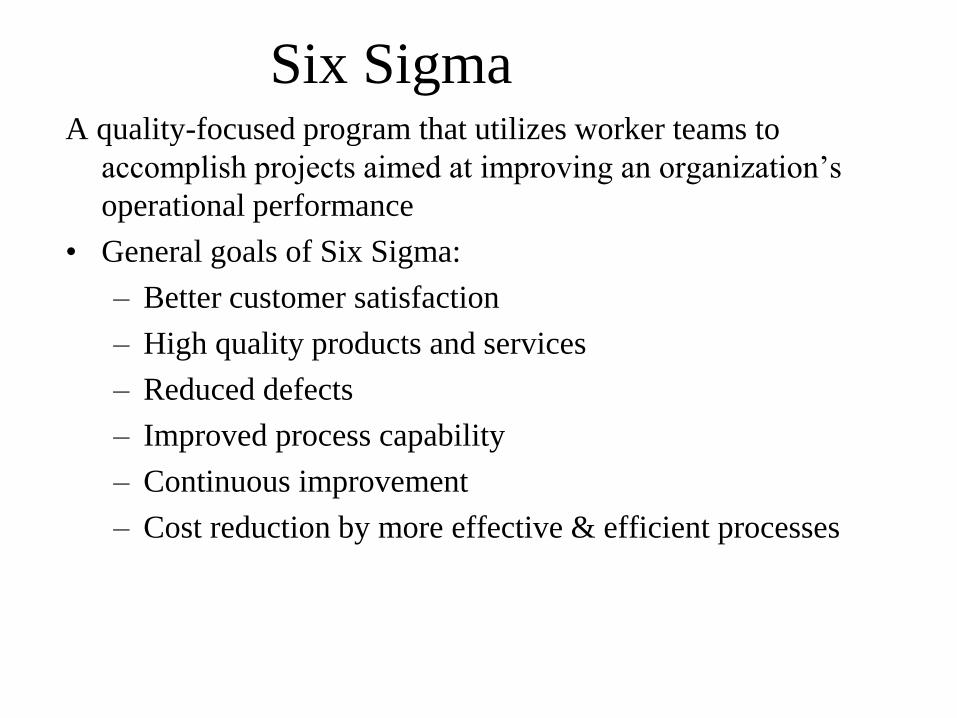
Six SigmaA quality-focused program that utilizes worker teams to
accomplish projects aimed at improving an organization’s
operational performance
• General goals of Six Sigma:
– Better customer satisfaction
– High quality products and services
– Reduced defects
– Improved process capability
– Continuous improvement
– Cost reduction by more effective & efficient processes
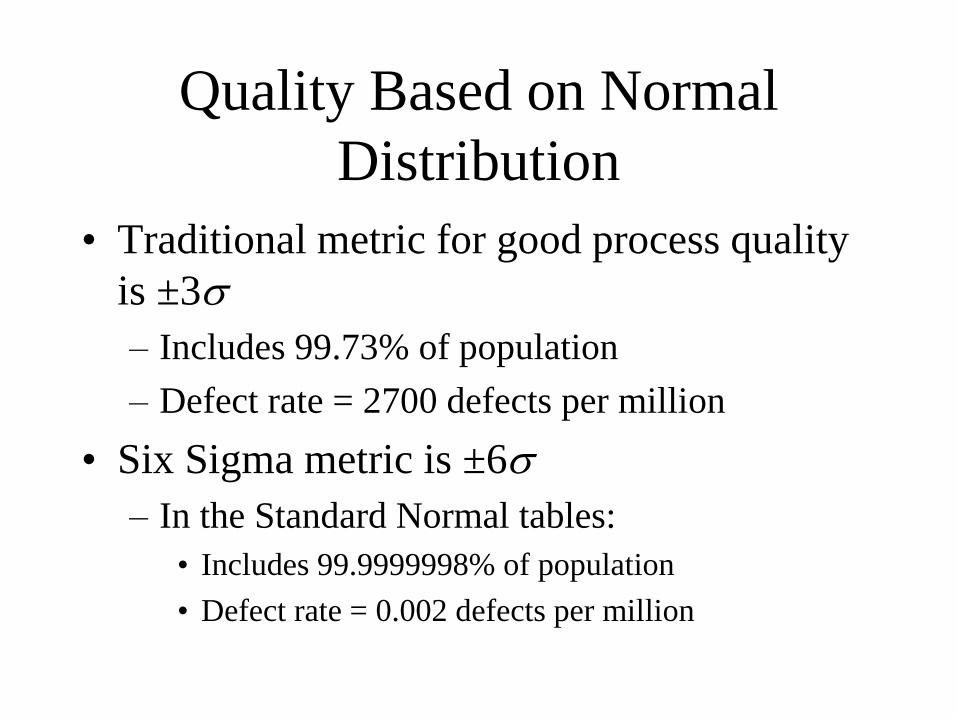
Quality Based on Normal
Distribution
• Traditional metric for good process quality
is ±3
– Includes 99.73% of population
– Defect rate = 2700 defects per million
• Six Sigma metric is ±6
– In the Standard Normal tables:
• Includes 99.9999998% of population
• Defect rate = 0.002 defects per million
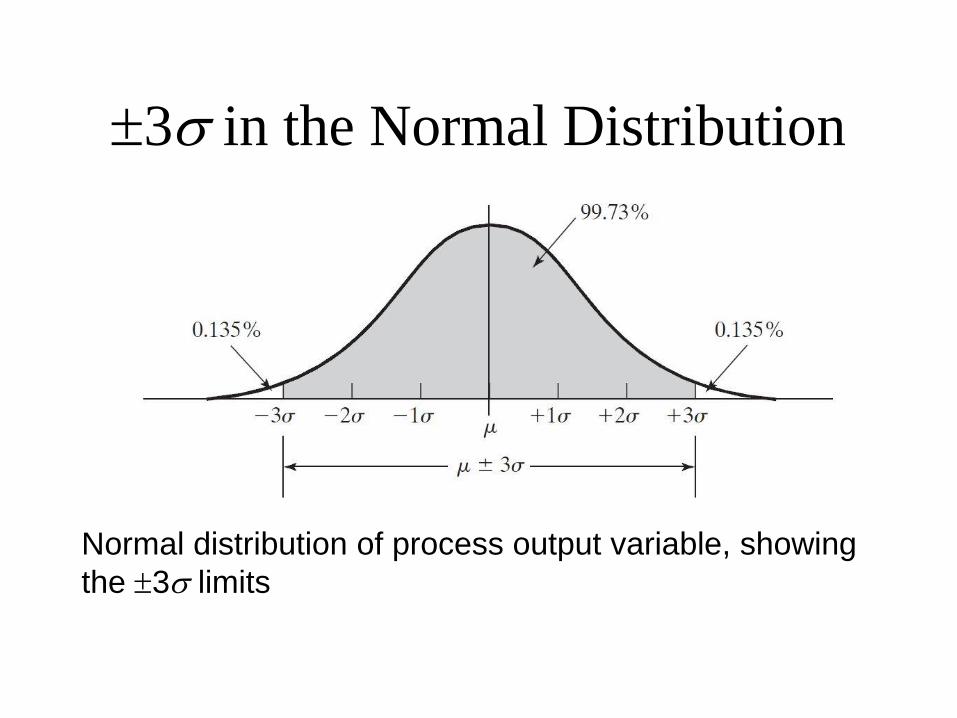
3 in the Normal Distribution
Normal distribution of process output variable, showing
the 3 limits

6 in the Normal Distribution
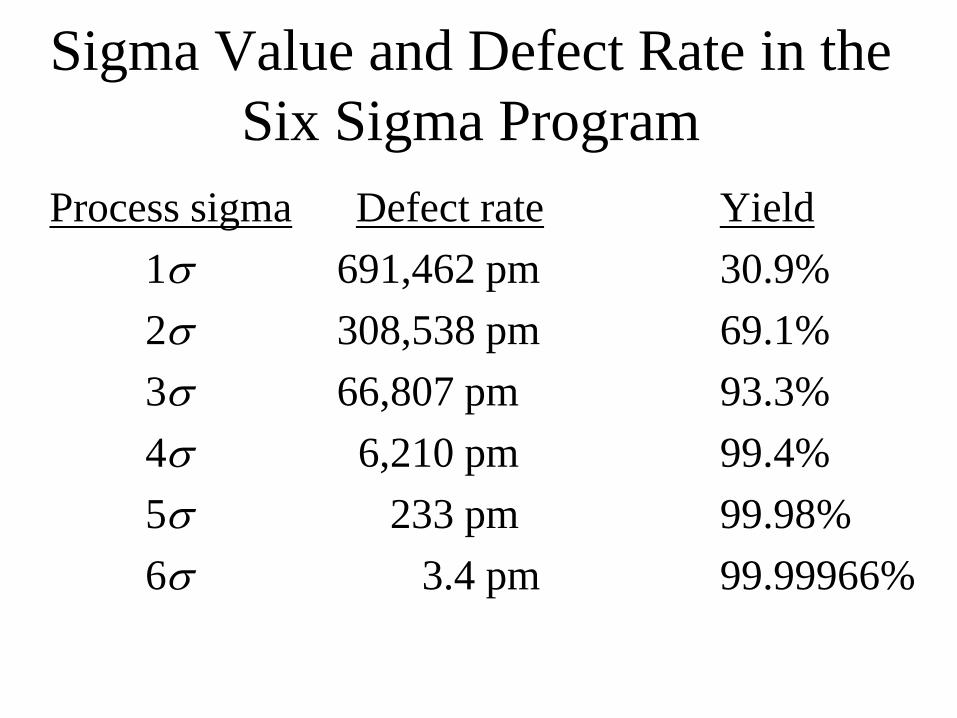
Sigma Value and Defect Rate in the
Six Sigma Program
Process sigma Defect rate Yield
1 691,462 pm 30.9%
2 308,538 pm 69.1%
3 66,807 pm 93.3%
4 6,210 pm 99.4%
5 233 pm 99.98%
6 3.4 pm 99.99966%

Taguchi Methods in Quality Engineering
Quality engineering = broad range of engineering
and operational activities whose aim is to
ensure that a product’s quality characteristics
are at their nominal or target values
• Shares much with Total Quality Management
• Taguchi methods:
1. Robust design
2. Taguchi loss function
Taguchi Loss Function• According to Taguchi, quality is “the loss a
product costs society from the time the product is released for shipment”
• Loss includes:
– Costs to operate
– Failure to function, maintenance and repair costs
– Customer dissatisfaction
– Injuries caused by poor design, etc.
• Defective products (or their components) that are detected, repaired, reworked prior to shipment are manufacturing costs
ISO 9000• ISO = International Organization for Standardization
• U.S. representative to ISO 9000 is ANSI/ASQC
• ISO 9000 is a standard for the systems and procedures
used by a facility that affect the quality of the products and
services provided by the facility
– It is not a standard for the products and services
• ISO 9000 is generic, not industry specific
– It can be applied to any facility producing any product
or providing any service
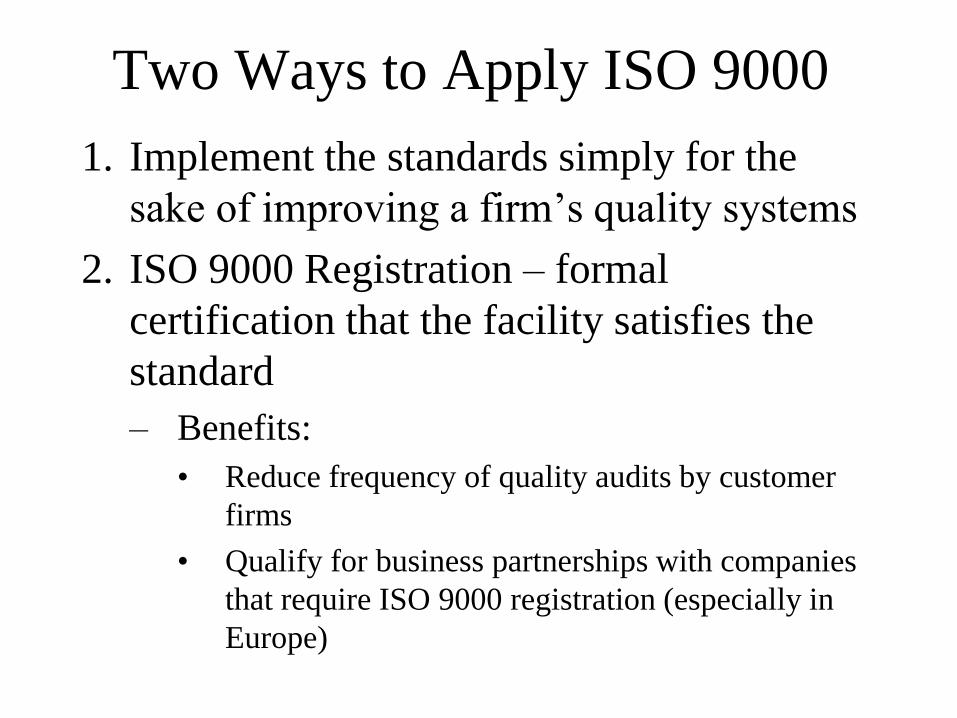
Two Ways to Apply ISO 9000
1. Implement the standards simply for the
sake of improving a firm’s quality systems
2. ISO 9000 Registration – formal
certification that the facility satisfies the
standard
– Benefits:
• Reduce frequency of quality audits by customer
firms
• Qualify for business partnerships with companies
that require ISO 9000 registration (especially in
Europe)


![ETSI ISG CIM · [JSON-LD] 20170608 Introduction to ISG CIM CIM-002-UC CIM -003 GAP CIM-004-APIprelim CIM-005-DPP CIM-001-AB ) CIM-006-MOD0. Timeline in ToR 02/2017 First General Meeting](https://static.documents.pub/doc/80x56/6002860fd1e0f63f360db5f2/etsi-isg-cim-json-ld-20170608-introduction-to-isg-cim-cim-002-uc-cim-003-gap.jpg)


