27
Tech Clusters William R. Kerr Frederic Robert-Nicoud Working Paper 20-063
Tech Clusters William R. Kerr Frederic Robert-Nicoud
Working Paper 20-063
Working Paper 20-063
Copyright © 2019, 2020 by William R. Kerr and Frederic Robert-Nicoud.
Working papers are in draft form. This working paper is distributed for purposes of comment and discussion only. It may not be reproduced without permission of the copyright holder. Copies of working papers are available from the author.
Funding for this research was provided in part by Harvard Business School.
Tech Clusters William R. Kerr Harvard Business School
Frederic Robert-Nicoud University of Geneva
1
Tech Clusters
William R. Kerr and Frederic Robert-Nicoud
William R. Kerr is the Dimitri V. D'Arbeloff—MBA Class of 1955 Professor of Business
Administration, Harvard Business School, Boston, Massachusetts and Research Associate,
National Bureau of Economic Research, Cambridge, Massachusetts. Frederic Robert-Nicoud is
Professor of Economics, Geneva School of Economics and Management (GSEM), University of
Geneva, Geneva, Switzerland, and Research Fellow, Centre for Economic Policy Research,
London, United Kingdom. Kerr is the corresponding author at [email protected].
Keywords: clusters, agglomeration, innovation, entrepreneurship, patents.
Abstract: Tech clusters like Silicon Valley play a central role for modern innovation, business
competitiveness, and economic performance. This paper reviews what constitutes a tech cluster,
how they function internally, and the degree to which policy makers can purposefully foster them.
We describe the growing influence of advanced technologies for businesses outside of traditional
tech fields, the strains and backlash that tech clusters are experiencing, and emerging research
questions for theory and empirical work.
The authors thank Harald Bathelt, Neil Coe, Ed Glaeser, Gordon Hanson, Enrico Moretti, Ramana
Nanda, Will Strange, Timothy Taylor, and Heidi Williams for their insightful thoughts, comments,
or feedback on this paper. The authors also thank Brad Chattergoon, Maggie Dalton, Brad
DeSanctis, and Louis Maiden for excellent research assistance.

2
While Silicon Valley houses less than 0.1 percent of the world’s population, its shadow looms
large. Many cities aspire to be a tech cluster: for example, an astounding 238 US cities jumped
through hoops in 2017-18 to enter Amazon’s infamous “bidding” process for where it would
establish a second headquarters. Wikipedia lists more than 25 efforts to brand a US location as
“Silicon Something,” along with many foreign ones (at https://en.wikipedia.org/wiki/List_of_
technology_centers#United_States). Our personal favorite names are Silicon Peach (Atlanta) and
Silicon Spuds (Idaho), whereas Silicon Prairie has at least four contenders. Other US examples
include Silicon Anchor, Basin, Desert, Forest, Hill, Holler, Mountain, Shire and Surf.
This paper examines the tech cluster phenomenon by considering three only partially answered
questions. We first ask how we might define a tech cluster—that is, what properties are required
to be a tech cluster? This delineation is harder than it first looks and raises some key questions
and issues. We start with the scale and density of local activity and then extend into the frontier
nature of the work being undertaken and its ability to impact multiple sectors of the economy.
We illustrate our definition through some common metrics like patents, venture capital funding,
and employment in R&D intensive sectors or digital-connected occupations. We also note some
interesting clues from emerging metrics (e.g., high-growth entrepreneurship, artificial
intelligence researchers) and recent efforts to measure tech clusters globally.
We then ask how tech clusters function, with a focus on traits that extend beyond those
associated with traditional industrial clusters. Not surprisingly, knowledge spillovers are a
powerful force in tech clusters, and recent work explores how knowledge transmits across firms
situated in a tech cluster and how density impacts the types of innovations created. Tech clusters
facilitate powerful scaling for the best designs when they combine modular product structures
with high-velocity labor markets. Universities, high-skilled immigration, and global production
linkages also feature prominently in the functioning of leading US centers.
Finally, we turn to the roots of tech clusters and inquire into the mix of initial ingredients
required for their formation. Leading tech clusters are far from permanent and have frequently
emerged in new places following the advent of new general purpose technologies. Today, the
rapid growth of Toronto as an artificial intelligence cluster suggests that there may be limits of
Silicon Valley’s grip on this frontier. Yet, despite the government having played an important
role in this history of many tech clusters, top-down attempts to re-create Silicon Valley have
mostly failed (Lerner 2009). Our historical examples suggest that local officials may instead
want to facilitate the scaling of nascent industries that have taken root, even if due to random
chance, rather than attempt to engineer a cluster from scratch.
We conclude with some thoughts on future research opportunities, including the question of
whether tech clusters are at their high-water mark or are likely to strengthen further. The
implications of the ongoing COVID-19 crisis for tech clusters could be profound. Our discussion
focuses primarily on the US economy, but much of what we describe applies to other countries
as well. We ground our discussion firmly within the economics and management disciplines,
occasionally reaching out in incomplete ways to other social sciences as we go.
3
Defining Tech Clusters
While it is easy to point to high profile examples of tech clusters, such as Seattle or Austin,
developing even a semi-formal definition is tricky. “Clusters” traditionally indicate an important
overall scale of local activity, complemented by spatial density and linkages among local firms
(e.g., Marshall 1890, Porter 1998). As discussed further below, the specific linked activities for
tech clusters might include engineer mobility across employers, flows of technical knowledge,
and reliance on shared local inputs like a research university. In addition to these traditional
dimensions, we define “tech” clusters to be locations where new products (be they goods or
services) and production processes are created that impact multiple parts of the economy. That is,
a tech cluster must have a frontier edge to it, and it must extend beyond refinements to a single
industry.
These criteria suggest that tech clusters are not a new phenomenon nor a permanent fixture. US
economic history shows a continual movement of leading tech centers: for example, Lowell,
Massachusetts, for textile mills reliant on water power in the 1800s; Cleveland, Ohio, for
electricity and then steel in the early 1900s; and Detroit, Michigan, for automobiles in the early-
mid 1900s (Lee and Nicholas 2012; Lamoreaux et al. 2004). Our definition puts early 19th
century technology advances for engines in Detroit on par with the cluster of artificial
intelligence firms in the Toronto area today, which seems conceptually useful.
An historical perspective also suggests that tech clusters may cease to be. For example, Detroit
was the Silicon Valley of the first half of the 20th century. At some point, the auto industry
matured and Detroit with it, and we would have taken away Detroit’s tech cluster badge. Should
Detroit’s mojo return with electric or autonomous vehicles, perhaps in 2030 we will declare
Detroit a tech cluster again. Over its relatively short history, Silicon Valley has also experienced
doldrums after technology waves crested before the next major path emerged.
Our definition also suggests drawing a line between specific industries which make heavy use of
technology (which include traditional industrial districts), and a true tech cluster with a broader
impact across the economy. For example, should Wall Street and the surrounding area of lower
Manhattan be considered a tech cluster? After all, Goldman Sachs in 2020 employs more
engineers than the total combined workforces of LinkedIn and Twitter. The iconic bank has even
been recently shedding traditional practices like dress codes to attract technical workers. Frontier
quantitative hedge funds are at the bleeding edge of artificial intelligence, and fintech advances
may reshape commerce. So maybe the Wall Street of the 1980s was not a tech cluster, but the
Wall Street of 2030 might be. Using the framework of Duranton and Puga (2005), perhaps Wall
Street is evolving from being a cluster specialized in a sector—financial services—into a cluster
specializing in a function—(fin)tech?
These definitional challenges reflect how advanced technology and its leading firms are entering
many parts of the economy in a variety of ways. Technology is becoming less of a segmented
industry—for example, less focused on manufacturers of personal computers or shrink-wrapped
software—and more ubiquitous and general purpose. There also exists a blurring of industry
boundaries, especially as incumbent firms seek to move out of stagnating industries and towards
new profitable opportunities. As robotics and cognitive automation advance, this ambiguity will
4
grow. Technology is becoming so pervasive that one can be tempted to resort to phrasings like
“talent clusters” to focus on frontier activity by sector in human-capital focused industries (for
example, Kerr 2019).
Data to Measure US Tech Clusters
Empirically studying tech clusters requires making choices about what to measure and the
appropriate scale of activity. Most analyses use patents, high-growth entrepreneurship supported
by venture capital firms, and/or employment in R&D-intensive industries or occupations. In
choosing a geographic unit, most empirical analyses of the US economy analyze the full
distribution of states or cities, which is helpful for getting a workable sample size (for example,
Acs et al., 2002; Delgado et al. 2010; Glaeser et al. 2015). An alternative method is to conduct
case studies or sub-city empirical analyses of a recognized tech cluster like Silicon Valley (for
example, Saxenian 1994, Kenny 2000, Bresnahan and Gambardella 2001). These choices should
follow the type of economic linkage under study: for example, focusing on very short-distance
knowledge spillovers in the area around Kendall Square near MIT vs. the labor mobility of
engineers across the entire Boston metropolitan area.
Patents and venture capital data are popular with researchers due to the existence of detailed
micro-data regarding individual inventions and funding transactions. Thus, in addition to
measuring spatial concentration, researchers can use the same data to learn how the clusters
operate by, for example, following the careers of inventors or entrepreneurs over time, modeling
local networks and spillovers, etc. These data also offer a foothold for assessing whether the
innovative work of the city touches multiple aspects of the economy. The central liability with
both approaches is that many forms of innovative activity are not captured; moreover, the
intellectual property and financing environment changes over time (e.g., greater recognition of
software or business method patents). Researchers must carefully consider limits to
comparability across industries (and therefore across cities, too) and longitudinally (see literature
in Feldman and Kogler 2010 and Carlino and Kerr 2015).
With some exceptions, such as Carrincazeaux et al. (2001) and Carlino et al. (2012), location-
specific R&D data are difficult to acquire. Industry- and occupation-level employment data offer
another tactic. As an example, we use below micro-data from the 2014-2018 American
Community Survey that records for individuals their metropolitan area, industry of employment,
salary, education level, and so forth. We map R&D intensity by industry, as documented by the
National Science Foundation (2017), to measure how much of a city’s employment base is in
R&D-intensive fields. This approach avoids some of the liabilities noted for patenting and
venture data but also sacrifices many of the advantages that micro-data provided.
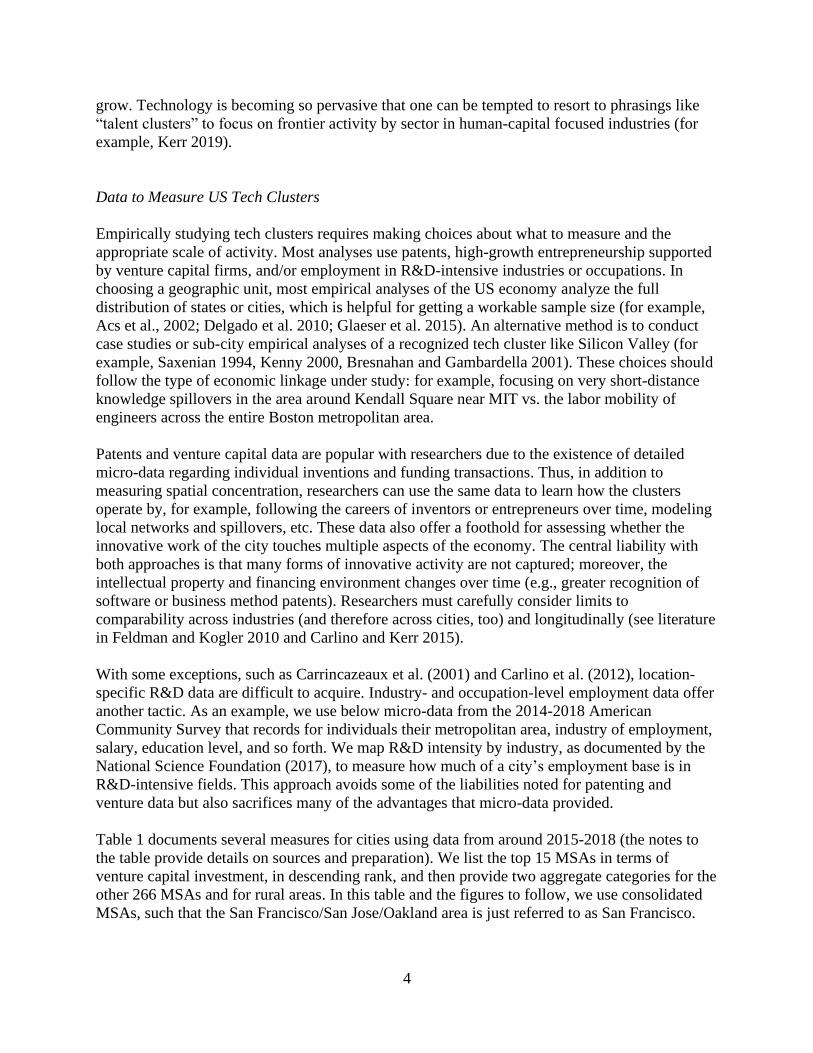
Table 1 documents several measures for cities using data from around 2015-2018 (the notes to
the table provide details on sources and preparation). We list the top 15 MSAs in terms of
venture capital investment, in descending rank, and then provide two aggregate categories for the
other 266 MSAs and for rural areas. In this table and the figures to follow, we use consolidated
MSAs, such that the San Francisco/San Jose/Oakland area is just referred to as San Francisco.

5
Table 1: Spatial concentration of US tech activity
Notes: Table lists the top 15 (consolidated) MSAs in terms of venture capital investment in descending rank.
Venture capital investments are for 2015-2018 based upon location of new investments in ventures and are taken
from Thomson One. Patents are for 2015-2018 based upon the most frequent location of inventors and application
date of utility patents and are taken from patents granted by the USPTO through end of 2019. Employment columns
are for 2014-2018 using the combined American Community Survey 1% files. ACS sample includes those aged 18-
65 who are working and with positive wage earnings, not in group quarters, with usual hours worked greater than 30
per week, and with usual weeks worked per year greater than 40. High-skilled workers are those with college-
degrees or higher in education and earning $50,000 or more. The 10 industries with the highest R&D per worker as
listed by NSF (2017) are Software publishers; Pharmaceuticals and medicines; Other computer and electronic
products; Data processing, hosting, and related services; Communications equipment; Semiconductor and other
electronic components; Navigational, measuring, electromedical, and control instruments; Pesticide, fertilizer, and
other agricultural chemicals; Aerospace products and parts; Scientific research and development services. These
industries in some cases map into more than one NAICS industry in the ACS for employment data. Population data
are 2015-2018 based upon counties that comprise MSAs and are taken from the Census Bureau. There are 281
MSAs identified in the venture capital, patent, and population data and 261 identified in the ACS data. Population
distributions in the ACS are very similar, with the one noticeable difference of LA being a 4.2% share.
This table speaks best to the scale of tech activity across cities and, through a comparison to the
population share in Column 7, the implied density of tech efforts. The top 15 MSAs as ranked by
venture capital investment hold 94 percent of venture capital activity in Column 1 and 57 percent
of patenting in Column 2, compared to just 31 percent of population. If we instead rank on
patents, Detroit, Portland, Dallas-Ft. Worth, and Houston feature in the 15 largest centers, with
Washington, Miami, Atlanta, and Raleigh-Durham dropping out. Either way, patenting and
Consolidated metro area
Venture
capital
investment
Granted
patents
Employment
in top 10 R&D
industries,
high-skilled
Employment
in top 20 R&D
industries, all
workers
Employment
in computer-
and digital-
connected
occupations,
high-skilled
Employment
in STEM-
connected
occupations,
all workers Population
(1) (2) (3) (4) (5) (6) (7)
San Francisco 48.1% 18.4% 11.7% 4.9% 8.6% 5.5% 2.5%
New York 15.3% 6.0% 6.3% 5.1% 8.0% 6.0% 6.4%
Boston 10.5% 4.5% 5.5% 2.4% 3.4% 2.7% 1.6%
Los Angeles 6.5% 5.3% 5.6% 5.7% 3.9% 3.9% 5.8%
Seattle 2.1% 4.0% 4.2% 2.4% 3.5% 2.5% 1.2%
San Diego 1.9% 3.6% 3.2% 1.6% 1.5% 1.5% 1.0%
Chicago 1.7% 2.5% 3.2% 3.2% 3.9% 3.2% 2.9%
Washington DC 1.5% 1.7% 4.4% 1.8% 6.6% 4.6% 1.8%
Miami 1.5% 0.7% 0.9% 1.1% 1.0% 1.2% 1.4%
Denver 1.1% 1.5% 1.5% 0.9% 1.7% 1.5% 1.0%
Austin 1.0% 2.1% 1.8% 1.0% 1.5% 1.2% 0.6%
Philadelphia 0.8% 1.8% 3.3% 2.1% 2.4% 2.2% 2.0%
Atlanta 0.7% 1.5% 1.4% 1.6% 2.8% 2.3% 1.7%
Minneapolis-St. Paul 0.7% 2.0% 1.3% 1.7% 2.0% 1.9% 1.0%
Raleigh-Durham 0.5% 1.4% 1.7% 0.8% 1.2% 1.0% 0.5%
Share in top 15 VC MSAs 93.8% 57.0% 55.9% 36.0% 52.1% 41.2% 31.3%
Share in other MSAs 5.9% 37.3% 38.3% 49.3% 41.8% 47.9% 48.0%
Share in non-metro areas 0.3% 5.7% 5.9% 14.8% 6.1% 10.9% 20.7%
Correlation to VC share 0.98 0.91 0.63 0.73 0.66 0.31
Correlation to patent share 0.98 0.93 0.67 0.71 0.65 0.32

6
especially venture capital investment are under-represented outside of leading tech centers.
Looking across MSAs listed in Table 1, shares for venture capital and patent have a 0.98
correlation, while shares for venture capital and population have a 0.31 correlation.
Columns 3 and 4 of Table 1 next provide two measures of local employment in leading
industries for R&D investment as measured by National Science Foundation (2017). We first
show a restrictive definition, where we identify college-educated workers earning more than
$50,000 (short-hand labelled as “high-skilled”) and working in a top 10 R&D-intensive sector—
11.7% of such individuals work in the San Francisco area, compared to 5.9% of them being
outside metropolitan areas. The second measure broadens to any full-time employee (no
education or salary restriction) among the 20 most R&D-intensive sectors. This makes a
noticeable difference, with San Francisco’s share now 4.9% and much smaller than the 14.8% in
non-metro locations. Column 5 similarly looks at high-skilled workers in occupations in
computer- and digital-connected work, and Column 6 expands to all full-time workers in a
broader class of STEM-connected occupations.
This table shows the potential and challenges of defining tech clusters using the scale and density
of local tech activity. Six cities appear to qualify under any aggregation scheme: San Francisco,
Boston, Seattle, San Diego, Denver, and Austin all rank among top 15 locations for venture
capital and for patents (scale) and hold shares for venture capital, patents, employment in R&D-
intensive sectors, and employment in digital-connected occupations that exceed their population
shares (density). They also pass the highly rigorous “sniff test” that they make sense!
Washington, Minneapolis-St. Paul, and Raleigh-Durham would join the list if relaxing the
expectation that that share of venture investment exceed population share (which is hard due to
the very high concentration in San Francisco).
New York and Los Angeles are more ambiguous: they hold large venture capital markets (and
venture investors frequently declare them leading tech clusters), but their patents and
employment shares in key industries and fields are somewhat less than their population shares.
Were we to disaggregate these huge metro areas, we would likely identify a sub-region that
would independently make this short list by still holding sufficient scale and yet having more
achieved a more recognizable density. Said differently, there is surely a part of New York and
LA that would be stand-alone equal to or greater than Austin (e.g., Egan et al. 2017). Chicago’s
activity is mostly equal to its population share or less.
At the other end of the city size distribution, it is hard to be a robust-yet-small tech cluster on
both venture investment and patent metrics due to the concentration of innovation. If one only
requires that a tech cluster achieve a venture capital and patent share that is 1.5x the local
population share, the one new city would be Provo, UT, with Denver dropping out. In summary,
San Francisco and Boston are extreme cases, and we are probably looking at 5-10 additional
leading centers across the country depending upon definition of scale and density.
At the start of this section, we conceptualized tech clusters as being positioned in frontier sectors
and having a broad-based impact. Patents provide a preliminary example of these traits. We first
consider new technology areas by isolating patent technology classes that the USPTO introduced
in 1995 and afterwards. On average, cities have 7.8 percent of their patents during 2015-2018 in

7
the newest classes, while the average for San Francisco, Boston, Seattle, San Diego, Denver, and
Austin is 27.8 percent. When looking at patent classes introduced after 1980, these shares are
29.8 percent and 60.2 percent, respectively. Patents in these six cities also display higher forward
and backward citations, with a greater measure of generality to the work (Hall et al. 2001). We
return below to recent research describing differences in the type of innovation across clusters.
How is this picture changing over time? For the most part, the rich are getting richer. Figure 1
shows city patenting (presented in annual terms) from 1975-1980 to 2013-2018. The axes are in
log format and a 45-degree line is included. There has been an overall increase in patent grants
since the late 1970s, visible in the figure with more cities being above the 45-degree line than
below. Cities that are farthest above the 45-degree line have the biggest percentage gains, and
big patenting centers in the late 1970s show the most consistent increases. Consequentially, an
Ellison and Glaeser (1997) index of patenting concentration relative to population distribution
grows over ten-fold from an index value of 0.002 in the late 1970s to 0.028 in 2018.
Figure 1: Growth in Annual Patenting by Metropolitan Statistical Area
Notes: Figure presents for metropolitan areas the average annual patent count for 1975-1980 and 2013-2018. Patents
are grouped by application year and all patents granted by the USPTO through end of 2019 are used. Axes are in log
format and a 45-degree line is included. Some cities are labelled for illustrative purposes only.
Researchers have recently developed new empirical methods to measure tech clusters, as well.
One approach focuses on measuring high-growth entrepreneurship independent of venture
capital data. Guzman and Stern (2019) use state-level business registration data and develop
techniques to identify whether new firms are targeting rapid growth, such as how the venture is
named (e.g., Infinity Global Technologies vs. Fred’s Bicycle Repair) and its legal form of
incorporation. The most intense areas for entrepreneurial potential are places like Silicon Valley,
Boston, and Austin, where they also measure booms in local high-growth activity through 2019.

8
In another approach, using LinkedIn data on employment, Gagne (2019) estimates that more
than a third of artificial intelligence researchers are located in the San Francisco Bay Area—a
fact due in part to the presence of tech giants like Microsoft, IBM, and Google in that area.
Global Tech Clusters
An emerging frontier is to map out global tech clusters. This combination of data across borders
gets complicated fast, and Table 2 shows metrics do not always point in the same way. For
venture capital investment, the last decade shows the remarkable rise of Chinese tech clusters.
The top 10 global cities include Beijing, Shanghai and Shenzhen, plus London, in addition to six
cities from the United States. Looking instead at the post 2009 formation of unicorn start-ups
(valued at $1 billion or more), the four non-US cities are similarly Beijing, Shanghai, and
Hangzhou, plus London (Kerr 2018).
Table 2: Global Tech Clusters as Measured by Total Size
Venture Capital Investment
(Thomson One, 2009-2018)
Unicorn Startup Companies
(CB Insights, 2009-2018)
Patent Cooperation Treaty Filings
(WIPO, 2010-2015)
San Francisco San Francisco Tokyo-Yokohama
Beijing Beijing Shenzhen-Hong Kong
Shanghai New York San Francisco
New York Los Angeles Seoul
Boston Shanghai Osaka-Kobe-Kyoto
Los Angeles Boston San Diego
London London Beijing
Shenzhen Seattle Boston
San Diego Hangzhou Nagoya
Seattle Chicago Paris
Notes: Table lists the 10 largest global tech clusters in terms of various metrics in descending rank. Venture capital
investments are for 2009-2018 based upon location of new investments in ventures and are taken from Thomson
One. Unicorn startup companies are counts of new ventures exceeding a billion dollars in valuation during 2009-
2018 and are taken from CB Insights. Patent Cooperation Treaty filings are for 2010-2015 and are taken from the
World Intellectual Property Organization. Geographic boundaries of clusters are defined by each data source and
differ to some extent across columns.
While measures of tech clusters using venture capital and patents provide mostly similar pictures
across US cities, globally this is not the case. In a World Intellectual Property Organization
report (Bergquist et al. 2017) that aggregates over many patent offices, Tokyo-Yokohama holds
twice the patent count to second place, Shenzhen-Hong Kong; the San Francisco Bay Area is
third and Seoul is fourth. Moreover, the top 10 cities span three in Japan, three in America, two
in China, and one each in Korea and France. For more specific frontiers like research in artificial
intelligence, the leading roles of America and China are clear, but relative shares depend
substantially on the yardstick employed and data source.
Building a stronger foundation for these comparisons is an important ongoing task. So far, we
are only tackling the scale of local tech activity, but not the extra nuances about density, frontier
status, and so forth. International settings also raise the interesting question of whether measures
9
of a tech center should be context specific. Many speak of Bangalore as a “tech cluster,” but
while it is technologically advanced when compared to other locations in India, much of its
activity is substantially lower tech and labor intensive relative to tech clusters in advanced
economies.
Is a Tech Cluster Different from Other Clusters?
Industry clusters arise due to the production advantages of local specialization combined with
subsequent trade across locations. Marshall (1890) famously described three forces of what we
now call agglomeration economies: knowledge spillovers, labor market pooling, and customer-
supplier interactions. Economic research over the last two decades has shown all three forces,
along with natural advantages of areas for certain industries (e.g., harbors, coal mines), are
important for explaining industrial clusters, with the most recent research quantifying the
heterogeneity across industries and co-agglomeration dynamics over time (for example, Ellison
et al. 2010; Faggio et al. 2017). While most studies of the Marshallian forces have focused on
industrial settings, they also apply to tech clusters, if often in distinctive ways.1
Knowledge Spillovers and Forms of Innovation
Our definition of tech clusters emphasized settings with a frontier edge, and many companies
seek insights on emerging possibilities, either through first access to codified knowledge or to
tacit knowledge that cannot be so easily written down. Marshall famously described knowledge
diffusion inside an industrial cluster in poetic terms: “The mysteries of the trade become no
mysteries; but are as it were in the air, and children learn many of them unconsciously.”
Researchers have since catalogued these knowledge transfers in many settings, such as
Switzerland’s watchmaking industry, and they appear particularly important for tech clusters
(Audretsch and Feldman, 1996). Olson and Olson (2003) document very tight bands for
collaborative interactions. In an ethnographic study of Silicon Valley, Saxenian (1994, p. 33)
describes many formal and informal channels facilitating knowledge transfer, including a
depiction of Wagon Wheel, a Mountain View bar that novelist Tom Wolfe dubbed the
“fountainhead of the semiconductor industry”:
[M]embers of an ‘esoteric fraternity’—the young men and women of the semiconductor
industry—would head after work to have a drink and gossip and brag and trade war
stories about phase jitters, phantom circuits, bubble memories, pulse trains, bounceless
contracts, burst modes, leapfrog tests, p‐n junctions, sleeping sickness modes, slow‐death
episodes, RAMs, NAKs, MOSes, PCMs, PROMs, PROM blowers, PROM blasters, and
teramagnitudes, meaning multiples of a million millions.
More recently, then-CEO Jeff Immelt described in 2016 why General Electric was moving its
headquarters from Fairfield, Connecticut, to Boston: “To look out the window [in Connecticut]
1 Duranton and Puga (2004) recast Marshall’s forces to emphasize higher-order functions like sharing and matching
that occur within clusters. See Markusen (1996) and Porter (1998) for complementary approaches.

10
and see deer running across, I don't care about that. I want some 29-year-old [graduate of] MIT
to punch me right in the nose and say all of GE's technologies are wrong and you're about to
lose. That's the challenge.” (as reported in Singer 2016; Kerr 2018 discusses the subsequent ups
and downs of General Electric’s move).
More formally, economists since Jaffe et al. (1993) have most frequently used patent citations to
quantify the higher rate of knowledge flow within cities versus across them (for example, see
Murata et al. 2014, and the references cited therein). The use of patent citations is only an
imperfect proxy for knoweldge flows (e.g., Jaffe et al. 2000), and many of the captured
information flows are due to inventor networks, licensing agreements, and so forth (e.g.,
Almeida and Kogut 1999; Breschi and Lissoni 2009). These citation metrics thus aggregate
unpriced knowledge spillovers that are “in the air” alongside regular forms of economic activity.
Citation patterns have been confirmed with co-authorship networks among inventors, and
Fleming and Marx (2006) identify that leading tech clusters became more connected during the
1990s.
Recent applications focus on using patent data to open the black box of how clusters operate.
Kerr and Kominers (2015) model localized spillovers within tech clusters. Firms interact with
their closest neighbors, but the costs of interaction prevent direct spillover benefits from more
distant members of the cluster. For example, a firm in Oakland may have useful information for
a startup in East Palo Alto, but the search and acquisition costs for that information prevent it
from diffusing directly, requiring instead indirect transfer via other firms. These conditions lead
to overlapping zones of interaction, such that nearby interactions are direct, while those farther
away happen through the underlying network of the cluster. (Arzaghi and Henderson (2008)
document a similar phenomenon in a study of advertising agencies in Manhattan.)
In their empirical work using patent citations, Kerr and Kominers (2015) show that firms are
more likely to directly cite the work of their closest neighbors but indirectly cite those farther
away in the cluster. Consequently, econometricians can compare the shapes and sizes of clusters
to learn about the technologies that sit behind them. Technologies with tight spillover lengths
produce smaller and denser clusters. In this study, as well as other research using broader sources
of variation (for example, Rosenthal and Strange 2001, 2003), knowledge spillovers are the most
localized of agglomeration forces.2
Another promising line of work quantifies how the level and type of inventions varies within a
broader metro area. For example, Carlino et al. (2007) and Berkes and Gaetani (2019) measure
that patenting per capita across US cities mostly rises with higher density, with a 10 percent
increase in density correlating with a 2 percent increase in intensity. At a more fine-grained
level, however, patenting per capita peaks in areas with high but not too high density—for
example, being higher in Silicon Valley or the Route 128 area surrounding Boston compared to
downtown San Francisco and Boston, respectively.
2 Even controlling for distance, political boundaries still matter for knowledge flows (Singh and Marx 2013).
Similarly, local economic conditions (low commuting costs, skilled labor abundance) and technology features
(localized knowledge spillovers, high startup costs) shape the decentralized emergence of science parks (Liang et al.
2019). By contrast, some studies do not find co-location to be essential (e.g., Waldinger 2012).

11
Berkes and Gaetani (2019) further show that the very densest districts instead foster atypical
combinations of technologies that combine core elements seen in prior work with distinctly
novel elements (Uzzi et al. 2013). These innovation advantages for developing the most novel
forms of new work are often credited to a diverse range of local inputs (for example, Jacobs
1969; Glaeser et al. 1992; Henderson et al. 1995; Lin 2011). In contrast, “company towns” where
a single large firm dominates the local tech activity, like Eastman Kodak in Rochester, New
York, during the 20th century, are more likely to have internally focused innovation (Agrawal et
al. 2010).
Continued investigation into how the technologies developed in frontier clusters differ from
other settings is important. It would be also interesting to identify cases and situations in which
tech clusters can become too isolated from a potential customer group to understand latent needs.
Michael Bloomberg is a very rich tech entrepreneur because he knew what kinds of desktop
terminals his former colleagues on Wall Street were missing, which someone in California may
have had a hard time figuring out.
Specialized Labor and High Velocity Labor Markets
A distinctive feature of tech clusters is the specialized skillsets of many local workers, which
becomes a powerful magnet to the area. As noted in Section 1, leading tech clusters hold a large
share of the nation’s college-educated workforce engaged in computer and digitally connected
fields, and the concentrations become even more skewed when looking at extreme skills like
specialization in artificial intelligence (e.g., Gagne 2019). Clusters provide several advantages
for workers with specialized skills: insurance against the shocks befalling any one employer,
deeper labor markets for better matching of particular skillsets with the best jobs, and often
superior environments for investments in training by talented individuals without fear of later
employer hold-up (for an entry point to this literature, see Overman and Puga 2010, and the
citations therein). Studies examining labor pooling in the tech arena often emphasize its role for
employee-firm matching and input sharing (e.g., Helsley and Strange, 1990, 2002).
Beyond these bread-and-butter features, the literature on tech clusters most emphasizes the high
velocity turnover of its labor markets. Saxenian provides an early depiction of this rapid
mobility, quoting an engineer on the ease of transitioning employers in Silicon Valley: “Out
here, it wasn’t that big of a catastrophe to quit your job on Friday and have another job on
Monday and this was true for company executives. You didn’t necessarily even have to tell your
wife. You just drove off in a different direction on Monday morning. You didn’t have to sell
your house, and your kids didn’t have to change schools.” Another local executive notes:
“People change jobs out here without changing car pools” (Saxenian, 1994, p. 35).
High profile executive moves are common within tech clusters, such as Sheryl Sandberg’s move
from Google to become Chief Operating Officer of Facebook in 2008 and Marissa Mayer’s
similar departure to become CEO of Yahoo! in 2012. These moves often spark legal challenges.
In 2017, Alphabet’s Waymo sued Uber, alleging that one of Waymo’s former engineers,
Anthony Levandowski, took confidential files with trade secrets related to self-driving cars with
him when leaving to form his own self-driving startup, Otto, that Uber later acquired. The suit
12
was settled in 2018 with Uber paying 0.34% of its equity (then valued at $245 million) to
Waymo. (https://www.wired.com/story/uber-waymo-lawsuit-settlement/)
While frequently discussed, this labor velocity has been less studied empirically compared to the
localization of knowledge flows. Fallick et al. (2006) is an important exception that further links
the flexible labor markets of tech clusters to an industrial organization that emphasizes modular
production.3 They model how modularity allows for winner-take-all competition, with labor
rapidly reallocating to the firm with the best design in order to scale it up for production. This
benefit helps the cluster to overcome potential underinvestment in worker training due to rapid
turnover in high-velocity labor markets. Related, Gerlach et al. (2009) connect labor pooling to
greater risk taking with R&D activities inside tech clusters, and Fairlee and Chatterji (2013)
document how rapid scaling of winning firms can ironically reduce start-up rates inside tech
clusters during exceptional growth periods like the late 1990s.
This rapid labor mobility hints at the dual-edge nature of tech clusters: while they provide strong
advantages, they impose real costs on firms, too. Despite the relative abundance of sought-after
skills within tech clusters, these labor markets were exceptionally tight in the late 2010s and
exhibited very low unemployment rates. Thus, many businesses located in these talent clusters
struggled to get the workers they wanted especially if they lacked a brand name like Apple or
Netflix that attracts employees.
Firms also need to be aware that company doors operate in both directions. While bosses get
excited about the top-notch employees and knowledge stocks at neighboring companies that they
might be able to lure away, they also become more likely to have their employees depart to rival
organizations. Combes and Duranton (2006) model this tension, showing that single-minded
pursuit of a position in the cluster is not always the best strategy. Building on Rotemberg and
Saloner (2000), Matouschek and Robert-Nicoud (2005) and Almazan et al. (2007) highlight the
role of firm-sponsored investments and firm-specific skills in investigating why employers
should think twice before jumping into the hot spot of their sector. Alcacer and Chung (2007,
2014) and Groysberg (2010) consider these themes in the management literature.
These tensions stress how clusters are an outcome of an equilibrium process. Thus, places with
great spillover benefits usually bring very high prices for real estate and talent. This market
pricing is true across cities and across small zones inside prominent clusters. Not only is Boston
more expensive as whole than Providence, the real estate around Kendall Square and MIT is the
priciest. Indeed, abstracting from moving costs, escalating real estate prices can enhance the
fidelity of the cluster, as only those who most benefit from the location are willing to pay
astronomical rates (e.g., Malmberg and Power 2006, Bathelt and Li 2014). Few studies have
explicitly modelled these tradeoffs and tensions, and yet they are critical for our understanding.
3 Modularity is the method of making complex products or creating processes from smaller subsystems developed
by a network of independent firms. Although different suppliers are responsible for separate modules, they follow
“design rules” that ensure the modules work together (Baldwin and Clark 1997). This approach decentralizes
innovation and may accelerate technical progress, since independent firms can focus on innovation to their specific
components compared with the divided attention of vertically integrated firms. Saxenian (1991), Sturgeon (2002),
and Berger (2005) provide case examples.

13
These labor tensions extend into employment law. Non-compete clauses in employment
contracts limit the ability of a person to leave their employer and immediately compete in the
same segment. Gilson (1999) proposed that Silicon Valley’s dynamism should be attributed to
the inability of local firms to enforce non-compete clauses. While non-compete clauses may
encourage employers to invest more in training workers, as they are less likely to be poached by
rivals, the labor rigidities can also stifle the flow of ideas and the optimal matching of workers
and firms. Subsequent empirical analyses by Marx et al. (2009, 2015), and Hausman (2019) have
shown to the latter to be particularly troublesome for inventors and technical diffusion.4
Immigration, Diversity, and Tech Talent
Immigration and talent diversity, two factors not discussed by Marshall (1890), are also critical
for the understanding of US tech clusters. Classic early accounts of tech clusters by Saxenian
(1994, 2002) and Florida (2005) emphasize how openness and tolerance in the community
undergird the innovative productivity of the cluster. These authors, along with Falck et al.
(2009), further consider how urban amenities and high quality of like are necessary to attract the
highly skilled people central for tech clusters.
US tech clusters are high-skilled immigration hubs, in most cases building strong past waves of
immigration to large coastal cities. More than 60 percent of Silicon Valley’s entrepreneurs are
immigrants to America (Kerr and Kerr 2020), and the chief executive officers of Alphabet,
Microsoft, SpaceX/Tesla, and Uber are all foreign-born. Much of the large innovative workforce
of tech clusters comes from abroad. Immigrants accounted for an astounding two-thirds of San
Jose’s college-educated workforce in the American Community Survey for information and
communications technologies. While San Jose is an outlier, immigrants as a share of the college-
educated workforce in these fields still exceed 40 percent in many tech clusters.
Kerr (2019) describes factors behind this reliance: talent for science, technology, engineering,
and mathematics is quite transportable across countries, and the ranks of foreign talent looking
for education and subsequent work opportunities in America in tech fields has been growing,
especially from China and India. Part of America’s immigration system is employer-driven (as a
prominent example, the H-1B temporary visa program for those in “specialty occupations”),
which also offers technology firms a substantial lever for using foreign talent. Not surprisingly, a
literature has quantified how growth in US immigration can benefit tech clusters and their major
employer firms (for example, see Kerr and Lincoln 2010; Peri et al. 2015). Nathan (2014, 2015)
provides similar evidence with a European focus.
A distinguishing feature of tech clusters is their cultural celebration of innovation that has the
potential to change the world. But other common cultural forces are counterproductive. Contrary
to the growing evidence of a diversity premium for generating ideas, tech clusters have been
frequently plagued by a “bro” culture that disadvantages women and minorities. Despite high-
profile tech leaders like Mayer and Sandberg, women are under-represented and sometimes
dramatically so (e.g., only 2-3 percent of venture funding goes to women entrepreneurs). African
4 Firms can also seek extra-legal maneuvers. In the late 2000s, major tech employers entered into anti-poaching
agreements with each other, later paying large fines to settle the cases (as reported in Roberts 2015; Mehrota 2016).

14
American participation is also terribly low, with recent gains in professional occupations like
management consulting and investment banking not occurring in tech work (Gompers and Wang
2017). A separate concern is that tech companies may still operate with the “move fast and break
things” spirit, but broader public concerns regarding privacy, data security breaches, and
propagation of “fake news” via social media loom large.
Customer-Supplier Interactions, Firm Organization, and Global Networks
Returning to the last of Marshall’s forces, the benefits that firms in tech industries gain from co-
locating depend upon local production techniques and, perhaps less obviously, global integration
and production chains. Taking the local perspective first, many case examples point to the
critical nature of local supply (Saxenian 1991). An early Apple executive described the desire for
regional proximity: “Our purchasing strategy is that our vendor base is close to where we’re
doing business… We like them to be next door. If they can’t, they need to be able to project an
image like they are next door.” Even where manufacturing was to be ultimately off-shored,
contract manufacturer Flextronics emphasized local integration: “In the early stage of any
project, we live with our customers and they live with us. Excellent communication is needed
between design engineers, marketing people, and the production people, which is Flextronics.”
Agrawal and Cockburn (2003) and Feldman (2003) developed concepts of anchor firms for
clusters, which all those cities hoped to achieve by luring Amazon’s HQ2 to their area, and
Glaeser and Kerr (2009) considered optimal industrial composition. Markusen (1996) and
Agrawal et al. (2014) emphasize the importance of firm size diversity. Large local firms anchor
the cluster and produce ideas that do not fit well internally and thus get spun-out. Lots of small
firms are also vital to lower entry barriers and to stimulate specialized support services. This
local diversity was present in Detroit in the early 1900s and Silicon Valley in the 1960s (for
example, Klepper 2010), and Agrawal et al. (2014) find evidence for their model when looking
at the innovative output of US cities during the 1975-2000 period.
Hellmann and Perotti (2011) alternatively conceptualize how tech clusters facilitate the
generation, circulation, and completion of new ideas. They model an important tradeoff of
seeking to circulate and complete novel ideas within firms (where they are more protected) vs. in
local clusters (where they are more likely to find best matches). Their model predicts diverse
organizational forms—internal ventures, spin-offs, and start-ups—coexisting and mutually
reinforcing each other. An empirical analysis of these features, along with the acquisition of
ideas into firms, is very promising for future research.
While the economics literature mostly studies the local properties of tech clusters, they must also
be embedded in the larger value chain of an industry (Coe and Bunnell 2003, Humphrey and
Schmidt 2002). While Apple and Google race to design the next features of the smart phone, the
phones themselves are produced in much lower cost locations and sold in retail shops globally.
The geography literature discusses how tech clusters achieve their scale by integrating the local
“buzz” into regional, national, or global production networks (e.g., Storper and Venables 2004,
Bathelt et al. 2004, Bathelt and Li 2014). Indeed, in addition to allowing rapid local scaling,
15
modular production design makes it easier for supply chains to extend across multiple locations
and over borders.
The linkages between global tech centers are also important and growing. In addition to
constituting a large share of the local innovative workforce, high-skilled migrants facilitate many
exchanges between tech centers (Saxenian et al. 2002; Saxenian 2006), and a substantial share of
patent inventor teams are now cross-border (Miguelez 2014; Branstetter et al. 2015; Kerr and
Kerr 2018). Venture capital firms are especially well connected internationally (Balachandran
and Hernandez 2019), and leading corporations maintain a string of labs and move workers
between facilities (Choudhury 2016, 2017). Nanda and Khanna (2012) also emphasize the degree
to which time abroad can aid entrepreneurs when they return to less well-connected parts of their
home country.
Preconditions and Dynamics of Tech Clusters
An emerging frontier of research focuses on whether tech clusters can be created, and the
necessary preconditions in doing so, with a persistent meta-finding that it is very difficult to
predict where leading clusters will take root. Krugman (1991) emphasizes the role of historical
accidents in explaining where clusters form, and local efforts to “become the next Silicon
Valley” have a poor track record (see discussions and references in Lerner 2009, Duranton 2011,
and Chatterji et al. 2014). Though history provides multiple examples of the development of a
new tech cluster, predicting or purposefully creating the location of the next cluster might be
impossible.
For example, in a portrait of the origins of Silicon Valley, Lee and Nicholas (2012) note that San
Mateo County was a technological backwater for several decades from the 1890s. It was not until
the 1930s that the area began to be noticed for its work on transistors, vacuum tubes and
microwaves, which helped draw in larger firms and enabled startups. The government’s huge
demand for electronics in World War II brought critical mass to the region, as the local
population of tech engineers surged ten-fold in a few years. When Silicon Valley went through
its inflection point, many other cities would have looked much better prepared in terms of
industry composition and talent base to be the next leading center. Indeed, accounts of the
formation of Silicon Valley like Saxenian (1994) emphasize how the region’s “blank slate”
allowed for new forms of work to emerge, versus some pre-existing factor that destined the
region for success. Being a “blank slate” may have worked for Silicon Valley, but it is not a
strategy that consistently guarantees success!
In most accounts of the origin of tech clusters, such as Klepper’s (2010, 2016) comparisons of
Detroit and Silicon Valley, emphasis is given to the initial placement of a few important firms
and the spinoff companies they subsequently generate. This outsized influence for anchor firms
generates ample room for random influences on the early location decisions vital to a future
cluster. For example, William Shockley, who shared a Nobel Prize in Physics for his work on
semiconductors and transistors, moved to the San Francisco area to be near his ailing mother; the
spinoffs from his firm Shockley Semiconductors included Intel and AMD.

16
Moretti (2012) also describes how personal factors led Bill Gates and Paul Allen to move
Microsoft from Albuquerque to Seattle, their hometown. At the time, Albuquerque was
considered the better place to live, favored by most of Microsoft’s early employees, and the
location of many early clients. Yet, proximity to family won out, and this decision has
reverberated well beyond Microsoft’s direct employment. The agglomeration advantages sparked
by Microsoft have attracted countless other tech firms to Seattle, including Jeff Bezos relocating
from New York City to Seattle when he founded Amazon. Had Gates and Allen not moved
home, Albuquerque might be home to two of America’s three most valued companies in 2020.
A similar and related randomness arises due to the often-serendipitous nature of breakthrough
discoveries and their outsized subsequent importance. Zucker et al. (1998) show that the location
of biotech industry follows the positioning of the star scientists in the nascent field, and the
surging prominence of Toronto for artificial intelligence traces to the choice of some key early
researchers to locate there, well before the field became so prominent. Duranton (2007)
formalizes how random breakthroughs could lead to shifts in the leadership of cities for a tech
field or industry, such as the migration of semiconductors from Boston to Silicon Valley, and
Kerr (2010) quantifies this pattern of reallocation across 36 patenting sectors since the 1970s.
While random sparks play a role, the same breakthroughs often occur contemporaneously in two
or more locations (Ganguli et al. 2019). Accordingly, a new line of work considers the factors
that shape which location emerges the winner. Duran and Nanda (2019), for example, study the
widespread experimentation during the late 1890s and early 1900s as local automobile
assemblers learned about the fit between this emerging industry and their city. Despite having
fewer entrants initially, activity coalesced in smaller cities – Cleveland, Indianapolis, St. Louis,
and Detroit – with Detroit being the ultimate winner by the late 1920s. The smaller city
advantage may have been due to the higher physical proximity of relevant stakeholders, allowing
for easier experimentation, prototyping, and circulation of ideas. So long as they had sufficient
local input supplies, smaller cities may have provided more attention and financial support to the
new technology compared to larger markets and fostered relational contracts.
This stream of research yields some tentative conclusions for policy makers. Lerner (2009)
documents the poor past performance of public efforts to engineer a cluster from scratch, and
Ferrary and Granovetter (2009) blame the widespread failure of policymakers to replicate the
success of Silicon Valley to their misunderstanding of complex innovation networks and to the
shallowness of venture capital markets. The unique origin of each existing tech cluster suggests
future efforts to seed from scratch are likely to be similarly frustrating.
Instead, a better return is likely to come from efforts to reduce the local costs to experimentation
with ideas (Kerr et al. 2014), alongside the provision of a good quality of life. There is likely also
a role for cities that have developed a position in an emerging sector, even if by random accident
due to family ties, to increase the odds they are favored in the shakeout process. Such support is
more likely to work if it is broad-based to a sector and avoids attempting to “pick winners” by
targeting individual companies. Other cities can take the strategy of increasing their connectivity
to leading centers via remote work. Tulsa Remote pays qualified workers with remote jobs
$10,000 to move to Tulsa, Oklahoma, and similar programs are popping up elsewhere. Rather

17
than seeking to “become the next Silicon Valley,” these effort focus on connecting into the
existing hotspots and being an attractive alternative with a lower cost of living.
Beyond anchor firms, universities also feature prominently in the history of tech clusters, both
for the United States and globally (Markusen 1996, Dittmar and Meisenzahl 2020). Under Dean
Fred Terman’s guidance, Stanford University fostered a strong relationship with the growing
tech community, such as the 1948 creation of the Stanford Industrial Park that would house
11,000 workers from leading tech firms by the 1960s. Famed venture capitalist Arthur Rock
summed up the university’s driving role around this time: “All of the energetic scientists were
forming around Stanford.” (Lee and Nicholas 2012). Similarly, the placement of a Carnegie-
funded library into a city in the decades around 1900 corresponded to a substantial growth in
patenting relative to peer cities for the next 20 years (Berkes and Nencka 2019).
Hausman (2012) documents how university innovation fosters local industry growth, and these
spillovers can attenuate rapidly (see also Andersson et al. 2009; Kantor and Whalley 2014). With
the increase in university patenting following the 1980 Bayh-Dole Act that provided universities
greater ownership of intellectual property resulting from government-funded research, these
intellectual sparks are growing in number. Universities are also a vibrant source of young, smart
workers with frontier skillsets. Marshall (1890) emphasized the benefits of natural advantages
like deep harbors and coal mines; strong research universities, along with government-sponsored
laboratories, are likely to be key (man-made) natural advantages for new tech clusters. While
Silicon Valley was a blank slate, it did possess from the start a powerful asset with Stanford.
These historical examples are starting to provide insight that will advance our theory on tech
clusters. Duranton and Puga (2001) model a system of cities in which new industries emerging in
large and diverse “nursery” cities. As industries mature and move from experimentation to scale,
they no longer value the cross-fertilization enabled by industrial diversity and seek instead to
maximize within-sector productivity. The model portrays mature industries as then relocating to
less expensive and more specialized cities.
The nursery city model provides a powerful tool for thinking about systems of cities (Henderson
1974). It also fits many industrial experiences, such as the exodus of large-scale apparel
manufacturing out of Manhattan over the last century (leaving the Garment District’s name and
some key fashion designers behind). The nearby “Silicon Alley” in Manhattan’s Flatiron district
also previously held names “Toy District” and “Photo District” reflecting the local cluster of
previous eras. Yet, autos went from cradle to old age in Detroit, and other places like Lowell and
Cleveland failed to renew themselves the way New York did. Boston has reinvented itself three
times since its colonial days (Glaeser 2005).
What explains these differing fates? One promising hypothesis starts by thinking about the
specialization of cities on function vs. industry lines (Duranton and Puga 2005). Many models
keep industry size much smaller than city size, so that reallocation is more likely to happen at the
industry level (Duranton and Puga 2001; Duranton 2007). The competitive framework by Porter
(1998) emphasizes these radical upheavals that happen at the industry level. By contrast, the
historical examples also suggest a fast-growing industry may come to dominate a nursery city so
quickly that the city ceases to specialize on a function (like the breeding of new ideas) and

18
instead specializes on an industry (like autos), thereby pushing out the local industry diversity to
other locations.5 The sociology and geography literatures also emphasize local threats to the
growth of clusters, such as emerging endogenous barriers to entry (e.g., Granovetter 1973).
A richer depiction of these interacting forces connects to many interesting literature strands.
Helsley and Strange (2014) model that cities hold a (non-optimal) mix of co-agglomerated
industries due to legacy location choices and persistence. Perhaps the larger city size of a London
or Tokyo protects it from becoming too hyper-specialized around any one fast-growing industry.
Other work focuses on superstar cities and power couples seeking dual careers (for example,
Gyourko et al. 2013, Costa and Kahn 2000). Maybe New York’s greatest lever for long-term
economic sustainability is that a high-income couple can be a daring fintech entrepreneur and
conservative healthcare CEO, so long as they can also afford to pay $40,000 for their kid’s pre-
school.
Future Directions for Research
There are many open questions regarding tech clusters, and we conclude with some promising
areas of inquiry. Just as tech clusters lead to spillovers across technological and industrial
boundaries in the real economy, we expect that research on tech clusters will also spill over into
and across other fields of economic inquiry.
New employer-employee datasets will allow researchers to quantify the creation and scaling of
enterprises inside tech clusters. This step can build upon administrative data, such as the Census
Bureau’s Longitudinal Employer Household Survey, combined via external links to patenting
and venture capital data. Others will take advantage of private datasets like LinkedIn, which is
almost a pseudo-Census of the tech industry. For example, these analyses will help differentiate
among the many theoretical channels for labor market pooling, ranging from greater matching to
insuring workers against the risk of job separation.
Fine-tuned establishment data also facilitate new inquiries. Relatively few studies explore the
internal choices within firms for how to locate their many activities, a decision that often
involves a tradeoff between proximity to sources of external insight and internal communication
and alignment (for recent examples, see Alcacer and Delgado 2016; Lychagin et al. 2017; Kerr
2018). As technology grows in importance, companies appear to be placing more key decision-
makers and innovation personnel into tech clusters. Researchers need to develop a better
understanding of these location decisions and their global consequences. For example, Landier et
al. (2009) quantify the greater likelihood of business leaders to close plants farther away from the
corporate headquarters.
These types of data further will refine our understanding of local spillovers in tech clusters from
knowledge work to other industries. Moretti (2012) calculates that knowledge work creates five
non-technical jobs for each knowledge worker, a local multiplier that is substantially higher than
5 The spatial equilibrium model also struggles with aspects of the distribution of entrepreneurship across cities (for
example, Glaeser 2008; Glaeser et al. 2010). Recent contributions to the underpinning of a system of cities model
include Behrens et al. (2014) and Davis and Dingel (2019), which provide further references.
19
manufacturing. These generated jobs also pay better than similar work in other cities. Samila and
Sorenson (2011) quantify how venture capital similarly creates new jobs in local areas beyond
the start-ups directly supported, and that these tend to be well-paid positions, but that the
magnitude is overall modest in nature. The resulting escalation of real estate rents, however, also
crowds out lower income individuals (Gyourko et al. 2013), and a more complete portrait of the
benefits and strains for local areas from blossoming tech work is needed.
Emerging research is also exploring how tech clusters shape the careers of individuals and the
early stages of companies. Gompers et al. (2005) document how many venture capital-backed
entrepreneurs cut their teeth through prior work in startups, and Moretti (2019) estimates that
inventors moving to a larger tech cluster experience increases in their patenting outcomes. Future
work can extend this person-level perspective to see how cities shape the types of work created
by inventors. In a similar way, Guzman (2019) documents the migration of startups from their
founding city to Silicon Valley. Higher-quality firms are more likely to migrate to the Valley,
where they appear to receive better knowledge spillovers.
In closing, will the existing tech clusters strengthen going forward? A simple extrapolation of
trend lines suggests greater spatial concentration for tech clusters looms on the horizon. Indeed,
many policy proposals ranging from pushing massive basic R&D stimulus into the heartland
(Gruber and Johnson 2019) to creating regionally capped visa allocations for skilled immigrants
start with the premise that, because tech clusters are becoming more concentrated, policymakers
need to step in. Due to lower agglomeration benefits outside of tech clusters, these proposals to
push activity into other cities and regions are typically based upon achieving regional equity and
political buy-in, perhaps coming with a reduced aggregate economic output. Moretti (2019)
estimates, for example, that the special concentration of inventors into leading tech centers
boosts innovation by 11 percent, compared to a scenario where all inventors spread out evenly
over cities. Additional research to quantify the particular role of tech clusters and their
innovations (both in total number and their traits like atypical combinations) into economic
growth will be very valuable.
Yet, many factors may naturally limit further spatial inequality. Doubling Silicon Valley’s size—
which is impossible on many geographic and political levels—would still only make it 2 percent
of the US population. We are witnessing a major transformation of business to achieve
appropriate positions in powerful tech hubs, but most workers and consumers will always be far
away. Large companies will only pay the hefty prices of tech clusters for some key workers,
instead investing to ensure that the firm transmits the important information effectively to others
in the company. At the local level, political pressures to limit housing construction will make it
costly for certain tech centers to expand: for example, Hsieh and Moretti (2019) estimate that
housing constraints that limited the spatial reallocation of workers towards the most productive
cities of New York and the San Francisco Bay area lowered US growth by 36 percent since the
1960s. Political tensions and spatial disparities across US regions may also limit how big tech
clusters can become.
These factors were already in play in early 2020 when the COVID-19 crisis added yet more
complexity to the future of tech clusters. On one hand, the acceleration in technology adoption
brought about by the pandemic (for example, to shift activity towards e-commerce or contactless
20
stores) is likely to increase the near-term importance of tech clusters. Efforts by tech companies
to provide assistance in the crisis have also helped repair some of the reputation hits they
recently incurred. Yet, these clusters thrive on proximity, which can unfortunately transmit
viruses as easily as ideas, and on global talent and trade. These benefits may be dampened in
years ahead due to the virus itself and the follow-on business and political changes it produces.
Catalysts like venture funding may also be in shorter supply in years ahead. The man-made
nature of tech clusters leaves them more malleable than those built around harbors or coal mines,
and future research will shed more light on tech clusters through the adjustments that lie ahead.
REFERENCES
• Acs, Z., Anselin, L., Varga, A. (2002). “Patents and innovation counts as measures of regional
production of new knowledge.” Research Policy, 3, 1069-85.
• Agrawal, A., Cockburn, I. (2003). “The anchor tenant hypothesis: exploring the role of large, local,
R&D-intensive firms in regional innovation systems.” International Journal of Industrial
Organization, 21 (9), 1217-53.
• Agrawal, A., Cockburn, I., Galasso, A., Oettl, A. (2014). “Why are some regions more innovative
than others? The role of firm size diversity.” Journal of Urban Economics, 81 (1), 149-65.
• Agrawal, A., Cockburn, I., Rosell, C. (2010). “Not invented here? Innovation in company towns.”
Journal of Urban Economics, 67 (1), 78-89.
• Alcacer, J., Chung, W. (2007). “Location strategies and knowledge spillovers.” Management Science,
53 (5), 760-76.
• Alcacer, J., Chung, W. (2014). “Location strategies for agglomeration economies.” Strategic
Management Journal, 35, 1749-61.
• Alcacer, J., Delgado, M. (2016). “Spatial organization of firms and location choices through the value
chain.” Management Science, 62 (11), 3213-34.
• Almazan, A., De Motta, A., Titman, S. (2007). “Firm location and the creation and utilization of
human capital.” Review of Economic Studies, 74 (4), 1305-27.
• Almeida, P., Kogut, B. (1999). “Localization of knowledge and the mobility of engineers in regional
networks.” Management Science, 45 (7), 905-17.
• Andersson, R., Quigley, J., Wilhelmsson, M. (2009). “Higher education, localization and innovation:
evidence from a natural experiment.” Journal of Urban Economics, 66 (1), 2-15.
• Arzaghi, M., Henderson, J.V. (2008). “Networking off Madison Avenue.” Review of Economic
Studies, 75, 1011-38.
• Audretsch, D., Feldman, M. (1996). “R&D spillovers and the geography of innovation and
production.” American Economic Review, 86, 630-40.
• Balachandran, S., Hernandez, E. (2019). “Mi Casa Es Tu Casa: immigrant entrepreneurs as pathways
to foreign venture capital investments.” Wharton Working Paper.
• Baldwin, C., Clark, K. (1997). “Managing in an age of modularity.” Harvard Business Review
(September-October).
• Bathelt, H., Li, P.F. (2014). “Global cluster networks—foreign direct investment flows from Canada
to China.” Journal of Economic Geography, 14 (1), 45-71.
• Bathelt, H., Malmberg, A., Maskell, P. (2004). “Clusters and knowledge: local buzz, global pipelines
and the process of knowledge creation.” Progress in Human Geography, 28 (1), 31-56.
• Behrens, K., Duranton, G., Robert-Nicoud, F. (2014). “Productive cities: sorting, selection, and
agglomeration.” Journal of Political Economy, 122 (3), 507-53.

21
• Berger. S. (2005). How We Compete: What Companies Around the World Are Doing to Make it in
Today's Global Economy, New York, Doubleday.
• Bergquist, K., Fink, C., Raffo, J. (2017). “Identifying and ranking the world’s largest clusters of
inventive activity.” WIPO Working Paper 34.
• Berkes, E., Gaetani, R. (2019). “The geography of unconventional innovation”, Working Paper.
• Berkes, E., Nencka, P. (2019). “‘Novel’ ideas: the effects of Carnegie libraries on innovative
activities”, Working Paper.
• Branstetter, L., Li, G., Veloso, F. (2015). “The rise of international coinvention.” In: Jaffe, A., Jones,
B. (Eds.) The Changing Frontier: Rethinking Science and Innovation Policy, University of Chicago
Press, 135-68.
• Breschi, S., Lissoni, F. (2009). “Mobility of skilled workers and co-invention networks: an anatomy
of localized knowledge flows.” Journal of Economic Geography, 9 (4), 439-68.
• Bresnahan, T, Gambardella, A. (Eds.) (2001). Building High-Tech Clusters: Silicon Valley and
Beyond, Cambridge University Press, Cambridge.
• Carlino, G., Carr, J., Hunt, R., Smith, T. (2012). “The agglomeration of R&D labs.” Federal Reserve
Bank of Philadelphia Working Paper 12-22.
• Carlino, G., Chatterjee, S., Hunt, R. (2007). “Urban density and the rate of invention.” Journal of
Urban Economics, 61 (3), 389-419.
• Carlino, G., Kerr, W. (2015). “Agglomeration and innovation.” In: Duranton, G., Henderson, J.V.,
Strange, W. (Eds.) Handbook of Regional and Urban Economics Volume 5, 349-404.
• Carrincazeaux, C., Lunga, Y., Rallet, A. (2001). “Proximity and localisation of corporate R&D
activities.” Research Policy, 30, 777-89.
• Chatterji, A., Glaeser, E., Kerr, W. (2014). “Clusters of entrepreneurship and innovation.” In: Lerner,
J., Stern, S. (Eds.), Innovation Policy and the Economy, Vol. 14, University of Chicago Press,
Chicago, IL.
• Choudhury, P. (2017). “Innovation outcomes in a distributed organization: intrafirm mobility and
access to resources.” Organization Science, 28 (2), 339-54.
• Choudhury, P. (2016). “Return migration and geography of innovation in MNEs: a natural
experiment of knowledge production by local workers reporting to return migrants.” Journal of
Economic Geography, 16 (3), 585-610.
• Coe, N.M., Bunnell, T.G. (2003). “‘Spatializing’ knowledge communities: towards a
conceptualization of transnational innovation networks.” Global Networks, 3, 437-56.
• Combes, P., Duranton, G. (2006). “Labour pooling, labour poaching and spatial clustering.” Regional
Science and Urban Economics, 36 (1), 1-28.
• Costa, D., Kahn, M. (2000). “Power couples: changes in the locational choice of the college educated,
1940-1990.” Quarterly Journal of Economics, 115 (4), 1287-315.
• Davis, D., Dingel, J. (2019). “A spatial knowledge economy.” American Economic Review, 109 (1),
153-70.
• Delgado, M., Porter, M., Stern, S. (2010). “Clusters and entrepreneurship.” Journal of Economic
Geography, 10 (4), 495-518.
• Dittmar, J., Meisenzahl, R. (2020). “Public goods institutions, human capital, and growth: evidence
from German history.” The Review of Economic Studies, 87 (2), 959-96.
• Duran, X., and Nanda, R. (2019). “Experimentation in the early U.S. automobile industry.” Working
Paper.
• Duranton, G. (2007). “Urban evolutions: the fast, the slow, and the still.” American Economic
Review, 97, 197-221.
• Duranton, G. (2011). “California dreamin’: the feeble case for cluster policies.” Review of Economic
Analysis, 3, 3-45.

22
• Duranton, G., Puga, D. (2001). “Nursery cities: urban diversity, process innovation, and the life cycle
of products.” American Economic Review, 91, 1454-77.
• Duranton, G., Puga, D. (2004). “Micro-foundations of urban agglomeration economies.” In:
Henderson, J.V., Thisse, J.-F. (Eds.), Handbook of Urban and Regional Economics, Vol. 4, North-
Holland, Amsterdam.
• Duranton, G., Puga, D. (2005). “From sectoral to functional urban specialisation.” Journal of Urban
Economics, 57, 343-70.
• Egan, E., Dayton, A., Carranza D. (2017). The Top 100 U.S. Startup Cities in 2016. Rice University
Report. tophttp://www.edegan.com/wiki/US_Startup_City_Ranking.
• Ellison, G., Glaeser, E. (1997). “Geographic concentration in U.S. manufacturing industries: a
dartboard approach.” Journal of Political Economy, 105 (5), 889-927.
• Ellison, G., Glaeser, E., Kerr, W. (2010). “What causes industry agglomeration? Evidence from
coagglomeration patterns.” American Economic Review, 100 (3), 1195-213.
• Faggio, G., Silva, O., Strange, W. (2017). “Heterogeneous agglomeration.” Review of Economics and
Statistics, 99 (1), 80-94.
• Fairlee, R., Chatterji, A. (2013). “High tech entrepreneurship in Silicon Valley: opportunities and
opportunity costs.” Journal of Economics and Management Strategy, 22 (2), 365-89.
• Falck, O., Fritsch, M., Heblich, S. (2009). “Bohemians, human capital, and regional economic
growth.” Jena Economic Research Papers 2009-049.
• Fallick, B., Fleischman, C., Rebitzer, J. (2006). “Job-hopping in Silicon Valley: some evidence
concerning the microfoundations of a high-technology cluster.” Review of Economics and Statistics,
88 (3), 472-81.
• Feldman, M. (2003). “The locational dynamics of the US biotech industry: knowledge externalities
and the anchor hypothesis.” Industry and Innovation 10 (3), 311-29.
• Feldman, M., Kogler, D. (2010). “Stylized facts in the geography of innovation.” In: Hall, B.,
Rosenberg, N. (Eds.), Handbook of the Economics of Innovation, Vol. 1. Elsevier, Oxford, 381-410.
• Ferrary, M., Granovetter, M. (2009). “The role of venture capital firms in Silicon Valley’s complex
innovation network.” Economy and Society, 18, 326-59.
• Fleming, L., Marx, M. (2006). “Managing creativity in small worlds.” California Management
Review, 48 (4), 6-27.
• Florida, R. (2005). Cities and the Creative Class, Routledge, New York.
• Gagne, J.-F. (2019). “Global AI talent report 2019.” jfgagne.ai/talent-2019.
• Ganguli, I., Lin, J., Reynolds, N. (2019). “The paper trail of knowledge spillovers: evidence from
patent interferences.” American Economic Journal: Applied Economics, forthcoming.
• Gerlach, H., Ronde, T., Stahl, K. (2009). “Labor pooling in R&D intensive industries.” Journal of
Urban Economics, 65 (1), 99-111.
• Gilson, R. (1999). “The legal infrastructure of high technology industrial districts: Silicon Valley,
Route 128, and covenants not to compete.” New York University Law Review, 74, 575-629.
• Glaeser, E. (2008). Cities, Agglomeration and Spatial Equilibrium, Oxford University Press, Oxford.
• Glaeser, E. (2005). “Reinventing Boston: 1630-2003.” Journal of Economic Geography, 5 (2), 119-
153.
• Glaeser, E.L., Kallal, H.D., Scheinkman, J.A., Shleifer, A. (1992). “Growth in cities.” Journal of
Political Economy, 100, 1126-52.
• Glaeser, E., Kerr, W. (2009). “Local industrial conditions and entrepreneurship: how much of the
spatial distribution can we explain?” Journal of Economics and Management Strategy, 18 (3), 623-63.
• Glaeser, E., Kerr, S., Kerr, W. (2015). “Entrepreneurship and urban growth: an empirical assessment
with historical mines.” Review of Economics and Statistics, 97 (2), 498-520.
• Glaeser, E., Kerr, W., Ponzetto, G. (2010). “Clusters of entrepreneurship.” Journal of Urban
Economics, 67 (1), 150-68.
23
• Gompers, P., Lerner, J., Scharfstein, D. (2005). “Entrepreneurial spawning: public corporations and
the genesis of new ventures, 1986 to 1999.” Journal of Finance, 60 (2), 577-614.
• Gompers, P., Wang, S. (2017). “Diversity in innovation.” Harvard Business School Working Paper,
No. 17-067.
• Granovetter, M. (1973). “The strength of weak ties.” American Journal of Sociology, 78 (6), 1360-80.
• Groysberg, B. (2010). Chasing Stars: The Myth of Talent and the Portability of Performance,
Princeton University Press, New Jersey.
• Gruber, J., Johnson, S. (2019). Jump-Starting America: How Breakthrough Science Can Revive
Economic Growth and the American Dream. Public Affairs.
• Guzman, J., Stern, S. “The state of American entrepreneurship: new estimates of the quantity and
quality of entrepreneurship for 15 US states, 1988–2014.” National Bureau of Economic Research
Working Paper No. 22095.
• Gyourko, J., Mayer, C., Sinai, T. (2013). “Superstar cities.” American Economic Journal: Economic
Policy, 5 (4), 167-99.
• Hall, B., Jaffe, A., Trajtenberg, M. (2001). “The NBER patent citation data file: Lessons, insights and
methodological tools.” National Bureau of Economic Research Working Paper No. 8498.
• Hausman, N. (2012). “University innovation, local economic growth, and entrepreneurship.” US
Census Bureau Center for Economic Studies Paper No. CES-WP- 12-10.
• Hausman, N. (2019). “Non-compete law, labor mobility, and entrepreneurship.” Working paper.
• Hellmann, T., Perotti, E. (2011). “The circulation of ideas in firms and markets.” Management
Science, 57 (10), 1813-26.
• Helsley, R., Strange W. (1990). “Matching and agglomeration economies in a system of cities.”
Regional Science and Urban Economics, 20 (2), 189-212.
• Helsley, R., Strange, W. (2002). “Innovation and input sharing.” Journal of Urban Economics, 51, 25-
45.
• Helsley, R., Strange, W. (2014). “Coagglomeration, clusters, and the scale and composition of cities.”
Journal of Political Economy, 122 (5), 1064-1093.
• Henderson, J.V. (1974). “The size and types of cities.” American Economic Review, 61, 640-56.
• Henderson, V., Kuncoro, A., Turner, M. (1995) “Industrial development in cities.” Journal of
Political Economy, 103, 1067-90.
• Hsieh, C.-T., Moretti, E. (2019). “Housing constraints and spatial misallocation?” American
Economic Journal: Macroeconomics, 11 (2), 1-39.
• Humphrey, J., Schmitz, H. (2002). “How does insertion in global value chains affect upgrading in
industrial clusters?” Regional Studies, 36 (9), 1017-102.
• Jacobs, J. (1969). The Economy of Cities, Vintage Books, New York.
• Jaffe, A., Trajtenberg, M., Fogarty, M. (2000). “Knowledge spillovers and patent citations: evidence
from a survey of inventors.” American Economic Review, 90 (2), 215-8.
• Jaffe, A., Trajtenberg, M., Henderson, R. (1993). “Geographic localization of knowledge spillovers as
evidenced by patent citations.” Quarterly Journal of Economics, 108, 577-98.
• Kantor, S., Whalley, A. (2014). “Knowledge spillovers from research universities: evidence from
endowment value shocks.” Review of Economics and Statistics, 96 (1), 171-88.
• Kenny, M, (2000). Understanding Silicon Valley: The Anatomy of an Entrepreneurial Region,
Stanford University Press.
• Kerr, S., Kerr, W. (2018). “Global collaborative patents.” The Economic Journal, 128, F235-72.
• Kerr, S., Kerr, W. (2020). “Immigrant entrepreneurship in America: evidence from the survey of
business owners 2007 & 2012.” Research Policy, 49 (3), 103918.
• Kerr, W. (2010). “Breakthrough inventions and migrating clusters of innovation.” Journal of Urban
Economics, 67 (1), 46-60.
• Kerr, W. (2018). “Navigating talent hot spots.” Harvard Business Review.

24
• Kerr, W. (2019). The Gift of Global Talent, Stanford University Press.
• Kerr, W., Kominers, S. (2015). “Agglomerative forces and cluster shapes.” Review of Economics and
Statistics, 97 (4), 877-99.
• Kerr, W., Lincoln, W. (2010). “The supply side of innovation: H-1B visa reforms and U.S. ethnic
invention.” Journal of Labor Economics, 28 (3), 473-508.
• Kerr, W., Nanda, R., Rhodes-Kropf, M. (2014). “Entrepreneurship as experimentation.” Journal of
Economic Perspectives, 28 (3), 25-48.
• Klepper, S. (2010). “The origin and growth of industry clusters: the making of Silicon Valley and
Detroit.” Journal of Urban Economics, 67, 15-32.
• Klepper, S. (2016). Experimental Capitalism, Princeton University Press.
• Krugman, P. (1991). Geography and Trade, MIT Press.
• Lamoreaux, N., Levenstein, M., Sokoloff, K. (2004). “Financing invention during the second
industrial revolution: Cleveland, Ohio, 1870-1920.” NBER Working Paper 10923.
• Landier, A., Nair, V., Wulf, J. (2009). “Trade-offs in staying close: corporate decision making and
geographic dispersion.” Review of Financial Studies, 22 (3), 1119-48.
• Lee, J., Nicholas, T. (2012). “The origins and development of Silicon Valley.” Harvard Business
School Case 813-098.
• Lerner, J. (2009). Boulevard of Broken Dreams: Why Public Efforts to Boost Entrepreneurship and
Venture Capital Have Failed-and What to Do about It. Princeton University Press.
• Liang, W.-J., Mai, C.-C., Thisse, J.-F., Wang, P. (2019). “On the economics of science parks.” NBER
Working Paper 225595.
• Lin, J. (2011). “Technological adaptation, cities, and new work.” Review of Economics and Statistics,
93 (2), 554-74.
• Lychagin, S., Pinkse, J., Slade, M., Van Reenen, J. (2017). “Spillovers in space: does geography
matter?” Journal of Industrial Economics, 64 (2), 295-335.
• Malmberg, A., Power, D. (2005). “(How) Do (Firms in) Clusters Create Knowledge?” Industry and
Innovation, 12 (4), 409-31.
• Markusen, A. (1996). “Sticky places in slippery space: a typology of industrial districts.” Economic
Geography, 72 (3), 293-313.
• Marshall, A. (1890). Principles of Economics. Macmillan, London.
• Marx, M., Strumsky, D., Fleming, L. (2009). “Mobility, skills, and the Michigan non-compete
experiment.” Management Science, 55 (6), 875-89.
• Marx, M., Singh, J., Fleming, L. (2015). “Regional disadvantage? Employee non-compete
agreements and brain drain.” Research Policy, 44, 394-404.
• Matouschek, N., Robert-Nicoud, F. (2005). “The role of human capital investments in the location
decision of firms.” Regional Science and Urban Economics, 35 (5), 570-83.
• Mehrohta, Kartikay. 2016. “Samsung, LG Accused of Silicon Valley Anti-Poaching Deal,”
Bloomberg, September 12, https://www.bloomberg.com/news/articles/2016-09-12/samsung-lg-
accused-of-silicon-valley-anti-poaching-agreement.
• Miguelez, E. (2014). “Inventor diasporas and the internationalization of technology.” Discussion
Paper Series No. 25/14, Centre for Research & Analysis of Migration.
• Moretti, E. (2012). The New Geography of Jobs. Houghton Mifflin Harcourt, New York.
• Moretti, E. (2019). “The effect of high-tech clusters on the productivity of top inventors.” Discussion
Paper 13992, Center for Economic Policy Research.
• Murata, Y., Nakajima, R., Okamoto, R., Tamura, R. (2014). “Localized knowledge spillovers and
patent citations: a distance-based approach.” Review of Economics and Statistics, 96 (5), 967-85.
• Nanda, R., Khanna, T. (2012). “Diasporas and domestic entrepreneurs: evidence from the Indian
software industry.” Journal of Economics and Management Strategy, 19 (4), 991-1012.
25
• Nathan, M. (2014). “The wider economic impacts of high-skilled migrants: a survey of the literature
for receiving countries.” IZA Journal of Migration, 3 (4).
• Nathan, M. (2015). “Same difference? Minority ethnic inventors, diversity and innovation in the
UK.” Journal of Economic Geography, 15 (1), 129-68.
• National Science Foundation. (2017). National Center for Science and Engineering Statistics | NSF
20-311.
• Olson, G., Olson, J. (2003). “Mitigating the effects of distance on collaborative intellectual work.”
Economics of Innovation and New Technology, 12 (1), 27-42.
• Overman, H.G., Puga, D. (2010) “Labour pooling as a source of agglomeration: an empirical
investigation.” In Glaeser, E.L. (Ed.) Agglomeration Economics. Chicago, IL: University of Chicago
Press, 133-50.
• Peri, G., Shih, K., Sparber, S. (2015). “STEM workers, H-1B visas and productivity in U.S. cities.”
Journal of Labor Economics, 33 (S1), S225-55.
• Porter, M. (1998). “Clusters and the new economics of competition.” Harvard Business Review.
• Roberts, Jeff John. 2015. “Tech Workers Will Get Average of $5,770 Under Final Anti-Poaching
Settlement,” Fortune, September 3, , http://fortune.com/2015/09/03/koh-anti-poach-order.
• Rosenthal, S., Strange, W. (2001). “The determinants of agglomeration.” Journal of Urban
Economics, 50, 191-229.
• Rosenthal, S., Strange, W. (2003). “Geography, industrial organization, and agglomeration.” Review
of Economics and Statistics, 85 (2), 377-93.
• Rotemberg, J., Saloner, G. (2000). “Competition and human capital accumulation: a theory of
interregional specialization and trade.” Regional Science and Urban Economics, 30, 373-404.
• Samila, S., Sorenson, O. (2011). “Venture capital, entrepreneurship and economic growth.” Review
of Economics and Statistics, 93 (1), 338-49.
• Saxenian, A. (1991). “The origins and dynamics of production networks in Silicon Valley.” Research
Policy, 20 (1), 423-37.
• Saxenian, A. (1994). Regional Advantage: Culture and Competition in Silicon Valley and Route 128,
Harvard University Press, Cambridge, MA.
• Saxenian, A. (2006). The New Argonauts, Harvard University Press, Cambridge, MA.
• Saxenian, A., Motoyama, Y., Quan, X. (2002). Local and Global Networks of Immigrant
Professionals in Silicon Valley, Public Policy Institute of California, San Francisco, CA.
• Singer, S. (2016). “General Electric CEO lauds Boston as new site.” Hartford Courant,
https://www.courant.com/business/hc-immelt-ge-boston-connecticut-20160324-story.html.
• Singh, J., Marx, M. (2013). “Geographic constraints on knowledge spillovers: political borders vs.
spatial proximity.” Management Science, 59 (9), 2056-78.
• Storper, M., Venables, A.J. (2004). “Buzz: face-to-face contact and the urban economy.” Journal of
Economic Geography, 4 (4), 351-70.
• Sturgeon, T. (2002). “Modular production networks: a new American model of industrial
organization.” Industrial and Corporate Change, 11 (3), 451-96.
• Uzzi, B., Mukherjee, S., Stringer, M., Jones, B. (2013). “Atypical combinations and scientific
impact.” Science, 342 (6157), 468-72.
• Waldinger, F. (2012). “Peer effects in science – evidence from the dismissal of scientists in Nazi
German.” The Review of Economic Studies, 79 (2), 838-861.
• World Intellectual Property Organization. (2017). The Global Innovation Index 2017: Innovation
Feeding the World.
• Zucker, L., Darby, M., Brewer, M. (1998). “Intellectual human capital and the birth of U.S.
biotechnology enterprises.” American Economic Review, 88 (1), 290-306.


