62
Tech, Data, and Your Practice Patrick Palace Owner Palace Law Jack Newton Co-founder and CEO Clio

Tech, Data, and Your Practice
Patrick PalaceOwnerPalace Law
Jack NewtonCo-founder and CEOClio

The Age of Data Driven Law
Patrick Palace
Owner, Palace Law@PALACELAW
Jack Newton
CEO & Founder, Clio@jack_newton


What gets measured gets managed
— Peter Drucker

Title TextSubtitle


• All extracted data is aggregated
and anonymized;
• No personally identifiable
information (PII) was used.
• No data belonging to any law firm
clients was used.
• Customers can opt-out from the
settings menu in Clio.
Methodology
Data Usage + Privacy

The Billable Hour Index
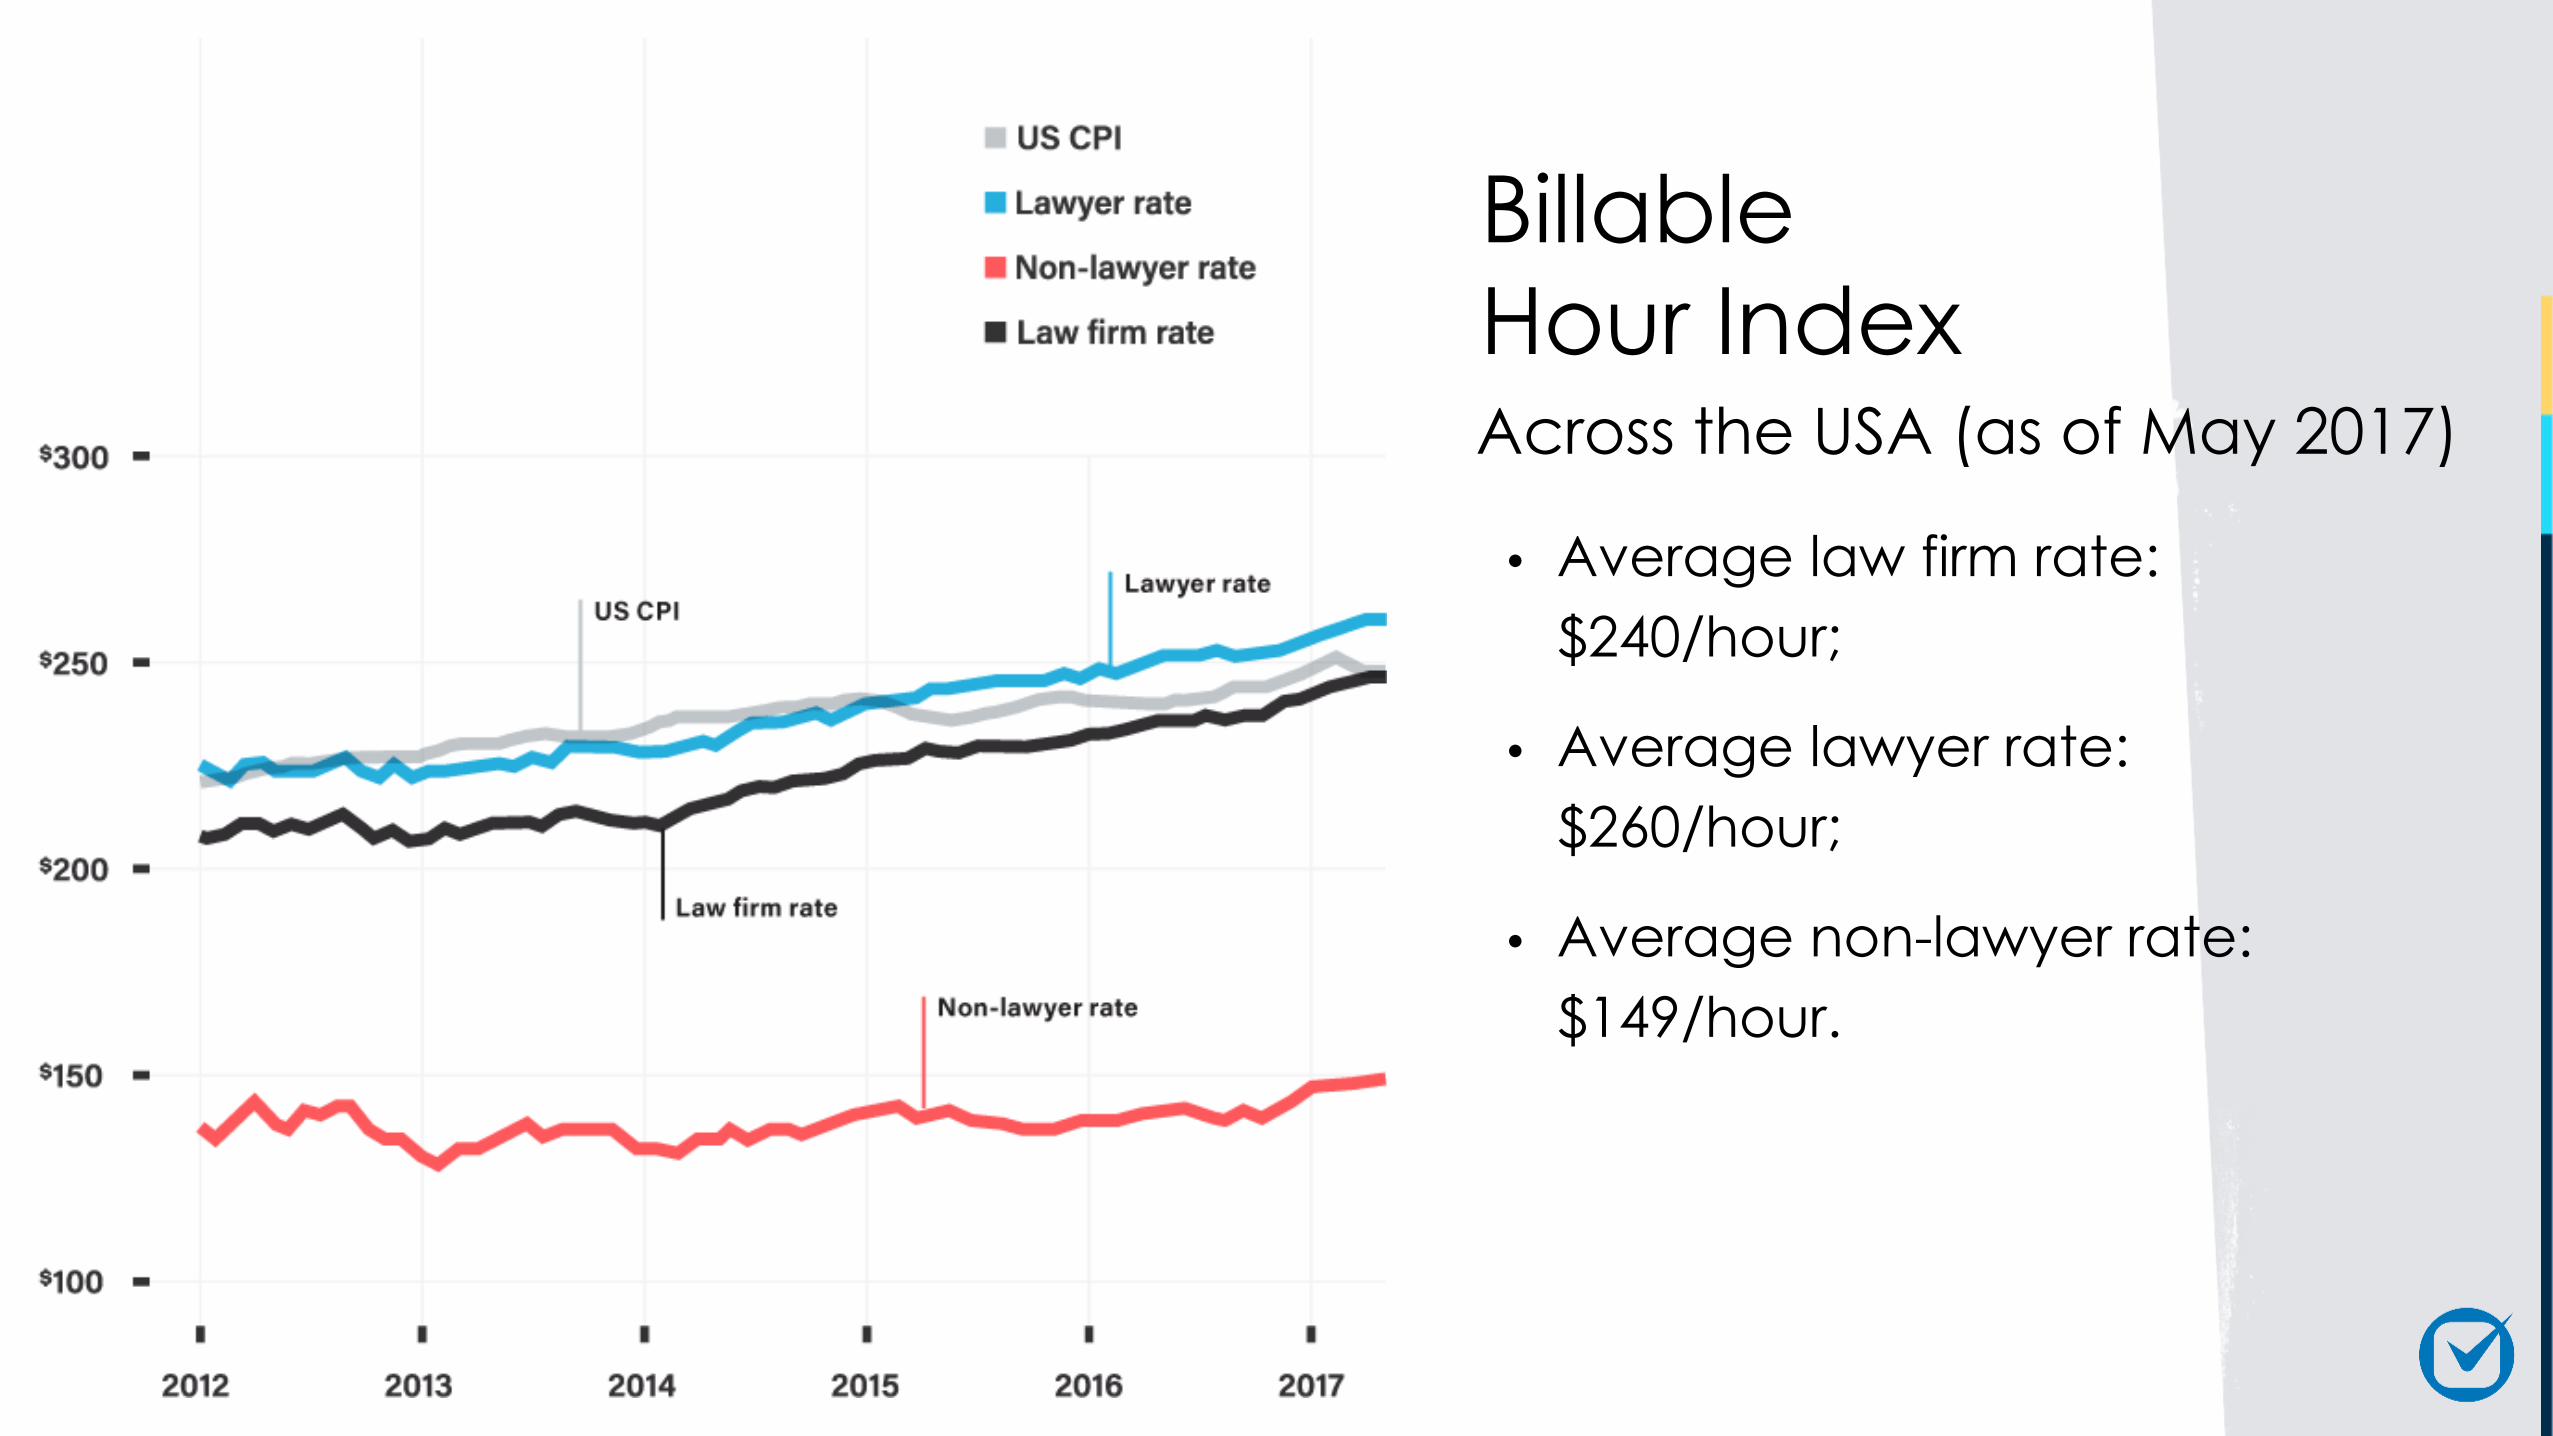
• Average law firm rate:
$240/hour;
• Average lawyer rate:
$260/hour;
• Average non-lawyer rate:
$149/hour.
Billable
Hour IndexAcross the USA (as of May 2017)

Billable Rates by Practice Area

Billable Rates
by Practice
Area
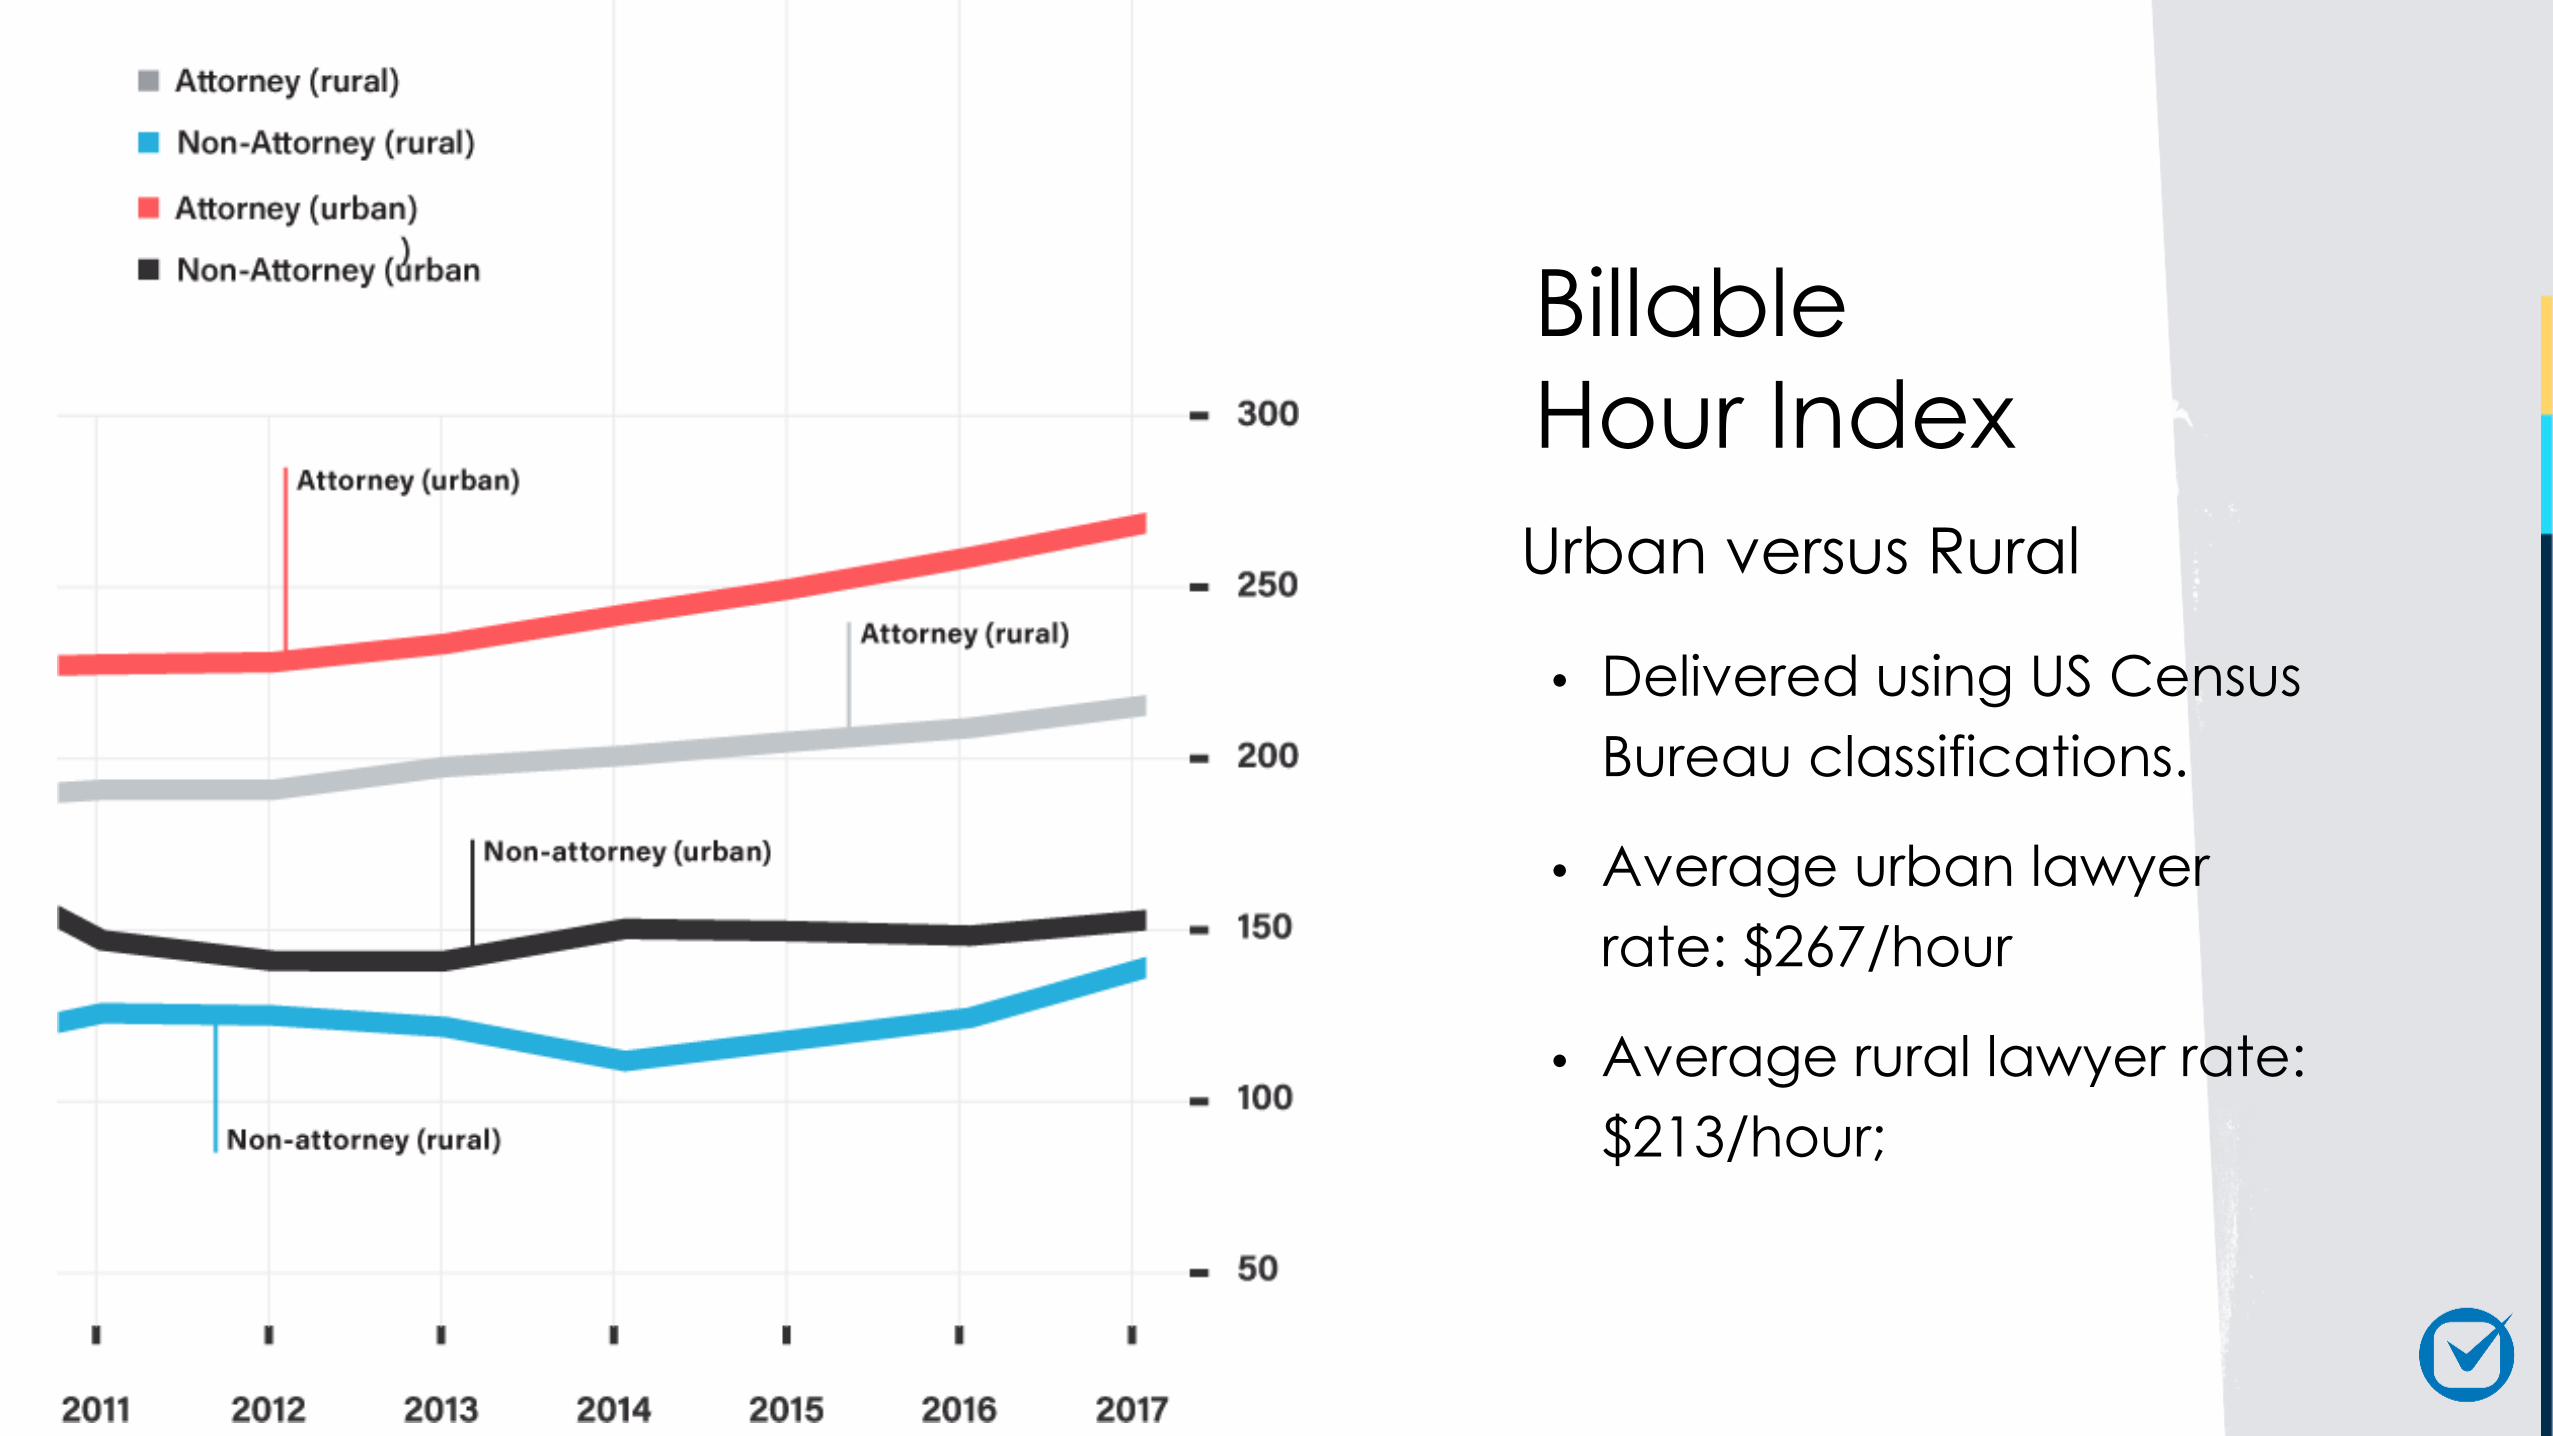
• Delivered using US Census
Bureau classifications.
• Average urban lawyer
rate: $267/hour
• Average rural lawyer rate:
$213/hour;
Billable
Hour Index
Urban versus Rural

Billable
Hour Index
Top 10 MSAs

Real Hourly Rates
By State

Real Hourly Rates
Largest differences

Law Firm KPIs

The Law Firm ‘Funnel’Key Performance Indicators

Utilization Rate
By State

Realization Rates
By State
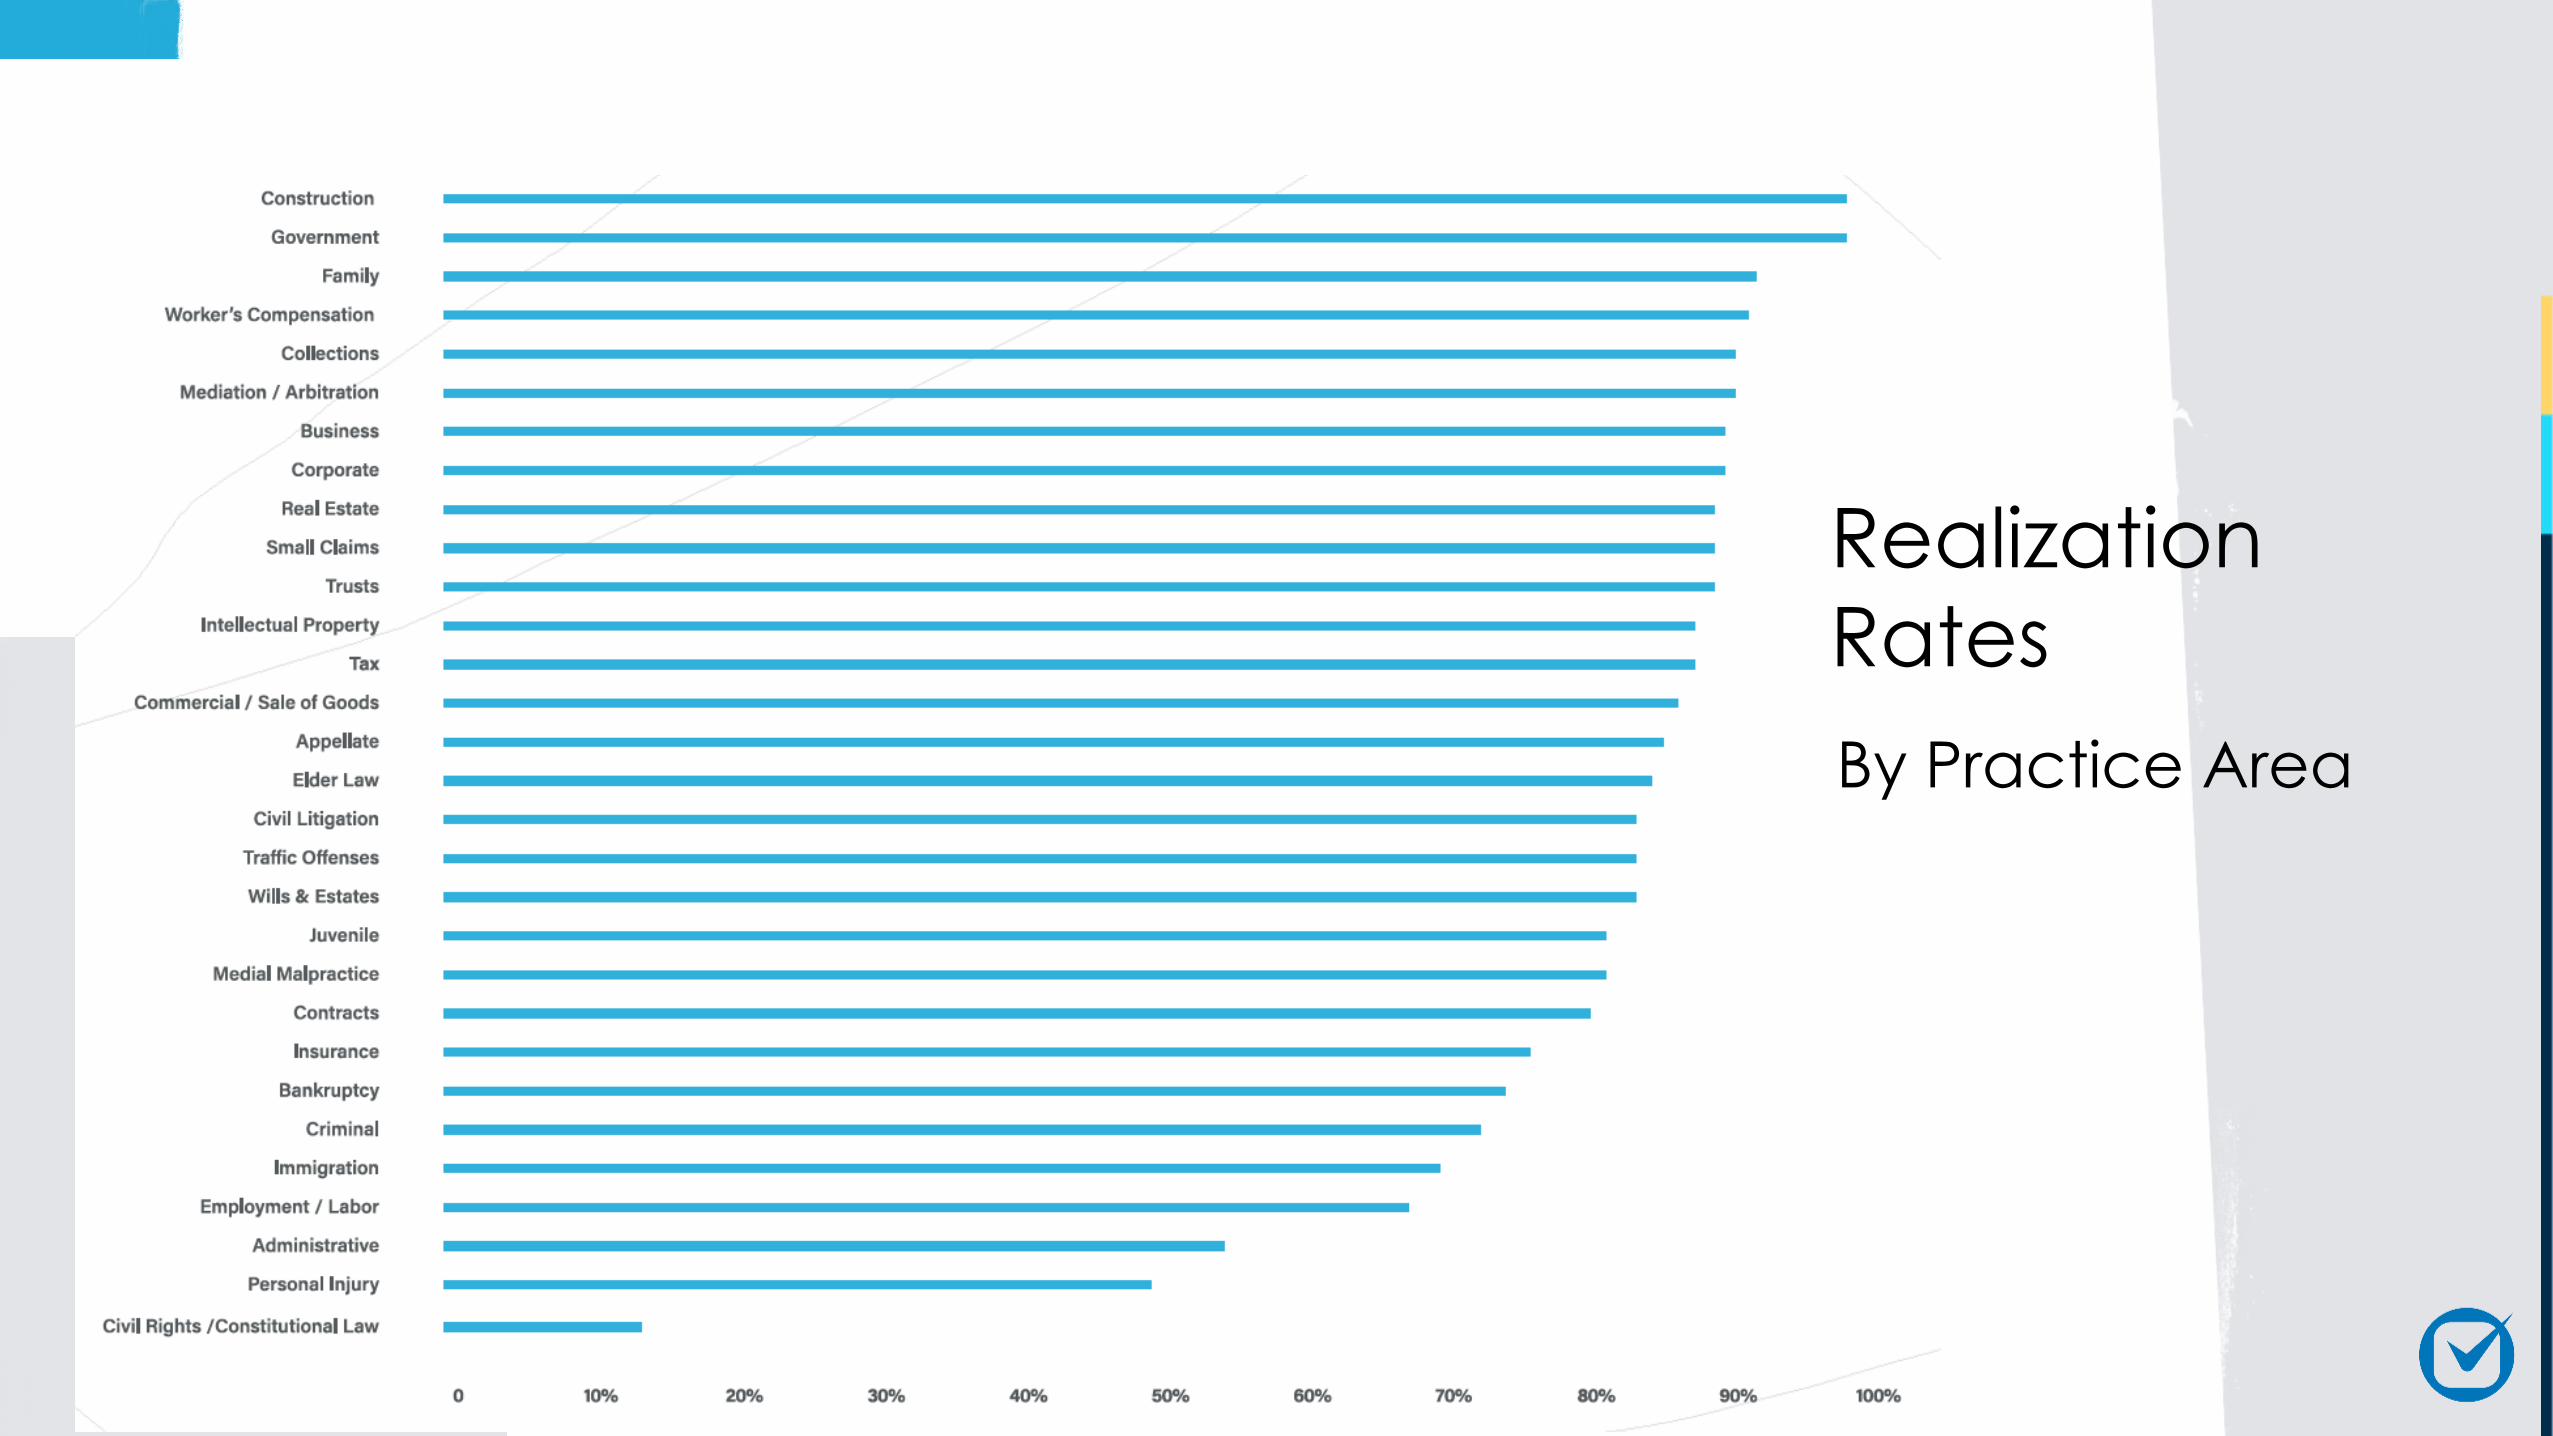
Realization
Rates
By Practice Area

Collection RatesBy State

Collection
RatesBy Practice Area

• Client lacks the funds to pay
(44%);
• Client has adequate funds
but payment is still late
(31%);
• 25% of firms mail bills / 29%
rely on checks;
• Firms accepting credit card
payments are paid 40%
faster.
Collection Rates
Law Firm Survey Insights
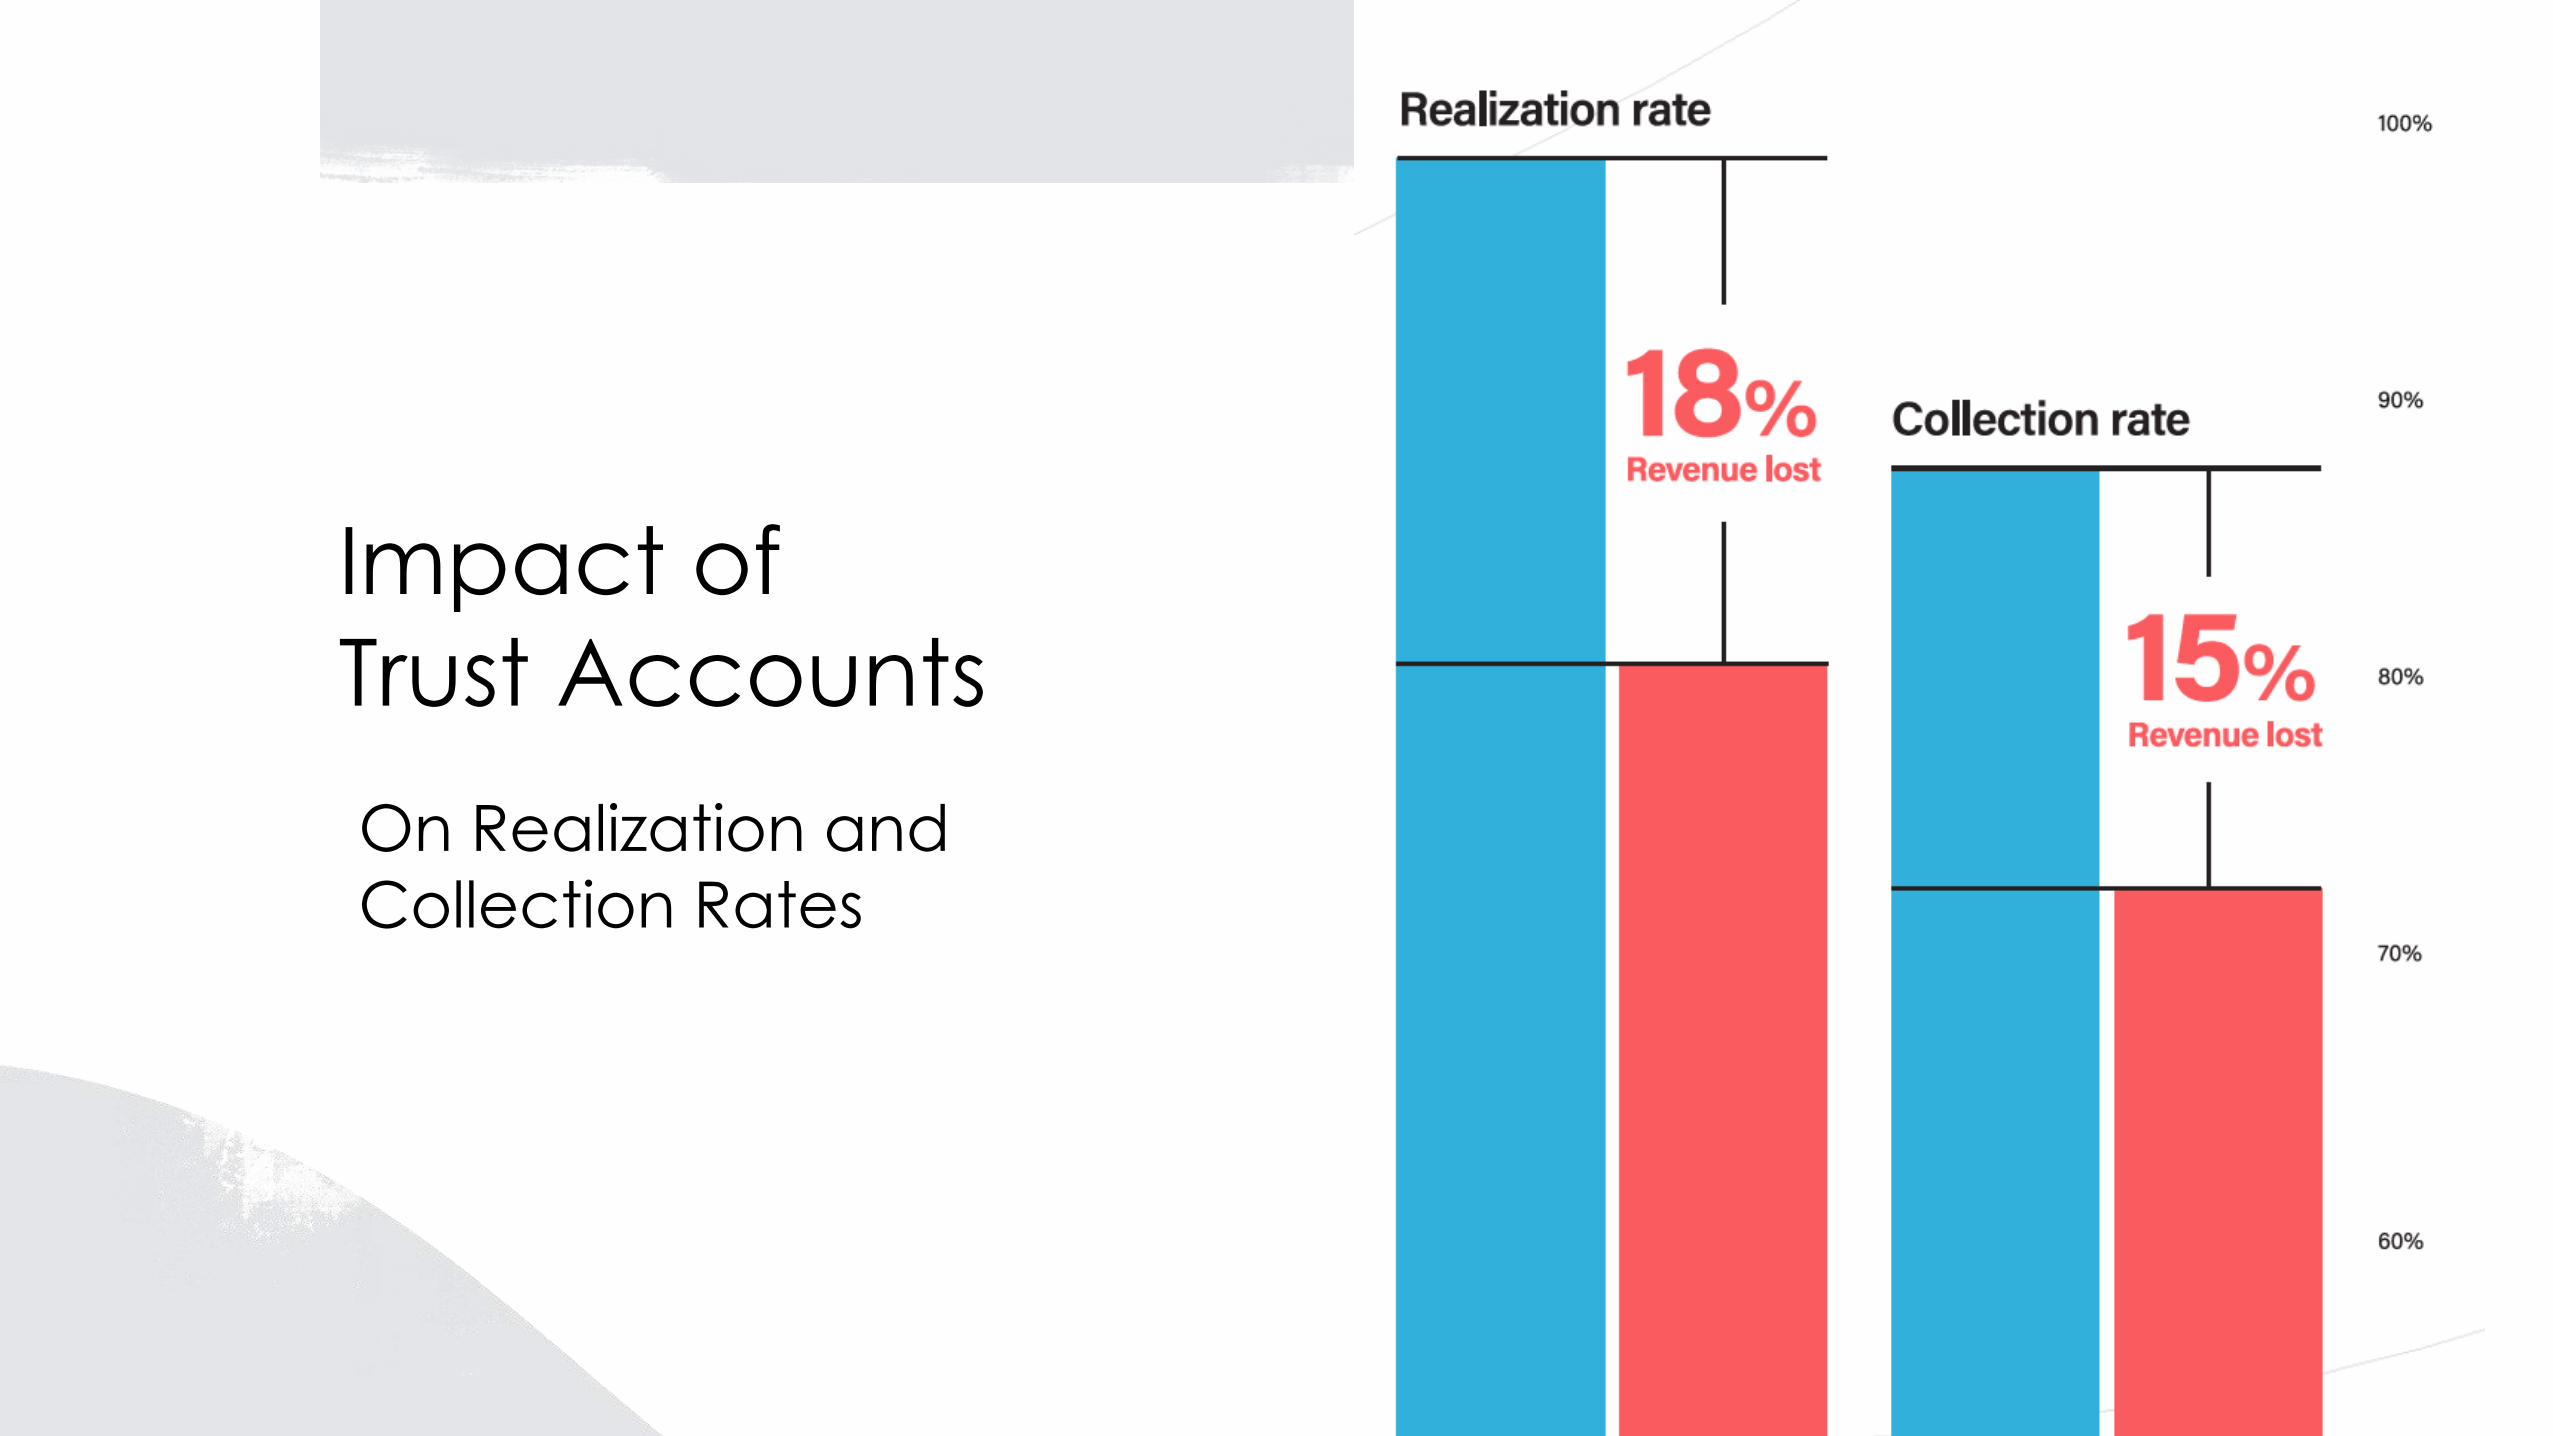
Impact of
Trust Accounts
On Realization and
Collection Rates

The
case of the missing 6 hours

2.3 Hours
Total hours in the workday
Missing 6 hours8 hours

Missing 6 hours2.3 Hours
Utilization rate (how many hours were billable?)
Hours utilizedGet more clients
Be more efficient
Both?

2,915Legal Professionals Surveyed

Where does the time go?

• 69% agreed: not enough time in
the day;
• 59% report that they struggle to
keep track of tasks and
deadlines;
• Interruptions:
• 25% are interrupted more than
10 times per day;
• 30% are interrupted 6 - 10 times
per day.
Additional Insight

It takes a knowledge worker an average of 23 minutes and 15 seconds
to get back to a task following an interruption
—Gloria Mark, Professor in the Department of Informatics at the University of California, Irvine

2,002Consumers Surveyed

How do you find on a lawyer?
Consumer Research

How do you choose a lawyer?
Consumer Research

How do I get my 6 hours back?
Respond to your client inquiries, fast
Minimize interruptions from existing customers
Streamline and automate administrative tasks where you can
Invest in managing your reputation and client satisfaction levels

How do you find on a lawyer?
Consumer Research

NPS Score

NPS Score

How do you choose a lawyer?
Consumer Research

The Flywheel


DATA DRIVEN “MONEYBALL” LAW
-PUTTING THE SEXY BACK IN NUMBERS-BY PATRICK PALACE
[email protected]@PALACELAW
Palace Law


“Its about getting things down
to one number.”
“Finding value nobody else can see.”
“Mathematics cuts straight through…”


SOCIAL MEDIA ANALYTICS


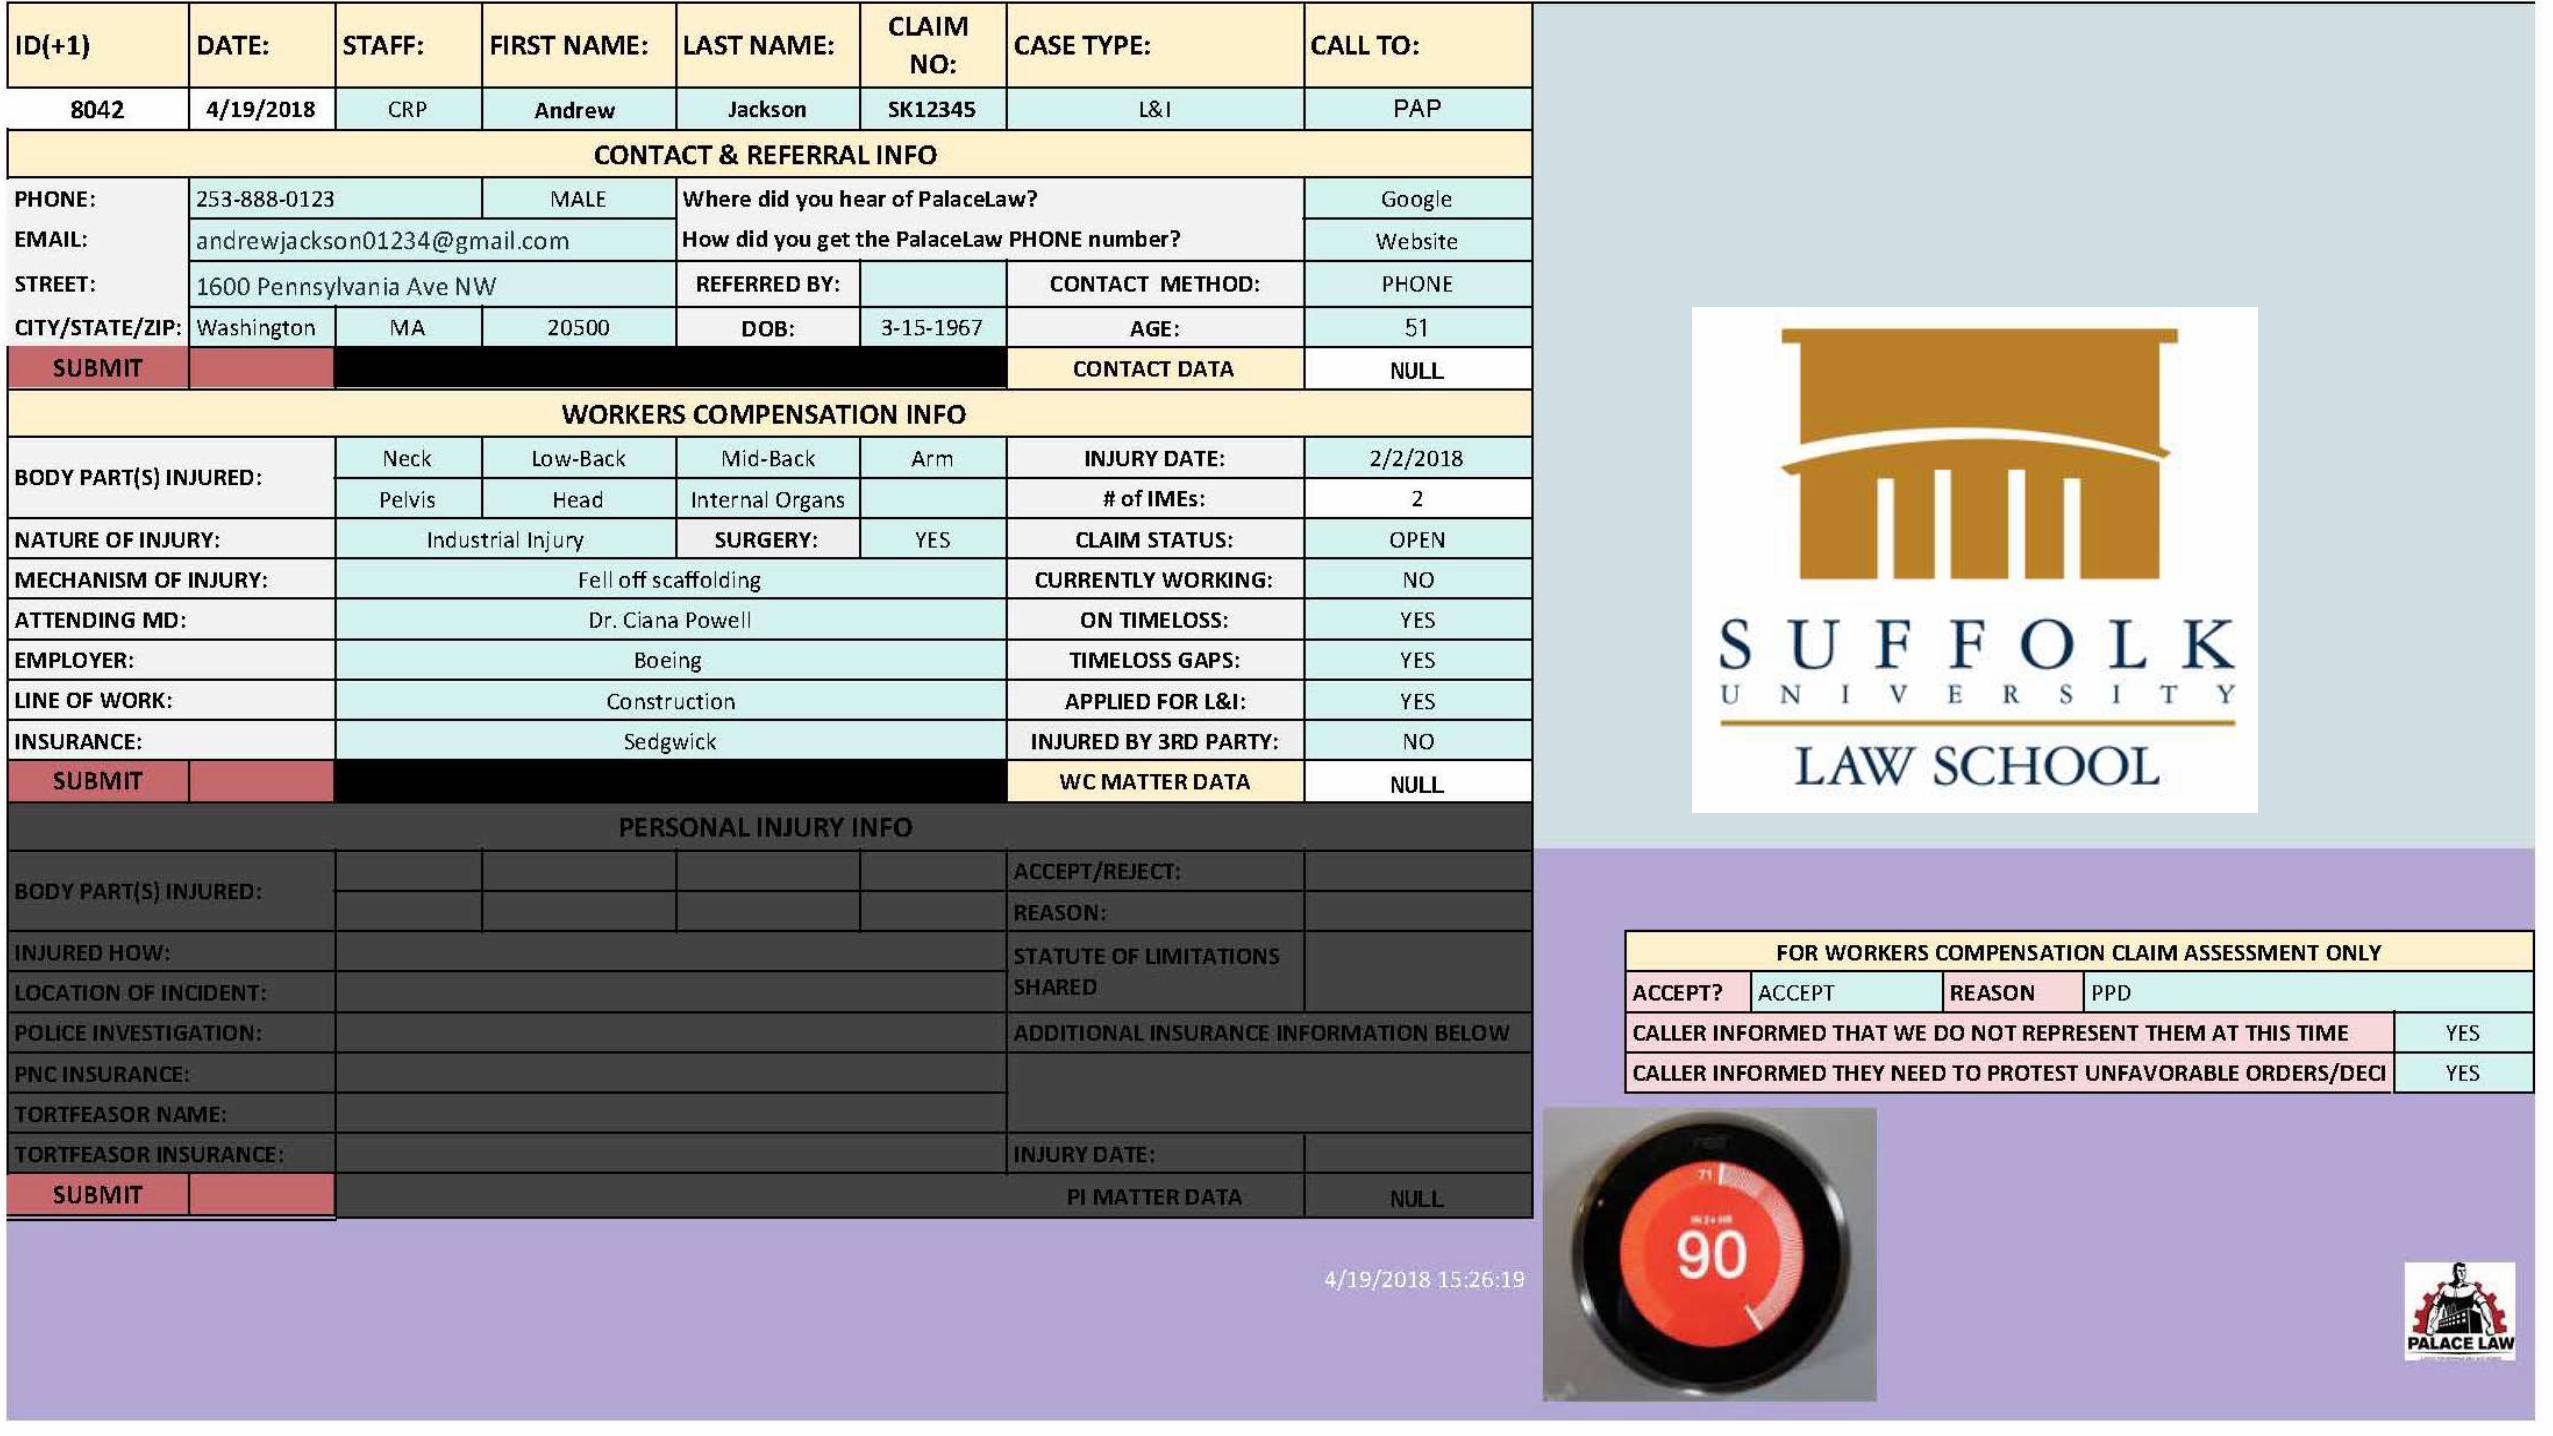
THE PATBOT

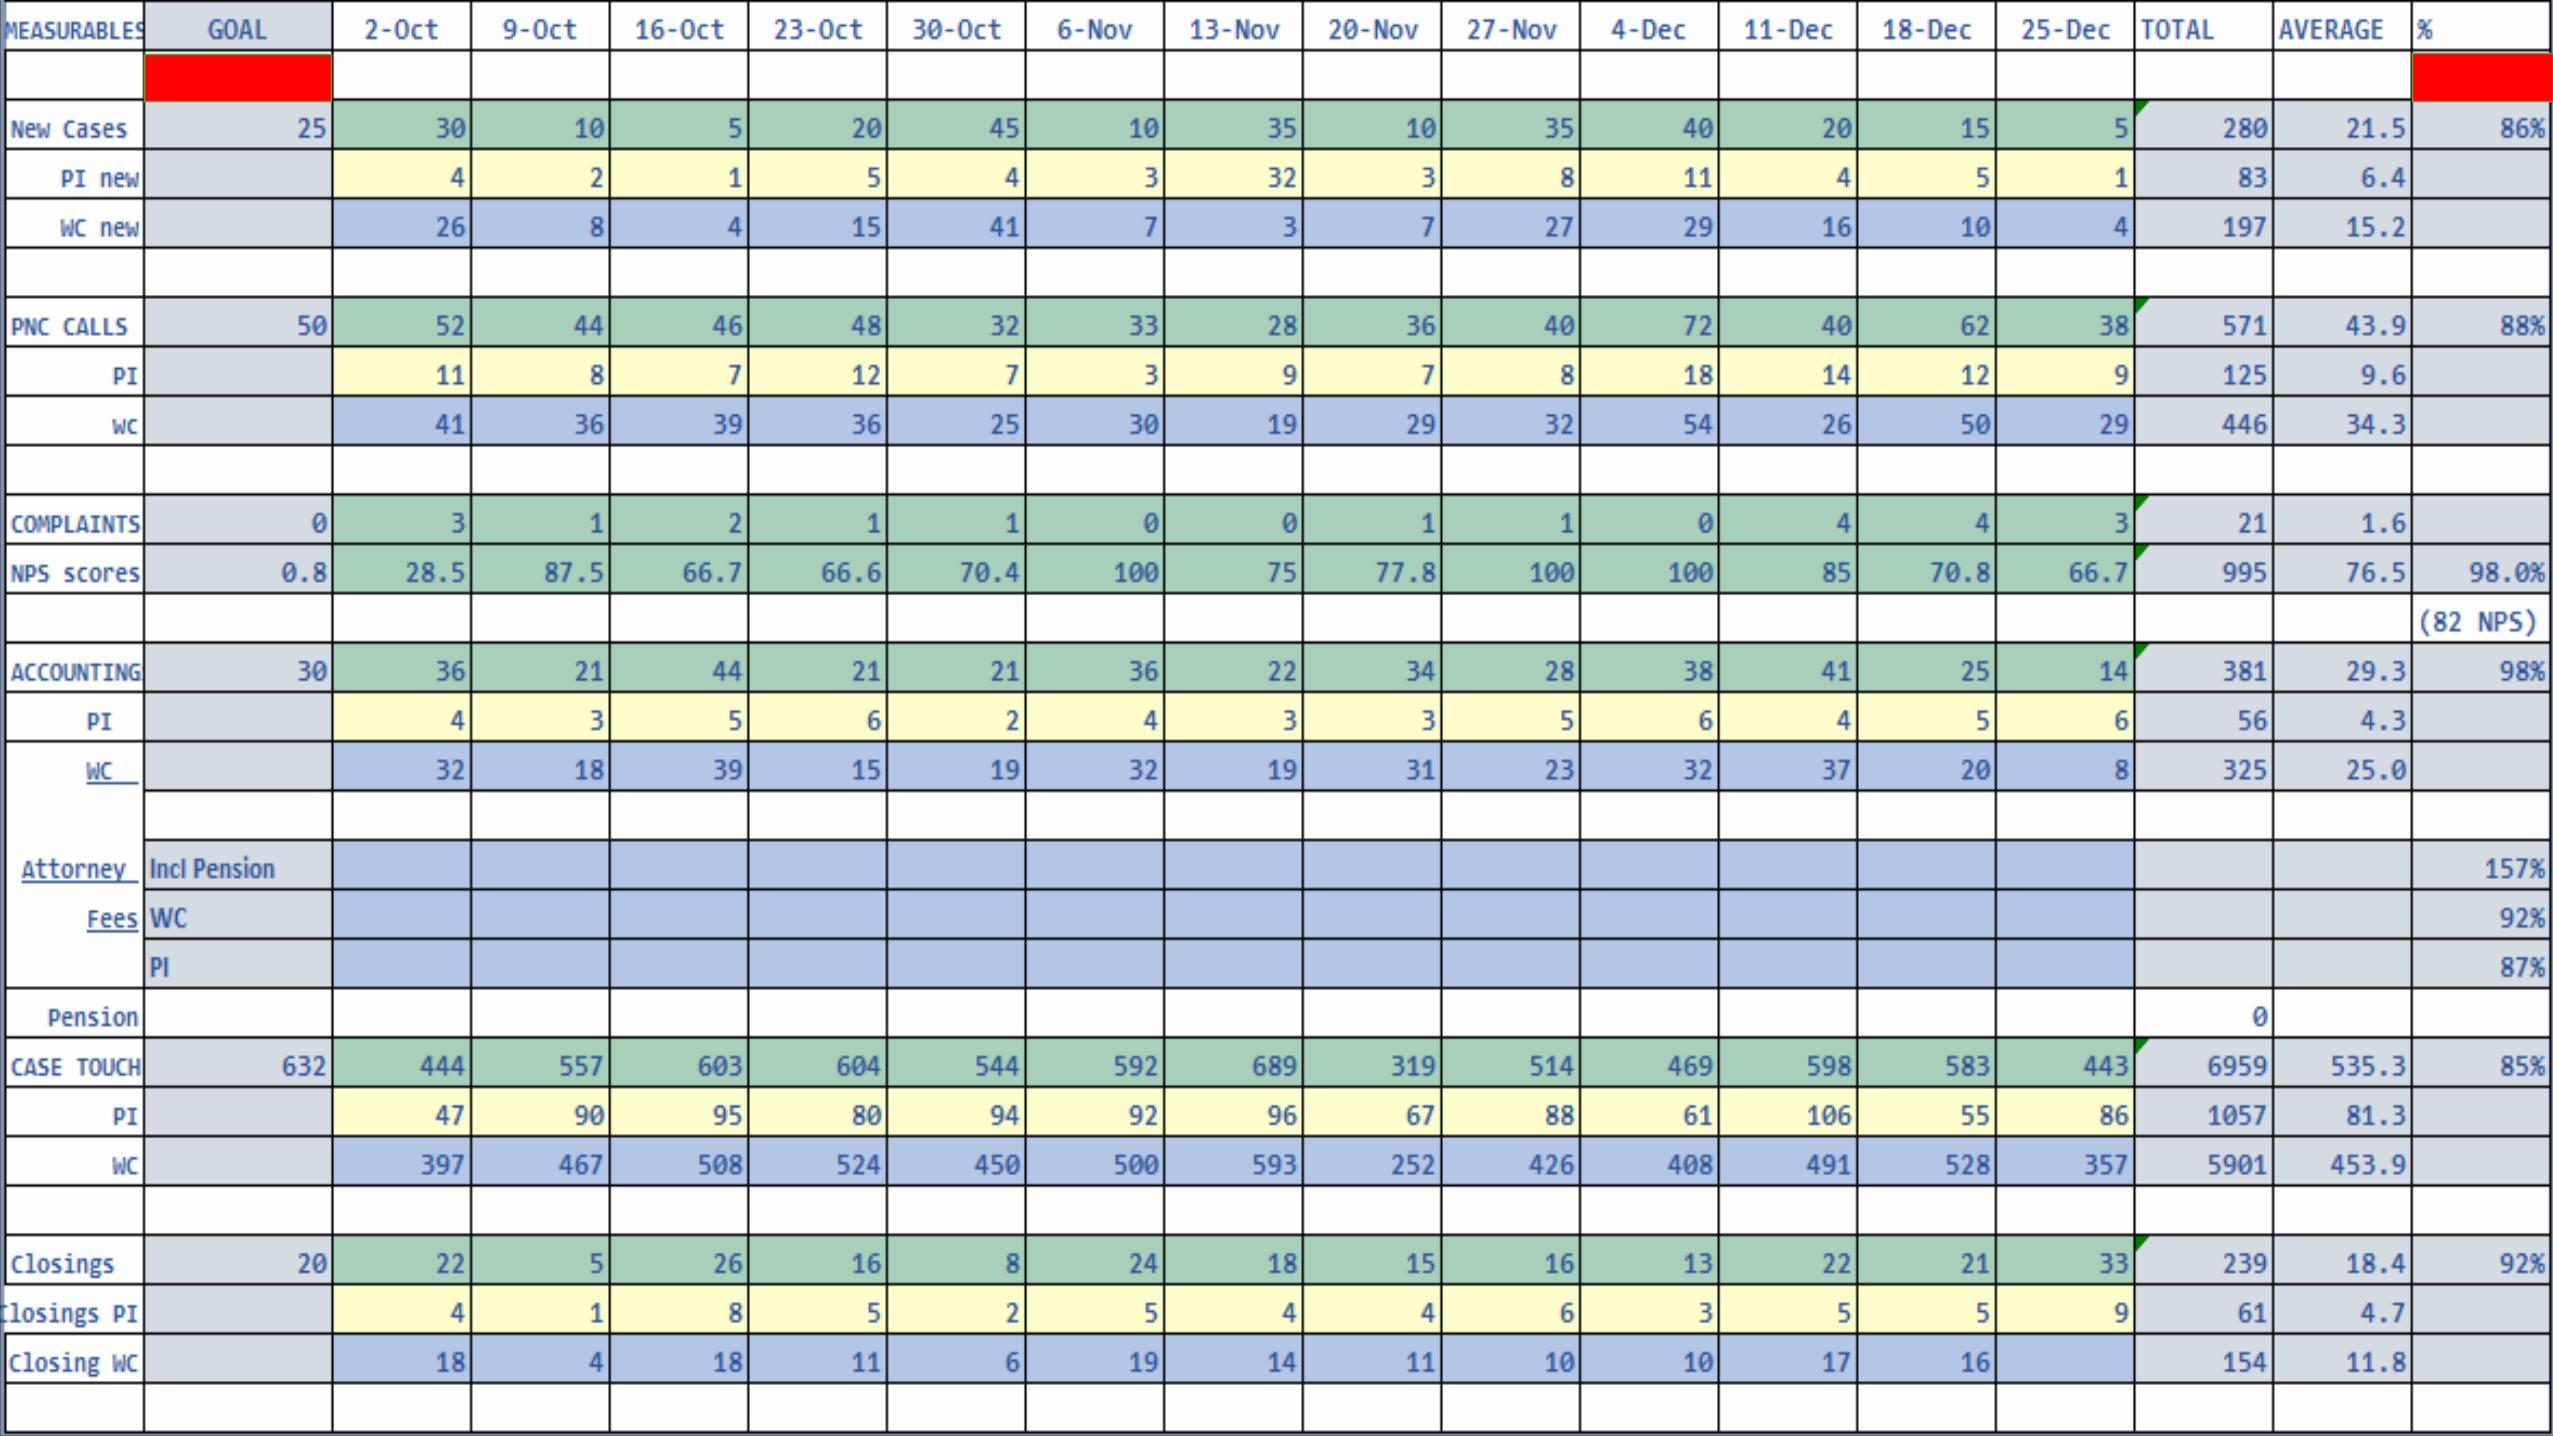
Additional KPIs
Social Media Engagement by Types of Content
Social Media Engagement Rates (Click Through/Open rate)
Potential Client (PNC) Calls by Date
PNC Calls handled per Person
PNC Accepted/Rejected by Week
PNC by Referral Source
PNC Appointment rate & Acceptance of Case Rate
PNC Ratio of Acceptance from In Person Interview
PNC Case Comparison vs Previous Years
Atty Fees per Week & Trend Line by Month/Year
Number of Accountings & Case Closings per Week/Year
Attys Fees by Referral Source (Weekly/Monthly/Annually)
Case Acceptance/Rejection Numbers by Referral Source
Cases Closed & New Cases Accepted per Week per Atty/Paralegal
Case Closing Data
Percentage Closing per Person
Length of Case by Type
Final Case Outcome vs Initial Estimated Value
ROI on Advertising Costs per Concluded Case
ROI on Advertising Sources per Call/Contact

“Its about getting things down
to one number.”


IN
GAME…

What are your…


