Vol. 5, No. 2, October 2010 – March 2011 TECNIA INSTITUTE OF ADVANCED STUDIES TECNIA Journal of Management Studies Assessing Service Quality within Airport Industry An Analysis of Consumer Perceptions and Behaviour with Special Reference to the Car Owners in Tamilnadu A Study on Deflated Average Cost of Four Products of Durgapur Steel Plant to Find Out the Optimum State of Operation Critical Success Factors of TQM in Auto Component Industry A Study of the Impact of Knowledge Management on Organizational Performance A Field Study on Opportunities and Challenges Faced by Organized Retailers in Tri-city Appraisal of NTPC Financial Strenth Transportation Logistics in India: A Critical Look Promotion Practices in Service Industry Faculty Retention – A Strategic Tool for Winning Competitive Edge Hafedh Ibrahim R. Ganapathi, S. Subadra and S. Anbu Malar Dr. Dilip Roy and Paroma Mitra Dr. Lakshmi Jagannathan Dr. Prateek Sharma, Dr. Babita Agarwal and Prof Monika Maheshwari Dr. K.C. Mittal and Anupama Prashar Mritunjay Kumar Pandey and Manoj Kumar Choubey Debomalya Ghose Dr. B. Sudhir and K.Tharaka Rami Reddy Dr B.K. Tripathi, K. Shama Ganjiwale and Dr. Babita Agarwal ISSN – 0975 7104 Regn. No.: DELENG/2006/20585 – (Approved by AICTE, Ministry of HRD, Govt. of India and affiliated to GGS Indraprastha University, Delhi) Institute is rated as "A" Category Best Business School by latest AIMA – Business Standard Publications & Business India survey and Rated amongst Top 100 B-Schools & IT Schools in India by Dalal Street Investment Journal.
Transcript
Vol. 5, No. 2, October 2010 – March 2011
TECNIA INSTITUTE OF ADVANCED STUDIES
TECNIA Journal of Management Studies
Assessing Service Quality within Airport Industry
An Analysis of Consumer Perceptions and Behaviour with Special Reference tothe Car Owners in Tamilnadu
A Study on Deflated Average Cost of Four Products of Durgapur Steel Plant toFind Out the Optimum State of Operation
Critical Success Factors of TQM in Auto Component Industry
A Study of the Impact of Knowledge Management on Organizational Performance
A Field Study on Opportunities and Challenges Faced by OrganizedRetailers in Tri-city
Appraisal of NTPC Financial Strenth
Transportation Logistics in India: A Critical Look
Promotion Practices in Service Industry
Faculty Retention – A Strategic Tool for Winning Competitive Edge
Hafedh Ibrahim
R. Ganapathi, S. Subadra and S. Anbu Malar
Dr. Dilip Roy and Paroma Mitra
Dr. Lakshmi Jagannathan
Dr. Prateek Sharma, Dr. Babita Agarwal and Prof Monika Maheshwari
Dr. K.C. Mittal and Anupama Prashar
Mritunjay Kumar Pandey and Manoj Kumar Choubey
Debomalya Ghose
Dr. B. Sudhir and K.Tharaka Rami Reddy
Dr B.K. Tripathi, K. Shama Ganjiwale and Dr. Babita Agarwal
ISSN – 0975 7104Regn. No.: DELENG/2006/20585
–
(Approved by AICTE, Ministry of HRD, Govt. of India and affiliated to GGS Indraprastha University, Delhi)Institute is rated as "A" Category Best Business School by latest AIMA – Business Standard Publications &
Business India survey and Rated amongst Top 100 B-Schools & IT Schools in India by Dalal Street Investment Journal.
TECNIA INSTITUTE OF ADVANCED STUDIES(Approved by AICTE, Ministry of HRD, Govt. of India and affiliated to GGS Indraprastha University, Delhi)
Institute is rated as "A" Category Best Business School by latest AIMA – Business Standard Publications &Business India survey and Rated amongst Top 100 B-Schools & IT Schools in India by Dalal Street Investment Journal.
A centre of Excellence providing Professionally oriented quality education
in Management, Information Technology and Mass Communication.
THE VISION
THE MISSION
To emerge as one of the world’s leading institute through continuing education to the highest academic
standards, by developing strong industry-academia bond and playing a pioneering role in research and
development, so as to serve society by way of shaping professionals to conquer the present and future
challenges to the socio-economic fabric of our society by dissemination of relevant knowledge through
structured learning system.
To build & nurture a new generation of well-rounded professionals who can work as positive change
agents in the new millennium by helping the Indian industry attain and sustain global leadership. It will be
our endeavour to assimilate and disseminate practical strategies to future professionals and to encourage
their understanding of strategic perception to fulfill the mission of the organization in the fast changing
global business environment and to make a significant contribution by providing an opportunity to the
deserving candidates of society to have world class professional education and to inculcate among them
the feeling of fraternity and patriotism
Tecnia Journal of Management StudiesVol. 5. No. 1, April 2010-September 2010
EDITORIAL ADVISORY BOARD
Prof. Christopher TurnerPro Vice-ChancellorThe University of WinchesterWest Hill, Winchester, U.K.
Prof. R.K. MittalVice-ChancellorTeerthanker Mahaveer University, Moradabad
Prof. Devender K. BanwetProfessor, Department of Management StudiesIndian Institute of Technology, New Delhi.
Prof. G.R. KulkarniFormer Director,Indian Institute of Management, Ahmedabad.
Prof. K.K. UppalFormer Professor, University Business SchoolPunjab University, Chandigarh.
Prof. K.L. JoharFormer Vice ChancellorGuru Jambheswar University, Hisar.
Prof. N.K. JainHead, Department of Management StudiesJamia Millia Islamia University, New Delhi.
Prof. M.P. GuptaFormer Dean, Faculty of Management StudiesUniversity of Delhi, Delhi.
Dr. Arun GoyalJournalist (WTO Expert)Director, Academy of Business Studies, Delhi.
Prof. P.N. GuptaFormer Executive Director,DOEACC Society, New Delhi
Published & Printed by Dr. Nirmal Singh, on Behalf of Tecnia Institute of Advanced Studies. Printed at RakmoPress Pvt. Ltd., C-59, Okhla Industrial Area, Phase-I, New Delhi-110020. Published from Tecnia Institute ofAdvanced Studies, 3 PSP, Institutional Area, Madhuban Chowk, Rohini, Delhi-85.
PATRON
Shri R.K. GuptaChairman,Tecnia Group of Institutions
From The Editor’s DeskFrom The Editor’s DeskFrom The Editor’s DeskFrom The Editor’s DeskFrom The Editor’s Desk
I take this opportunity to thank all contributors and readers for making Tecnia Journal of ManagementStudies an astounding success. The interest of authors in sending their research-based articles forpublication and overwhelming response received from the readers is duly acknowledged. I owe myheartfelt gratitude to all the management institutes for sending us their journals on mutual exchangebasis, and their support to serve you better.
We are happy to launch the ninth issue of our academic journal. The present issue incorporates thefollowing articles:
� Use of Analytical Hierarchical Process Model for Alternative Equipment Selection in SmallManufacturing Enterprise
� Customers’ Perception of Indian Railways (Special Reference to Coimbatore Region)� Optimal Policies for Integrated Inventory System for Deteriorating Items using Quantity
Discount in Price-sensitive Declining Market� A Study to Determine the Potential Antecedents, Types and Consequences of Workaholism
in Medical Professionals� Implications of an Augmented CPFR Model in Supply Chain Management� HRD Climate and Organizational Performance with Focus on Job Satisfaction as a Correlate:
An Exploratory Analysis� Semantic Web: Ontology Based Web� Relationships among Selected Demographic Factors and Employee Satisfaction Level in
Indian BPOs� Women Investors’ Perception Towards Online Trading in Tamil Nadu with Special Reference
to Coimbatore District� Rural Business Management Imperatives for Sustainable Growth� Connective Leadership and Women Entrepreneurs: An Integral Approach� Economic Prospective of Media Management in Reference with Ethics and Market Forces
My thanks to the authors Sutapa Datta , P. Purkayastha, Dr. N.Bharathi, Nita H. Shah , NidhiRaykundaliya, Charu Mohla, Gaurav Aggarwal, Santoshi Sen Gupta, Aayushi Gupta, VidushiSandhir, Dr. A K. Varma, Dr S K Bansal, Ajay Solkhe, Dr. Nirmala Chaudhary, Shikha Singh,Sushma Bahvguna, Dr.V.K Bishnoi, Dr. Siddharatha S Bhardwaj, Ms. Pratibha Bhardwaj Dr. N.Kathirvel, A. Mekala, Rajesh Bajaj, Dr. G.B. Sitaram & Sudhir K. Rinten who have sent theirmanuscripts in time and extended their co-operation particularly in following the AmericanPsychological Association (APA) Style Manual in the references.
I extend my sincere thanks to our Chairman Sh. R. K. Gupta, who has always been a guiding lightand prime inspiration to publish this journal. I am grateful to Dr. A.K. Rathore, Director, for hiscontinuous support and encouragement to bring out the Journal in a proper form. I also appreciateEditorial Committee Members for their assistance help, advice and suggestion in shaping up theJournal. My sincere thanks to our distinguished reviewers and all team members of Tecnia familyfor their untiring efforts and support in bringing out this bi-annual Journal.
I am sure the issue will generate immense interest among corporate practitioners, policy-makers,academicians and students.
Dr. Nirmal Singh
Contents
1. Use of Analytical Hierarchical Process Model for AlternativeEquipment Selection in Small Manufacturing Enterprise ............................................ 1
Sutapa Datta, P. Purkayastha
2. Customers’ Perception of Indian Railways(Special Reference to Coimbatore Region) ....................................................................... 6
Dr. N. Bharathi
3. Optimal Policies for Integrated Inventory System for DeterioratingItems using Quantity Discount in Price-sensitive Declining Market ..................... 15
Nita H. Shah, Nidhi Raykundaliya
4. A Study to Determine the Potential Antecedents, Types andConsequences of Workaholism in Medical Professionals .......................................... 26
Charu Mohla, Gaurav Aggarwal
5. Implications of an Augmented CPFR Model in Supply Chain Management ...... 32Dr. A.K. Varma, Dr S K Bansal
6. HRD Climate and Organizational Performance with Focus onJob Satisfaction as a Correlate: An Exploratory Analysis........................................... 47
Ajay Solkhe, Dr. Nirmala Chaudhary
7. Semantic Web: Ontology Based Web ............................................................................... 58Shikha Singh, Sushma Bahvguna
8. Relationships among Selected Demographic Factors and EmployeeSatisfaction Level in Indian BPOs .................................................................................... 69
Santoshi Sen Gupta, Aayushi Gupta, Vidushi Sandhir
9. Women Investors’ Perception Towards Online Trading in Tamil Naduwith Special Reference to Coimbatore District ............................................................. 75Dr. N. Kathirvel & A. Mekala
10. Rural Business Management Imperatives for Sustainable Growth .......................... 89Rajesh Bajaj
11. Connective Leadership and Women Entrepreneurs: An Integral Approach ......... 93Dr. G.B. Sitaram
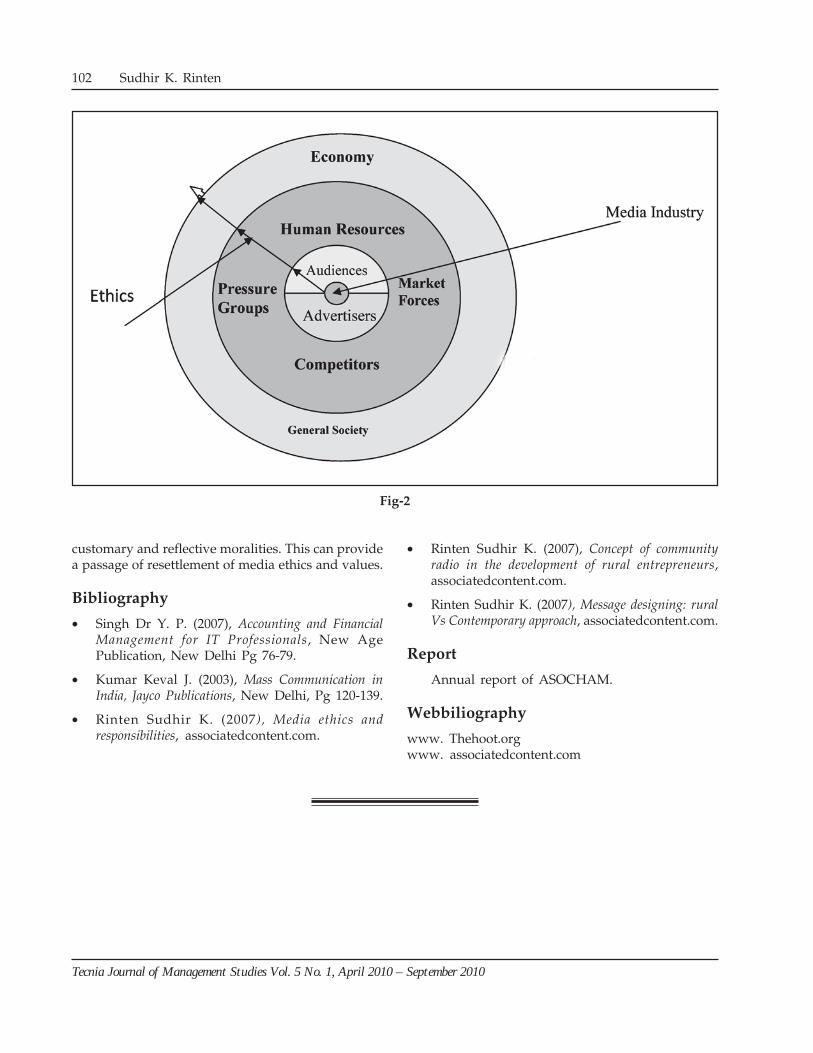
12. Economic Prospective of Media Management in Reference withEthics and Market Forces ..................................................................................................... 98
Sudhir K. Rinten
General Information
� Tecnia Journal of Management Studies is published half-yearly. All editorial andadministrative correspondence for publication should be addressed to the Editor, TecniaInstitute of Advanced Studies, 3 PSP, Institutional Area, Madhuban Chowk, Rohini,Delhi-110085.
� The received articles for publication are screened by the Evaluation Board for approvaland only the selected articles are published. Further information on the same is availablein the “Guidelines for Contributors”.
� Annual subscription details with the format for obtaining the journal are given separatelyand the interested persons may avail the same accordingly.
� Views expressed in the articles are those of the respective authors. Tecnia Journal ofManagement Studies, its Editorial Board, Editor and Publisher (Tecnia Institute ofAdvanced Studies) disclaim the responsibility and liability for any statement of fact oropinion made by the contributors. However, effort is made to acknowledge sourcematerial relied upon or referred to, but Tecnia Journal of Management Studies does notaccept any responsibility for any inadvertent errors & omissions.
Tecnia Journal of Management Studies Vol. 5 No. 1, April 2010 – September 2010
1
Introduction
We illustrate the application of the AnalyticHierarchical Process (AHP) for a Multi-Criteria
Decision Model the best recommended DoughKneader equipment from among alternatives whereManagement is considering installation a new systemof Kneaders for their Savoury product line.
The Analytical Hierarchical Method is being usedsince this allows weighting different physicalcharacteristics of the system as well as their suitabilitycharacteristics as far as consideration has been madeon their appropriateness of their applications inmanufacture of Patties, Burgers and other additionalSavoury items.
This Multi-Criteria Decision Making Aid wasintroduced by Saaty (Ref. Operational Research, 7th
Ed., Handy Taha, Prentice Hall) and has also founduse in various industrial problem solutions designedtowards making similar optimal choice decisions. Themethodology is based on the following systematicapproach.
Methodology
The problem is Multi-Level or Multi-Echelon instructure. Therefore a tree structure decision theoretic
solution approach can be applied by rolling-back toa final optimal solution (in this case the appropriateKneader Machine to be recommended for operationsusage).
The following stages are involved in the use ofthis method for the optimal Kneader choice:
(i) Structuring the choice matrix from managementrepresentatives well versed in process technologyof Bakery line manufacturing, maintenanceexperts and with operations managementinvolvement in Projects, Production, Packing,Marketing and Quality Management Issues.
(ii) The favourable choice agreement is given by achoice matrix
μ1 μ2 μ3μ1 ⎛ 1 2 3 ⎞μ2 ⎜ - 1 - ⎟μ3 ⎝ - - 1 ⎠
wherein pair-wise choice of selection of criteriais assigned where μ1, μ2 and μ3 = alternativechoice criteria relating to some physical property.In the above example μ2 is 2 times as much inpreference to μ1 and μ3 is 3 times much inpreference to μ1.
USE OF ANALYTICAL HIERARCHICAL PROCESS MODEL FOR ALTERNATIVE
EQUIPMENT SELECTION IN SMALL MANUFACTURING ENTERPRISE
Abstract: The study describes the use of a popular multi-criteria decisionmodel AHP in deciding upon the selected supplier and suitable modelto be used from among alternative offers for a Dough Kneader used bya Small Manufacturing Enterprise (A Bakery Food Manufacturer). Whilean exhaustive use of the AHP model has been made as a basis of selectionprocedure, we may extend this method to enhance its accuracy with aidof Grey loading analysis.
Key Words: Alternative equipment selection, Small manufacturingenterprise, AHP Application
Sutapa Datta*
P. Purkayastha**
*Sutapa Datta, Research Associate IISWBM, Kolkata; [email protected]**A. Purkayastha, Dean & Professor IISWBM, Kolkata; [email protected]
Tecnia Journal of Management Studies Vol. 5 No. 1, April 2010 – September 2010
2
(iii) The conversion of choice matrix to a normalizedmatrix wherein after completion of filling up ofthe above matrix components. This is generatedby the reciprocals (each element aij = 1/aji wherei = row of choice matrix and j = column of choicematrix) as proposed by Saaty.
(iv) The normalized weights of choices μ1, μ2 and μ3respectively are given by normalized weights forthe three characteristics under consideration i.e. — — —(ω1, ω2 & ω3).
(v) Thereafter Consistency of Choice Matrix isevaluated through assessment of two propertiesConsistency Index (CI) and Random ConsistencyIndex (RI).
(vi) For this we use the model
— —[A]* ω = nmax * ω
nmax – n 1.98(n – 2)where, CI = ———— and RI = —————
n – 1 n
RI (random consistency index is relatedimperically to a large sample of randomlygenerated choice matrices [A])
(vii) Thereafter the Consistency Ratio CR is obtainedas
CICR = —
RI
If CR ≤ 0.1, then the inconsistencies of the choicematrix is acceptable. Otherwise a new choiceanalysis with corresponding Choice Matrixstructure is to be generated and the analysisrepeated till the Consistency Ratio Condition issatisfied.
Analysis of Problem
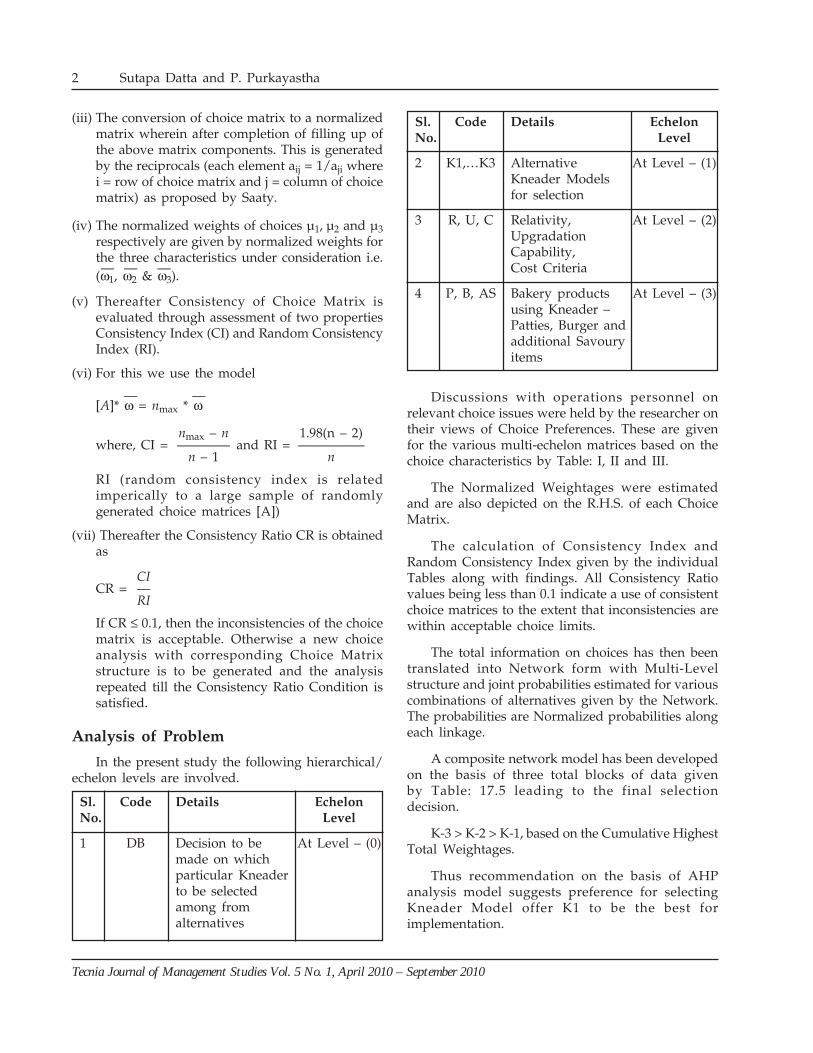
In the present study the following hierarchical/echelon levels are involved.
Sl. Code Details EchelonNo. Level
1 DB Decision to be At Level – (0)made on whichparticular Kneaderto be selectedamong fromalternatives
Sl. Code Details EchelonNo. Level
2 K1,…K3 Alternative At Level – (1)Kneader Modelsfor selection
3 R, U, C Relativity, At Level – (2)UpgradationCapability,Cost Criteria
4 P, B, AS Bakery products At Level – (3)using Kneader –Patties, Burger andadditional Savouryitems
Discussions with operations personnel onrelevant choice issues were held by the researcher ontheir views of Choice Preferences. These are givenfor the various multi-echelon matrices based on thechoice characteristics by Table: I, II and III.
The Normalized Weightages were estimatedand are also depicted on the R.H.S. of each ChoiceMatrix.
The calculation of Consistency Index andRandom Consistency Index given by the individualTables along with findings. All Consistency Ratiovalues being less than 0.1 indicate a use of consistentchoice matrices to the extent that inconsistencies arewithin acceptable choice limits.
The total information on choices has then beentranslated into Network form with Multi-Levelstructure and joint probabilities estimated for variouscombinations of alternatives given by the Network.The probabilities are Normalized probabilities alongeach linkage.
A composite network model has been developedon the basis of three total blocks of data givenby Table: 17.5 leading to the final selectiondecision.
K-3 > K-2 > K-1, based on the Cumulative HighestTotal Weightages.
Thus recommendation on the basis of AHPanalysis model suggests preference for selectingKneader Model offer K1 to be the best forimplementation.
Sutapa Datta and P. Purkayastha
Tecnia Journal of Management Studies Vol. 5 No. 1, April 2010 – September 2010
3
Calculation for Choice Matrix Parameters;Consistency Index, Random ConsistencyIndex and Consistency Ratio
Bp = (0.29*0.3*0.54) + (0.29*0.16*0.54) + (0.29*0.54*0.54) = 0.1566BL–3
ASp = (0.57*0.3*0.54) + (0.57*0.16*0.54) + (0.57*0.54*0.54) = 0.3078BL–3
P B AS3.9 K-1 ⇒ p + p + p = 0.16BL–1 BL–1 BL–1
P B ASK-2 ⇒ p + p + p = 0.3BL–2 BL–2 BL–2
P B ASK-3 ⇒ p + p + p = 0.54BL–3 BL–3 BL–3 1.00
Observation
The calculation of Consistency Index andRandom Consistency Index given by the individual
Tecnia Journal of Management Studies Vol. 5 No. 1, April 2010 – September 2010
5
Tables along with findings. All Consistency RatioValues being less than 0.1 indicate a use of ConsistentChoice Matrices to the extent that inconsistencies arewithin acceptable choice limits.
The total information on choices has beentranslated into Network from with Multi-levelstructure and joint probabilities estimated for variouscombinations of alternatives given by the Network.The probabilities are Normalized probabilities alongeach linkage.
A composite network model has been developedon the basis of three total blocks of data given byTables leading to the final selection decision. K-3>K-2>K-1, based on the cumulative highest totalweightages.
Conclusion
Thus recommendation on the basis of AHPanalysis model suggests preference for selectingKneader model offer 1 to be the best forimplementation.
References
• Oliver, Gitam Journal of Management, vol.-7, no.-3, July-Sep, 2009
• Ellram & Cooper, International Journal ofLogistics Management 1(2) (1990)
• Babu, Lal., Vrat, Prem and Sushil (1999), “InSupply Chain Management for GlobalCompetitiveness”, 1st ed. B. S. Sahay (eds.), NewDelhi: Mcmillan India Ltd., pp. 1040-1059.
• Christopher M., ‘Logistics & Supply ChainManagement – Strategies for Reducing Cost &Improving Service’, Pitman Publication (1998)
• Ellram, L.M. and Cooper, C. M.(1990), “SupplyChain Management, Partnerships and the ShipperThird Party Relationship”, International Journal ofLogistics Management, 1(2):1-10.
• Sharman G. (1999), ‘Supply Chain Management –Challenges for Supply Chain of the Future’, HelsinkiUniversity of Technology, Proceedings
• Seturam, Shobha, 1st Ed(1999) ‘Supply ChainManagement for Global Competitiveness’ McMillanIndia Ltd., New Delhi: Mcmillan India Ltd., pp.
Use of Analytical Hierarchical Process Model for AlternativeEquipment Selection in Small Manufacturing Enterprise
77-93.
• Ulrich, William, (2004), “Revolutionary SupplyChain Management through Holistic GovernanceStructures, ICFAI Journal of Supply ChainManagement, 1(3) pp.9-16.
• Towill, Denis R. (1997), “The Seamless Supply Chain– The Predator’s Strategic Advantages”,International Journal of Technology Management,Special issue on Strategic Cost Management,13(1); pp.37-56.
• Lakshaminarsimha,(2004), “Article on ‘Impact ofSupply Chain Management in Select Countries” – AReview, ICFAI Journal of OperationsManagement, III(4), November 2004.
• Malhotra, Arvind; Gossain, Sanjay and El Sawy,Omar A. (2005), ‘Absorptive Capacity Considerationin Supply Chains: Gearing for Partner-enabled MarketKnowledge Creation’, MIS Quarterly, 29(1), pp.145-187.
• Gujar, A., Mophare, A. V., Deomore, D. N. andKhodke, P.M.(2007), ‘System Dynamics Approachfor strategic Supply Chain Management’, ICFAIJournal of Supply Chain Management, IV(1)pp.40-48.
• Mohan A., (2007)‘Risk Control in Supply Chain &Measures for Impact Mitigation’ ICFAI Journal ofSupply Chain Management, vol. – IV, no.-1, March2007, pp. 82-89.
• Gokulnananda et al. (2007), ‘Supply Chain RedesignStrategies through Identification of Uncertainty’,ICFAI Journal of Supply Chain Management, vol.– IV, no.-1, March 2007, pp. 73-81.
Tecnia Journal of Management Studies Vol. 5 No. 1, April 2010 – September 2010
6
CUSTOMERS’ PERCEPTION OF INDIAN RAILWAYS
(SPECIAL REFERENCE TO COIMBATORE REGION)
Abstract: After 1991, the reforms process has gathered some momentumand several important decisions have been taken by the Central andState governments. There are indications that political support fordeepening the economic reform process is gradually increasing. Thegeneral perception is that policy makers realize that reform is an essentialpre-requisite for the economic development of India at the targeted GDPgrowth rate of 7-8 percent per year. With the economy on track for aplanned growth at 7-8 per year, the demand for freight and passengertransport is expected to grow at around 10 percent a year. At present,however, India’s transport system, especially surface transport, is highlycongested, and the sector performance is poor and inefficient byinternational standards. One way is to improve the conditions of serviceto satisfy the expectations of the customers. For this it is necessary toknow their attitude towards the present conditions of services providedby the Indian railways. Hence, the present study on attitude towardsIndian railways.
N. Bharathi*
*Dr. N. Bharathi, Assistant Professor, Department of Commerce, Delhi College of Arts and Commerce (University of Delhi), NetajiNagar, New Delhi-110023 Mobile: 09971419099 E-mail: [email protected] / [email protected]
Introduction
The economic growth of a country mainly dependson the infrastructure facilities available. Transport
facility is an important aspect of infrastructurefacilitating mobility of goods and people from oneplace to another place. To keep pace with thechanging business paradigms along with its growingneeds of the hour ensuring availability of sufficienttransport facility is necessary. In this concept, therailways are remained as energy efficient transportmode ideally suited for long distance travel as wellas perfect for bulk mode of transport.
The developing countries like India with thickpopulation, Railway transport plays an important rolein the development of the economy. The country’seconomy would be tampered if the railways werenot in a position to provide transportation capacityand quality of service required by the growingtransport market amidst the globalized scenario. Thepresent Indian railways are characterized by
challenges of market changes and increasing demandin capacity Moreover, competition is a key factor inachieving improved productivity, lower prices andhigher quality of services and products that respondto the changing needs of the customers.
A certain degree of competition exists betweenrail and road transport, but the level of competitionvaries widely with volume, distance and customerneeds regarding transit time, reliability of service andvalue of goods Indian railways can provide thenecessary customers focus and compete effectivelywith road provided its reliability, productivity andefficiency are enhanced. So, it is imperative for Indianrailways to develop innovative approach byconsidering customer focus and competition.
Statement of the Problem
Indian railways is one of the largest and busiestrail network in the world. It is an important form ofpublic transportation in the country. Its operations
Tecnia Journal of Management Studies Vol. 5 No. 1, April 2010 – September 2010
7
are characterized by a dominance of traffic and longhaul of bulk commodities. Since their inception 155years ago, the railways in India have beencontributing significant share to the growth of Indianeconomy. The social and economic development ofthe country also depends to a large extent uponIndian railways and for future development.
Indian railways have interesting historicalturnaround in its fortunes in recent years largely dueto the responsiveness of the organization to alignitself to the strategy of striking unit cost and highersocial obligations as a common carrier by providingaffordable transport service to the masses.
Apart from this, there is also intense competitionbetween railways and roads with substantialinvestment to improve the highway network in India.For the most part, the highways being improvedparallel to the high density railway routes. In additionlarger capacity and modern technology trucks thatoffer advantage of high speed, reliability and lowerunit cost in its own way. Thus, the railways need tosubstantially improve the quality of service,customers focus and service profile to meet thechallenges of more intense competition in thetransport market.
In view of the above, the Indian railways areexpected to provide safe, fast and comfortable serviceat reasonable prices and good behavior towardscustomers, it should also focus towards amenitiesprovided and the service profile that meets changingcustomer’s requirements.
As the market needs change and competitionbecomes more intense, Indian railway has to reinventitself to continue playing an important role in theIndian transport market. Hence, the Indian railwaysare expected to change its insides aiming provisionof high quality service in line with the changingatmosphere and hectic competitions and maintainand increase the share through market research.
So, a study on the attitude of the customerstowards Indian railways about the services and otheramenities provided is felt, which resulted into thepresent research work with the following objectives.
Objectives of the Study
1. To analyze the attitude of the passengers towardsfacilities and convenience provided ensuringsophisticated service.
2. To identify the factors that influences the likingof the railway mode of the transport.
3. To suggest measures for improvement of theconditions of service in particular to theCoimbatore junction and Indian railways ingeneral.
Sampling and Data Collections
The present study analysis the attitude of thepassengers. The study depended on primary data.The data was collected from the passengers who wantto board or otherwise in Coimbatore junction.Coimbatore is an industrial city and an educationhub and above all an upcoming IT centre. The datawere obtained from the respondents by administeringa questionnaire to elicit information on their socio-economic profile and their attitude towards theservices provided by the Indian railways. Therespondents include all sections of people who usedrailway service for personal purpose, official purposeor other purposes. The questionnaires are distributedto the respondents selected using convenientsampling by explaining the purpose of the study.
The collected data were statistically analyzed inorder to ensure that the objectives of the study areachieved.
Data Covered
The issues covered in the study include theopinion recovery of rail passengers who on-board /off-board the trains are: profile of passengers, opinionof passengers on pantry car and catering facilityprovided by Southern railways, proper securityarrangements given by the railway police force,passengers’ comfort inside the compartments,excellent layout of platforms for restaurants, tea stalls,cool bars etc, amenities provided by the railways,concession given to various sections of the society,cleanliness of passengers waiting halls, platforms,compartments etc, arrangements of medical facilitiesfor passengers provided by the railways, reservationfacilities for passengers and approachability ofrailways staff including TTR. The data on thesevariables were collected using five point scale rangingfrom highly satisfied, satisfied, neutral, dissatisfiedand highly dissatisfied.
Framework of Analysis
In order to achieve the objectives of the study an
Customers’ Perception of Indian Railways (Special Reference to Coimbatore Region)
Tecnia Journal of Management Studies Vol. 5 No. 1, April 2010 – September 2010
8
analysis is made to understand the opinion of thepassengers on various amenities. The statistical toolsused are: Factor analysis and multiple regression.
I. Factor Analysis: This helps to reduce theproposed factors into few, which represent asignificant amount of the original one.
II. Multiple Regression: This helps to identify thesignificant factors which determine the attitudetowards railway customers’.
Survey Results
The socio economic profiles of the respondentsare shown in the following table:
It is understood from the table that 40% of therespondents are belonging to the age group of 30-40years, 30.4% of the respondents are in the age groupof 20-30 years, 28.4% of the respondents are in theage group of above 40 years and others are less than20 years.
The above table shows that 44.4% of therespondents are earning a monthly income of aboveRs.15000, 22.8% earn Rs.10000 to Rs.15000, 19% ofthem are earning between below Rs.5000 and theremaining respondents belong to the income groupof Rs.5000 to Rs.10000.
Regarding the occupation of respondents isconcerned, 36.8% of the respondents are working inprivate organizations, 26% are doing business, 16%are government employees, 12.8% are students andthe remaining are professionals like doctors, lawyersetc.
It is observed regarding the frequency of travel,48.8% of the respondents travel rarely, 21% of therespondents are traveling monthly once, 11.6% of therespondents travel once in fort night, 10.8% travelweekly once and others travel daily.
Customers’ Attitude Towards IndianRailway
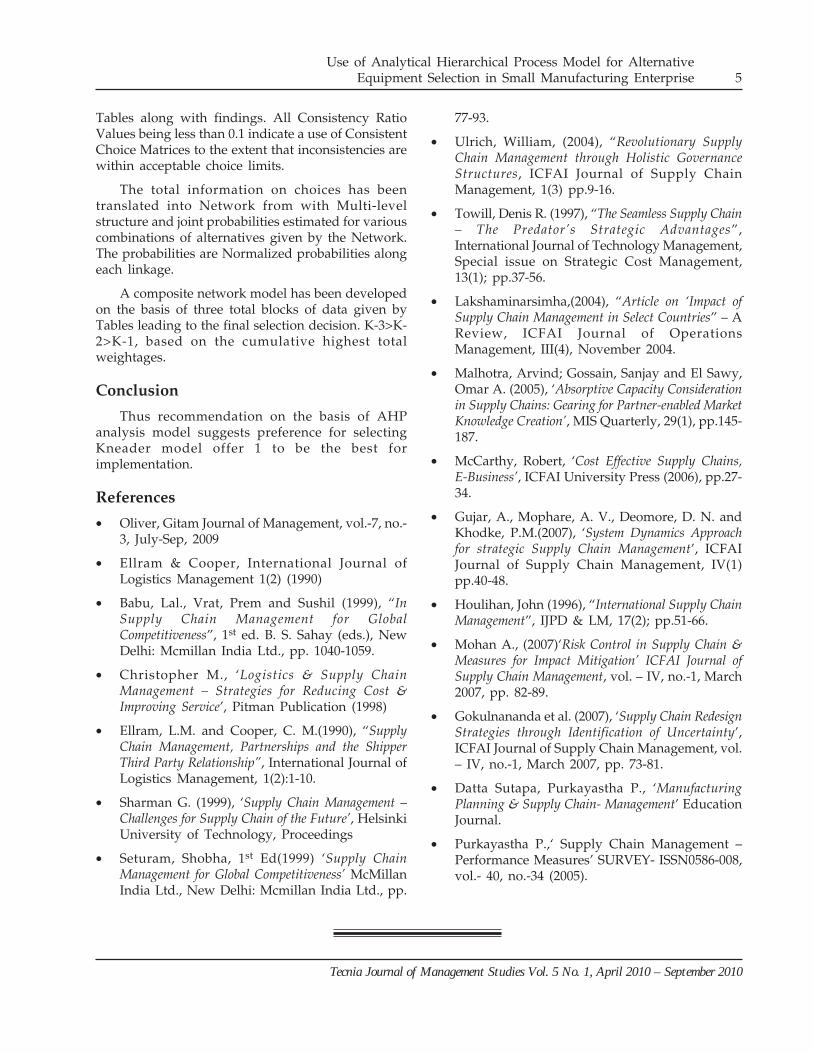
In the changing scenario, the competitive strengthis to be constantly improved to enable a firm toprovide product / service in the market with qualityat cheaper price than the competitor. Hence, thepassengers’ attitude is analyzed and the results aregiven in table 2 below:
It is understood from the above table that 36.4%and 20.4% of the respondents are satisfied and highlysatisfied to the pantry car and catering facilitiesprovided by southern railway and 1.2% and 17.2%of the respondents are highly dissatisfied anddissatisfied with the facility.
As far as proper security arrangement given bythe railway police force, 26% and 5.2% are satisfiedand highly satisfied respectively and 16.4% and 2.4%are dissatisfied and highly dissatisfied.
56.8% and 22.4% of the respondents are satisfiedand highly satisfied respectively to the fact thatpassengers are carryout inside the compartment andonly 3.2% of the respondents dissatisfied to the fact.
Regarding excellent layout of platforms forrestaurant, tea stalls, cool bars etc. 22% and 6.8% of
Dr. N. Bharathi
Table 1: Socio Economic Profile of the Respondents
Variable Profile No. of Per-Respon- cent-
dents age
Gender Male 194 77.6Female 56 22.4
Age Less than 20 years 3 1.220-30 years 76 30.430-40 years 100 40.0Above 40 years 71 28.4
It is observed from the above table that 77.6% ofthe respondents are male and the remaining 22.4%are female.
Tecnia Journal of Management Studies Vol. 5 No. 1, April 2010 – September 2010
9
the respondents are satisfied and highly satisfied and21.2% and 3.6% of the respondents are dissatisfiedand highly dissatisfied to the fact.
It is a telling fact that 40% and another 43.2% ofthe respondents have been satisfied and highlysatisfied to the various amenities provided by therailways.
As far as the concession given to various sectionsof the society 41.2% each of the respondents havebeen satisfied and highly satisfied.
48.8% and 26.8% of the respondents respectivelysatisfied and highly satisfied to the fact of cleanliness
of the waiting halls, platforms, compartments etc19.6% and 3.2% of the respondents are satisfied andhighly satisfied to the variable the medical facilitiesprovided by the railway and 22.4% and 5.6% of thepassengers are dissatisfied and highly dissatisfied tothe fact.
As far as reservation facilities are concerned,49.2% and 6.8% of the respondents have satisfactionand high level of satisfaction with the facility.
51.6% and 28.4% of the respondents are satisfiedand highly satisfied with approachability of therailway staff including TTR.
Customers’ Perception of Indian Railways (Special Reference to Coimbatore Region)
Table 2: Customers’ Attitude towards of Indian Railway
Tecnia Journal of Management Studies Vol. 5 No. 1, April 2010 – September 2010
10
Factor Analysis
The factor analysis is a powerful and usefulstatistical as an analytical approach to determine theunderlying forces or factors among a large numberof interdependent variable or measures. This methodextracts common factor variables from a set ofobservations and groups the number of variables intoa smaller set of uncorrelated factors which tell whatvariables belong together or which one virtuallymeasure the same things.
This technique is used to identify the factorsaffecting passenger attitude towards southernrailways from 250 respondents in the Coimbatoreregion. As a first step, the data are tested to knowthe whether it suits factor analysis. The followingsteps have been taken for the purpose:
• The correlation matrices are computed andexamined. It reveals that there are enoughcorrelations to go ahead with factor analysis.
• Anti-image correlations were computed.These showed that partial correlations werelow, indicating that true factors existed inthe data.
• Kaiser-Meyer-Olkin Measure of SamplingAdequacy (MSA) for individual variables arestudied from the diagonal of partialcorrelation matrix (Table 3). It is found to besufficiently high for all variables. Themeasure can be interpreted with thefollowing guidelines: 0.90 or above,marvelous: 0.80 or above, meritorious; 0.70or above, middling; 0.60 or above, mediocre;0.50 or above miserable, and below 0.50,unacceptable.
• To test the sampling adequacy, Kaiser-Meyer-Olkin measure of sampling adequacy iscomputed, which is found to be 0.638. It isindicated that the sample is good enough forthe study.
• The overall significance of correlation matrixis tested with the Bartlett test of Sphericityfor attitude of railway passenger (approx. chi-square = 264.830, which is significant at 0.000)as well as support for the validity of the factoranalysis of the data set.
Hence, all these standards indicated that the datais suitable for factor analysis. For extracting factorswe have employed ‘principal components analysis’and ‘latent root criterion and rotation method-orthogonal rotation with Varimax’ was also applied.As per the latent root criterion, only the factors havinglatent roots or Eigen values greater than 1 areconsidered significant; and all the other factors withlatent roots less than 1 are considered insignificantand disregarded.
Identification of Factors Affecting Attitudeof Railway Passenger
After the standards indicated that the data aresuitable for factor analysis, principal componentsanalysis was employed for extracting the data, whichallowed determining the factors underlying therelationship between a number of variables. The totalvariable explained suggests that it extracts one factoraccounts for 58.948 percent of the variance of therelationship between variables (Table 4).
Loading on factors can be positive or negative. Anegative loading indicates that this variable has aninverse relationship with the rest of the functions.However, Comrey (1973: 1346) suggested thatanything above 0.44 could be considered salient, withincreased loading becoming more vital determiningthe factor. All the loading in the present research arepositive (Table 5).
Rotation is necessary when extraction techniquesuggests that there are two or more function. Therotation of factors is designed to give an idea of howthe factors unlimitedly extracted differ from eachother and to provide a clear picture of which itemloads on which factor.
There are only four factors, each having Eigenvalue exceeding one. The Eigen values for four factorswere 2.321, 1.273, 1.171 and 1.130 respectively (Table4). The percentage of total variance is used as anindex to determine how well the total factor solutionaccounts for what. The variable together representindex for the present solution accounts for 58.948percent of the total variations for choosing a
Bartlett’s Test Approx.of Sphericity Chi-Square 264.830
Df 45
Sig. 0.000
Tecnia Journal of Management Studies Vol. 5 No. 1, April 2010 – September 2010
11
passenger attitude. It is pretty good extraction as itcan economies the number of factors (from ten it hasreduced to four factors) while we have lost 41.052percent information content. The percentage ofvariance explained by factor one to four factorsaffecting the attitude towards railways are 23.214,12.726, 11.708 and 11.350 respectively (Table 4). Thetable 5 tells as that after four factors are extracted isretained, the communality is 0.544 for variable 1, 0.402for variable 2, and so on. It means that 54 percent ofthe variance of variable 1 is being accepted by thefour extracted factors together. The proportion ofvariance on any one of the original variables, whichis being captured by the extracted factor, is knownas communality (Nargudkar 2002).
Large communalities indicate that a large numberof variance has been accounted for by the factorsolution. Varimax rotated factor analytic results forfactor determining the attitude of the passengers isshown in table 6.
The four factors extracted have been shown intable 6 below:
Customers’ Perception of Indian Railways (Special Reference to Coimbatore Region)
Table 4: Extraction Method: Principal Component Analysis
Total Variance Explained
Compo- Initial Eigen values Extraction Sums of Rotation Sums ofnent Squared Loadings Squared Loadings
Total % of Cumulative Total % of Cumulative Total % of CumulativeVariance % Variance % Variance %
Tecnia Journal of Management Studies Vol. 5 No. 1, April 2010 – September 2010
12
Factor 1: Amenities and Safety Measures
This factor describes the amenities and safetymeasures provided by railways. It is the most crucialfactor which explains 23.214 of the variations andincludes six variables S2, S3, S4, S8, S10 and S5.
Factor 2: Facilities for Reservation
It is the second important factor which coversadequacy of facilities for reservations.
Factor 3: Cleanliness
It is identified as cleanliness expected by thepassengers in the waiting halls, platforms andcompartments.
Factor 4: Concession and Catering Facility
It is last factor among the four factors identifiedand named as concession and catering facilities whichincludes pantry car and catering facilities andconcession given to various relations of the society.
Regression Analysis
Multiple regressions are basically a predictivetool. The result is obtained by analyzing a set ofindependent variables to predict a dependentvariable. The general equation for a multipleregression can be written as bellow:
Y= B0 + B1 X1 + B2 X2 + B3 X3 + ….. + Bn Xn +E, Where B0 = A constant, the value of Y when all Xvalues are zero. B1 = The slope of the regressionsurface of the response surface, and B represents theregression coefficient associated with each X1 and E= An error term, normally distributed about a mean0. For the purpose of computation, E is assumed tobe 0.
The regression coefficient can either be stated inraw score units (the actual X values) or asstandardized coefficients. In either case, the value ofregression coefficient states the amount that Y varieswith each unit change of the associated X variables,when the effects of all other X variables are beingheld constant. When the regression coefficient are
Dr. N. Bharathi
Table 6: Name of the Factors
Naming Name of the Dimensions Label Name of the Problems Factorof Loading Loading
Factors
F1 S2 Adequacy security arrangement 0.541
S3 Passengers’ comfort inside the train 0.653
Amenities and S4 Excellent lay out of platforms for 0.539Safety Measures Restaurant, tea stalls, cools Bars etc
S8 Provisions of medical facilities 0.689
S10 Approachability of railway staff 0.529
S5 Amenities provided 0.511
F2 Facility for Reservation S9 Adequacy of facilities for reservation 0.723
F3 Cleanliness S7 Cleanliness for waiting halls, platforms, 0.646comportment, etc.
F4 Concession and S1 Pantry car and catering facilities 0.587
Catering Facility S6 Concession given to various sections 0.731of society
Tecnia Journal of Management Studies Vol. 5 No. 1, April 2010 – September 2010
13
standardized, they are called beta weights (B), andtheir values indicate the relative importance of theassociated X values, particularly are unrelated.
The above equation can be built either with allvariables, specific combinations or a selected methodthat sequentially adds or removes variables. Forwardselection starts with the constant and adds variablesthat results in the largest R square increase. Backwardelimination begins with a model containing allindependent variables and remove the variableschanges R square the least. The independent variablethat contributes the most in explaining the dependentvariable is added first. Subsequent variables areincluded based on the incremental contribution overthe first variables and whether they meet the criterionfor entering the equation. Care should be taken toensure that the independent variable must not becorrelated among themselves, as it highly affects theoverall result. This situation is called multicollinearty.
The factor analysis shows that some of thevariables are highly correlated among each other. Thisleads to multicollinearity. The highlighted parameterunder each factor is used to run the multipleregressions resulting that a all the parameters arestatically significant at 5% and at 1% level.
The results are shown in the following table 7.
Here, using the B value of the unstandardizedcoefficients, the following regression equation isformed:
Attitude towards a particular variable = -0.285+0.356 S3 + 0.135 S7 + 0.139 S2 + 0.148 S6 + 0.130 S4
Customers’ Perception of Indian Railways (Special Reference to Coimbatore Region)
Table 7: Coefficients
Model Unstandardized Standardized t Sig. R2
Coefficients Coefficients
B Std. BetaError
1 (Constant) -0.285 0.224 -1.272 0.205** 0.296
S3 0.356 0.060 0.342 5.897 0.000*
S7 0.135 0.054 0.138 2.530 0.012*
S2 0.139 0.051 0.154 2.710 0.007*
S6 0.148 0.050 0.160 2.944 0.004*
S4 0.130 0.046 0.158 2.828 0.005*
a Dependent Variable: S5*: Significant at 5%**: significant at 1% level.
ANOVA
Sum of df Mean F Sig.Squares Square
Regression 152.187 14 10.871 9.862 .000*
Residual 534.605 485 1.102
Total 686.792 499
Dependent Variable: S5
The analysis of variance of multiple regressionmodel for S5 indicates the overall significance of themodel. The coefficient of determination R2 valueshows that the six variables put together explainsthe variations of amenities is adequate (S5) to theextent of 20.5 %.
Thus, it is concluded that the step wise multipleregression analysis (Partial Model) for the variableY, dependent variable the amenities is adequate is
Tecnia Journal of Management Studies Vol. 5 No. 1, April 2010 – September 2010
14 Dr. N. Bharathi
adequate (S5) has esteemed a functional relationbetween Y with the predictor variables S3, S7, S2, S6and S4 and these five variables have significantlycontributed to amenities is adequate is adequate (S5)to the extend of 29.6%. The model has excluded theother variables.
Findings
The following are the findings based on thepresent study:
1. The Indian Railways have to pay moreattention towards Passengers’ comfort insidethe train, Cleanliness for waiting halls,platforms, comportment, etc., Adequacysecurity arrangement, Concession given tovarious sections of society, Excellent lay outof platforms for Restaurant, tea Stalls, coolsBars etc.
2. Provision of adequate amenities is the factorwhich has great influence over the otherfactors selected for the study, so the railwayadministration may concentrate its attentiontowards it.
Conclusion
In conclusions, protect their market share andviability, the railways have, different degrees,responded with a recognized management structure– that focuses on business and customers, improvedasset and staff productivity, redefined service profilesto match changing customer requirements, targetingof higher – margin market segments and sheddingof non-core activities. As per the present study therailways have to focus their attention towards thefour factors like amenities and safety measurement,facilities for reservation, cleanliness and concessionand catering facilities. Essentially, the railways havehad to transform themselves to market-responsiveentities in order to remain in business. Thefundamental change has been that service is tailoredto meet the specific needs of the customer, and pricingvaries accordingly.
Bibliography
Books
• Gilbert A, Churchill Jr (1991), “Marketing ResearchMethodological Foundations”, The Dryden PressFifth Edition, USA.
• Kothari C R (1985), “Research Methodology”,Wishwa Prakashan, New Delhi.
Journal
• Eboli, L. and Mazzulla, G. (2007). “Service QualityAttributes Affecting Customer Satisfaction For BusTransit”, Journal of Public Transportation, Vol.10.
• Fu, Linda and Xaviar, Y. (2007) “A NewPerformance Index for Evaluating Transit Quality ifService”, Journal of Public Transportation, Vol.10.
• Gleave, S. D., (2000). “Rail Passenger Quality ofService Valuation”, Indian Journal of ServiceManagement, Vol. VIII, No.2, pp 107-111.
• Vijay Durga Prasad (2007), “Passenger Amenitiesof Indian Railways”, Journal of ContemporaryResearch in Management, July – December, 2007.
• Yahesh and Indrajan (2006) “ComprehensiveEvaluation of the Degree of Railway PassengerSatisfaction Based on Fuzzy Factors”, Journal of theChina Railway Society, 28(1) 22-25.
Reports
• Jin Tao (2005). “Research on the Evaluation Systemof Railway Passenger Service Quality” DelhiUniversity, 7-34.
Tecnia Journal of Management Studies Vol. 5 No. 1, April 2010 – September 2010
15
OPTIMAL POLICIES FOR INTEGRATED INVENTORY SYSTEM FOR
DETERIORATING ITEMS USING QUANTITY DISCOUNT IN
PRICE-SENSITIVE DECLINING MARKET
Abstract: This article deals with formulation of optimal ordering andpricing policy when units in inventory deteriorate at a constant rate.The demand is dependent on time and retail price. In collaboratingscenario, it is observed that the vendor is more beneficial compared tobuyer, a quantity discount pricing strategy is advantageous to attractthe buyer to accept the join decision. A negotiation factor is incorporatedto share profit between the vendor and the buyer. Sensitivity analysiswith the numerical example proves that the integrated total cost is verysensitive to deterioration rate and the price-sensitive parameter. Theanalysis establishes that the integrated strategy with quantity isbeneficial to increase the profit of the supply chain.
Nita H. Shah*Nidhi Raykundaliya**
*Nita H. Shah, Department of Mathematics, Gujarat University, Ahmedabad-380009 E-Mail: nitahshah@ gmail.com**Nidhi Raykundaliya, A.D. Patel Institute of Technology, New Vidyanagar, Anand-388121 Gujarat, India.
Introduction
Due to inflation/recession, globalization of world,shrinking resources, quicker response, and
customer’s awareness, the individual players of themarket started adopting integration of the supplychain. An effective supply chain network requires acollaborative healthy relationship between the vendorand the buyer. In effective supply chain, the playersshare complete information, resources and profit. Thisresults increase in the joint profit.
Monahan (1984) analyzed an optimal quantitydiscount policy that maximizes the vendor’s profit butat the buyer’s end there was an additional cost. Laland Staelin (1984) formulated a fixed order quantitymodel when discount is offered to benefit the buyer.Lee and Rosenblatt (1986) generalized Monahan’smodel to study the vendor’s ordering and discount-price policy. Kim and Hwang (1988) developed anincremental discount-pricing schedule with multiplebuyers and single price break. Chakravarty and Martin(1988) developed an integrated strategy to computethe discount rice and cycle time for any desired
negotiation factor. Weng and Wong (1993) formulateda general all –unit quantity discount model todetermine optimal sale price and cycle time. Weng(1995) developed the vendor’s quantity discount toreduce the vendor’s operating cost and boost up thebuyer’s demand when end-user demand is price-sensitive. Li et al (1996) formulated a lot-for-lotdiscount policy with price-sensitive demand. Wee(1998) developed a lot-for-lot discount pricing policywhen units in inventory are subject to deterioration ata constant rate. As cited in Yang (2004), operating anintegrated supply chain required (a) reengineeringsystems, (b) a long term and mutual benefitpartnership between upstream and downstream , (c)complete knowledge of all players, (d) an accessibleinstant any data in the whole system, such as point-of-sale market and inventory information, throughglobal market, (e) producing and ordering the requireditems just in time for their consumption to minimizethe integrated total cost, (f) a global optimizationinstead of local optimization, (g) matching supply anddemand, and etc.
Tecnia Journal of Management Studies Vol. 5 No. 1, April 2010 – September 2010
16
Yang (2004) developed an integrated optimalstrategy mode for deteriorating item with quantitydiscount when demand is price-sensitive.
In this paper, the prevailing situation of decreasingdemand due to recession is considered. An integratedpricing and ordering inventory model is developedfor deteriorating items with quantity discount. Thedemand is considered to price-sensitive decreasingfunction of time. A negotiation factor is incorporatedto share the profit between both players. Numericalexample and sensitivity analysis are carried out tostudy the effect of model parameters on the joint totalprofit.
The paper is organized as follows: Threemathematical models with different assumptions areformulated in Section 2. Section 3 is about the solutionprocedures for the three models. The numericalexample and sensitivity analysis are given in Section4. The concluding remark is given in Section 5.
Mathematical Models and analysis
The proposed models are derived using followingassumptions:
a) The supply chain comprises of single vendorand the single buyer.
b) The players have complete knowledge of eachother’s information.
c) Inventory system deals with stocking singleitem.
d) The replenishment rate is instantaneous andlead-time is zero or negligible.
e) The demand rate is linear decreasing functionof time and retail price.
f) All-unit quantity discount is considered.
g) Shortages are not allowed.
h) Carrying cost is applicable to good units only.
i) Deterioration of the units is considered onlyafter its arrival into the inventory. There is noreplacement or repair of deteriorated units.
Three scenarios are discussed. The first scenariodoes not consider the vendor buyer integration andquantity discount. The second scenario considers thevendor-buyer integration without quantity discount.The scenario 3 deals with the vendor-buyer integrationand quantity discount simultaneously.
The variable parameters are as follows:
i = 1, 2, 3
Tbi Buyer’s cycle time for scenario i
ni Number of shipments from the vendor to thebuyer per cycle for scenario i
where a > 0 is scale parameter for demand,0 < b < 1 denotes the rate of change of demandwith respect to time and d > 0 denotes price-sensitive demand parameter.
Cb3 The buyer’s purchase unit cost for scenario 3.
The buyer’s related parameters are as follows:
Ibi (t) Inventory level for scenario at any instant oftime t.
Ab Ordering cost for buyer, $ per order
Cbi The buyer’s purchase unit cost for scenarioi, i = 1,2.
Ib Inventory carrying charge fraction per annumper dollar.
TCbi Annual total cost for scenario i.
TPbi Annual total profit for scenario i.
Sb Extra profit sharing for scenario 3 as comparedto scenario 1 (Sb = TPb3 – TPb1)
The vendor’s related parameters are as follows:
Ivi (t) Inventory level for scenario i at any instant oftime t.
Av Set-up cost, $ per cycle.
Cvb Fixed cost to process each buyer’s order.
Cv Vendor’s unit cost.
Iv Inventory carrying charge fraction per annumper dollar.
TCvi Annual total cost for scenario i.
TPvi Annual total profit for scenario i.
Sv Extra profit sharing for scenario 3 as comparedto scenario 1 (Sv = TPv3 – TPv1)
Nita H. Shah and Nidhi Raykundaliya
Tecnia Journal of Management Studies Vol. 5 No. 1, April 2010 – September 2010
17
The other related parameter for both the vendor and the buyer are
TCi Annual total cost (TCvi + TCbi) for scenario i.
TPi Annual total profit (TPvi + TPbi) for scenario i.
α Extra profit sharing negotiation factor between the vendor and the buyer.
The depletion of the inventory is due to the demand and the constant on-hand-stock deterioration. Thebuyer’s inventory level at any instant of time is governed by the differential equation
DIbi (t)——— = –R(t, P) – θIbi(t), i = 1,2,3 (1)dt
With boundary condition Ibi (Tbi) = 0, the solution of differential equation (1) is given by
Optimal Policies for Integrated Inventory System for Deteriorating Itemsusing Quantity Discount in Price-sensitive Declining Market
Tecnia Journal of Management Studies Vol. 5 No. 1, April 2010 – September 2010
18
In the parenthesis of (9), the first two terms are related ordering costs, the third term is the inventory holdingcost and the last term is the purchase cost.
Cb1 I*b1 (0)
The vendor’s annual total profit is TPv1 = ————— – TCv1 (10)T*
b1
The vendor’s total profit in (10) is a function of discrete variable, n1. Thus, optimal policy is
max TPv1 (n1) (11) n1
Since, n1 is a discrete integer, the optimal value of n1, denoted by n*1, and must satisfy the following condition:
TPv1 (n*1 – 1) ≤ TPv1 (n*
1) ≥ TPv1 (n*1 + 1) (12)
When the vendor-buyer integration and quantity discount are not considered, the total profit of the vendor andthe buyer is
TP1 = TPb1 (T*b1, P*) + TPv1 (n*
1) (13)
Scenario 2: inventory system with integration but not quantity discount.
The aim of vendor-buyer integration is to maximize the integrated total profit. The total cost of the buyerand the vendor are
The last term of (21) is the increased cost of vendor when quantity discount is offered.
The total profit of the vendor and the buyer are
PIb3 (0)TPb3 = ———— – TCb3 (22)
Tb3
Cb2 Ib2 (0)and TPv3 = ————— – TCv3 (23)
n3 Tb2
respectively.
The buyer’s extra profit, Sb is defined as
Sb = TPb3 – TPb1 (24)
and the vendor’s extra profit, Sv is defined as
Sv = TPv3 – TPv1 (25)
The integrated total profit in scenario 3 (TP3) is more than the scenario 1 (TP1) or scenario 2 (TP2). Theirrelationship for positive Sb and Sv values is defined as
Sv = αSb, α ≥ 0 (26)
When α = 0, all extra profit sharing is for the buyer; when α = 1, the extra profit sharing is equally distributed,A large α means that profit is in the favour of the vendor.
From (26) and (27), it can be seen that Cb3 and TP3 are functions of three variables, n3, Tb3 and P.
Optimal Policies for Integrated Inventory System for Deteriorating Itemsusing Quantity Discount in Price-sensitive Declining Market
Tecnia Journal of Management Studies Vol. 5 No. 1, April 2010 – September 2010
20
Solution Procedure
For scenario 1, to determine the value of n1 to maximize TP1 (13), follow steps stated in (11) and (12).
For scenario 2, to determine the discrete value n2 to maximize TP2 (18), follow the steps stated below:
a) For a given n2, set the partial derivatives of TP2 with respect to P and Tb2 to zero and determine valuesof P and Tb2. Denote it by P(n2) and Tb2(n2).
b) Derive the optimal values of n2, denoted by n*2 such that
TP2(Tb2(n*2 – 1), P(n*
2 – 1), (n*2 – 1) ≤ TP2(Tb2(n*
2), P(n*2), (n*
2)) (28)
And TP2(Tb2(n*2), P(n*
2), (n*2)) ≥ TP2(Tb2(n*
2 + 1), P(n*2 + 1), (n*
2 + 1)) (29)
For scenario 3, we outline following procedure:
a) From (26), Cb3 can be expressed as function of three variables: Tb3, n3 and P. Then substitute Cb3 into (27).
b) For a given n3, set the partial derivatives of TP3 with respect to P and Tb3 to zero to determine values ofP and Tb3. Denote it by P(n3) and Tb3(n3).
c) Derive the optimal value of n3, denoted by n*3 such that
TP3(Tb3(n*3 – 1), P(n*
3 – 1), (n*3 – 1)) ≤ TP3(Tb3(n*
3), P(n*3), (n*
3)) (30)
and TP3(Tb3(n*3), P(n*
3), (n*3)) ≥ TP3(Tb3(n*
3 + 1), P(n*3 + 1), (n*
3 + 1)) (31)
Numerical example
The derived model is illustrated by the following numerical example where the parametric values are asfollows:
Price-sensitive declining demand rate, R(t, p) = a(1 – bt) – dP units per year.
Scale parameter, a = 3000
Rate of change of demand, b = 10%
Price sensitive parameter, d = 35
Buyer’s ordering cost, Ab = $ 100
Buyer’s carrying charge fraction per year per dollar, Ib = 0.20
Buyer’s purchase unit price before price discount, Cb = $ 35
Vendor’s set-up cost, Av = $ 6000
Vendor’s fix cost to process each buyer’s order, Cvb = $ 100
Vendor’s carrying charge fraction per year per dollar, Iv = 0.20
Vendor’s unit cost, Cv = $ 20
Negotiation factor, a = 1
Deterioration factor, θ = 5%
By applying the solution procedure stated in section 3, results are worked out and are presented in Tables1-12. Table 1 shows the optimal solution for various scenarios when α = 1 and θ = 5%.
Nita H. Shah and Nidhi Raykundaliya
Tecnia Journal of Management Studies Vol. 5 No. 1, April 2010 – September 2010
21
For scenario 1, the optimal retail price is $ 60.30,cycle time is 0.126 years and the corresponding annualdemand is 851 units. The unit purchase price of thebuyer is $ 35. The buyer’s total profit is $ 20919. Thereare eight shipments from the vendor to the buyer per
cycle, resulting vendor’s profit to be $ 22524. The totalprofit of the supply chain is $ 43443.
For scenario 2, the vendor and the buyer take jointdecision. The buyer’s optimal retail price is $ 55.82 andcycle time is 0.243 years. The corresponding annualdemand is 972 units. The buyer’s, the vendor’s andthe integrated total profit are $ 19886, $24979 and$45117 respectively. The increase in the integrated totalextra profit in scenario 2 with respect to scenario 1 is$ 1,674. The vendor gains $ 2,455 and buyer loses$ 1,033. To attract the buyer, the vendor offers somediscount in the retail price. In agreement of equalsharing of the extra profit (α = 1), the optimal unitdiscount price is $ 33.16. the optimal cycle time is 0.245years.
The increase in the integrated total profit fromscenario 1 to scenario 3 is $ 1,719. Here each playershares the same cost saving of $ 859.5. The annualdemand is of 681 units. Only integration results thepercentage of extra total profit (PETP2) to be 3.85%. Ifboth the collaboration and the quantity discount areconsidered, the percentage of extra total profit (PETP3)is 3.96%.
Optimal Policies for Integrated Inventory System for Deteriorating Itemsusing Quantity Discount in Price-sensitive Declining Market
Table-1: The optimal solution for various scenarios
Scenario i i =1 i=2 i=3
P 60.304 55.82 55.77
di 851 972 681
Cbi 35 35 33.16
ni 8 4 4
Tbi 0.126 0.243 0.245
TPbi 20919 19886 21778
TPvi 22524 24979 23383
TPi 43443 45117 45162
PETPi 0 3.85% 3.96%
PETPi = (TPi - TP1)/TP1.
Table-2: Sensitive analysis for the demand scale parameter
In Table 2, the demand scale parameter is changed.It is observed that PETP3 decreases significantly.Increase in demand rate parameter in Table 3 showsthat the integrated profit decreases. This is because ofdecrease in the discounted unit price offered to thebuyer by the vendor. From Table 4, when the demandprice-sensitive parameter increases, PETP3 increasesas well. This suggests logistic manager to approachfor the integration and quantity discount when price-sensitive demand parameter increases.
From Tables 5, 6, 9, 10, 11 it is observed that theintegrated total profit decreases significantly. Thissuggests that the responsible player should try tocontrol these factors. Increase in buyer’s purchase cost(Table 7), the vendor’s ordering cost (Table 8), weobserve that the integrated total profit increases. Thechange in the negotiation factor does not have anyeffect on the percentage change in extra profit.
Concluding remarks
In this study, the optimal cycle time and pricingpolicy are analyzed when the price-sensitive demandis decreasing with time. The collaborative model isdeveloped for single-vendor and single-buyer. The
numerical example suggests that the integration andquantity discount result in an extra total profit gain of3.96%.
When the negotiation factor is very large, thepromotional scheme of price discount is insignificantand the integrated total profit is negligible. Theincrease in the deterioration rate decreases theintegrated total profit, the vendor’s replenishment timedecreases. This results in higher retail price. The resultof this research is applicable to efficient supply chainmanagement.
Acknowledgment
This research is carried out under the UGCresearch grant F. No. 36 – 358 / 2008 (SR).
• Kim, K.H., Hwang, H., 1988. An incrementaldiscount-pricing schedule with multiple customers and
Tecnia Journal of Management Studies Vol. 5 No. 1, April 2010 – September 2010
25Optimal Policies for Integrated Inventory System for Deteriorating Items
using Quantity Discount in Price-sensitive Declining Market
single price break European Journal of OperationalResearch, 35, 71-79.
• Lal, P., Staelin, R., 1984. An approach fordeveloping an optimal discount pricing policy.Management Science, 30, 1524-1539.
• Lee, L. E., Resenblatt, M. J. , 1986. A generalizedquantity discount-pricing model to increase supplier’sprofits. Management Science, 32, 1177-1185.
• Li, S. X., Hung, Z., Ashley, A., 1996. Inventorychannel coordination and bargaining in amanufacturer- retailer system. Annals of Operationsresearch, 68, 47-60.
• Monahan, J.P., 1984. A quantity discount-pricingmodel to increase vendor profits. ManagementSciences, 30, 720-726.
• Wee, H. M., 1998. “Optimal buyer-seller discountpricing and ordering policy for deteriorating items”.The Engineering Economist, 43 (2), 151-168.
• Weng, Z.K., 1995. “Modelling quantity discountunder general price-sensitive demand functions:Optimal policies and relations”. European Journal ofOperational Research, 86, 300-314.
• Yang, P.C., 2004. “Pricing strategy for deterioratingitems using quantity discount when demand is pricesensitive”. European Journal of OperationalResearch, 157, 389-397.
Tecnia Journal of Management Studies Vol. 5 No. 1, April 2010 – September 2010
26
A STUDY TO DETERMINE THE POTENTIAL ANTECEDENTS, TYPES AND
CONSEQUENCES OF WORKAHOLISM IN MEDICAL PROFESSIONALS
Abstract: Stress is the constant companion of many medicalprofessionals these days. Immense pressure pours in from all sides:
• From patients, who want to receive the very latest medicalprocedures;
• From insurance companies, who manage the ever-growing patientpopulation with ever-shrinking reimbursements;
• From our culture, which expects medical professionals to be infallibleat all times.
Then there are those pesky but essential tasks to keep up with, such ascontinuing medical education and managing practice overhead. Thepressure of “keeping up with the Joneses” and family expectations alsokeep them trying to be the best, the busiest, and the most profitable.
Today, patients have a choice of physicians, hospitals, healthcare centersetc; therefore, they must differentiate themselves from the pack or feelthe competitive pinch. They must strategically plan their approach sothat patients choose them. They must become adept at marketingstrategies on top of the advanced medical knowledge they need to keepup with in this changing industry. This new competition has also forcedthem to look at his or her practice from the patient’s point of view. Anexample is, whereas the physician wants to keep overhead low andprocesses simple; the patient is more demanding than ever. Theprospective patient wants an aesthetically pleasing atmosphere, acourteous and friendly staff, and limited waiting time.
Therefore, the medical professionals have been forced to re-evaluate theirfacility, staff, processes, and patient experience. This might be new tothem who have not evaluated the practice from the patient’s perspective.It can be daunting and expensive to revisit, revise, and remodel theentire operation. With all of these factors, it’s no wonder that manythey are feeling a different type of stress: to constantly push ahead ofthe competition so that revenue keeps coming in consistently. It’s aperfect setup for workaholism.
Charu Mohla*Gaurav Aggarwal**
*Charu Mohla, Faculty of Maharaja Agarsen Institute of Management Studies, Sector-22, Rohini, New Delhi. E-mail:[email protected]**Gaurav Aggarwal, Faculty of Maharaja Agarsen Institute of Management Studies, Sector-22, Rohini, New Delhi. E-mail:[email protected]
Tecnia Journal of Management Studies Vol. 5 No. 1, April 2010 – September 2010
27
Introduction
Workaholism can be described as the inabilityto stop working. Whether you are in the
office, at home, in bed, or socializing, if you findthat you cannot stop thinking about work ortalking about work then it is very likely that youare or you are about to become a workaholic. Untilrecently many people described workaholism as arespectable addiction, and half thought that it wasan admirable attribute. However, the condition isnow recognized as a serious problem and manytheories have been put forward to try and betterunderstand what motivates the workaholic.
Doctors, nurses and other medicalprofessionals might be risking their own healthand that of their patients by being dangerouslyoverworked, in some cases laboring as many as 17hours daily, according to a new study. There hadbeen a number of cases in recent years wherepatient deaths, or serious injuries, were put downto bad judgment calls caused by doctor fatigue,according to a Science alert report. After a pointbeing so tired has a similar effect to being drunk,so overworked health professionals are at a higherrisk of making poor judgments, their reaction timeslows and they face increased difficultiescompleting routine tasks.
This study aims to examine the potentialantecedents and consequences of workaholismtypes among the medical professionals. Threeworkaholism types (Work Enthusiasts, WorkAddicts, Enthusiastic Addicts) were compared.Antecedents included personal and work situationcharacteristics and personality factors.Consequences included work experiences, workoutcomes and indicators of psychological well-being. The workaholic triad consists of threeconcepts, work involvement, feeling driven towork because of inner pressures and workenjoyment. Work Addicts score high on workinvolvement and feeling driven and low on workenjoyment; Work Enthusiasts score high on workinvolvement and work enjoyment and low onfeeling driven to work; and Enthusiastic Addictsscore high on all three components.
Work & Workaholics
Work is not just a small word but it’s a veryimportant part of our life. Right from ourchildhood, we are taught to work, whether its
home or school; to take up a job and work whenwe grow up. Some people work to live but somelive to work and this is where the problem arises.As it is said, “All work and No play makes aperson dull.” This is quite true in today’scircumstances where there is competition allaround, greed for money and the desire forsuccess.
This drive is so strong that people may tendto forget their families, their friends and even theirown selves. Just like people get addicted to alcoholor drugs, these people get addicted to work. Workbecomes the synonym for life to them. They onlythink about work and nothing else becauseworking for long hours may fetch them moremoney, reputation and recognition. These peoplehave compulsive and unrelenting need to workand are called as WORKAHOLICS.
4 Styles of Workaholism
Bulimic Workaholic Style: The motto of thisstyle is, “Either I do it perfectly or not at all.” Justas some people with eating disorders alternatebetween self-starvation and bingeing, the bulimicworkaholic style involves cycling amongprocrastination, work binges and exhaustion.Bulimic workaholics often can’t get started, andthen scramble to complete the project by deadline,staying up for three nights straight beforecollapsing in exhaustion. Beneath theprocrastination phase of the bulimic workaholicstyle is the fear that they will not do the jobperfectly and intolerance for the emotionsconnected with making mistake. They areworrying obsessively about work- and kickingthemselves for not doing it.
Relentless Workaholic Style: is characterizedby the motto, “It has to be finished yesterday.”People in this group get an adrenaline kick fromtight deadlines and start things too soon ratherthan too thought, reflection and attention to detailslate. This style also is characterized by impulsivity;its participants tend to take on too much. They donot say no, set priorities, delegate or consciouslydecide to put anything on the back burner. Theywork too fast for careful. They often sufferdistortions in self-image; underlying theirrelentless volunteering is often a grandiose senseof their unique competence and a sense of self-worth dependent on other’s approval.
A Study to Determine the Potential Antecedents, Types and Consequencesof Workaholism in Medical Professionals
Tecnia Journal of Management Studies Vol. 5 No. 1, April 2010 – September 2010
28
Attention-Deficit Workaholic Style: use theadrenaline of overwhelming work pressure as afocusing device. People involved in Attention-Deficit workaholic style live on the brink of chaosand get high from the rush of new ideas. Theystart a plethora of exciting projects that they neverfinish. Easily bored with follow through, they arethe revved-up workaholics who click their nailson table tops, twiddle their thumbs in meetingsand fidget or place about erratically. They live onthe edge at work and plays gravitate toward high-risk jobs or activities. Unlike bulimic workaholicswho can’t start a project and want to do everythingperfectly, Attention-Deficit Workaholics start lotsof projects, do them carelessly and get too boredto follow through.
Savoring Workaholic Style: Is slow,methodical and overly scrupulous. Participantshave trouble letting go of work; they get hooked,savoring a project the way some alcoholics mightsavor a fine wine. This is a style of consummateperfectionism: those employing it can’t tell whenthe job is done down they fear the project is nevergood enough. They inadvertently prolong andcreate additional work then they realize they areclose to completion. Because a project feelsincomplete to them even when others feel it isfinished, savoring workaholics have difficulty withcompleting old tasks and starting new ones
Types of Workaholism
There are three workaholism types (WorkEnthusiasts, Work Addicts, Enthusiastic Addicts).
Work Addicts score high on work involvementand feeling driven and low on work enjoyment;
Work Enthusiasts score high on workinvolvement and work enjoyment and low onfeeling driven to work;
And Enthusiastic Addicts score high on allthree components.
Workaholism
Workaholism – an unhealthy inability to stopworking is becoming more and more common.This is why Dr. Barbara Killinger in her best sellingbook Workaholics (Key Porter books) 1991, refersto workaholism as “the respectable addiction.”
Workaholics identify business with pleasure.They are the embodiment of the pleasure principle.They make up the class of the entrepreneurs, themanagers, and the businessmen. They are themovers, the shakers, the pushers, and the energy.Without them, we have socialist economies, whereeverything belongs to everyone and, actually tonone. In these economies of “collective ownership”people go to work because they have to, they tryto avoid it, to sabotage the workplace, theyharbour negative feelings. Slowly, they wither anddie (professionally) – because no one can live longin hatred and deceit. Joy is an essential ingredient.
Workaholism is a big problem because, likeany other addiction it can be very dangerous andcan affect certain aspects of one’s life. But who isa real workaholic? Workaholics usually spend alot of time in their offices; some of them spend 60to 70 hours a week there, and others stay evenlonger.
Being a workaholic doesn’t just mean being ahard worker, says Robinson, a psychotherapist andprofessor at the University of North California whohas been studying people’s work habits for years.It means you’ve got a progressively worseningaddiction like any other, in which work becomesthe substance you use in an attempt to meet yourunconscious psychological needs. Robinson callsworkaholism the “best- dressed addiction,”because it’s often rewarded-at least in the shortterm- and is seen as a positive attribute by peoplewho don’t understand the destruction it can cause.But are all hard workers workaholics?
Research Methodology
Objectives
The broad objectives of the study were:
1. To determine the potential antecedents ofworkaholism.
2. To identify the type of workaholism, if it existsin the medical professionals.
3. To examine the consequences of workaholism.
Sample Design and Sample Size:
A questionnaire was administered to themedical professionals at the CONTACTPROGRAMME HELD AT INDRAPRASTHA
Charu Mohla and Gaurav Aggarwal
Tecnia Journal of Management Studies Vol. 5 No. 1, April 2010 – September 2010
29
APOLLO HOSPITAL, DELHI. The populationconsisted of 130 professionals, among which 50people were chosen randomly and administered aquestionnaire. Thus the sampling design became,SIMPLE RANDOM SAMPLING.
Analysis
A survey of 50 medical professionals wascarried out. Five questionnaires were unfilled orinaccurate and thus had to be discarded. Thedetailed break up is as follows.
TOTAL NUMBER OF RESPONDENTS: 45
NUMBER OF FEMALES: 28
NUMER OF MALES: 17
31 out of 45 respondents were found to beworkaholics, which makes it around 69%. Thus itis a point of concern, because more than half ofthe respondents were found to be workaholic.Whereas only 31% were Non Workaholic. Thisobservation gave a clear picture that workaholismis no more a rare phenomenon that exists in peoplebut a sure shot addiction to work that in turn hasseveral negative consequences.
Potential Antecedents to Workaholism
On the basis of gender
It was found, that 23 out the 28 females takenas respondents, were workaholics, and only 8 outof 17 males were workaholics. That makes it82.14% of the women being workaholic and47.05%. This difference in percentage can also beattributed to the fact that women have dualresponsibility on domestic as well as official fronttherefore they generally work more and hence itwas interpreted, that workaholism exists more infemales as compared to the male counter parts.
On the basis of age group
Amongst the 31 workaholics, it was found outthat, 28 of them falls in the age group of 35 yearsand under i.e. nearly 90%, whereas a negligiblenumber of people fell in other age groups. Thisobservation can be attributed to the fact that peoplein young age are more active and thus take upmore work than their counterparts in higher agegroups.
On the basis of Marital Status
As far as the marital status is concerned, therewas a very minute difference in the number ofrespondents falling in each of the category. Thus,it was inferred that people do not compromise ontheir career or work to their social and family life.This is an apparent quality of workaholics thatthey neglect their social life but not their Worklife.
On the basis of Income Group
It was found that, 59% of the workaholic’s fallsin the category of the monthly income from 20k-30k. This observation is much obvious, that peopletend to work more for salary hikes, better paypackages, and in process, become workaholics.
On the basis of Work Experience
It was found that maximum workaholics fallin the group of 1 to 5 years of work experience.This observation is also a well agreed one, becausemost of the people tend to take up more work andthus get extra involved into it, when in the entrylevel, or the initial stages of the career.
The type of workaholism to which therespondents belonged was found as:
It was found that a significant percentage ofpeople (refer figure no.1) belonged to the categoryof work addicts where they are surely involvedto their work and also feel driven to it, but donot enjoy it, this is the worst form ofworkaholism. Another significant point to note is,the second category that is those of WorkEnthusiasts, where people do no feel driven towork, was found only amongst 13% of the people,which infers that people still feel driven to theirwork, rather than involved. The next category ofWorkaholics that is the Enthusiastic Addicts, whoscore high on all the three parameters. Theyformed a substantial amount of percentage thataccounts nearly about 39%.
Consequences of Workaholism
� Delegation: It was observed that 81% of thepeople found it difficult to delegate, whichshows that they do no like to decentralize theirwork and insist on doing everything bythemselves, which account for heavy work load
A Study to Determine the Potential Antecedents, Types and Consequencesof Workaholism in Medical Professionals
Tecnia Journal of Management Studies Vol. 5 No. 1, April 2010 – September 2010
30
and thus workaholism among them.
� Job Satisfaction: The results showed, thatWorkaholics, love doing work and 72% ofthem were satisfied by their job, 19% wereneutral but only a minimal of 9% said thatthey were not satisfied by their jobs.
� Type A Behavior: The results showed that 35%of the people get irritated frequently, and 23% of the people were neutral about it, thuswhen compared with people who disagreedon this front, the no of irritated people is high.
� Beliefs and Fears: 42% of the workaholics donot worry what others think about them, thisshows that they are or they do neglect thesocial aspect of their lives. Whereas only 29%of them worries and the rest 29% was neutralabout the social aspect.
Some more practical female doctor casesto identify the exact situation:
Case 1
Dolly Gupta a cheerful doctor in a well knownhospital married for five years had infertility,where all her reports were fine and normal butwas unable to conceive because of odd workinghours and unmet demands of patients and family.
Case 2
Amita Naik, a doctor in Gyane departmentfaced pretum delivery due to long working hourswhich did not allow her to take adequate rest insuch situation.
Limitation of the Study
However we have tried our best in collectingthe relevant information yet there are alwayspresent some limitations under which researcherhas to work. Here are some limitations:
The sample size was 50, which is small andmay not reflect a true picture and the area coveredis Apollo Hospital only again a major constraint.
Conclusion
At the end of the study we can say that todetermine the potential antecedents ofworkaholism. Gender, Age groups, Income groups,
work experience and hours worked turned out tobe the major antecedents for workaholism.
� The female gender is suffering more fromworkaholism.
� The people in the lowest age group constitutedthe highest no. of workaholics.
� The people in the early or initial stages of theircareer faced workaholism more.
The present study also tried to identify thetype of workaholism, if it exists in the medicalprofessionals and it was found that a significantpercentage of people belonged to the category ofwork addicts where they are surely involved totheir work and also feel driven to it, but do notenjoy it, this is the worst form of workaholism.Another significant point to note is, the secondcategory that is those of Work Enthusiasts, wherepeople do no feel driven to work, was found onlyamongst 13% of the people, which infers thatpeople still feel driven to their work, rather thaninvolved. The next category of Workaholics, thatis the Enthusiastic Addicts, who score high on allthe three parameters. They formed a substantialamount of percentage that accounts nearly about39%.
The following consequences of theworkaholism as found out in the study were,inability to delegate, serious neglect of social life,a presence of irritation in the behavior, but amongall the negatives, a positive that was observed wasthat, they are highly satisfied by their jobs andinvolved in their work.
Figure No.1
Charu Mohla and Gaurav Aggarwal
Tecnia Journal of Management Studies Vol. 5 No. 1, April 2010 – September 2010
31
References
• Burke, R. J. , (2000), “Workaholism inorganizations: Psychological and physical well-being consequences”. Stress Medicine, 16, 11-16.
• Robinson, Bryan, July/ August, (200), “Chainedto the Desk” The Family Networker
• Schaufeli, W. B., Taris, T.,. & Bakker, A.B.(2008)“Workaholism is working excessively and workingcompulsively”
• Schweitzer, B. (1994) “Stress and burnout injunior doctors”. South African Medical Journal,84, 352-354.
A Study to Determine the Potential Antecedents, Types and Consequencesof Workaholism in Medical Professionals
Tecnia Journal of Management Studies Vol. 5 No. 1, April 2010 – September 2010
32
Introduction
The global business environment is continuouslyfacing increasing competitive pressures in a
volatile economic environment. Obtaining andmaintaining a competitive advantage has becomemore elusive and difficult due to global competition,industry consolidation, new channel development,and shorter product life cycles. Many firms havemade tremendous efforts to overcome thesechallenges and establish an advantage throughimproved supply chain performance (Andraski, 2008).These supply chain improvement efforts initiallystarted with the areas that the firm could controlinternally such as inventory management, processimprovement, and quality. These initiatives graduallyprogressed externally to include collaborationbetween the firm and its suppliers as well as betweenthe firm and its customers. Collaboration has become,
in a sense, the holy grail of supply chain improvementand has been referred to as the driving force behindeffective supply chain management (Ellram andCooper, 1990).
A collaborative partnership has been defined asan “inter-enterprise concept developed and practicedbetween multiple independent organizations in avertical relationship within a supply chain (Saha,2008). Since businesses are experiencing the limits ofaccruing business benefits out of supply chainmanagement within their own boundaries, thereforethese limitations have led organizations to focus onsupply chains outside of their own organizationalboundaries and bring in trading partners. With theadvent of faster technologies in the late 1990’s thesepartnerships have become a more likely possibility.The concept of a “maturity model” has been appliedin various ways to supply chain management. The
IMPLICATIONS OF AN AUGMENTED CPFR MODEL
IN SUPPLY CHAIN MANAGEMENT
Abstract: Globalization and increased use of IT have forced industryPundits to create efficiency and effectiveness in supply chain activitiesby moving away from functional excellence to functional integration.They have been successful in discovering innovative means such asquick response (QR), electronic data interchange (EDI), vendor managedinventory (VMI), continuous replenishment planning (CRP) andefficient consumer response (ECR). But these have fallen short ofexpectations due to the ever increasing complexities of the modern supplychain. One of the most recent initiatives aimed at achieving true supplychain integration is collaborative planning, forecasting andreplenishment (CPFR). CPFR has been recognized as a breakthroughbusiness model for planning forecasting and replenishment. CPFR is abusiness process that aspires to break down the barriers between differentplayers that traditionally exist in the supply chain. The result of thisis a much more integrated and collaborative environment for the sharingof business information and effort to improve the supply chainperformance.
A.K. Varma*S.K. Bansal**
*Dr. A.K. Varma, Director, College of Management and Technology, Urban Estate-II, Patiala (Punjab)- 147002 Email:[email protected]**Dr. S.K. Bansal, Professor, Dean School of Management Studies, Punjabi University, Patiala.
Tecnia Journal of Management Studies Vol. 5 No. 1, April 2010 – September 2010
33
following table shows the PRTM Supply ChainMaturity Model, with four phases of maturity in howcompanies manage their supply chains, particularlythe level of collaboration with supply chain partners.
Working from right to left, an enterprise becomesmore mature, graduating from being a “Follower” toa “Challenger” and ultimately a “Leader.” At eachlevel, there is more meaningful sharing andcollaboration with supply chain partners.
What is CPFR
One of the most recent highly acknowledgedcollaboration initiatives aiming at achieving truesupply chain integration is collaborative planning,forecasting and replenishment (CPFR). CPFR’sunderlying premise is that wider integration of firmswithin the supply chain will lead to a better focus oncustomers through the development of a singleshared forecast of demand and a reduction of leadtimes. The benefits resulting from a successfulapplication of CPFR include reductions in stock-outs,improved inventory management, shorter cycle times,increases in sales revenues, stronger relationshipsbetween trading partners, better overall systemvisibility and customer service, and improved coststructures. Other compelling benefits of utilizingCPFR include enhanced relationships, better category
management, improved product offering, reliable andaccurate order (Hennel, 2002).
CPFR is a paradigm-breaking business model thattakes a holistic approach to supply chain managementamong a network of trading partners. Approved asindustry guidelines by the Voluntary Inter-IndustryCommerce Standards (VICS) organization and theUniform Code Council (UCC), CPFR has the potentialto deliver increased sales, inter-organizationalstreamlining and alignment, administrative andoperational efficiency, improved cash flow, andimproved return-on-assets (ROA) performance. CPFRis not the first initiative aimed at increasingcollaboration and information sharing betweentrading partners in order to achieve improvementsin supply chain management. There have been anumber of widely known initiatives started with thisobjective from time to time such as vendor-managedinventory (VMI), quick response (QR) and efficientconsumer response (ECR). CPFR intends to ensurethat the industry actually captures the benefits ofinter- and intra-enterprise collaboration through acommon, pragmatic approach. Rather than create anew standard, it leverages the legacy of existingstandards in broad use through the retailing andconsumer manufacturing industries to developguidelines for collaborative business processes. CPFR
Implications of an Augmented CPFR Model in Supply Chain Management
Work is done with Practices are extended Division or company- Planning andcustomers and suppliers to interface with wide processes are optimization isto define a mutually strategic customers defined conducted withinbeneficial strategy and suppliers; functions and / orand cross-enterprise associated information Cross-functional departmentsprocesses are enabled needs are identified metrics are definedby information A well-defined Processes that cuttechnology Corrective actions are demand/supply across multiple
taken when balancing process functions are not wellReal-time performance performance falls is in place understoodtargets are set with below expectationsboth customers andsuppliers
Tecnia Journal of Management Studies Vol. 5 No. 1, April 2010 – September 2010
34
is envisioned as a platform- and vendor-independentenvironment where multiple parties can interoperate.Partners of different sizes and technical levels cancollaborate through accessible technologies, includingInternet and the Web, private Value Added Networks(VANs), dial-up, or other transport mechanisms. Thiscommunication is supported by formal standards,which evolve through an open process.
Interdisciplinary Relevance of CPFR
CPFR is in the first place an evolution andrefinement of the original Efficient Consumer Response(ECR). ECR means the consequent optimization ofthe supply chain to the customers’ needs by passingon information along the supply chain. Thefundamental objective of ECR is the collaborationbetween all affected participants by the supply chain,the customer, retailer and supplier, respectively theappliance of technical and process standards (Zillgitt,2005).
CPFR aims to enhance the use of ECR and tooptimize the collaboration along the entire valuechain for companies by bringing the methods andtechniques of ECR in a holistic business modeltogether. The conjunction of the separately recognizedissues concerning the demand and supply side in
the ECR model, offer the possibility to achieveremarkable synergetic effects.
Concisely, CPFR displays “an initiative among allparticipants in the supply chain intended to improve therelationship among them through jointly managedplanning processes and shared information”. The aim ofCPFR is achieved by the use of a common controlprocess relating to all relevant planning, forecastingand replenishment issues. All activities of the CPFRprocess try to provide the highest availability of goodswhile optimizing the inventory (Zillgitt, 2005),improving the company’s own position in the marketand the optimization of its own value chain. Sincethe fundamental planning and forecasting of theprocess require an intensely information exchange,e.g. in logistics, sales management, marketing andfinance planning, thus CPFR is a tool forcomprehensive value chain management of anorganization (Seifert, 2003).
It has been recognized as a breakthrough businessmodel for planning forecasting and replenishment.CPFR as a business process aspires to break downthe barriers between different players thattraditionally exist in the supply chain. The result ofthis is a much more integrated and collaborativeenvironment for the sharing of business information
Dr. A. K. Varma and Dr S K Bansal
Table 2: CPFR Methodology
Collaboration PlanningThe main idea of CPFR is to achieve higher The word “planning” was added to the originalbenefits in a partnership, by working together Collaborative Forecasting and Replenishmenttowards the same goal. This does not mean the model because the VICS group saw collaborationstronger partner uses his power to dictate the in terms of business and financial planning of allterms of the collaboration, but having the affected parties by the supply chain as a vitalcommon goal to satisfy as many customers as role in CPFR.possible while gaining the highest profit forboth parties.
Forecasting ReplenishmentForecasting can be done by both, the vendor and The sales forecasting are converted into orderthe retailer, depending on the circumstances forecasts. Thus, supplier constraints such as orderwhich party can produce more accurate, cycle time, lead-times, order minimums, case packsrespectively valuable data (Peterson, 2003). and chronic open-to-buy inhibitors need to beBy an optimized collaborative forecasting, the controlled. Moreover, the transportation planninginventories and sales can be improved over the is named by VICS as a “key lever” inwhole supply chain (Peterson, 2003). Especially, replenishment.products depending highly on seasonal influencescan be better analyzed by a collaborativeforecasting.
Tecnia Journal of Management Studies Vol. 5 No. 1, April 2010 – September 2010
35
and effort to improve the supply chain performance.The following table shows the CPFR methodology(Peterson, 2003):
Genesis of CPFR
In the early nineties, American retailers andconsumer goods companies were struggling withstagnation of revenues, rising costs and an increasein productivity was scarcely realized. This often ledto a negative impact on margins, contribution marginsand profit on sales. Changes and real gains couldonly be accomplished through open cooperationpartnerships for retailers and manufacturers.
CPFR originated in 1995 as an initiative co-ledby Wal-Mart and consulting firm BenchmarkingPartners. This initiative originally was calledCollaborative Forecasting and Replenishment (CFAR)(http://en.wikipedia.org/wiki/CPFR). Withassistance from Benchmarking Partners and IT firms(such as IBM, SAP, i2, and Manugistic), Wal-Martand Warner-Lambert implemented the first pilot ofCFAR to increase sales, reduce inventory, andimprove the in-stock position of Listerine, the project’spilot product (Sherman, 1998). Since this project,CPFR has evolved and is a strategic initiativeimplemented by many companies throughout NorthAmerica and Europe. VICS created guidelines forCPFR in 1998. Since the development and publicationof these guidelines, over 300 companies havesuccessfully implemented CPFR. The implementationof CPFR has also extended to industry sectors beyondretail, including high-tech industries. Rosettanet, anon-profit consortium of high-tech firms, hasdeveloped a collaborative forecasting standard forapplying CPFR practices to that industry. Today, theVICS CPFR Committee works “to develop businessguidelines and roadmaps for various collaborativescenarios, which include upstream suppliers,suppliers of finished goods and retailers, whichintegrate demand and supply planning and execution(http://www.vics.org/committees/cpfr/). CPFRenables trading partners to improve operationalefficiency through a structured process of sharingand utilizing information across firm”levelboundaries.
Brief Review of Literature on CPFR
There is a good amount of literature available onthe issues related to CPFR at international level. Thevarious prominent authors have thrown light on
various aspects of CPFR practices and have tried tocapture the different problems faced in collaborativepractices. Wognum and Faber (2003) presented anapproach that can support the gradual building ofknowledge on the process of collaboration. Theapproach, which results from the Esprit IV project23286 FREE (Fast Reactive Extended Enterprise), canbe viewed as a first step towards building amethodology to support management ofcollaboration. The concept of infrastructures forcollaboration has been introduced stressing theintegral nature of management of collaboration.Blomqvist and Levy (2006) propose that collaborationcapability integrates the key elements in many closelyrelated but semantically diverse conceptualizations.One of the major studies by Economist IntelligenceUnit Limited in 2008 covering 19 different industriesaround the world revealed that
• Collaboration among business partners is,among other things, intended to helpcompanies get closer to the customer.
• Companies are embracing collaboration bothto reduce costs and to enhance revenuegrowth.
• The biggest challenge in collaborating withbusiness partners is building trust.
• Technology is regarded as a key enabler ofbusiness relationships.
A study undertaken by Stiely and Katz in 2003concluded that in the automobile sector, companiesneed to achieve higher levels of integration withsupply chain partners and alignment of businessstrategy with the supply chain strategy byrestructuring their business and by increasing theirinvestment in IT. Kaushik (2009) reports a case studyof Inter-organizational Systems (IOS) at MarutiUdyog Limited. This paper suggests an approach toIOS planning for the automotive industry byproviding new insights into the existing literature onCritical Success Factors (CSFs) in the IOS domain.He examines two specific IOS initiatives in the MULvalue and supply networks and presents adifferentiated analysis of design elements (e.g.,relationships, processes, Information Systems (IS) andchange issues). It is also a best-practice case of howIOS initiatives can add value to the focal companyand its business partners and provides support tothe business relevance of inter-organizationalinvestments.
Implications of an Augmented CPFR Model in Supply Chain Management
Tecnia Journal of Management Studies Vol. 5 No. 1, April 2010 – September 2010
36
In fact, it is very difficult to find out a firm thathas not adopted any collaborative measure in oneform or the other with their vendors, distributors,retailers, dealers, customers and co-firms. A gooddeal of techniques such as ECR, VMI, JIT (Just-in-Time) emphasize to enhance quality, reduce wastageand increase productivity. At the same time, effortshave been made to improve relations with suppliers,distributors, retailers and customers. The researchundertaken at various levels in international arenahas been summarized under four streams as below:
2002 demonstrated that in almost every sector CPFRpilots are conducted.
Figure 1 shows the wide range of allocation:Aerospace, automotive, agriculture, transportation,electronic, telecommunication or chemistrycompanies. CPFR can also be used in the paper,textiles, pharmaceutical, consumer ormanufacturing industry. Even real estate, energycompanies, financial services and consultingcompanies have also adopted and experienced
Dr. A. K. Varma and Dr S K Bansal
Table 3: Major International Research on CPFR
Streams Research
First stream Dyer et al. (1997), Birt (1999), Lapid (2000),Definition and overview articles onthe role of CPFR in competitiveenvironment
Second stream Wognum and Faber (2003), Smith and Dickson (2003),Normative studies done mainly by Lin et al. (2003), Neubert et al. (2004), Kraines et al.’s, (2004),practitioners for institutionalizing Jiang-Liang Hou (2004), Kuo et al. (2005), Alt et al. (2005),CPFR in varied industries Bautzer (2005), Faraj and Alshawi (2004), Oyelaran-Oyeyinka
(2005)
Third stream Fornasiero and Zangiacomi (2006), Belzowski et al. (2006),Developing a basis for assessing Hardy, et al. (2006), Gardan et al. (2006), Volkmann andthe role of information sharing in Tokarski (2006), Matopoulos et al. (2006), Blackhurst, et al.implementing CPFR practices (2006), Chang et al. (2006), Yoon and Kwon (2006),
Okongwu (2006), Littler (2006), Yuen Ling Chan et al. (2006),Oliveira and Zaiane (2006), Namin et al. (2006), Chaloping(2006), Kim and Mahoney (2006), Blomqvist and Levy (2006),and Paton (2007)Lauri Ojala (2006), Ling Li (2006),
Fourth stream Simatupang and Sridharan (2007), Bayazit (2007), MotohashiAppraisal and successful (2007), Pecar and Davies (2007), Msanjila and Afsarmaneshimplementation of CPFR on the basis (2007), Hsieh and Chen (2007), Min and Yo (2008), Pisano andof case studies and its role in new Verganti (2008),product development
Application of CPFR
CPFR initiatives started in the retail sector andthe CPFR initiative of Wal-Mart is very well-known.The retailer has experimented with CPFR since 1995and has had significant success in this regard andcan be seen as a pacesetter. Seeing the success, manyother sectors tried to transfer this to their ownbusiness. Interviews by the Supply and Value ChainCentre with managers involved in CPFR projects in
with CPFR. Most CPFR implementations have beenin North America and Europe. In the USA aloneand more than 100 CPFR programs are currentlyunderway in Europe. Even Indian auto companiessuch as M&M, Maruti, Honda, L&T and manyMNCs in India have started experimenting withCPFR. The following table shows some companiesin different sectors that have implemented CPFRsuccessfully.
Tecnia Journal of Management Studies Vol. 5 No. 1, April 2010 – September 2010
37Implications of an Augmented CPFR Model in Supply Chain Management
(Source: Industry Directions, 2000)
Figure 1: Survey Metrics
Table 4: Applications of CPFR
Company Benefits Accrued
Motorola, Wal-Mart and Sara Lee, • Selection of the right trading partnerCisco, Living.com, Amazon.com, • Senior Management CommitmentDell Computers, JC Penny, Kmart, • Achieving a Collaborative Culture / OrganizationFederal Express, Kimberly-Clark, • Communication and Coordination for PromotionsNabisco and Wegmans, Solectron • Selecting the right itemsand Koda, Heineken, Coca-Cola • Progress TrackingFEMSA (KOF), Metro Group, Tesco, • Sales ForecastNASA, Condis, Delhaize, Elgeka, • Forecast AccuracyEqos, Heinz, Hellas Spar • Enabling TechnologyVeropoulos, Henkel, JDA, Johnson • Reduced order cycle times& Johnson, Ketjuetu, Kimberley- • lower procurement costsClark, Kraft, Marks & Spencer, • Smaller inventory and fresher products to consumers.Masterfoods, Nestlé, ONIA-NET, Sales increase as well as reduction of inventoryProcter & Gamble, SCA, Superdrug,Syncra, The Co-operative Group,Unilever, Valio, Vandemoortele,Wella, Woolworths, Hitachi
Fuji Heavy Industries Ltd. Toyota, • Increased demand-planning accuracy,General Motors, Ford Mazda, • reduced stock-outs,Renault-Nissan Volkswagen, • greater overall efficiency and better customer service,Hyundai-Kia, Daimler Chrysler,Honda, Peugeot-Citroën
Tecnia Journal of Management Studies Vol. 5 No. 1, April 2010 – September 2010
38
Involved Departments
It is very important to know which departmentsare actively involved in CPFR. A survey conductedby the VICS organization showed that beside theSupply Chain department or Logistics, Sales,Customer Service, Inventory, IT, Finance, Operations,Executive Management, Trade Relations or CustomerDevelopment and Marketing are involved, too(Barratt et al, 2001).
Technology and CPFR
The CPFR process does not fundamentallydepend on technology. But it uses common tools andprocesses to improve supply chain planning throughaccurate and timely information flow. Experimentsshow that Excel spreadsheets, internally developedsoftware or third-party software are being used.However, specialized technology can make the CPFRprocess more scaleable. To facilitate the process, thetechnology has to be flexible across the industry,guarantee secure communication and should beextensible to all supply chain processes. Moreover,the sharing of historical data and forecasts, theinteroperability with existing systems, the automationof the collaboration process and joint business plan,the possibility of revisions and the evaluation ofexception situations should be possible (Barratt etal., 2001). These requirements have been successfullytested by the Uniform Code Council, Inc. (UCC) forthe following companies´ software. Participatingvendors were i2 Technologies, Inc, IPNet Solutions,Inc., JDA Software Group, Inc., Logility, Inc.,Manugistics Group, Inc., SAP, and Syncra Systems,Inc. The test was the first of its kind worldwide (KJRConsulting, 2002). Among the most used softwaretoday are mySAP, Manugistics CPFR Solution,Voyager Solutions, Oracle’s J.D. Edwards AdvancedPlanning Solutions, Agile Anywhere, CLOExpressand JDA Software (Erman, 2002).
VICS CPFR Process Model
CPFR being a very successful collaboration modelis being implemented at many enterprises along theglobe. Over the past twelve years, CPFR guidelineshave been published several times, both to providea better understanding of CPFR and to point out thesteps required for the CPFR implementation process.The original CPFR Model, which was published bythe VICS Association in 1998, showed the CPFRimplementation as a linear process divided in nine
steps with consumer at the end of this process. Inorder to adjust the CPFR Process Model to thechanging global requirements and by gaining moreand more implementation experience, the originalCPFR model was revised by the VICS CPFRcommittee in 2004 as an interactive cycle of four maincollaboration activities (known as augmented CPFRmodel). Furthermore, the crucial role of the consumer,on whom lays the focus of collaborate efforts, isdemonstrated by placing it in the centre of the model.
The CPFR model (Figure 2) offers a generalframework by which a buyer and seller can usecollaborative planning, forecasting, and replenishingprocesses in order to meet customer demand. Toincrease performance, the buyer and seller areinvolved in following four collaboration activitieslisted in logical order.
1. Strategy and Planning – In this activity, the buyerand seller come to an understanding about theirrelationship and establish product and eventplans.
2. Demand and Supply Management – in whichcustomer demand and shipping requirements areforecasted.
3. Execution – the third collaboration activityinvolves placing, receiving, and paying for orders,and also preparing, delivering, and recordingsales on shipments.
4. Analysis – for this activity, the execution step ismonitored and key performance metrics aremeasured to work towards continuousimprovement.
Annotation on the Collaboration Activitiesand Tasks
The augmented CPFR model breaks down theactivities into further detail. Eight supplier andmanufacturer collaboration tasks i.e. two sets of tasks,one for the supplier and one for the manufacturerare associated with each of the four activities listedabove. The supplier and manufacturer tasks are calledenterprise tasks and link business-to-businesscollaboration tasks to the entire enterprise operations.
1. Strategy and Planning
This activity appoints the basic rules for thecollaboration between the manufacturer and theretailer. It determines both the product mix and
Dr. A. K. Varma and Dr S K Bansal
Tecnia Journal of Management Studies Vol. 5 No. 1, April 2010 – September 2010
39
placement and the event plans for the followingperiod.
• Collaboration Arrangement: The business goalsfor the collaboration are set and the scopefor relationship is defined. Furthermore theresponsibilities, checkpoints and escalationprocedures are assigned. The retailer taskrelated to this collaboration task is VendorManagement, and the manufacturer task isAccount Planning.
• Joint Business Plan: Important events thatinfluence supply and demand are disclosedfor the planning period. This includes forexample promotions, inventory policychanges, store openings and closingsrespectively or product introductions (VICS,2004). The retailer task associated with thisis Category Management and the manufacturertask is Market Planning.
2. Demand and Supply Management
This part of the CPFR Model forecasts thecustomer demand, also referred to as point-of sale(POS) demand, and the order and shipmentrequirements.
• Sales Forecasting: The demand at the point-of-sale is projected by means of consumptiondata. Depending on the product, industry ortrading partner the consumption data couldbe the retailer POS data, distribution centrewithdrawals or manufacturer consumptiondata. It must be pointed out that plannedevents mentioned in the Business Plan haveto be embraced in the Sales Forecasting(Bozarth, 2006). The retailer task here is POSForecasting and the manufacturer task isMarket Data Analysis.
• Order/Planning Forecasting: Based upon thesales forecast, the order forecast and the
Implications of an Augmented CPFR Model in Supply Chain Management
Figure 2: CPFR Model (Source: VICS, 2004)
Tecnia Journal of Management Studies Vol. 5 No. 1, April 2010 – September 2010
40
delivery requirements are issued. Compilingthe Order/Planning Forecast transit leadtimes, manufacturer’s capacity limitations,inventory positions and other factors haveto be considered (VICS, 2004). The associatedretailer task is Replenishment Planning, andDemand Planning is the associatedmanufacturer task
3. Execution
Execution comprises all operational actions likeplace orders, prepare and deliver shipments, receiveand stock products on retail shelves. Furthermorethe record of sales transactions and the effort ofpayments are components of the Execution as well.
• Order Generation: Order forecasts aretransitioned to firm demand. The retailer taskrelated to this collaboration task is Buying/Re-buying, and the manufacturer task isProduction and Supply.
• Order Fulfilment: Products are produced,shipped, delivered and stocked for consumerpurchase (VICS, 2004). In this case, both theretailer and manufacturer task is Logistics/Distribution
4. Analysis
The task of this activity is to detect deflectionsthat lead to exception conditions. Therefore, amonitoring of planning and execution activities isneeded. The results gained by monitoring areaggregated and key performance metrics calculated.The retailer and the manufacturer share their insightsand adjust their plans to achieve continuouslyimproved results.
• Exception Management: It includes monitoringof planning and activities to arrange theexception conditions. Exceptions could ariseboth in sales and order forecast (VICS, 2004).The retailer task is Store Execution and themanufacturer task is Execution Monitoring.
• Performance Assessment: The calculating of keymetrics is a crucial task in PerformanceAssessment. Key metrics are divided into twogroups: the operational measures that includefill rates, service levels, forecast accuracy, leadtimes or inventory turns and the financialmeasures which could be costs or itemprofitability. Their calculating helps to
appraise the achievement of the businessgoals, to perceive new trends or to developalternative strategies (Bozarth, 2006). Theretailer task here is Supplier Scorecard and themanufacturer task is Customer Scorecard.
The model described here is a two-tiered model.However, this model can be extended to include morethan two layers in the supply chain. VICS calls thisN-tier Collaboration, which is a relationship thatdevelops from retailers through manufacturers/distributors to suppliers.
n-Tier Collaboration
The CPFR model can be extended to encompassmore than two tiers of trading partners. N-tiercollaboration is the term used to describerelationships that progress from retailers throughmanufacturers or distributors to suppliers. In otherwords, N-tier means applying CPFR to other partsof the supply chain (for example raw materialsuppliers and manufacturers) or to multiple tradingpartners within one tier (such as a manufacturerpartnering with multiple retailers). Therefore, thesupplier which provides the manufacturer is placedin an enclosing ring of the CPFR Process Model likeshown below in the Figure 3.
Collaboration in the CPFR Process Model
CPFR is a key enabler behind synchronizedsupply chain strategies. By placing supply chainpartner trading relations at the center of thereplenishment decision making process, CPFR canprovide competitive advantages to market leaders.CPFR can often be accomplished with minimumchange to existing business processes using internet-based technologies (Sherman, 1999).
CPFR is a business practice that combines theintelligence of multiple trading partners in theplanning and fulfillment of customer demand. CPFRlinks sales and marketing best practices, such ascategory management, to supply chain planning andexecution processes to increase availability whilereducing inventory, transportation and logistics cost.CPFR assumes a great deal of data sharing andexchange between partners in all steps. Data isnecessary to measure the common metrics, to identifythe exceptions in sales and order forecasts, and alsois important to support decision making on theexception items. Therefore data integrity is almost a
Dr. A. K. Varma and Dr S K Bansal
Tecnia Journal of Management Studies Vol. 5 No. 1, April 2010 – September 2010
41
must for these steps to fulfill their missions. As aresult, frequent update of data is important to ensurethat real-time information is exchanged betweenpartners. The frequency of data update could beagreed upon between the partners to meet the needof their specific relationship. Ever since the release ofthe CPFR Guidelines and Roadmap, there has beensteady increase in the number of companiesimplementing CPFR. In addition to the successes seenin the U.S. and European pilot implementations,CPFR has also gained increasing attention in otherparts of the world as well.
Benefits and Challenges of CPFR
CPFR Benefits
CPFR creates a win-win situation between theirtrading partners if it is applied properly (IndustryDirections and Syncra Systems, 2000). There aretremendous opportunities for the participants indemand and supply matters.
CPFR is based on a strong supplier – buyerrelationship. The involved parties spend a lot of timetogether in CPFR meetings, such as Business Planmeetings, Forecast and Planning meetings etc. Themore often they meet the stronger the relationshipgets. As a result, both parties make a contribution toshare internal company data to improve theirPlanning figures which is known as “Infopartnering”(Seifert et al.2005).
The joint planning and forecasting has animmediate influence on the quality of forecasts. Theexample of the German manufacturer Henkel and itsretail customer Eroski endorses the above mentionedargument. 50 percent of Henkels’ and Eroskis’ salesforecasts had an average error of more than 50percent. After having started a CPFR partnership in1999, they achieved an average error of less than 20percent with three quarters of their forecast figures.Furthermore, stock out levels could be reduceddramatically.
More accurate forecast figures lead to lower
Implications of an Augmented CPFR Model in Supply Chain Management
Tecnia Journal of Management Studies Vol. 5 No. 1, April 2010 – September 2010
42
inventory and backorder levels, that means by usingCPFR the often mentioned bullwhip effect in thesupply chain can be reduced
(Simchi-Levi et al., 2003). Furthermore, a closecollaboration on planning and forecasting results ina more realistic business plan. That means thatmarketing decisions becomes more effective whichhas a direct effect on sales figures (VICS, 1999). Inaddition to the above mentioned points, variouscompanies experienced some other benefits in termsof
• replenishment cycle times,• stock rates for retailers,• days of supply, inventory level and inventory
turns,• service level,• and costs arising from production, planning
and deployment (Industry Directions andSyncra Systems, 2000).
Summarily “CPFR improves efficiency, increasessales, reduces fixed assets and working capital and reducesinventory for the entire supply chain, while satisfyingconsumers’ needs” (Simchi-Levi et al., 2003). While itis obvious that demand visibility is improved byexternal collaboration but the importance ofimproving internal collaboration is often overlooked.Eventually, all successful CPFR practitioners find thatthe real monetary value is derived from improvedinternal collaboration (Oracle Corporation, 2006).
CPFR Challenges
The whole process of CPFR is based on sharingsensitive information with trading partners. One ofthe biggest threats is the misuse of this information(Drayer, 2002). Therefore, choosing the right tradingpartners is important. Besides having a trustingbusiness relationship, the counterparts must have therequired commitments and resources available.Otherwise CPFR will not be successful. With referenceto the above mentioned CPFR Study of IndustryDirections and Syncra Systems, more than 60 percentof the questioned manufacturers, retailers,wholesalers and distributors see even moredifficulties in internal change followed by costmatters.
Nowadays, the whole CPFR process is doneelectronically. In this connection the introduction ofnew technology can become a barrier if the companydoes not provide the required funds. The samepercentage of the respondents saw it as a challengeto roll out CPFR without having the requiredexecutive support. The executive board has to be fullybehind it and CPFR has to become a priority withinthe organization which is often linked to a “culturalshift and human capital investment” (Industry Directionsand Syncra Systems, 2000). If the company is able toovercome these barriers to success, CPFR offerssignificant business benefits.
Dr. A. K. Varma and Dr S K Bansal
Figure 4: CPFR Challenges (Source: Industry Directions, 2000)
Tecnia Journal of Management Studies Vol. 5 No. 1, April 2010 – September 2010
43
Critique of the New Model
Despite the advantages of the new CPFR modelin various industries, there are some limitations tothis model. The biggest problem is the sharing ofconfidential information. It is quite unrealistic thatall members of the chain share all their datacompletely with all others, because they areapprehensive about the trustworthiness of suppliers.There is always a risk of forwarding developmentsto competitors by suppliers. Even if there were anagreement on a penalty fee, it would be hard to provefor the manufacturer that his partner supplierforwarded his data to the competitor. Moreover,development project differ from each other and hence,a standardization of the processes at this point oftime of the product life cycle is not possible.Furthermore, in order to get useful forecastinformation, the quality of the forecast data has to beimproved. Another problem is that it is difficult todescribe the replenishment process in detail with allpossible activities in advance of the order process. Inaddition, the complexity of an auto part and thedependency on each single part in order tomanufacture causes problems if the supplier has alack of knowledge. Both partners should focus oncollaborative work and conjoint solutions. However,sometimes it takes more time to discuss a solutionwith all partners than if only one partner develops aplan. The same situation can be found when problemsoccur. It is faster to solve them immediately insteadof informing all clients. This could be interpreted asa weakness and therefore many companies keep suchthings to themselves.
Conclusion
The impressing improvements concerning thecompany’s efficiency, sales increase as well asreduction of inventory figures point out potentialbenefits for companies in various sectors with theimplementation of CPFR practices. Companies canno longer operate in isolation. Collaboration andmutual trust is likely to stay in the modern timesdespite many problems and limitations.
References
• Alt, Rainer; Gizanis, Dimitrios and Legner,Christine (2005), “Collaborative order management:toward standard solutions for interorganisational ordermanagement” International Journal of TechnologyManagement, Vol. 31, No.1/2 pp. 78 - 97
• Andraski, Joseph C. and Haedicke, Jack (2003),“CPFR: time for the breakthrough? (Collaboration).”Supply Chain Management Review. ReedBusiness Information, Inc. (US). HighBeamResearch. <http://www.highbeam.com>.
• Attaran, M., Attaran, S. (2007), “Collaborativesupply chain management - The most promisingpractice for building efficient and sustainable supplychains” http://emeraldinsight.com/Insight/ViewContentServlet;jsessionid=9C6980ADE5D4A177 242CD5F3EF447DFD?Filename=Published/EmeraldFullTextArticle/Articles/
• Barratt, M., Oliveira, A. (2001), “Exploring theexperiences of collaborative planning initiatives”URL:http://www.emeraldinsight.com_Insight_ViewContentServlet_Filename=_published_emeraldfulltextarticle_pdf_1570130304.
• Bautzer, Luiz R. (2005), “Bringing togetherknowledge about the product life cycle to improveinter-firm collaboration capabilities”, InternationalJournal of Automotive Technology andManagement, Vol. 5, No.2 pp. 184 - 198
• Bayazit, Ozden (2007), “An examination of currentcollaborative supply chain practices”, InternationalJournal of Business Innovation and Research, Vol.1, No.3 pp. 253 - 266
• Belzowski, Bruce M.; Flynn, Michael S.; Edwards,Morgan; Ban, Linda and Martin, Gregory (2006),“Supply chain management: new competitive realitiesin the automotive value chain”, International Journalof Automotive Technology and Management ,Vol. 6, No.4 pp. 387 - 405
• Birt, J.M. (1999), “In India Collaboration is the Key”,Supply Chain Management Review, Fall, pp.13-15.
• Blackhurst, Jennifer ; Craighead, Christopher W.and Handfield, Robert B. (2006), “Towards supplychain collaboration: an operations audit of VMIinitiatives in the electronics industry”, InternationalJournal of Integrated Supply Management, Vol.2, No.1/2 pp. 91 - 105
• Blomqvist, Kirsimarja and Levy, Juha (2006),“Collaboration capability – a focal concept inknowledge creation and collaborative innovation innetworks”, International Journal of ManagementConcepts and Philosophy, Vol. 2, No.1 pp. 31 -48
Implications of an Augmented CPFR Model in Supply Chain Management
Tecnia Journal of Management Studies Vol. 5 No. 1, April 2010 – September 2010
44
• Bozarth, Cecil (2006a), “Demand and SupplyManagement. Supply Chain Resource Consortium”,North Carolina State University. http://scm.ncsu.edu/public/cpfr/4management.html
• Chaloping-March, Minerva (2006), “Collaborationtowards social sustainability: the case of a miningcorporation, its surrounding communities, and localgovernment in Benguet, Philippines”, InternationalJournal of Environment and SustainableDevelopment, Vol. 5, No.2 pp. 109 - 125
• Chang, Carl K. ; Zhang, Jia and Chang, KaiH.(2006), “Survey of computer-supportedcollaboration in support of business processes”,International Journal of Business ProcessIntegration and Management, Vol. 1, No.2 pp. 76- 100
• Drayer, Ralph (2002) Interview with Ralph Drayeron CPFR, Business Process Automation andP&G’s Deal with Wal-Mart. URL: http://www.cio.com/article/31239/Interview_with_Ralph_Drayer_on_CPFR_Business _Process_Automation_and_P_G_s_Deal_with_Wal_Mart
• Dyer, J.H.; Kale, P. and Singh, H. (2001), “How tomake Strategic Alliances Work”, Sloan ManagementReview, Vol. 42(4), Summer, pp. 37-43.
• ECR Europe, 2002 European CPFR Insights.http://www.ecrnet.org/04- publications/b l u e _ b o o k s /pub_2002_cpfr_european_insights.pdf. Erman, T.(2002) Seven Vendors Achieve CPFR® DataInteroperability in UCCsponsored Test.URL:http://findarticles.com/p/articles/mi_m0EIN/is_2002_August_6/ai_90163309.
• Faraj, I. and Alshawi, M. (2004), “Global projectcollaboration in the construction industry:standardisation and integration”, InternationalJournal of Computer Applications in Technology,Vol. 20, No.1/2/3 pp. 26 - 41
• Fornasiero, Rosanna and Zangiacomi, Andrea(2006), “Setting up e-platforms for collaboration inSME contexts”, International Journal of BusinessPerformance Management , Vol. 8, No.1 pp. 77– 90
• Gardan, Yvon; Hillereau, Mael and Perrin, Estelle(2006), “DIJA system: a CAD solution forcollaboration between designers and manufacturers”,International Journal of Product LifecycleManagement, Vol. 1, No.4 pp. 436 - 450
• Hardy, Cynthia ; Lawrence, Thomas B. andPhillips, Nelson (2006) , “Swimming with sharks:creating strategic change through multi-sectorcollaboration”, International Journal of StrategicChange Management , Vol. 1, No.1/2 pp. 96 -112
• Kaushik, Anjali (2009). “Interorganisational systemsin an automotive supply network: the Indian case ofMaruti Udyog”, International Journal ofAutomotive Technology and Management,Volume 9, Number 4 / 2009, 394 - 414
• Kim, Sung Min and Mahoney, Joseph T. (2006),CPFR as a Relational Contract: An IncompleteContracting Perspective, pp.1-44, URL: http://www.business.uiuc.edu/Working_Papers/papers/06"0102.pdf
• KJR Consulting (2002) CPFR Baseline Study –Manufacturer Profile. http://www.retailwire.com/BrainTrust/ResourceDocs/
• Kraines, Steven B. ; Komiyama, Hiroshi;Shigeoka, Hitoshi and Wallace, David R. (2004),“Development of an internet-based collaborationplatform and application to household waste plasticprocessing”, International Journal of TechnologyTransfer and Commercialisation , Vol. 3, No.2 pp. 129 - 146
• Kuo, David Chien-Liang; Chen, Wen-Hsien andSmits, Martin T. (2005), “SME-based collaborativesupply chain management: the impact of informationtechnologies”, International Journal of Managementand Enterprise Development , Vol. 2, No.3/4 pp. 360 - 373
• Lapide, L. (2000), “True Measures of Supply ChainPerformance”, Supply Chain Management Review,July-August, pp. 8-26.
• Li, Ling (2006), “The effects of information technologyimplementation on supply chain collaboration”,International Journal of Internet and EnterpriseManagement, Vol. 4, No.2 pp. 118 - 134
• Lin, Julia; Fang, Shih-Chieh and Hsiao, Luke Y.C.(2003), “The business strategies of technologicalcollaboration: Taiwan electronic industry perspective”,International Journal of Technology Transfer andCommercialisation, Vol. 2, No.2 pp. 111-127
• Littler, Dale (2006), “Alliance enigmas,International Journal of Technology Management,Vol. 33, No.2/3 pp. 115 - 129
Dr. A. K. Varma and Dr S K Bansal
Tecnia Journal of Management Studies Vol. 5 No. 1, April 2010 – September 2010
45
• Lothair (2001) Supply chain collaboration: closeencounters of the best kind. Business Week, 26March
• Matopoulos, Aristides; Vlachopoulou, Maro andManthou, Vicky (2006), Exploring chain, networkand cluster collaborative practices: implicationsfor SMEs, International Journal of Networking andVirtual Organisations, Vol. 3, No.2 pp. 142 - 155
• Min, Hokey and ‘Vincent’ Yu, Wen-Bin, (2008),Collaborative planning, forecasting andreplenishment: demand planning in supply chainmanagement, International Journal of InformationTechnology and Management, Vol. 7, No.1, pp. 4-20
• Motohashi, Kazuyuki (2007), The changingautarky pharmaceutical R&D process: causes andconsequences of growing R&D collaboration inJapanese firms, International Journal of TechnologyManagement, Vol. 39, No.1/2 pp. 33 - 48
• Manilas, Simon Samwel and Afsarmanesh,Hamideh (2007), Modelling trust relationships inCollaborative Networked Organisations,International Journal of Technology Transfer andCommercialisation , Vol. 6, No.1 pp. 40 - 55
• Namin, Akbar Siami; Shen, Weiming andGhenniwa, Hamada (2006), Implementingenterprise collaboration using web services andsoftware agents, International Journal of Networkingand Virtual Organisations, Vol. 3, No.2 pp. 185 -201
• Neubert, Gilles ; Ouzrout, Yacine and Bouras,Abdelaziz (2004), Collaboration and integrationthrough information technologies in supplychains, International Journal of TechnologyManagement, Vol. 28, No.2 pp. 259 - 273
• Norbridge (2001), “ Supply chain collaboration andvisibility: the results are beginning to show BusinessWeek, 8 October Oracle Corporation (2006) GrowingRevenue from CPFR and VMI: Building theDemand-Driven Supply Chain URL: http://www.oracle.com/applications/scm/demantra/resources/growing-revenue-from-cpfrand- vmi-white-paper.pdf. [22 October 2007]
• Okongwu, Uche (2006), Integration of SupplyChain Management systems, World Review ofIntermodal Transportation Research ,Vol. 1, No.1 pp. 24 - 44
• Oliveira, Stanley R.M. and Zaiane, Osmar
R.(2006), A unified framework for protectingsensitive association rules in businesscollaboration, International Journal of BusinessIntelligence and Data Mining, Vol. 1, No.3 pp. 247- 287
• Oyelaran-Oyeyinka, Banji (2005), Inter-firmcollaboration and competitive pressures: SMEfootwear clusters in Nigeria, International Journalof Technology and Globalisation, Vol. 1, No.3/4 pp. 343 - 360
• Paton, Bruce (2006), Collaboration amongindustry, civil society, and government forsustainability: a framework for identifyingopportunities, Progress in Industrial Ecology, AnInternational Journal, Vol. 3, No.1/2 pp. 148 - 162
• Pecar, Branko and Davies, Barry (2007) A newtechnology paradigm for collaboration in thesupply chain, International Journal of ServicesOperations and Informatics , Vol. 2, No.3 pp. 300- 314
• Peterson, Michael J. (2003) CPFR®: The 21stCentury’s Most Powerful Process for ConsumerSatisfaction http://www.mikepetersonconsulting.com SCRC SupplyChain Resource Cooperative (2000-2006)Collaborative Planning, Forecasting andReplenishment CPFR. http://scm.ncsu.edu/public/cpfr/index.htm
• Peterson, Michael J. (2003) CPFR®: The 21stCentury’s Most Powerful Process for ConsumerSatisfaction http://www.mikepetersonconsulting.com
• Pisano, Gary P. and Verganti, Roberto (2008),Which Kind of Collaboration is Right for You?,Harvard Business Review, December, 2008, pp.60-69
• Sahay, B.S. and Mohan, R. (2003), “Supply ChainManagement Practices in Indian Industry”,International Journal of Physical Distribution andLogistics Management, Vol. 33 (7), pp. 583-606.
• Seifert, Dirk (2003) Collaborative Planning,Forecasting and Replenishment: How to create aSupply Chain Advantage. New York: AMACOMBooks
• Sherman, Richard (1999), CPFR: Realizing thePromise of Efficient Consumer Response ThroughCollaborative Technology, Ascet Volume 1,
Implications of an Augmented CPFR Model in Supply Chain Management
Tecnia Journal of Management Studies Vol. 5 No. 1, April 2010 – September 2010
• Simatupang, Togar M. and Sridharan,Ramaswami (2007), The architecture of supplychain collaboration, International Journal of ValueChain Management, Vol. 1, No.3 pp. 304 - 323
• Simchi-Levi, David, Kaminsky, Philip andSimchi-Levi, Edith (2003) Designing and Managingthe Supply Chain. TMH, New Delhi
• Stiely, J.B., Katz, M.F. (2003) Virtually vertical: asupply chain model for the collaboration era’ inSeifert, D. Collaborative Planning, Forecasting, andReplenishment – How to Create a Supply ChainAdvantage. American Management Association,pp.331- 348
• Syncra Systems Inc. and Industry Directions Inc.(2000) “The next wave of supply chain advantage:collaborative planning, forecasting andreplenishment – CPFR survey findings andanalysis”. Available (http://www.syncrasystems.com, http://www.industrydirections.com
• Volkmann, Christine and Tokarski, Kim Oliver(2006), Growth strategies for young e-venturesthrough structured collaboration, InternationalJournal of Services Technology and Management, Vol.7, No.1 pp. 68 – 84
• Wognum, P.M. and Faber, E.C.C. (2003),“Infrastructures for collaboration in virtualorganizations”, International Journal of ComputerApplications in Technology, Vol. 18, No.1/2/3/4, pp. 210-224
• Yoon, Han-Seong and Kwon, Ik-Whan G. (2006),“The roles of electronic marketplace for buyer–supplier relationship: collaborative systemarchitecture”, International Journal of Services andOperations Management, Vol. 2, No.4 pp. 335 - 351
• Zillgitt, Andreas (2005), (CPFR). Prozeus. http:// w w w . p r o z e u s . d e / p r o z e u s / d a t e n /broschueren/cpfr/index.htm
Tecnia Journal of Management Studies Vol. 5 No. 1, April 2010 – September 2010
47
Introduction
Globalization dominates the competitive horizonand entails new markets, new markets, new
products, new mindsets, new competencies and newways of thinking about business.A major challengefor any organization in this era of internationalcompetition seems to be ‘survival and sustainability’amidst cut-throat competition. It is increasinglyargued that the organizations, best able to meet thechallenges will be those that can acquire and utilizevaluable, scarce and inimitable resources (Barney,1995). Human resources can fall into this category,particularly, if they are effectively deployed throughappropriate human resource practices andmanagement of organizational culture (Barney andWright, 1998). Human resources being one of the
important factors of production, HRD is needed todevelop competencies of individual employeesthrough its various interventions.
But with the initiation of the process ofglobalization and opening up of Indian economythere have suddenly been major changes in the primadonna status of the public enterprises. They are nowreeling under the threats of privatization. Thepersistence losses and inefficient working have forcedthe government to rethink about the revival of or tosay goodbye to sick units. This trend is prevailingnot only in India but the world over. In this context,the public enterprises have to cope up with theemerging environment. They must run fast. Theymust shed the stigma of being inefficient and beingburden on the national exchequer. Different countries
HRD CLIMATE AND ORGANIZATIONAL PERFORMANCE WITH FOCUS ON
JOB SATISFACTION AS A CORRELATE: EXPLORATORY ANALYSIS
Abstract: HRD climate helps the employees to acquire requiredcompetencies that would enable them to execute their present or futureexpected roles and aids in developing their capabilities for betterOrganizational Performance. Though the measures of OP are manyranging from financial to behavioural ones’, but researcher has focusedonly on single measure i.e. Job Satisfaction because of dearth in amountof studies exploring this relationship. The present paper attempts toanalyse and determine the relationship and impact of HRD Climate onJob Satisfaction as an OP measure in selected public sector organization.The study is based on the responses sought from 71 junior and middlelevel executives from various departments of a public sector undertaking(HMT Ltd.).The questionnaires relating to the HRD Climate (Rao andAbraham) and Job Satisfaction (C N Daftuar) was administered to thesample population and the findings indicate that HRD Climate has adefinite impact on Job Satisfaction which in turn leads to the increasedorganizational performance.
Keywords: Human Resource Development Climate, OCTAPACCulture, HRD Mechanisms, Job Satisfaction, OrganizationalPerformance
Ajay Solkhe*Nirmala Chaudhary**
*Ajay Solkhe, Corresponding Author, Assistant Professor, University School of Management, Kurukshetra University, [email protected]**Nirmala Chaudhary, Associate Professor, University School of Management, Kurukshetra University.
Tecnia Journal of Management Studies Vol. 5 No. 1, April 2010 – September 2010
48
in the world have chosen different strategies, ownpaths and management styles to face this challenge.Japan has emerged as the leading nation with theunique style of management-thanks to itsoverwhelming reliance on the use of major asset ,viz.,the human resource. The key to the whole matter inpublic enterprises in India is also to develop andposition our human resources in such a way thatorganizations become strategic. Thus, there is a needto institutionalize the system of human resourcedevelopment HRD in all public enterprises in orderto improve their working as well as to make themoperationally more productive. According to Y SMahajan, “human resource being the most vital factorof production and labour productivity, a positive,forward looking, human resource development policyis a sine-qua-non for the efficiency and effectivenessof public sector employees. (Mahajan, 1996)
HRD as a concept demands a specific andcongenial climate to take root. It enriches the worklife in an organization and aims to link productivitywith a sense of personal fulfilment.HRD involves allmanagement decisions and practices that direct, affector influence the human resource in the organization.In recent years the reason of greater emphasis is thebelief that employees enable an organization toachieve its goals and the management anddevelopment of these resources is critical to anorganization’s success.(Schuler,1992)
The success of HRD in any organization depends,to a large extent, on the existence of a favourableHRD Climate.HRD is more personnel-oriented thantechnology-oriented and believes that participationand communication would bring about greatercommitment, efficiency, and growth of individuals.
Review of Earlier Studies
HRD encompasses the development orientedactivities of the organization. For an individual toperform productively, the climate prevailing in theorganization needs to be conducive for hisdevelopment. Various research studies have beenconducted to determine and analyse the factorsaffecting the HRD Climate prevailing inorganizations.
K P Sai Venkateswaran (1997) in a note onHuman Resource Development Climate, made astudy based on the responses of 132 executives of alarge PSU and concludes that early identification of
human resource potential and development of theirskill represent two major tasks of human resourcedevelopment. This can be achieved only when aconducive HRD climate prevails. The study foundthe existence of favourable HRD climate in theorganization. Krishna and Rao (1997) carried out acomprehensive empirical study Organisational andHRD Climate in BHEL: An Empirical Study, andfound that HRD climate in the organisationencouraged middle and senior managers toexperiment with new methods and try out creativeideas. A. Sharma and Pooja Purang (2000) in theirstudy Value Institutionalization and HRD Climate:A Case Study of a Navratna public sectororganisation, found a positive relationship betweenvalue institutionalization and HRD climate in a largepublic sector organisation, meaning thereby that abetter and more ethical environment of theorganization shall lead to a better HRD climate forthe organisation. G V Chalam and L Srinivas (2005)in their study Genderwise Perceptions and Attitudeson HRD Climate in Indian Banking Sector, examinesthe basic disagreement with respect to HRD Climatein the selected branches of SBI. C Vijaya Banu.( 2007)in his study A Study on HRD Climate with SpecialReference to Public Sector Cement Corporation,concluded that to survive and excel in the neweconomy, the HRD climate is of crucial importanceto the Indian public sector organizations. Jain,Singhal, and Singh (1996) conducted a study, HRDClimate in Indian Industry, in two public sectororganisations i.e. BHEL and NFL and concluded thatthe HRD climate is mainly a function of theeffectiveness variables including individual efficiency,organisational efficiency and productivity, and theHRD variables including management policy onHRD, organisation development, role analysis andtraining. Ishwar Dayal et.al (1996) carried out a studyof HRD Climate in Indian Oil Corporation. It wasfound that HRD Climate was positive for learning.Gani and Rainayee (1996) conducted a study in HRDClimate in Large Public Sector Organization inKashmir and concluded that climate existing in theorganization for employee development was pickingup and it was further observed that compared tomanagerial personnel, workers were less sanguine.Riyaz Rainayee (2002) in a study on HRD Climate inCommercial banks found that the overall level ofOCTAPAC values in the banks was perceived at amoderate level. Pooja Purang in a ComparativeAnalysis of HRD Climate in Public Private and
Ajay Solkhe and Dr. Nirmala Chaudhary
Tecnia Journal of Management Studies Vol. 5 No. 1, April 2010 – September 2010
49
Multinational Organizations concluded that theEmployee perceptions regarding the HumanResource Development Climate are significantlybetter in the private sector and MNC in comparisonto the Public Sector Organization.
Most of the researchers have followed thetypology, ‘HRD Climate Survey’ as developed by Raoand Abraham (1986).It had 38 items grouped underthree categories: General Climate, OCTAPAC Cultureand HRD Mechanisms to assess the level of HRDClimate. The General Climate items deal with theimportance given to human resource developmentin general by the top management and line managersbut also concerns good personnel policies andpositive attitudes towards development. OCTAPACCulture depicts the degree of Openness,Confrontation, Trust, Autonomy, Pro-action,Authenticity, Collaboration and the extent to whichthese values are promoted in the organization.HRDMechanisms takes into account performanceappraisal, potential appraisal, career planning,performance rewards, feedback and counseling,training, employee welfare, quality of work life, jobrotation, self renewal and institution building,personal growth laboratories and worker educationprogrammes, quality circles ,task forces, andassignment groups, managerial learning network,organizational development etc. In the later days,researchers have made subtle changes to theinstrument to fit their study. Later the researchesshifted from not only analyzing the factors thatcontributed to the HRD Climate in an organization,but also on the effect that the climate had on theeffectiveness of the organization. The impact of HRDpractices on organizational level outcomes has gainedimportance as a research issue. The study conducteddone by Jain, Singhal and Singh has shownencouraging results in this regard.
The researchers conducted studies to know theinfluence of the HRD Climate on the individual’sattitudes and behaviours. Eisenberger, Fasolo andDavis-LaMastro (1990) found that the increasedperformance and positive work attitudes came fromthose employees who perceived that the HRdepartment is concerned about them. From a practicalpoint of view, this suggests ta Job Satisfaction can bean important barometer of HRM effectiveness.Rohmetra (1998) found that there exists a positiverelationship between developmental climate and thelevel of satisfaction of the employees. As per the studyof Kumar and Patnaik (2002) HRD Climate had a
positive association with job satisfaction, which givesa view that the job satisfaction is a resultant offavourable HR practices. Frederickson (1966)Lafollete & Sims 1975, found that more consultative,open, employee-oriented employees generally resultin more positive job attitudes. Lyon & Ivancevich(1974) in their study of a hospital, have found thatdifferent climate dimensions influence facets ofindividual JS for nurses and administrators. Cawsay(1973) has observed that JS increases as the individualperceives the climate as having more ‘opportunitiesfor advancement’ and by Insel and Moss (1974) haveshown that more precise predictions can be madeabout the person-environment interaction when theareas of concern are rather specific and delimited.Prediction of variables like satisfaction will improveby looking at the concept of environment in terms ofvarious dimensions. According to Payne and Pugh(1976) an individual needs, satisfaction and goalsinfluence his perception of climate, while climate inturn effects the same satisfaction, goals andbehaviour. Forehand and Gilmer (1964) outlines theperception of OC as being influenced by personalityfactors and their relationship with the satisfaction ofone’s needs.
It is inferred from the literature discussed that,the studies linking climate and satisfaction ofemployees was dominant.
Objectives of Study
In light of the domain for research, the studywas undertaken:-
i. To examine the nature of the HRD Climateexisting in the organization.
ii. To study the level of Job Satisfaction of themanagers of the organization.
iii. To critically review the relationship of HRDClimate and Job Satisfaction and subsequentlythe impact of developmental climate on jobsatisfaction of the individuals.
Hypothesis
Due to the lack of evidences in this area, thefollowing set of null hypothesis was developed:
“There exists no relationship between HRD Climateand the level of job satisfaction of the managers in theorganization”.
HRD Climate and Organizational Performance with Focus onJob Satisfaction as a Correlate: Exploratory Analysis
Tecnia Journal of Management Studies Vol. 5 No. 1, April 2010 – September 2010
50
Research Methodology
Data
A total of 100 managers were chosen randomlyfrom various departments, functional areas oforganization keeping in view their total strength andrange of activities. Out of 100 to whom thequestionnaires were distributed only 71questionnaires were received completed in allrespects .Therefore with 71% response rate theresearcher has conducted this study.
Instruments
The HRD Climate Survey developed by Rao andAbraham (1990) at Centre for HRD Xavier LabourRelations Institute (XLRI, India) to survey the extentto which a development climate exist in organisations,was used in the present study. This instrumentconsists of 38 questions on a 5 point scale rangingfrom 5 (Always almost true) to 1 (Not at all true) tomeasure the elements of HRDC which can begrouped into 3 broad categories referred to earlier,i.e. general Climate, OCTAPACE Culture, and HRDMechanisms.
Job Satisfaction Scale developed by C.N. Daftuarconsisting of 19 items including 2 which measureseparately overall satisfaction with the company andoverall satisfaction with the work was used for thepurpose. The respondents were asked to rate eachstatement on a five point scale ranging from 5(strongly agree) to 1 (strongly disagree).
Reliability
Alpha (Cronbach’s) reliability of the two scalesused is
• HRD Climate Scale = .96
• Job Satisfaction = .95
This indicates a very high internal consistency,based on average inter-item correlation.
Statistical Measures
To analyse the results, various statistical measuressuch as Mean, Standard Deviation, Correlation andRegression analysis were performed through SPSS18 and MS Excel 2007.
Analysis
HRD Climate
The item wise mean scores of the total sample of71 executives are presented in the table 1. Since thequestionnaire used 5 point scale, average mean scoreof 3 around indicate a moderate tendency on thatdimension. Scores around 4 indicate a fairly gooddegree of existence. Here the overall score was 3.25which indicate the existence of a just above averagedegree of HRD Climate. Examining the three majorcomponents of HRD Climate i.e. General Climate,HRD Mechanisms and OCTAPAC Culture the resultsindicates:
Ajay Solkhe and Dr. Nirmala Chaudhary
Table 1: Mean and Standard Deviation Results of 38 Item – HRD Climate Survey responded by 71 managersof a Public Sector Enterprise
GENERAL 1 The top management of this organization goes out of itsCLIMATE way to make sure that employees enjoy their work. 2.6620 1.02739
2 The top management believes that human resources arean extremely important resource and that they have to betreated more humanly. 3.3521 .98704
3 Development of the subordinates is seen as an importantpart of their job by the managers/officers here. 3.3944 .91774
4 The personnel policies in this organization facilitateemployee development. 3.0845 1.06565
Tecnia Journal of Management Studies Vol. 5 No. 1, April 2010 – September 2010
51HRD Climate and Organizational Performance with Focus on
Job Satisfaction as a Correlate: Exploratory Analysis
5 The top management Is willing to invest a considerable partof their time and other resources to ensure the developmentof employees. 2.9718 1.08195
6 Senior officers/executives in this organization take activeInterest in their juniors and help them learn their job. 3.3521 1.05693
7 People lacking competence in doing their jobs are helped toacquire competence rather than being left unattended. 3.1690 .86166
8 Managers in this organization believe that employeebehaviour can be changed and people can be developed atany stage of their life 3.5352 1.09324
9 People in this organization are helpful to each other. 3.7887 .96976
10 Employees in this organization are very informal and do nothesitate to discuss their personal problems with theirsuper visors. 3.7183 .92864
11 The psychological climate in this organization is veryconducive to any employee interested in developing himselfby acquiring new knowledge and skills. 3.5070 1.01240
12 Seniors guide their juniors and prepare them for futureresponsibilities/ roles they are likely to take up. 3.3944 .97803
13 The top management of this organization makes efforts toidentify and utilize the potential of the employees 2.9577 1.12677
18 People in this organization do not have any fixed mentalimpression/mental reservations about each other. 3.2817 .95891
Overall GC 3.29 .56450
HRD 14 Promotion decisions are based on the suitability of theMechanisms promotee rather than on favouritism. 2.6620 1.12051
15 There are mechanisms in this organization to reward anygood work done or any contribution made by employees. 3.1549 1.10386
16 An employee is appreciated by his supervisors when hedoes good work. 3.5915 1.00822
17 Performance appraisal reports in our organization are basedon objective assessment and adequate information and noton any favouritism. 3.2535 1.03811
19 Employees are encouraged to experiment with and try outnew methods and try out creative ideas. 3.1268 1.19439
20 When any employee makes a mistake his supervisors treat itwith understanding and help him to learn from suchmistakes rather than punishing him or discouraging him. 3.4930 .96914
21 Weaknesses of employees are communicated to them in anon-threatening way. 3.4789 .92364
22 When behaviour feedback is given to employees they take itseriously and use it for development. 3.1127 .90316
23 Employees in this organization take pains to find out theirstrengths and weaknesses from their supervising officersor colleagues. 2.9296 .97576
24 When employees are sponsored for training, they take itseriously and try to learn from the programmes they attend. 3.4366 1.10496
25 Employees returning from training programmes are givenopportunities to try out what they have learnt. 3.2958 .99131
26 Employees are sponsored for training programmes on thebasis of genuine training needs. 3.3380 1.09471
37 This organization ensures employee’s welfare to such anextent that the employees can save a lot of their mentalenergy for work purposes. 2.8873 .90316
38 Job-rotation in this organization facilitates employeedevelopment. 3.1690 1.06886
Overall HRDM 3.20 .62879
27 People trust each other in this organization. 3.6761 .92234
OCTAPAC 28 Employees do not feel afraid about their expression of/orCulture discussion of their feelings with their superiors. 3.3239 .96769
29 Employees are not afraid to express or discuss theirfeelings with their subordinates. 3.5634 .90605
30 Employees are encouraged to take initiative and do thingson their own without having to wait for instructions fromsupervisors. 3.1268 1.04101
31 Delegation of authority to encourage juniors to develophandling higher responsibilities is quite common in thisorganization. 3.0845 1.07897
32 When seniors delegate authority to juniors, the juniors use itas an opportunity for development. 3.3803 .88425
33 Team spirit is of high order in this organization. 3.3944 1.10167
34 When problems arise people discuss these problems openlyand try to solve them rather than keep accusing each otherbehind the back. 3.4930 .89240
35 Career opportunities are pointed out to juniors by seniorofficers in the organization. 2.7746 1.05826
36 The organization’s future plans are made known to themanagerial staff to help them develop their juniors andprepare them for future. 2.9437 1.08084
Overall OC 3.27 .57581
OVERALL HRD CLIMATE 3.25 .53230
Tecnia Journal of Management Studies Vol. 5 No. 1, April 2010 – September 2010
53
• Among the General Climate Dimensions themean score for Item No.9 (3.78), 10 (3.71) and8 (3.53) was found to be higher than otheritems which indicates that employees in thisorganization helpful to each other and are veryinformal and do not hesitate to discuss theirpersonal problems with their supervisors andsenior managers in this organization believethat employee behaviour can be changed andpeople can be developed at any stage of theirlife.
• Among the HRD Mechanisms category the meanscore for Item No.16 (3.59), 19 (3.49) Item no. 20(3.47) and Item No. 23 (3.43)was found to behigher than other items which indicates that theemployees are quite satisfied with theappreciation and recognition programmes,Learning and Development activities ,Feedbackmechanisms and most importantly Trainingactivities . This shows that company is having areasonable level of development orientation andemployees are contended with the same. On theother side the employees were quite unsatisfiedwith respect to the promotion decisions in thecompany (2.66).
• Among the OCTAPAC Values, the mean scorefor Item No.26 (367), 28 (3.56) and Item No. 33(3.49) was found to be higher than other itemswhich indicates that employees in thisorganization trust each other and they are notafraid to express or discuss the feelings withtheir subordinates, they confront their problemrather then accusing each other behind theback.
Job Satisfaction
The item wise mean scores of the total sample of71 executives are presented in the table 2. Since thequestionnaire used 5 point scale, ranging from 5strongly agree to 1 strongly disagree. Here the overallscore was 3.27 which indicate that job satisfactionlevel of managers is just above average. Examiningthe scores of the individual items of the JS Scale, theresearcher found that the mean scores of the itemsno.1 (3.76), 5(3.70),4 (3.69) and 18(3.56) are higherthan other items in the scale which indicates that theemployees are highly satisfied with the availabilityas well as adequacy of opportunities to do differentthings from time to time which make use of theirabilities along with this they are also contended with
the stability in employment .On the whole the resultsshowed that people are happy with the work andthe organization in general.
Relationship between Climate and Job Satisfaction
Mean score analysis of HRD climate and Jobsatisfaction of the organization reveal that arelationship exists between them. Correlation analysiswas carried out to statistically test their relationship(Table 3 ). The result shows that a significant positivecorrelation of 0.786 exists between them. Therefore,it supports the hypothesis and makes clear that animprovement in HRD Climate is essential forimproving the level of job satisfaction of themanagers, which in turn will bring positive changesin Organizational Performance of the company.
Having observed that a positive correlation existsbetween the HRD Climate and JS, further analysiswas conducted to find the relationship between thesub factors or dimensions of HRD Climate withJS(Table 3). The correlational analysis performed toanalyse the relationship between HRD ClimateDimensions i.e. General Climate , HRD Mechanismsand OCTAPAC Culture and Job Satisfaction. Theanalysis showed that there exists a positiverelationship between different components of HRDClimate and Job satisfaction. The correlationcoefficient was .734 (JS*General Climate) ,.693(JS*HRD Mechanisms) and .695 (JS*OCTAPACCulture) respectively.
This proves that HRD Climate is a contributing/influencing factor to increase the level of jobsatisfaction of the employees.
Impact of Climate on Job Satisfaction
Regression analysis was performed to explain theimpact of HRD Climate on job satisfaction i.e. theamount of association. F –Value of 111.56 which issignificant at 5% level of significance proves that theregression model is valid. (Table). The individualimpact of HRD Climate dimensions on satisfactioncannot be interpreted in this analysis because of theexistence of multi-collinearity and high inter-itemcorrelation, which may distract the results. Buthowever it can be said that job satisfaction is verymuch influenced by General Climate, HRDMechanisms and OCTAPAC Culture in general. Theresults may differ according to the settings. It wasfound that 61% of the variance in job satisfaction isexplained by the HRD Climate variables. Therefore
HRD Climate and Organizational Performance with Focus onJob Satisfaction as a Correlate: Exploratory Analysis
Tecnia Journal of Management Studies Vol. 5 No. 1, April 2010 – September 2010
54 Ajay Solkhe and Dr. Nirmala Chaudhary
the null hypothesis that there exists no relationshipbetween HRD Climate and the level of job satisfaction ofthe managers in the organization is rejected.
Conclusions and Implications
Thus on the whole, the researcher finds theexistence of good HRD Climate in the organizationaccording to the perceptions of managers soughtthrough the scale constructed for measuring the same.The managers in general showed a favourableattitude towards HRD Policies and practices of theorganization. They were satisfied with thedevelopmental policies of the top management aswell as contented with their work and theorganization as a whole i.e. level of job satisfaction
was also good.Most importantly the researchers’findings support the existing literature and add tothe deficit literature existing which have attemptedto explore the relationship of HRD Climate and JobSatisfaction in Indian Context. It was concluded thatthere is a significant relationship between JS andHRDC and any positive change in HRD Climate andits components will bring about positive changes inJob Satisfaction and in turn impact the OrganizationalPerformance in positive manner.
However the findings of the present studyindicate that there is a still substantial scope forimprovement in various aspects of HRD in theorganization as well as factors influencing JS. Someof these aspects along with broad suggestions are:-
Table 2: Mean and Standard Deviation Results of 19 Item – Daftuar’s Job Satisfaction Scale responded by71 managers of a Public Sector Enterprise
Items Mean S.D.
JS1 My job provides adequate opportunities to do different things fromtime to time. 3.7606 .86956
JS2 My job provides adequate opportunities to be “some body” in thecommunity. 3.4085 .80316
JS3 My supervisor is quite competent in making decisions. 3.4648 .99758
JS4 My Job provides for stable employment in suitable ways. 3.6901 .97967
JS5 My job provides adequate opportunities to do something that makesuse of my abilities. 3.7042 1.03364
JS6 My job provides fair Pay. 2.3662 1.09856
JS7 My job provides adequate opportunities for advancement on this job. 3.0423 .93253
JS8 I’m happy with the working conditions. 2.9155 1.06565
JS9 I’m happy with the way my co-workers get along with each other. 3.3803 .86794
JS10 My Job provides me a feeling of accomplishment. 3.4789 .90805
JS11 I’m happy with the General management of the company. 3.2113 1.06792
JS12 I’m happy with my past advancements’ in this organization. 3.2817 .92864
JS13 There are adequate opportunities for future growth (in efficiency) 2.8451 .98049
JS14 Social conditions are appropriate for the job with in the organization 3.2394 .94815
JS15 My work is suitably recognized in the organization. 3.3521 1.04333
JS16 I’m happy with the kind and amount of responsibilities assigned to me. 3.3803 .93145
JS17 I’m happy with the Company’s policies. 2.9577 1.07486
JS18 I’m happy with my work as a whole. 3.5634 .95218
JS19 I’m happy with my company/organization as a whole. 3.2394 1.11438
OVERALL JS 3.27 .53984
Tecnia Journal of Management Studies Vol. 5 No. 1, April 2010 – September 2010
55HRD Climate and Organizational Performance with Focus on
Job Satisfaction as a Correlate: Exploratory Analysis
• The top management’s commitment should beincreased towards learning & potentialdevelopment of its human resources in all itsendeavours. The mean score of the items dealingwith these aspects were 2.66, 2.97 and 2.95 whichare below average.
• Management should also draw its attentiontowards bringing reforms in the Promotion policy(2.66) as well as the welfare practices of the
organization (2.88), as the mean score is quitebelow average on these two HRD mechanisms.
• In general psychological climate in theorganization should be improved and effortsshould be initiated to make it conducive to thedevelopment of employees. Besides , there is anurgent need for restructuring the variouspersonnel policies in the organization. Soundpersonnel policies that show high concern for
Table 3: Correlation Results between Job Satisfaction and HRD Climate, its Components (General Climate,OCTAPAC Culture and HRD Mechanisms)
**Correlation is significant at the 0.01 level (2-tailed).
Table 4: Results of Regression Model of HRDC on JS
Model Summary
Model R R Square Adjusted Std. Error Change StatisticsR Square of the
Estimate R Square F Change df1 df2 Sig. FChange Change
1 .786a .618 .612 .33612 .618 111.567 1 69 .000
a. Predictors: (Constant), HRDC
Tecnia Journal of Management Studies Vol. 5 No. 1, April 2010 – September 2010
56
employees and emphasise equity and objectivityin appraisals would go a long way in creating abetter HRD Climate in the organization. Themanagement should also take a good look at theexisting HRD mechanisms and explore thepossibilities of introducing new ones.
• On account of satisfaction level of managerscertain improvements derives the attention theorganization needs to improve the workingconditions, needs to revise the compensationpackages as per the industry standards, careeropportunities should be pointed out to employees,company policies should be conveyed in asimplified manner and its interpretation shouldbe checked through feedback mechanisms as themean scores was low in these categoriesrespectively (2.36, 2.91, 2.95 and 2.84)
In the end it must be emphasized here that sincethis study was carried out in a public sectororganization, the findings of the study are notapplicable to other types of organizations. Further,since the sample consisted only of managerialpersonnel, the findings may be generalised in othercategories of employees, i.e. supervisors and workers,with caution. Although this study made an attemptin examining the potential impact of HRD Climateon Organizational Performance by concentrating onsingle variable i.e. just job satisfaction, but there aremany other indicators of OP such as FinancialPerformance, Employee Turnover, MarketPerformance, Sales Turnover, Productivity whichremains unconsidered. Thus, there is a scope forfurther research in this area.In general, this studycontributes to the literature on HRD Climate andprovides an additional insight to the individualsassociated with the HR field.
References
• Barney J B and Wright P M (1998), “On becominga Strategic Partner: The Role of HR in gainingcompetitive advantage”, Human ResourceManagement, 37:31-46.
• Bhamidipati, Ravi and Makhijani, Rajer (2003),‘Changing Mindsets’, Background Papers, AIMA30th National Management Convention,September 15-17.
• Bhardwaj Gopa and Mishra Padmakali (2002)HRD Climate: an empirical study among privatesector managers ,IIJR July 2002,38(1)
• Cawsey, T. (1973) ‘The interaction of motivationand environment in the prediction of performance andpotential and satisfaction in the Life InsuranceIndustry in Canada’. paper presented at 16thAnnual Midwest Academy of Managementmeeting, Chicago, Illinois, April,
• Eisenberger, Fasolo and Davis-Lamastro (1990),“Perceived Organizational Support and EmployeeDiligence, Commitment and Innovation”, Journal ofApplied Pscyhology,75:51-59.
• Forehand, G, & Von Gilmer, B(1964).Environmental variations in studies of organisationalbehaviour. Psychological Bulletin, 62, 362-381.
• Frederickson, N. (1966) Some effects of OCadministrative performance’, ResearchMemorandum RM-62-61, Educational to stingservice.
• International Labour Organisation, (1997) ,ILOEnterprise Forum, Geneva 1996, ‘Summary ofProceedings.
• Jain V K, Singhal K C and Singh V C (1997),“HRD Climate in Indian Industry”,Productivity,37(4) : 628-639.
• K P Sai Venkateswaran,(1997) A Note on HumanResource Development Climate, Vikalpa,Vol. 22Issue 1 pp.51-53
• Kalburgi, M.S.(1984),Human ResourceManagement, McGraw Hill, Toronto
• Kumar S and Patnaik S P (2002), “HRD andAttributes of Teachers in JNVs”, Indian Journal ofTraining and Development, 32(2):31-37
• Lawfollete, W.R.,and Sims,H.R.,Jr. (1975)‘Issatisfaction redundant with OC ?’,OrganizationalBehaviour and Human Performance, 13, pp. 257-278
• Lewlyn L.R. Rodrigues, (2004) Correlates of HumanResource Development Climate Dimensions: Anempirical study in engineering institutes in India.South Asian Journal of Management,Vol 11 Issue2 pp 81.
• Murthy, P.V.R., & Gregory, J.X.(1989),”Relevanceof Japanese HRD practices in Sundaram Clayton,”In T.V.Rao, K.K.Verma, A.K.Khandelwal, &E.Abraham (Eds),Alternative Approaches andStrategies of H.R.D,” Rawat Publications.
Ajay Solkhe and Dr. Nirmala Chaudhary
Tecnia Journal of Management Studies Vol. 5 No. 1, April 2010 – September 2010
• Sonal Saxena,(2006), Human Resources DevelopmentClimate in Indian IT Companies, ICFAI Journal ofManagement Research ,Feb,2006.
HRD Climate and Organizational Performance with Focus onJob Satisfaction as a Correlate: Exploratory Analysis
• Srimanarayan M.,(2007) Human ResourceDevelopment Climate in Dubai Organizations,IJIR,Vol 43 No. 1 July 2007,pp 1-13.
• Srimannarayana M., (2001), Human ResourceDevelopment Climate in a Software Organization,HRD Newsletter,Vol. 2 Issue 3 pp.6-14
• Tanuja Aggarwala,(2002), Innovative HR Practicesand Human Resource Development Climate : acomparison of automobile and IT Industries. UdaiPareek,Osman-Gani Ramnarayan andT.V.Rao(Ed) HRD in Asia, Oxford & I.B.H, NewDelhi, pp.3-10.
• Venkataratnam, C.S..(1999) (ed.) ‘HRD forAdjustment at the Enterprise Level’, ParticipantsManual, ILO.
• Verma, Madhurendra K. (2000) ‘Nurturing ChangeThrough Your Human Assets,’ Sage India.
Tecnia Journal of Management Studies Vol. 5 No. 1, April 2010 – September 2010
58
Introduction
Technology changes in AI also change thephenomena of Internet search. .As AI emerges
with new knowledge representation tools andtechniques and thus new generation web search alsorevolutionized with the upcoming “Semantic SearchEngine”. Semantic Web Search is a search engine forthe Semantic Web.
Semantic web is defines as web with meaning. To bemeaningful (semantic), information must be logical. For an entire worldwide web of information to besemantic (meaningful) the entire web of informationmust be structured according to what is calleduniversal logic[21]. Semantic web will be used tomake web pages machine readable so that they canperform more of the tedious work involved infinding, sharing and combining information on theweb without interference of humans.
Objective of semantic web is to combineinformation from multiple sources. The vision of the“Semantic Web” is to have all public (www) ‘data’encoded in a way that ANY application program canuse it – even programs that have no encoding toanticipate the meaning of the data.
Information retrieval technology has been vitalto the success of the Web. For semantic webdocuments or annotations to have an impact, they
will have to be compatible with Web based indexingand retrieval technology These annotations willprovide metadata about the documents as well asmachine interpretable statements capturing some ofthe meaning of document content
Transformation from HTML to OWL
WWW Language—HTML
Now a day’s information in computer can beloosely divided into documents and data. Documentslike articles, messages, reports, and brochures are readby humans. Data, like calendars, address books,playlists, and spreadsheets are presented using anapplication program which lets them be viewed,searched and combined in many ways. CurrentlyWeb pages are stored in HTML HTML is full of tagsthat can be used to represent a visually-abstractcontent, but these were designed to markup pages,so they contain semantics about paragraphs, tables,images, but they cannot markup things like invoices,mathematics formulas, car spare parts, etc.
Example of HTML code:
<H1>Introduction to AI</H1><UL><LI>Teacher: Frank van Harmelen<LI>Students: 1AI, 1I<LI>Requirements: none</UL>
SEMANTIC WEB: ONTOLOGY BASED WEB
Abstract: As the barriers of distances in networking are removedthrough Internet technology. It is the time to have new era in the fieldof database, AI and IR and web. This is coming up in the form ofsemantic Web .The word semantic define ‘meaning’. As the semanticdatabase is the latest trend in database technology and it is incorporatingthe new generation of knowledge representation and InformationRetrieval for Semantic Web. This paper presents the in depth discussionon Ontology based web, the transition from HTML to OWL .InformationRetrieval system and Semantic web.I will also be discussing the differenttechniques used in IR systems for Semantic Web.
Tecnia Journal of Management Studies Vol. 5 No. 1, April 2010 – September 2010
59
Metadata
Metadata is data about data. HTML brought the<meta> tag to allow page authors to help indexingof the page by placing keywords that specified thepage content. The best search engine make extensiveuse of these tags, when available, to categorize theinformation. Metadata will not be displayed on thepage, but will be interpretable by machines. Metadatatags, for example
Metadata provide a method by which computerscan categories the content of web pages. But still thatdoes not provide powerful approach to searchengines. So the new language was introduced toprovide advantage over HTML i.e. XML.
Why XML?
(eXtensible Markup Language)
XML does not specify fixed tag set. In fact XMLis really a meta-language for describing markuplanguages. In other words, XML provides a facilityto define tags and the structural relationships betweenthem. Since there’s no predefined tag set, there can’tbe any preconceived semantics. All of the semanticsof an XML document will either be defined by theapplications that process them or by style sheets. XMLis considered to be the basis for all semantic weblanguages – the “machine code” of the newgeneration web[12].
An XML document is parsed in two levels.
� Well-formed. A XML document is well formedif it is having start tag(<>) and its correspondingend tag(</>).
� Valid. A valid document additionally conformsto semantic rules, either user-defined or in anXML schema, especially DTD; e.g. if a documentcontains an undefined element, then it is notvalid; a validating parser is disallowed fromprocessing it.
It can be shown in tree like structure, which willbecome the basis for search in web.
Fig 1: tree representation of XML
Any XML document whose nested tags form abalanced tree is a well-formed XML document.Furthermore it is possible to enforce constraints onwhich tags should be used, and which nesting ofthese tags is allowed. In XML 1.0 this is done in aDocument Type Definition (DTD)
Limitations in XML
Let us suppose we want to express the followingfact:
Shikha Singh is a lecturer of Computer Science
There are various ways of representing thissentences in XML .Three possibilities are
Tecnia Journal of Management Studies Vol. 5 No. 1, April 2010 – September 2010
60
Fig 3: graph showing link of lecturer and teaching
• Here in all the statements, same relationship isshown but there is no specification to showrelationships, it is up to the application tounderstand itself. So, there is no standard wayof assigning meaning to tag nesting.
• XML is aiming at the structure of documents anddoes not impose any common interpretation ofthe data contained in the document. This is themajor limitation of XML: since XML just describesgrammars there is no way of recognizing asemantic unit from a particular domain ofinterest.
• If the files are defined by a DTD or Schema, thefiles will not be extensible.
In a nutshell, this means that XML is very suitablefor data interchange between applications that bothknow about what the data is, but not in situationswhere the addition of new communication partnersoccurs frequently.
XML Schema
An XML schema describes the structure of XMLdocument, typically expressed in terms of constraintson the structure and content of documents of thattype, above and beyond the basic syntacticalconstraints imposed by XML itself. An XML schemaprovides high level of abstraction to the view of thedocument.
Different languages are developed to describeXML schema like DTD (Document Type Definition)etc. Two other very popular, more expressive XMLschema languages are XML Schema (W3C) andRELAX NG.
RDF(Resource Description Framework)
The limitations of relationship associated withthe XML are overcome by RDF. XML describes thesyntax and RDF describes the semantic.
• Syntax: the structure of your data
• Semantics: the meaning of your data
Syntax being the science of how signs can be puttogether to create sentences. Semantics being howthese signs relate to the world so that one can givethe sentence a truth value.
Lets take the above sentence i.e
Shikha Singh teaches computer science.
The above sentence is referring to three things.One person named Shikha Singh, second coursenamed computer science and the relationship betweenthem i.e teaches. There are many ways to representthe same relationship i.e you can write in English,French, Spanish Java or in XML. But all of them willbe describing the same thing but in different syntax.
As I referred above XML describes the syntax ofthe document and RDF describes the semantics. SoRDF can be written in many ways like RDF/XML,N3, N-Triple or as Turtle.
RDF describes the framework for meta-data of webdocument. RDF is used to describe relationship betweendifferent Entities in the world.
RDF provides information like title, author,modification date, content, and copyright informationof a Web page
The RDF data model can be said to haveresemblance with entity-relationship diagram. TheRDF data model, however, does not provide methodfor declaring the properties, nor does it provide anymechanisms for defining the relationships betweenthe properties and other resources. That is the role ofRDF Schema.
RDFS Schema
For describing any Resource there is requirementto say certain things about certain kinds of resources.For describing bibliographic resources, for example,descriptive attributes including “author”, “title”, and“subject” are common. For digital certification,attributes such as “checksum” and “authorization”are often required. The declaration of these properties(attributes) and their corresponding semantics aredefined in the context of RDF as an RDF schema. Aschema defines not only the properties of the resource(e.g., title, author, subject, size, color, etc.) but mayalso define the kinds of resources being described(books, Web pages, people, companies, etc.).
Shikha Singh
Tecnia Journal of Management Studies Vol. 5 No. 1, April 2010 – September 2010
61
By definition
RDF schema is a semantic extension of RDF. TheRDF schema language is used for declaring basic classand types when describing the terms used in RDF and areused to determine characteristics of other resources, suchas the domains and ranges of properties.
The ‘rdfs’ namespace is used here to define corevocabulary, and is identified by the URI referencehttp://www.w3.org/2000/01/rdf-schema#.Thisspecification also uses the prefix ‘rdf’ to refer to thecore RDF namespace
http://www.w3.org/1999/02/22-rdf-syntax-ns#.
RDF/XML
RDF is not designed for being displayed to peopleXML language used by RDF is called RDF/XML. RDFuses XML to describe metadata so that informationcan easily be exchanged between different types ofcomputers using different types of operating systemsand application languages.
RDF/RDFS allows anyone to write their ownname-space document (a ‘schema’). This definesproperties and classes in some application domain.
These form vocabularies which can be usedglobally for sharing the meaning of tags
Along with its formal semantics, RDF datastructure is effectively modeled using a directedgraph. In RDF data model the metadata statementsare represented as triples: nodes are used to representtwo parts of the triple, and the third part isrepresented by a directed link that describes therelationship between the nodes. The triples are storedin a logical network.
Triple is defined as (subject, predicate, object) forinstance (Shikha Singh, teaches, computer science)
RDF identifies everything as URI(UniformResource Identifier) which gives a uniformity inaccessing anything on the web. This URI could linkto a machine or human readable definition, or theURI could merely serve as a unique identifier withno real link to information content
RDF triple can be taken as (Resource, property,value).
• A Resource is anything that can have a URI, suchas “http://www.abc.com/RDF”
• A Property is a Resource that has a name, suchas “creator” or “homepage”
• A Property value is the value of a Property, suchas “Shikha Singh” or “http://www.abc.com”
Property value can either be literal or anotherURI.Let’s look at some example statements to get abetter understanding:
Statement:
“The creator of http://www.abc.com/RDF isShikha Singh”.
• The subject of the statement above is: http://www.abc.com/RDF
• The predicate is: creator
• The object is: Shikha Singh
So here property value is literal(string).
Fig 4: RDF triple with object as literal value
Statement: “The homepage of http://www.abc.com/RDF is http://www.abc.com”.
� The subject of the statement above is: http://www.abc.com/RDF
� The predicate is: homepage
� The object is: http://www.abc.com
In the above example the property value is URI.
Fig 5: RDF triple with object as URI
Root Element
<rdf:RDF> is the root element of an RDFdocument. It defines the XML document to be anRDF document. It also contains a reference to theRDF namespace:
Description
rdf:Description is a container for informationabout a resource identified by the about attribute. Inthis case each resource is a book, its identification
Semantic Web: Ontology Based Web
Tecnia Journal of Management Studies Vol. 5 No. 1, April 2010 – September 2010
62
(URI) is its name. Each book has an author and thespecified number of pages.
The above relations can be shown as a graph asbelow.
Shikha Singh
Tecnia Journal of Management Studies Vol. 5 No. 1, April 2010 – September 2010
63
Fig 6: RDF statements of ABC1 schema
Now the ABC2 can be shown as N3 relation asbelow:
[ a :Person;:name “Tim Bray”;:mbox ≤mailto:[email protected]≥:address [ a :Address;
:country “Canada”@en] ]
[ a :Person;:name “Jonathan Story”;:mbox ≤mailto:[email protected]≥:address [ a :Address;
:country “Franc≥@en]
].
Fig 7: RDF triple graph of ABC2
RDF data Model
Now lets take the statement as below:
Shikha singh is teacherof Rahul Thakur.
RDF statement is
http://www.abc.com/s.singh is teacherof http://www.abc.com/r.thakur.
both statements shows the same relationship butin different manner. The above statement can beexpressed in RDF data model as
Fig 8: RDF data Model
Here in above example statement shows subjectand predicate both are having properties as first nameand last name with literal values .
Layered structure of RDFS
The RDF data model can be transformed inlayered structure of RDFS and its namespace. As Ihave mentioned earlier that RDFS specifies theschema for RDF and it also specifies classes andproperties to be used in RDF modeling. So usingthose classes and properties , the above example canbe shown as a layered structure.
Fig 9: RDF model and RDFS structure
Again the RDF is having certain limitations interms of vocabulary for specifying the metadata andtheir relationships, which is overcome by introductionof Ontology.
Semantic Web: Ontology Based Web
Tecnia Journal of Management Studies Vol. 5 No. 1, April 2010 – September 2010
64
Ontology
The term ontology has different meaning indifferent terms.
In general ontology represents an idea or concept. Itis a kind of model depicting a concept. Ontology isknowledge representation showing model consists ofproperties and relationship.
In philosophy, ontology is defined asmetaphysics, which deals with the nature of reality-of what exists.
In computer science ontology is a conventionalrepresentation of a set of concepts within a domainand the relationships between those concepts.Ontology provides hierarchical structure of concepts.
An ‘Ontology’ is an agreed on, shared, commonunderstanding of a domain written as an explicit, formalspecification[7].
Ontology is defined as classification of things. Itbequeath a better organisations of relationships. Itcategorises the object or things in the world accordingto specifications. It provides better understanding ofrelationships.
As RDF used to define the metadata , Ontologydefines the relationships.
Lets take the same example of describing a book.
Book
hasPart chapter
Chapter
hasElement page
Page
hasElement paragraph
So the information regarding a book can berepresented as above or as below.
These are the simplest way of writing theontologies.
Basics components of Ontology in any field are:
� Classes
� Attributes
� Relationships
� Rules
� Restrictions
� Axioms
Classes can be expressed as domain of theproblem or we can say it specify the kind of thing, orcollection of objects etc.
Attribute are used to represent set of propertieswhich a thing poses or characteristics.
Relationship shows the link between classes orindividuals or it describes how classes are related toeach other.
Rules define the logical inferences that can betaken from an assertion.
Restriction specifies the conditions under whicha statement can be true.
Axioms defined the logical form of assertions.
There are two “kinds” of ontology: representationontology (axiomatization of basic operations used inmany applications) and application ontology whichare domain specific.
OWL (Web Ontology Language)
W3 has endorsed a language to define ontologiesand is called as OWL[9].OWL is mainly based ontwo semantics: OWL DL and OWL Lite semanticsare based on Description Logics, which haveattractive and well-understood computationalproperties, while OWL Full uses a novel semanticmodel intended to provide compatibility with RDFSchema. OWL ontologies are most commonlyserialized using RDF/XML syntax. OWL isconsidered one of the fundamental technologiesunderpinning the Semantic Web, and has attractedboth academic and commercial interest.
Shikha Singh
Tecnia Journal of Management Studies Vol. 5 No. 1, April 2010 – September 2010
65
Structure of Semantic Web
Fig 10: semantic architecture in layer
The upper layers are:
Logic Layer: creates new pieces of knowledgeinformation by applying assertions to existing webdata.
Proof Layer: validates information so that it canbe accredited. Ontologies will be retrieved from theSemantic Web and processed locally to create andprovide proofs for other machine processes in theSemantic Web.
Trust Layer: Digital signatures will have to beapplied to all layers from the RDF Layer up to theProof Layer, validating the results of each component.This is the reason why the Semantic Web also hasthe Web of Trust moniker.
Fig 11: Example of Ontology written in OWL/RDFformat
Related Work
All ready study conducted on comparison ofontology and other formalism and which describe as
1. Ontologies vs. XML Schema: In general, XMLSchema is proposed as a mechanism to define thesyntax for XML documents.
Because data can be encoded in different waysusing XML, this allow parties to agree on a definedstructure and labeling for the exchange of data [12].While XML Schemas define the structure of thedocument, they do not define any meaning.Ontologies on the other hand are formalized in away that limits possible interpretations. In particular,on the basis of possible interpretations, an OWL-aware tool can tell that two classes or individuals areequivalent or different. While XML and XML-Schemahave strength in exchanging data, ontologies are usedto exchange information.
2) Ontologies vs. Database Schema: Database schemascan be distinguished into the conceptual and thephysical Schema and logical schema. The physicalschema results from the mapping of the conceptualschema to physical storage objects—e.g. tables of arelational database. In particular, a conceptualdatabase schema mostly reflects only a single or alimited viewpoint— namely that of its creators. Whenrequirements change, the viewpoint and the schemarespectively need to be modified.
Ontologies in general are required to be shared,that is, reflect multiple viewpoints (domain ontologiesin particular).
A domain ontology does not need to be modifiedto meet changes in requirements but can be flexiblyused to model any data requirements related to aparticular domain. An important distinction betweenontologies and database schemas is their behavior atruntime. After being translated to physical tables, theontology is also available for retrieval and inferencingof new facts at runtime. The ontology can potentiallyincrease semantic interoperability not only of theresources exchanged among systems but also of thedata stored in physical databases. For instance, theformal descriptions of two differently labeledconcepts may yield the same interpretations and sothe corresponding tables can be inferred as containingsemantically the same data despite the different tablenames. Therefore, when queries are formulated usingontology concepts, they can be processed also by
Semantic Web: Ontology Based Web
Tecnia Journal of Management Studies Vol. 5 No. 1, April 2010 – September 2010
66
external systems that may use different labels for theelements of the physical schema.
Information Retrieval in Semantic web
Different techniques are being used to extractdata from semantic web. As data is stored in manyforms like XML and RDF or in the form of RDBMSetc. in semantic web. Here I am discussing abouttwo languages for IR i.e XQuery and SPARQL whichhave already developed.
A query language that uses the structure of XMLintelligently can express queries across all these kindsof data, whether physically stored in XML or viewedas XML via middleware. This specification describesa query language called XQuery, which is designedto be broadly applicable across many types of XMLdata sources.
The SPARQL Protocol and RDF Query Language(SPARQL) is a query language and protocol for RDF.XQuery is a language to query a document, SPARQLis a tool to query the world[19].
An XQuery can only query one document. RDFhelps you to extract the content of manydocuments[25], as a set of facts, drop them in onebig container, and query that container in one go,essentially allowing one to make relations betweenfacts stated in different documents. This is thefundamental difference between these twotechnologies, and why they are both needed.
Relational OWL
Currently all databases are based on relationaltheory, so there is need arises to develop a relationalOWL for the semantic web so as to relate currentweb databases with futuristic semantic database. Sorelational OWL have been developed[27].
Relational OWL is a Semantic Web-basedrepresentation format for relational data and schemacomponents, which is particularly appropriate forexchanging items among remote database systemsor to expose relational data on the Semantic Web.OWL, originally created for the Semantic Web enablesus to represent not only the relational data itself, butalso a part of its interpretation, i.e. knowledge aboutits format, its origin, its usage, or its originalembedment in specific frameworks.So formulationof relational OWL from current RDBMs will be likethis statement as given below.
Database has tables.Tables has columns.Tables are identified by primary key.Foreigne key refer to primary key of another
table.
So graphical representation of this kind ofOntology is relational OWL.Jena toolkit is being usedfor the development of such OWL.
Fig 12: relational OWL of RDBMS
Jena is based on java and uses JDBC for databaseconnectivity. It converts the relational RDF/OWL intoRDBMS and also convert data extracted from RDBMSinto relational RDF/ OWL representation.
Discussion and Future Work
In this paper I have discussed about a new ageof web and that is semantic web. So howtransformation has been taking palce from HTML toOWL. Here I have discussed various KR of data insemantic web and how current database can beconnected with the futuristic semantic web. Assemantic web is the future web , which will providemeaningful information without wastage of time. Ihave discussed already developed query languagefor semantic search .My future work will be basedon development of query language for joining ofmultiple ontologies and implementation of RDBMSconcepts of constraints etc.
References
• Lee. Berners- T, Hendler .J., and Lassila,.O. , 2001.“The semantic web,” Scientific American, vol. 284,no. 5, pp. 34–43
Shikha Singh
Tecnia Journal of Management Studies Vol. 5 No. 1, April 2010 – September 2010
67
• Lopez.X and Stephens.S,March 2006 “SemanticData Integration for the Enterprise,”. [Online].Available:http://www.oracle.com/technology/tech/semantic technologies/pdf/semantic gridwp 0603.pdf”
• Schreiber.G., Akkermans .H., Anjewierden A.,Hoog de R., Shadbolt .N.,W. V. de Velde, and B.Wielinga, 2000. “Knowledge Engineering andManagement: The Common KADS Methodology”MITpress
• Musen M. A. 1998., “Domain ontologies in softwareengineering: Use of prot´eg´e with the EONarchitecture,” Methods of Information in Medicine,vol. 37, pp. 540–550,
• O´Corcho, A. Go´mez-Pe´rez, M. Ferna´ndez-Lo´pez, and M. Lama, 2003, “ODE-SWS: Asemantic web service development environment,” inProceedings of SWDB’03, The first InternationalWorkshop on SemanticWeb and Database, I. F.Cruz, V. Kashyap, S. Decker, and R. Eckstein,Eds., pp. 203–216.
• Haller A., Cimpian .E., Mocan .A., Oren .E., andBussler .C., 2005 “WSMX - A semantic service-oriented architecture,” in ICWS. IEEE ComputerSociety, , pp. 321–328.
• Knublauch.H., 2004. “Ontology-Driven SoftwareDevelopment in the Context of the Semantic Web:An Example Scenario with Protege/OWL,” 1stInternational Workshop on the Model-DrivenSemantic Web (MDSW2004),
• Brodie.M., Bussler.C., Brujin de J., Fahringer T.,Fensel .D., Hepp .M., Lausen .H., . Roman D,Strang .T., Werthner .H., 2005, “ SemanticallyEnabled Service Oriented Architectures: A Manifestoand a Paradigm Shift in Computer Science,” DERITR-2005-12-26, Tech. Rep..
• Gruber. R. T., , 1993. “A translation approach toportable ontology specifications,”KnowledgeAcquisition, vol. 5, no. 2, pp. 199–220
• Uschold . Gr¨uninger .M. , 2004. “Ontologies andsemantics for seamless connectivity,” SIGMODRecord, vol. 33, no. 4, pp. 58–64
• Dean. M and Schreiber.G., (2004) “OWL WebOntology Language Reference. W3CRecommendation,” World Wide Web ConsortiumLatest version: http://www. w3. org/TR/owl-ref, vol. 7.
• “XML schema part 1: Structures, W3Crecommendation,” W3Consortium, May 2001.[Online].Available: http://www.w3c.org/TR/xmlschema-1/
• Shadbolt .N., Lee.Berners-T., and Hall.W, , 2006.“The semantic web revisited,” IEEE IntelligentSystems, vol. 21, no. 3, pp. 96–101
• Wolstencroft .K., Lord.P., Tabernero .L., Brass.A., and Stevens.R.,2006 “Protein classification usingontology classification,” in ISMB (Supplement ofBioinformatics), pp. 530–538.
• Singh.I., Stearns.B., and Johnson M., June 2002“Designing Enterprise Applications with the J2EEPlatform” Second Edition. Addison- WesleyProfessional,. [Online]. Available: http://java.sun.com/blueprints/guidelines/designingenterprise applications 2e/titlepage.html
• Riehle.D., Tilman.M., and Johnson.R. , October,2000,”Dynamic Object Model,”Proceedings ofPLoP2000. Technical Report# wucs-00-29, Dept.of Computer Science, Washington UniversityDepartment of Computer Science.
• Volkel.M. and. Sure. Y, Nov, 2005.”RDFReactor-from ontologies to programmatic data access,”Proceedings of the International Semantic WebConference- Demo Session, Galway, Ireland,
• Horrocks .I., Patel-Schneider. P., Boley .H., Tabet.S., Grosof .B., and Dean .M., 2004. “SWRL: ASemantic Web Rule Language Combining OWL andRuleML,” W3C Member Submission, vol. 21
• Motik .B. and Sattler .U., November, 2006. “AComparison of Reasoning Techniques for QueryingLarge Description Logic ABoxes,” Proc. of the 13thInternational Conference on Logic forProgramming Artificial Intelligence andReasoning (LPAR 2006), Phnom Penh, Cambodia.
• Tran .T., Cimiano .P., and Ankolekar .A., , 2006.“Rules for an Ontologybased Approach toAdaptation,” in Proceedings of the 1stInternational Workshop on Semantic MediaAdaptation and Personalization, Athen,Greece
• Stefan Decker, Frank van Harmelen , JeenBroekstra Michael Erdmann, Dieter Fensel, IanHorrocks, Michel Klein, Sergey Melnik”TheSemantic Web - on the respective Roles of XMLand RDF”
Semantic Web: Ontology Based Web
Tecnia Journal of Management Studies Vol. 5 No. 1, April 2010 – September 2010
68 Shikha Singh
• Kendall Grant Clark, Lee Feigenbaum “SPARQLProtocol for RDF “ W3C Recommendation15January2008 http://www.w3.org/TR/2008/REC-rdf-sparql-protocol-20080115/
• Cristian Pérez de Laborda and Stefan Conrad“Relational OWL - A Data and SchemaRepresentation Format Based on OWL” ConceptualModelling 2005, Second Asia-Pacific Conferenceon Conceptual Modelling (APCCM2005); pp89-96
Shikha Singh
• Cristian Pérez de Laborda and StefanConrad,2005 “Querying Relational Databases withRDQL”; Berliner XML Tage; pp 161-172
• Semantic Web Activities at the Databases andInformation Systems”Group Dorf - http://www.dbs.cs.uni-duesseldorf.de/RDF/
• Jena : A Semantic Web Framework for Java –”http://jena.sourceforge.net/
• “Relational.OWL - v 0.1 beta” http://dbs.cs.uni-duesseldorf.de/RDF/docs/ROWLApp/
Tecnia Journal of Management Studies Vol. 5 No. 1, April 2010 – September 2010
69
Introduction
A consistently high level of employee motivationand commitment are the key factors in
developing a positive working environment for anybusiness. When a business like that of a BPO, ischaracterized by unusual work hours, never-endingnight shifts; high work targets; repetitive nature ofwork; pressure to work on metrics; non-negotiablemetrics; irate customers and insufficient holidays, itbecomes all the more important and crucial to havemotivated and satisfied employees who can add tothe growing revenues of the company. Employeesmay be satisfied with some aspects of jobs, whilebeing dissatisfied with others. According to Gupta etal. (2008) mounting dissatisfaction among theemployees leads to straining out of motivation in
them, which in turn results in dispirited efficiency,hence their leaving the job. According to Poling(1990), the best predictor of job satisfaction is whenthe employees’ personal values match those of theorganization.
When considering job satisfaction, demographicvariables should be considered to thoroughlycomprehend the possible factors that lead to jobsatisfaction and dissatisfaction. Herzberg, Mausner,Peterson, and Capwell (1957) recognized severalcharacteristics of satisfied/dissatisfied workers. Theyindicated that morale tend to be high when peopleare new in their careers. It then decreases during thenext few years and remains at a relatively low leveluntil workers are in their late twenties or early thirties.At this time, job satisfaction levels begin to escalate;
RELATIONSHIPS AMONG SELECTED DEMOGRAPHIC FACTORS AND
EMPLOYEE SATISFACTION LEVEL IN INDIAN BPOS
Abstract: The BPO industry has always been characterized by ungodlyhours, monotonous job, low perceived value, dispirited efficiencyresulting to high attrition level. Notwithstanding the ever rising attritionrate, it has become critical for the companies to satisfy their employeesin order to retain them. This paper aims at determining what and howdemographic factors are related to the level of employee satisfaction ofthe BPO employees. The study follows a descriptive correlational design.For this a questionnaire was sent to 200 BPO employees to gather data,of which 143 were found usable. Focused group interviews were alsotaken to get the true picture and to support the result from thequantitative analysis done. Based on the data so collected, it was foundthat significant relationship relationships existed between the employeesatisfaction constructs and the demographic factors of gender and age.Other factors like tenure, marital status and income level also had certainrelationship with employee satisfaction. Significant relationships havebeen determined at the p<0.5 level.
Santoshi Sen Gupta*Aayushi Gupta**Vidushi Sandhir***
*Santoshi Sen Gupta – Lecturer and Research Scholar, Professional Development Department in Jaypee Institute of InformationTechnology University, A-10, Sector 62, Noida. Phone: 0120-2590839, 9891062568 Email: [email protected],[email protected]**Dr. Aayushi Gupta – HOD and Asst Professor, Professional Development Department in Jaypee Institute of InformationTechnology University, A-10, Sector 62, Noida. Phone: 0120-2590885, 9811377591 Email: [email protected],[email protected]***Vidushi Sandhir — Student, CSE Branch, Jaypee Institute of Information Technology University, A-10, Sector 62, NoidaEmail: [email protected]
Tecnia Journal of Management Studies Vol. 5 No. 1, April 2010 – September 2010
70 Santoshi Sen Gupta, Aayushi Gupta and Vidushi Sandhir
and continues to rise through the remaining years ofan employee’s career. The same trend is found inregard to a worker’s length of service. Workers beginwith high morale, which drops during the first yearand remains low for a number of years. Then aslength of service increases, job satisfaction levels tendto rise. Especially when we talk of a firm like that ofa BPO, it becomes all the more important to reviewthe environment in which it grows. According toBudhwar et al, the Indian BPO industry’s focus wason creating a well-built and steadfast platform, usingtechnology as a selling point, thus cashing on thesuccess of the Indian software industry of the late1990s. In such a case, where BPO jobs were beingsold like hot cakes, a special scrutiny of thedemographic profile of the employees became theneed of the hour.
Concerning gender, there are no simpleconclusions about the differences between males andfemales and their job satisfaction levels. Some studiesreviewed by Herzberg et al. (1957) indicate that malesare more satisfied with their jobs, while othersindicate that females are more satisfied. There wasn’tmuch clarity in the relationships between satisfactionlevel and education also. Furthermore, these studiesshowed that workers with more education have ahigher job satisfaction level, while other studiesindicate that workers with more education have alower job satisfaction level. Other studies showed norelationship between the two. Herzberg et al. (1957)suggested that a clear conclusion cannot be drawnconcerning job satisfaction and its relationship tomarital status, number of dependents, number ofprevious occupations, or ethnicity.
In a research study done on Wal-Mart employeesabout employee satisfaction, it was seen that therewere three major predictors of job satisfaction:thinking all employees are treated equally by theirboss, sex (females were more satisfied than males),and employees seeing themselves having a future intheir present job. Factors hypothesized to besignificant predictors of job satisfaction, such aseducation level and age, did not turn out to besignificant at all. A similar study was done onagricultural education teachers in Ohio, Cano andMiller (1992b) found that the teacher’s age, years incurrent position, total years teaching, and degreestatus were not significantly related to overall jobsatisfaction. In general, both males and females wereequally satisfied with their jobs. These findings arequite similar to a later study of the same nature by
Castillo, Conklin, and Cano (1999). The findings fromthese two studies (Cano & Miller, 1992b; Castillo etal., 1999) implied that older or younger teachers werenot necessarily more or less satisfied with their jobs.In addition to this, the tenure of the teachers had apositive impact on job satisfaction. The longer ateacher remained in the profession the less was theimpact on the overall job satisfaction level. A studydone by Scott et al, (2005) on Extension Agentsshowed low relationships between gender and jobsatisfaction constructs which included growthsatisfaction, job security satisfaction and satisfactionwith pay. It further stated that other demographicfactors like age, marital status and education werenot related to any of the job satisfaction constructsfor Extension agents.
A study was done on academic professionals intertiary institutions in Zimbabwe to determine thefactors affecting job satisfaction. Among the variousdemographic factors, gender, number of dependentsand tenure were considered. According toChimanikire et al, (2007) the probability of jobsatisfaction is lower for females than male employees.The value for the job status of the respondents in thisstudy implied that employees with permanent postswere more satisfied with their jobs than those withtemporary posts. It even stated that job satisfactionincreases in the presence of a satisfactory income.Less experienced lecturers were more likely to besatisfied than those with greater work experience. Inthe same study it was revealed that the salary variableis statistically significant for job satisfaction. Lecturerswith higher salary tend to be more satisfied withtheir jobs than those who draw lower salaries. Thiswas consistent with Sur et al (2004) study of tourismemployees in Turkey who pointed out that incomewas an essential factor affecting job satisfaction. Italso stated that probability of job satisfaction is lowerfor females than male employees. Previousresearchers such as Varca et al. (1983) found out thatat higher occupational levels, men showed greatersatisfaction because of greater opportunities fordevelopment.
In a study done by Hallock et al. (2004), todetermine the possible demographic and attitudinalcorrelates of employee satisfaction with an ESOP, itwas revealed that there was not a considerably strongrelationship between employee demographics likeage, educational level, job salary, job satisfaction, jobclassification and supervisory responsibility andemployees’ satisfaction with the ESOP. Certain
Tecnia Journal of Management Studies Vol. 5 No. 1, April 2010 – September 2010
71
employee demographics are positively associatedwith employee satisfaction with the ESOP. Age andjob tenure are significantly correlated with ESOPsatisfaction whereas education and ESOP satisfactionhas a significant negative correlation.
However, the literature is quite divergent anddiverse. Some studies indicate that there is a bleakrelationship between gender and employeesatisfaction whereas some studies show stringconclusions about females having higher satisfactionthan males or vice versa. Besides gender, there isalso quite diversity in the conclusions drawn byvarious researchers on the parameters ofdemographic factors and their correlation withemployee satisfaction. Factors like age, marital status,qualification and salary have unlike correlations.
Purpose and Objectives
The purpose of this study was to determine whatdemographic factors were related to the level of jobsatisfaction of BPO employees. The specificdemographic factors addressed in this study were:
� Gender� Age� Marital status� Educational Qualification� Tenure� Income Level
Methods and Procedures
Population
The population for this descriptive correlationalstudy was all BPO employees employed in the BPOsector in Noida. (N = 143). This included agents atthe job floor.
Instrumentation
BPO agents’ level of job satisfaction was obtainedutilizing a questionnaire specifically designed forextracting information about demographics of therespondents and their level of job satisfaction. Theage was boxed in four brackets i.e. 18 to 24, 24 to 28,28 to 32 and 32 and above. Statements were rated ona 5-point rating scale ranging from strongly disagreeto strongly agree. These were used to measure thevarious aspects of job satisfaction. These includedsix major factors which affect the level of jobsatisfaction for an individual. The factors include
nature of job, company culture, security and growth,relationship with colleagues, Salary and other relatedHR Policies, and Supervision. We limited our studyto only three of the factors and named them assatisfaction constructs. They were job securitysatisfaction, growth satisfaction, and pay satisfaction.
Data Collection
Data was collected from 200 BPO employees inNoida region. Of the 200 invited to participate in thestudy, 187 responded to the survey for an overallresponse rate of 93.5%. Due to incomplete data orparticipants choosing not to participate, 143 surveyswere usable, making the final usable response rate71.5%.
Data Analysis
Data were analyzed using the Statistical Packagefor the Social Sciences (SPSS® Version 16.0 forWindows). Descriptive statistics, including means andstandard deviations, were used to summarize thedata. Frequencies and percentages were reported forthe demographic data. Means and standarddeviations were computed for the job satisfactionconstructs. Pointbiserial correlation coefficients (rpb)were calculated to determine the relationshipsbetween the job satisfaction constructs and gender,race, marital status and his tenure. Significantrelationships were determined with an a priori alphalevel of .05.
Results
Population Description
Descriptive Statistics was used to analyze thedemographic pattern of the sample size. As reportedin Table 1, the age of the respondents varied from 19years to 34 years and the mean came out to be 23.75,with standard deviation as 3.905. Since most of therespondents hailed from middle level, their salariesdid not have much of a range. The mean salary was2.17 lakhs per annum. Another important criteriaselected in the demographic profile was the tenureof the employees; and the result showed 13.69 monthsas the average period of stay in this organization.
Age
Low significant relationships were found betweenage and satisfaction with job security (rpb = .023),and satisfaction with pay (rpb = .060). There was a
Relationships Among Selected Demographic Factors and Employee Satisfaction Level in Indian BPOs
Tecnia Journal of Management Studies Vol. 5 No. 1, April 2010 – September 2010
72
considerable relation between growth satisfaction andage. After examining the scatter plots for therelationships between age and these three constructs,it was found that employees within the age bracketof 18 and 21 rated growth satisfaction, satisfactionwith job security, and satisfaction with pay higherthan the ones whose age were more than 25. Themean for the first age bracket (18-22) was 444.84 outof 600; for the second age bracket (22-26) it was 439.76,for the third one (26-30) it was 426.55 and for the lastbracket (30-34) it was 424.52.
Gender
Low significant relationships were found betweengender and growth satisfaction (rpb =.17), satisfactionwith job security (rpb = .00864), and satisfaction withpay (rpb = .183). After examining the scatter plotsfor the relationships between gender and these threejob satisfaction constructs, it was found that femalesrated growth satisfaction, satisfaction with jobsecurity, and satisfaction with pay higher than males.
Marital Status
No significant relationships were found betweenmarital status and the job satisfaction constructs.Neither of the two statuses i.e. married and singlehad any considerable relationship with job security
(rpb = -0.104), growth (rpb = -0.313) and paysatisfaction (rpb = .282). However, the relationshipsbetween marital status and total job satisfactionshowed a higher mean in case of single employees.
Education
Again, no significant relationships were foundbetween the demographic factor and the jobsatisfaction constructs. The only low relationshipfound was between education and satisfaction withpay (rs = -.068). All other relationships werenegligible.
Tenure
Relationships were found between tenure andthe job satisfaction constructs. All relationships werenegligible, except for the significant relationship withsatisfaction with growth (rpb = .10).
Income Level
The relationships which were found between theincome level and three job satisfaction constructs werenot much of significance. The relationship betweenincome level and job security satisfaction wasconsiderable (rpb = .22), and satisfaction derived frompay (rpb = .28) but was negligible in case of growthsatisfaction (rpb = .012).
Descriptive Statistics
N Minimum Maximum Mean Std. VarianceDeviation
Age 143 19 34 23.75 3.905 15.246
Current Salary 143 1.35 3.50 2.1717 .50234 .252
Months since Hire 143 8 25 13.69 4.591 21.074
Table 2: Average Job Satisfaction (on 600)
Age Gender Marital Status Income Qualification Tenure
18-22 444.84 Male 428.47 Single 440.23 1lac-2lac 440.345 12+ 449.7 0-1 437.87
22-26 439.76 Female 449.92 Married 427.46 2lac-3lac 435.18 Graduate 436.95 1 to 3 445.51
26-31 426.55 3lac-4lac 434.17 Post 417.65 3 to 5 NotGraduate Available
31-35 424.53 More Not more Notthan 4 lac Available than 5 Available
Santoshi Sen Gupta, Aayushi Gupta and Vidushi Sandhir
Tecnia Journal of Management Studies Vol. 5 No. 1, April 2010 – September 2010
73
As evident from Table 2, clear findings can beconcluded about average job satisfaction among theBPO employees in various categories underdemographic features. Highest JS was seen in theage bracket of 18 – 22. Females showed more JS thanmales in various constructs. Single employees tendto be more satisfied with their jobs as compared tomarried ones. This finding was further supportedwith some firsthand information as received fromthe respondents that married employees come withmore expectations in salaries and challenges in jobprofile. Therefore, the single employees showed moresatisfaction with their jobs than the married ones.Another interesting fact that was revealed from thisstudy that the employees within the salary bracketof 2-3 lac showed maximum job satisfaction. As thesalary increased, their expectations from the jobprofile, the designation, crave for recognition alsoexpands, which ultimately leads to decrease in jobsatisfaction. BPO was always marketed as a lowprofile job, wherein people with average qualification,graduates, undergraduates and even post graduatesare associated with it. Maximum satisfaction wasshown by employees who are under graduates. Thereason is simple, with the increase in qualification,demands for better salaries and more challenging jobsalso increase, thus job satisfaction is crippled becauseof many extrinsic and intrinsic factors. And finally,employees with 1-3years of tenure in the presentorganization showed maximum job satisfaction. Welltalking of job satisfaction also reminds us of thevarious factors that mount to job dissatisfaction.Minimizing these factors, may also assist in increasingthe score of job satisfaction. Other set of reasonsidentified for job dissatisfaction in BPOs, is the lackof recognition, incongruity with the culture ordirection of the company, lack of stimulation aboutthe growth prospects, poor relationships with co-workers and also unfair treatment by their boss(Mishra, 2007).
Conclusions
The results of this study can only be inferred tothis specific BPO firm in Noida. Low relationshipswere observed between gender and the jobsatisfaction constructs of growth satisfaction,satisfaction with job security, and satisfaction withpay. Females rated all three of these constructs higherthan males, indicating a higher level of satisfactionwith personal learning and growth opportunities atwork, job security, and compensation. Previous
studies have shown similar findings (Bowen et al.,1994; Riggs & Beus, 1993). However, even thoughthe literature indicates a relationship between genderand job satisfaction, some studies are inconclusiveregarding whether males or females are more satisfied(Herzberg et al., 1957). In contrast, other studies haveshown that gender is not related to job satisfaction(Cano & Miller, 1992a; Cano & Miller, 1992b; Castillo& Cano, 1999; Castillo et al., 1999; Nestor & Leary,2000).
Age was not related to any of the job satisfactionconstructs for this set of BPO employees. Thisconclusion is consistent with other studies (Andrews,1990; Cano & Miller, 1992a; Cano & Miller, 1992b;Castillo & Cano, 1999; Castillo et al., 1999). However,several studies have shown a relationship betweenage and job satisfaction, indicating that older workersare more satisfied with their jobs than youngerworkers.
Marital status was not strongly related to any ofthe job satisfaction constructs for them. However,single employees showed more job satisfaction thanthe ones who are married. Several studies have showna relationship between marital status and jobsatisfaction, indicating that married agents are moresatisfied with their jobs than singles.
Education was not significantly related to any ofthe job satisfaction constructs for BPO agents. Otherresearchers have found this same conclusion (Cano& Miller, 1992a; Cano & Miller, 1992b; Castillo &Cano, 1999; Castillo et al., 1999; Herzberg et al., 1957).However, the literature does indicate a relationshipbetween education and job satisfaction, even thoughstudies are inconclusive regarding whether or notworkers increase or decrease their job satisfactionwhen they increase their educational level (Herzberget al., 1957). Even so, some studies do indicate thatincreasing one’s educational level increases his or herlevel of job satisfaction (Andrews, 1990; Berns, 1989).
This study is only specific to one big BPO firm inNoida. Though the results can be induced genericallyfor the entire whole industry, yet special care needto be taken of certain environmental factors that affecta business. The results can be utilized to design thework, training, compensation, career graph and jobprofile of the employees based on their demographicfactors. This study need to be replicated time andagain so as to infer the latest trends as such behavioralpractices are majorly influenced by attitudes, thoughtsand societal trends.
Relationships Among Selected Demographic Factors and Employee Satisfaction Level in Indian BPOs
Tecnia Journal of Management Studies Vol. 5 No. 1, April 2010 – September 2010
74
References
• Budhwar, P, Luthar, H. and Bhatnagar, J (2006)“The Dynamics of HRM Systems in Indian BPOFirms.” Journal of Labor Research Vol. XXVII,No. 3
• Cano, J., & Miller, G. (1992a). An analysis of jobsatisfaction and job satisfier factors 0among sixtaxonomies of agricultural education teachers[Electronic version]. Journal of AgriculturalEducation, 33(4), 9-16
• Cano, J., & Miller, G. (1992b). “A gender analysisof job satisfaction, job satisfier factors, and jobdissatisfier factors of agricultural education teachers”[Electronic version]. Journal of AgriculturalEducation, 33(3), 40-46.
• Castillo, J. X., & Cano, J. (1999). “A comparativeanalysis of Ohio agriculture teachers’ level of jobsatisfaction” [Electronic version]. Journal ofAgricultural Education, 40(4), 67-76.
• Herzberg, F., Mausner, B., Peterson, R. O., &Capwell, D. F. (1957). Job attitudes:Review of
research and opinion. Pittsburgh, PA: PsychologicalService of Pittsburgh.
• Mehta, A. et al. (2006) “Challenges and opportunitiesof Business Process Outsourcing in India.” Journalof Labor Research Vol. XXVII, 3.
• Misra, P. (2007) “Increasing Rate of Attrition inBPO.” Management and Labor Studies Vol. 32,1.
• Poling, R. L. (1990). Factors associated with jobsatisfaction of faculty members at a land-grantuniversity (Doctoral dissertation, The Ohio StateUniversity, 1990). Summary of Research in Extension,5, 143.
• Scott M, Swortzel K., Taylor W, (2005) TheRelationships between selected demographic factorsand the level of job satisfaction of Extension AgentsJournal of Southern Agricultural Education researchVolume 55, Number 1
• Sen Gupta, S and Gupta, A (2008) “Vicious Circleof Attrition in the BPO Industry” The Icfai Journalof Organizational Behavior Vol. VII No. 2.
Santoshi Sen Gupta, Aayushi Gupta and Vidushi Sandhir
Tecnia Journal of Management Studies Vol. 5 No. 1, April 2010 – September 2010
75
WOMEN INVESTORS’ PERCEPTION TOWARDS ONLINE TRADING IN
TAMILNADU WITH SPECIAL REFERENCE TO COIMBATORE DISTRICT
Abstract: A good financial system provides the intermediation betweensavers and investors and promotes faster economic development. Aninvestment share requires a careful evaluation of factors related to theeconomy, industry and the company. This analysis is called fundamentalanalysis. An investor is surrounded by many factors in her considerationof making investments. She is interested in liquidity of her assets. Sheis also interested by the fact that there is an increasing number ofwomen working in the organization. 1. To identify the demographicprofile of women investors. 2. To identify the factors influencing thewomen investors while making investment. 3, To suggest suitablemeasure to protect the interest of women investors. In this study theresearcher used Descriptive research, which is concerned withdescribing the characteristics of a particular individual or of a group.The primary data’s have been collected from women investors. The data’swere collected using interview schedule method. The interview schedulefor women investors is prepared in such a way that they are able toexpress their opinions freely and frankly. In this research researcherhas selected Coimbatore District. There are many sample designs fromwhich the researcher chooses in this study Convenience Samplingdesign. In order to find out association between factors associated withfinancial decision-making of women investors, two-way table accordingto their factor group was framed. Chi-square test is applied to them tofind out the association between the selected variables and financialdecision-making perception of women investors. The data collected isbased on the questionnaire the results of which will vary according tothe opinions of individuals. The study is based upon prevailing investor’sbehaviour. The women investor may change according to time, fashion,technology, development etc. It could be seen from this that the calculatedvalue is less than the table value at 5% level thus the null hypothesisis accepted. Hence it is clear that there is no association between savingsper month and time taken for investment decision. Basic knowledgemust be given to the investors about all types of investment; so that theinvestor can make a better choice that best suits their investment plan.
N. Kathirvel*A. Mekala**
*Dr. N. Kathirvel, Associate Professor, Department of Management, Karpagam University, Coimbatore 21 Mobile No. 9442735283E-mail [email protected]
Tecnia Journal of Management Studies Vol. 5 No. 1, April 2010 – September 2010
76
Introduction
The emerging economic environment ofcompetitive markets signifying customer’s
sovereignty has profound implications for the savingsand their investment in India. Investment means aperson’s commitment of funds towards his futurelife. It is an economic activity. It refers to acquisitionof assets which generates income. It means thediversification of money towards investment andthereby increasing productivity of a nation.Investment means parking of one’s idle funds inincome generating assets.
The term investment refers to funds invested invarious securities, consisting of Government andSemi-Government securities, Loans, Debentures ofLocal authorities, such as Port Trusts, MunicipalCorporations and debentures and shares anddebentures of companies. Investments represent legalclaims of various securities, such as Bonds, shares,Debentures etc., and are assets of special nature.Investments are freely bought and sold in the stockexchange through banks and brokers, who charge asmall amount of commission for their services. Aninvestment means the use of money to earn moremoney by way of interest, dividend or capitalappreciation. Well planned investment alone canensure regular income, capital appreciation and canbe used to meet the financial requirements ofinvestors. The dynamics of economic growth providevarious opportunities for investors to invest theirmoney in different types of securities.
Now, the present women, who is equallyemployed, through their education have knowledgeabout various aspects of investment and as a resultthey invest in various investment avenues such asshares, debentures, mutual funds and bank deposits.
Indian savings market has been expanding overthe period and there is a steady increase of householdsavings. Moreover, general profile of womeninvestors is changing in tune with time. But they lagin various spheres of investment such as awarenessand preference of investment. So, attempt has beenmade by the researcher to identify the factorsinfluencing women investors’ perception to evaluatethe level of awareness among women investors andto analyse the preference of women investor towardsvarious investment outlets
Since 1951, the Indian capital market has beenbroadening slowly. The volume of savings and
investments, have started showing steadyimprovement. Many types of encouragement and taxrelief exist in the country to promote savings. Severalsteps have been taken to protect the interest ofinvestors. An important indicator in the growth ofcapital market is the growth of joint stock companiesand corporate enterprises.
One of the notable features of development ofIndian capital market in the 1990’s has been thegrowth in the number of investors. Estimates aboutthe investors’ population vary from 22 million to 40million. An important indicator in the growth ofcapital market is the growth of joint stock companiesand corporate enterprises. As on 31-3-98 there weremore than 2,00,000 companies with a paid up capitalof nearly Rs.1,37,959 crores and every upward trendin the market brought new investors. Similarly downtrends have driven away the investors. The currentscenario in the new issue market is an example ofincreasing apathy of investors. It is stated that theknowledge of investors about stock market suffereddue to the indiscrect decision made by them.
Statement of the Problem
An investor is surrounded by many factors inher consideration of making investments. She isinterested in liquidity of her assets. She is alsointerested by the fact that there is an increasingnumber of women ready to invest in online sharetrading. Increase in working population properplanning for life span and longevity have ensuredthe need for balanced investments. The investor mustbe careful in determining their investment channels.This study is conducted to discover the factorsassociated with financial decision making of womeninvestors. How much amount is invested? And whatchannels are selected to invest the funds? What factorsare involved? And how much time is taken fordecision making?
Review of Related Literature
Shanmugam. R and S.P. Muthuswamy (1998)conducted a study titled “Decision Process andindividual investment”. In their study they statedthat the time spent on investment analyses isinadequate. Moreover, the investors in shares aremainly from salaried group, young and mostly firstgeneration investors. Time is an important factorsassociated with the financial decision making ofinvestors. They also stated that the share selection is
Dr. N. Kathirvel and A. Mekala
Tecnia Journal of Management Studies Vol. 5 No. 1, April 2010 – September 2010
77
not sophisticated.
A study of middle class investors preferences forfinancial instrument in greater Bombay by P.K.Bandgar (2000) stated that most of the femaleinvestors also prefer to invest in risky securities forfuture investments as compared to male investors.More over the female investors were highly educatedas compared to male investors. The study revealedthe middle class investors in Bombay have highermonthly income than male investors.
Re-Positioning A Leading Stock Broker KintDorwin (1988) in his study, the strategic manner ofthe largest American discount security broker,describes how a comparatively young firm took stepsto reposition itself in the market so as not to be caughtunaware by the problems of encroaching maturity.The lessons of the exercise are; listen to the customer,examine the competition and stake out the groundyou intend to hold in the future.
Merging Service Quality And Service Satisfaction– An Empirical Test Of An Integrative Model Ko deRuyter, Jose Bloemer and Pascal Peeters (1997) intheir study, Recent research linking service qualityand service satisfaction has raised issues whichrequire conceptual and empirical elaboration. Amongthese are conceptual overlap as well as distinctionsbetween these two customer judgments, the role ofexpectations and perceptions and questions whetherservice satisfaction is super ordinate concept qualityor vice versa. In this article, an integrative model ispresented in which both concepts and theirantecedents are delineated on the basis of conceptualadvances made in the services marketing literaturerecently.
Share trading On The Web: A ComprehensiveReview Of Design Specification Across The GlobeRobert Hudson, Kevin Keasey and Kevin Lttler (2000)in their study, they had given rapid increase, overthe past couple of years, of share dealing servicesavailable on the web. This paper describes thefindings of a research study into the designspecifications of web- based share trading sites. Thepurpose of the research is to highlight the key featuresof net trading sites across the globe and to identifybest of breed examples of the features. The researchis based on the latest available literature and a reviewof the majority of sites across the globe. With thisbackground in mind, the paper offers the firstcomprehensive review of the type of features thatare available on net trading sites across the globe.
Objectives
1. To identify Demographic profile of womeninvestors
2. To identify the factors influencing the womeninvestors while making investment.
3. To give the suggestions to women investors toimprove the quantity of the investment.
Research Design
Research design constitutes the blue print ofcollection, measures and analysis of data. In specificterms, a research design is the arrangement ofconditions for collection and analysis of data in amanner that aims to combine relevance to the researchprose with economy in procedure. Here in this studythe researcher used Descriptive research, which isconcerned with describing the characteristics of aparticular individual or of a group.
Sources of Data: The study has used onlyprimary data. The primary data have been collectedfrom women investors. The data were collected usinginterview schedule method. The interview schedulefor women investors is prepared in such a way thatthey are able to express their opinions freely andfrankly.
Secondary Data: Secondary data here has beencollected from newspapers, magazines, websites andgeneral discussion with local muncipal governmentofficials.
Sampling Design: Type of universe: The firststep in developing any sample design is to clearlydefine the set of objects, technically called theUniverse, to be studied. The universe can be finite orinfinite. In finite universe the number of items iscertain, but in case of an infinite universe the numberof items is infinite i.e., we cannot have any idea aboutthe total number of women investors
Sampling Unit: A decision has to be takenconcerning a sampling unit before selecting sample.Sampling unit may be geographical one such as state,district, village, etc., In this research researcher hasselected coimbatore District.
Source List: It is also known as ‘sampling frame’from which sample is to be drawn. It contains thenames of all items of a universe. In this study sourcelist not available, researcher has to prepare it. EachTaluk has selected 30 women investors. Five taluk
Women Investors’ Perception Towards Online Trading inTamilnadu with Special Reference to Coimbatore District
Tecnia Journal of Management Studies Vol. 5 No. 1, April 2010 – September 2010
78
viz., Pollachi, Udumalai, Coimbatore North,Coimbatore south and Mettupalayam
Size of Sample: This refers to the number ofitems to be selected from the universe to constitutea sample the size of sample should neither beexcessively large, nor too small. It should beoptimum. An optimum sample is one which fulfillsthe requirements of efficiency, representative ness,reliability and flexibility. As such, budgetaryconstraint must invariably be taken into considerationwhen we decide the sample size as 150.
Parameters of interest: In determining the sampledesign, one must consider the question of the specificpopulation parameters which are of interest. In thisstudy it is Women investors.
Budgetary constraint: Cost considerations, frompractical point of view, have a major impact upondecision relation to not only the size of the samplebut also to the type of sample. This fact can evenlead to use of this study, non- Probability sample.
Sampling procedure: Finally, the researcher mustdecide the type of sample he will use i.e. he mustdecide about the technique to be used in selectingthe items for the sample. There are many sampledesigns from which a researcher chooses in this studyConvenience Sampling design.
Statistical Tools and Techniques
The collected data have been analysed with thehelp of tools like simple percentage method and Chi-square test.
Simple Percentage Method
Simple percentage analysis refers to a ratio. Withthe help of absolute figures it will be difficult tointerpret any meaning from the collected data, butwhen percentages are found out then it becomes easyto find the relative difference between two or moreattributes.
No. of RespondentsPercentage = —————————————— × 100
Total Number of Respondents
Chi-Square
Chi-Square Test is an important test among theseveral tests of significance. Chi-Square issymbolically written as χ2 (pronounced as Ki Square).
It is a statistical measure used in the context ofsampling analysis for comparing a variance to atheoretical variance.
Chi square test enables us to explain whether ornot two attributes are associated. Chi- square iscalculated as follows,
Oij = observed frequency of the cell in the ith rowand jth column.
Eij = expected frequency of the cell in the ith row andjth column.
As a non parametric test it can be used todetermine a categorical data. It is used to make acomparison between theoretical population andactual data.
Degree of freedom plays an important part inusing the chi-square distribution and tests are basedon it. The degree of freedom is worked out as follows
d.f = (c-1) (r-1)
where ‘c’ means number of columns and ‘r’ meansnumber of rows.
Variable
Independent Variable: Time taken for investmentmaking decisions
Dependent Variable: Age, Marital status, Educationalqualification, Occupation, Monthly Income, Status inthe family, family members, Number of dependents,Family income, Savings, etc.
Hypotheses
In tune with the objectives of the study, thefollowing hypothesis has been framed.
1. There exists no association between age and timetaken for investment decision.
2. Marital status does not influence the timeconsumption for investment decision.
3. There is no association between Educationalqualification and time taken by investor forinvestment decision
Dr. N. Kathirvel and A. Mekala
Tecnia Journal of Management Studies Vol. 5 No. 1, April 2010 – September 2010
79
4. Occupation does not influence time consumptionfor investment decision.
5. There is no association between monthly incomeand time taken for investment decision
6. Status in the family does not influence the timetaken by investor for investment decision.
7. There is no association between family membersand time taken for investment decision.
8. Number of dependents does not influence timeconsumption for investment decision
9. Family income per month does not influencetime consumption for investment decision
10. Savings per month does not influence timeconsumption for investment decision.
Limitations of the Study
The analysis of the present study has been carriedout based on the information collected from theinvestors who are residing at Coimbatore districtalone. The data collected is based on thequestionnaire, the results will vary according to theopinions of individuals. The study is based uponprevailing investor’s behaviour. The women investormay change according to time, fashion, technology,development etc.
Women Investors Profile
The profile of women respondents have beengrouped into investors’ profile and investmentprofile. For the purpose of this study, the age ofwomen respondents has been classified into threecategories namely those whose age is below 30,between 31 and 40 years and those who are above41 years treated as young , middle and oldcategory respectively. With regard to formaleducation, the sample women investors have beenclassified into three categories namely school,graduation, post graduation and professionalcategory. The sample women investors wereinvolved in various occupation like Agriculture,Business, professional, Employed, Unemployed.On the basis of their marital status, sample womeninvestors have also been classified and studied intwo groups such as married and un married. Inrespect of monthly income, the womenrespondents have been classified into three level
namely low (below Rs. 10,000), middle (betweenRs. 10001 and Rs.20,000) and high (aboveRs.20,001).
Investment Profile
Investment related variables include age,income, educational qualification, number offamily members, number of dependents,occupation of the respondents and savings of therespondents, they are dependent variables in thisstudy. Time taken for making investment decision(with in hour, within week, within few days andmore than a week). In this study mentionedinvestment means online trading. General profileof women investors is changing in tune with time.But they lag in various spheres of investment suchas awareness and preference of investment. So, anattempt has been made by the researchers toidentify the factors influencing women investors’behaviour to evaluate the time taken for theinvestment decision.
Table 1: Age group of the respondents
Age No. of the Percentagerespondents of the
respondents
Up to 30 58 39
31-40 54 36
Above 41 38 25
Total 150 100
Source: Primary Data.
From the Above table no. 1 age of therespondents reveals that the majority 39 percent ofthe respondents belong to up to 30 years age group,followed by 36 percent of the respondents belong to31 -40 years of age, 25 percent of the respondents areabove 41.
H0: Null Hypothesis
There exists no association between age and timetaken for investment decision.
H1: Alternative hypothesis
There exists association between age and timetaken for investment decision.
Women Investors’ Perception Towards Online Trading inTamilnadu with Special Reference to Coimbatore District
Tecnia Journal of Management Studies Vol. 5 No. 1, April 2010 – September 2010
80
Table 1.1: Age of the respondents and time takenfor making investment decision
Age Within Within Within More TotalHour Few Week Than
Days A Week
Up to 30 9 12 29 8 58
31-40 9 13 27 5 54
Above 41 16 9 11 2 38
Total 34 34 67 15 150
Source: Primary Data
This table shows the association between age andthe time taken by investor to make investmentdecision. There are 58 investors whose age is up to30. Out of 58 respondents, 9 of them take investmentdecision within an hour, 29 of them are takinginvestment decision within a week. 12 of them takingdecision within few days and 8 of them take morethan a week to make investment decision. Likewise,out of 54 respondents, 27 of the investors takedecision within a week. 13 of them take decisionwithin few days 9 of them take decision within hourand 5 of them make more than a week to takeinvestment decision.
Similarly, out of 38 respondents 16 of them takeinvestment decision within an hour, 9 of them takedecision within a few days, 2 of them take more thana week to take investment decision and 11 of themmake a decision within a week.
Table 1.1.a
Factor Chi-square DF Significance
Age Calculated Table 6 5%
14.4 12.6
Source: Primary data
From the table it is clear that as the calculated ëvalues more than the table value at 5% level, the nullhypothesis is rejected. Hence it could be inferred thatthere exists an association between age and time takenfor investment decision.
Table 2: Marital status of the respondent
Marital No. of the Percentage ofstatus respondents the respondents
Married 105 70
Unmarried 45 30
150 100
Source: Primary Data.
From the Above table no.2, marital status of therespondents reveals that the majority 70 percent ofthe respondents belong to Married, followed by 30percent of the respondents belong to Unmarried.
H0: Null Hypothesis
Marital status does not influence the timeconsumption for investment decision
H1: Alternative hypothesis
Marital status influence the time consumptionfor investment decision
Table 2.1: Marital Status vs Time Taken
Marital Within Within Within More Totalstatus hour few week than a
days week
Married 30 23 44 8 105
unmarried 4 11 23 7 45
Total 34 34 67 15 150
Source: Primary data
This table exhibits the association betweenmarital status of investors and the time taken forinvestment decision. From the unmarried group,there are 45 investors, 4 of them take decisionwithin an hour. 11 of them take decision within afew days, 23 of them take decision within a weekand 7 investors who take more than a week tomake investment decisions fall under third group.In the married sector there are 105 investors, outof them 44 take decision within a week, 30 of themare taking decision within a hour, 23 of them aretaking decision within a few days and 8 of themare taking more than a week to take investmentdecisions.
Dr. N. Kathirvel and A. Mekala
Tecnia Journal of Management Studies Vol. 5 No. 1, April 2010 – September 2010
81
Table 2.1.a
Factor Chi-square DF Significance
Marital Calculated Table 6 5%Status
8.06 7.81
Source: Primary data
It is clear from the table that the calculated ëvalue is more than the table value at 5 % level, thenull hypotheses is thus rejected. Hence it could beinferred that there exhibits an association betweenmarital status and the time taken for investmentdecision.
Table 3: Educational Qualification of therespondents
Educational No. of the Percentage ofqualification respondents the respondents
Up to HSC 17 11
UG 48 32
PG 74 49
Professional 11 8
Total 150 100
Source: Primary Data.
The above table shows that 49 percent of therespondents are belonging to PG Qualificationfollowed by 32 percent of the respondentsbelonging to UG qualification, 11 percent of therespondents belonging to Up to HSC and 8 percentof the respondents belonging to professionalqualification.
H0: Null Hypothesis
There is no association between Educationalqualification and time taken by investor forinvestment decision
H1: Alternative hypothesis
There is association between Educationalqualification and time taken by investor forinvestment decision
Table 3.1: Educational qualification and time takenfor investment decision
Educational Within Within Within More Totalqualification hour few week than a
This table exhibits the association betweeneducational qualification and time taken by theinvestor for investment decision. Out of 74 investorswho are post graduates, 10 of them take investmentdecision within an hour, 21 of them take investmentdecision within a few days and 34 of them decidetheir investment channels within a week and 9 of theinvestors takes more than a week to decide theirchannels. Similarly, out of 11 investors, 2 of themdecide their investment channels within an hour.Only one investor takes decision within a few days.5 of them make decision within a week and only 3 ofthem take more than a week to take investmentdecision.
Table 3.1.a
Factor Chi-square DF Significance
Edcuational Calculated Table 6 5%status
23.2 23.6
Source: Primary data
It is shown from the table as calculated ë valueis less than the table value at 5% level, the nullhypothesis is accepted. Hence it could be inferredthat there is a association between educationalqualification and time taken by the investmentdecision.
Table 4:
Occupation No. of the Percentage ofrespondents the respondents
Agriculture 5 3
Business 22 15
Professional 11 7
Employed 104 70
Unemployed 8 5
Total 150 100
Source: Primary Data.
Women Investors’ Perception Towards Online Trading inTamilnadu with Special Reference to Coimbatore District
Tecnia Journal of Management Studies Vol. 5 No. 1, April 2010 – September 2010
82
The above table shows that 70 percent of therespondents are employed followed by 15 percent ofthe respondents who are in business, 7 percent of therespondents who are professionals, 5 percent of therespondents who are unemployed and 3 per cent ofthe respondents who are in Agriculture.
H0: Null Hypothesis
Occupation does not influence time consumptionfor investment decision.
H1: Alternative hypothesis
Occupation influence time consumption forinvestment decision.
Table 4.1: Occupational status for time takenmaking investment deicision
Occupation Within With in With in More totalhour few week than a
To study the association between occupation andthe time taken for investment decision, the totalinvestors are broadly classified in to five groups.
In the business group, there are 22 investors, 6 ofthe investor takes investment decision within hour, 7of the investors takes decision within few days 9 ofthe investors decide their investment channels withina week. None of them takes more than a week todecide their channels.
In the employed group, there are 104 investors,21 of them takes investment decision within hour 25of them takes investment decision within few days.46 of them decide their investment channels withina week. 12 of the investors takes more than a weekto decide their investment channels.
Table 4.1.a
Factor Chi-square DF Significance
Occupation Calculated Table 6 5%
16.3 28.3
Source: Primary data
From the above table it is clear that as thecalculated ë value is less than table value at 5% levelthe null hypotheses is accepted. Hence it could beclear that there is no association between occupationand time taken for investment decision.
Table 5:
Monthly No. of the Percentage ofIncome respondents the respondents
Upto Rs.10000 110 73
10,001 to 20,000 31 21
Above 20001 9 6
Total 150 100
Source: Primary Data.
From the above table shows that the 73 percentof the respondents are monthly Income up to 10,000,21 percent of the respondents are belong to 10,001 to20,000 and 6 percent of the respondents are above20,001.
H0: Null Hypothesis
There is no association between monthly incomeand time taken for investment decision
H1: Alternative hypothesis
There is association between monthly income andtime taken for investment decision
Table 5.1: Monthly income and time taken forinvestment decision
Monthly Within Within Within More Totalincome hour few week than a
days week
Up to Rs.10,000 24 22 52 12 110Rs.10,000-Rs.20,000 10 10 10 1 31Above Rs.20,001 0 2 5 2 9
34 34 67 15 150
This table shows the association betweeninvestors monthly income and time consumption formaking investment decision.. Out of 110 investors,24 investors take investment decision within an hour,22 of them decide their channels within a few days,52 of them take decision within a week. 12 of them
Dr. N. Kathirvel and A. Mekala
Tecnia Journal of Management Studies Vol. 5 No. 1, April 2010 – September 2010
83
take more than a week to decide their investmentchannels
Second group consists of 31 investors, out of 31,10 of them decided their investment channels withina week. 10 of them take decision within a few days.10 of them take decision within an hour. Only oneinvestor takes more than a week to decide herinvestment channels.
Table 5.1.a
Factor Chi-square DF Significance
Occupation Calculated Table 6 5%
10.07 18.5
Source: Primary data
It could be clear from this table that the calculatedë value is less than the table value at 5% level, thenull hypothesis is accepted. Hence it is clear thatthere is no association between monthly income andtime consumption for decision making.
Table 6:
Status in No. of the Percentage ofthe family respondents the respondents
Head of the 14 9family
Member of 136 9 1the family
Total 150 100
Source: Primary Data.
The above table shows that 91 percent of therespondents are belonging to the member of thefamily category and 9 percent of the respondents areHead of the family.
H0: Null Hypothesis
Status in the family does not influence the timetaken by investor for investment decision.
H1: Alternative hypothesis
Status in the family influences the time taken byinvestor for investment decision.
Table 6.1: Status and time taken for makinginvestment decision
Status in Within Within Within More Totalthe family hour few week than a
days week
Head of thefamily 6 1 7 0 14
Member of thefamily 29 33 59 15 136
35 34 66 15 150
Source: Primary Data.
The above table shows the association betweenstatus in the family and time taken for investmentdecision. There are 14 investors in the first group.Out of 14 investors, 6 of them take decision withinan hour. Only one investor decides her investmentchannels within a few days. 7 of them take decisionwithin a week. None of them take more than a week.
Out of 136 investors, 29 of them decide theirinvestment channels within an hour, 33 of them takeinvestment decision within a few days. 59 of themtake investment decision within a week, 15 of themtake more than a week to decide their investmentchannels.
Table 6.1.a
Factor Chi-square DF Significance
Status of Calculated Table 6 5%family
member 5.83 12.8
Source: Primary data
It could be inferred from this table that thecalculated chi-square value is less than at 5% levelthe null hypotheses is accepted. Hence it is clear thatthere exists no association between status in thefamily and time taken for investment decision.
Table 7: Family members of the respondents
Family No. of the Percentage ofmembers respondents the respondents
Up to 2 13 9
3-4 107 71
Above 5 30 20
Total 150 100
Source: Primary Data.
Women Investors’ Perception Towards Online Trading inTamilnadu with Special Reference to Coimbatore District
Tecnia Journal of Management Studies Vol. 5 No. 1, April 2010 – September 2010
84
From the above 71 percent of the respondentshave 3-4 members in the family, 20 percent of therespondents are belong to above 5 and 9 percent ofthe respondents have up to 2 members in their family.
H0: Null Hypothesis
There is no association between family membersand time taken for investment decision.
H1: Alternative hypothesis
There is association between family members andtime taken for investment decision.
Table 7.1: Family members and time taken forinvestment decision
Family Within Within Within More Totalmembers hour few week than
days week
Up to 2 1 5 6 1 133-4 25 26 46 10 107above 5 8 4 14 4 30
Total 34 35 66 15 150
Source: Primary Data.
This table exhibits the association between familymembers and the time taken for investment decision.Based on this factor, there are three groups. In thesecond group, there are 107 investors who have 3 to4 family members. Out of 107 investors, 25 of themtake investment decision within an hour, 26 of themtake investment decision within a few days, 46investors decide their channels within a week and 10of them take more than a week to decide theirinvestment channels.
There are 30 investors in the last group in whichthe investors’ family members are above 5. Out of 30investors, 8 of them take investment decision withinan hour, 4 of them takes investment decision withina few days, 14 investors decide their investmentchannels within a week and 4 investors take morethan a week to decide their investment channels.
Table 7.1.a
Factor Chi-square DF Significance
Family Calculated Table 6 5%members
23.21 12.6
Source: Primary data
It is clear from this table that the calculated ëvalue is more than the table value at 5% level thenull hypothesis is rejected. So there is associationbetween family member and time consumption forinvestment decision.
Table 8: Number of the Dependents
Number of No. of the Percentage ofDependents respondents the respondents
0-2 96 64
Above 2 54 36
Total 150 100
Source: Primary Data.
From the above table, 64 percent of therespondents have to 0-2 dependents and 36 percentof the respondents have more than 2 dependents.
H0: Null Hypothesis
Number of dependents does not influence timeconsumption for investment decision
H1: Alternative hypothesis
Number of dependents influence timeconsumption for investment decision
Table 8.1: No. of dependents and time taken forinvestment decision
No of Within Within Within More Totaldependents hour few week than a
days week
0-2above 2 1816 2311 4423 114 9654
Total 34 34 67 15 150
This table exhibits the number of dependents andtime taken for investment decision. In the first groupthere are 96 investors, 44 of them take decision withina week and 23 of the investors takes decision withina few days.
In second group there are 54 investors whosefamily dependents is above 2. Out of 54investors, 16of them take decision within an hour and 23 of themtake decision within a week.
Dr. N. Kathirvel and A. Mekala
Tecnia Journal of Management Studies Vol. 5 No. 1, April 2010 – September 2010
85
Table 8.1.a
Factor Chi-square DF Significance
Dependents Calculated Table 6 5%
2.64 12.6
Source: Primary data
In this table the calculated ë value is less thanthe table value at 5 % level the null hypothesis isaccepted. So it is clear that there is no associationbetween number of dependents and time taken formaking investment decision.
Table 9: Family Income of The Respondents
Family No. of the Percentage ofincome respondents the respondents
Up to Rs. 20,000 96 64
Above Rs.20,001 54 36
Total 150 100
Source: Primary Data.
From the above 64 percent of the respondentsearn up to Rs.20,000 as family income and 36 percentof the respondents earn above Rs.20,001.
H0: Null Hypothesis
Family income per month does not influence timeconsumption for investment decision
H1: Alternative hypothesis
Family income per month influences timeconsumption for investment decision
Table 9.1: Family income and time taken forinvestment decision
Family income Within Within Within More Totalhour few week than a
days week
Up to Rs. 20,000 29 25 55 11 120Above Rs. 20,001 6 8 12 4 30
Total 35 33 67 15 150
Source: Primary Data.
This table shows the association between familyincome per month and time taken for investmentdecision.
In the first group there are 120 investors whosefamily income is up to Rs. 20,000. Out of them, 29take decision within an hour, 25 of them takeinvestment decision within a few days, 55 of themtake investment decision within a week and 11 ofthem take more than a week to take investmentdecision.
In the second group there are 30 investors whosefamily income ranges above Rs. 20001. Out of 30investors, 6 of them take investment decision withinan hour. 8 of the investors take investment decisionwithin a few days, 12 of them decide their investmentchannels within a week and 4 of them take morethan a week for their decision.
Table 9.1.a
Factor Chi-square DF Significance
Family Calculated Table 6 5%Income
4.55 7.81
Source: Primary data
It is clear from this table that the calculated ëvalue is less than the table value at 5% level, the nullhypotheses is accepted. Hence it could be clear thatthere is no association between family income permonth and time taken for making investmentdecision.
Table 10: Savings of the Respondents
Monthly No. of the Percentage ofsavings respondents the respondents
Upto Rs.1000 32 21
Rs.1001 – 2000 49 32
Rs.3001 – 4000 19 14
Above Rs.4001 50 33
Total 150 100
Source: Primary Data.
From the above table 33 percent of therespondents belong to above 4001 of the savings ofmonthly income followed by 32 percent of therespondents belong to 1001 – 2000, 13 percent of therespondents belong to 3001 – 4000 and 21 percent ofthe respondents belong to up to 1000 monthly savingscategory.
Women Investors’ Perception Towards Online Trading inTamilnadu with Special Reference to Coimbatore District
Tecnia Journal of Management Studies Vol. 5 No. 1, April 2010 – September 2010
86
H0: Null Hypothesis
Savings per month does not influence timeconsumption for investment decision
H1: Alternative hypothesis
Savings per month influences time consumptionfor investment decision
Table 10.1: Savings and time taken for makinginvestment decision
Savings Within Within Within More Totalper month hour few week than a
The above table shows the association betweensavings per month and time taken for investmentdecision. The second group consists of 49 investorswhose savings range from Rs.1001 to Rs.3000. Out ofthem 6 of the investors’ take decision within an hour.11 of them take investment decision within a fewdays. 24 of them take decision within a week and 8of them take more than a week to decide theirinvestment channels
The last group consists of 50 investors whosesavings is above Rs.4,001. Out of 50, 11 of them takeinvestment decision within an hour, 11 of theinvestors take investment decision within a few days,25 of them takes decision within a week and 3 ofthem take more than a week to decide theirinvestment channels.
Table 10.1.a
Factor Chi-square DF Significance
Savings Calculated Table 6 5%
14.2 23.6
Source: Primary data
It can be seen from this table that the calculatedλ value is less than the table value at 5% level thenull hypothesis is accepted. Hence it is clear that
there is no association between savings per monthand time taken for investment decision.
Findings of the study
� It is found that 39 percent of the respondentsbelong to up to 30 years age group.
� It is found that 70 percent of the respondents aremarried, while 30 percent of the respondents areUnmarried.
� It is found that 49 percent of the respondentshave PG Qualification.
� It is revealed that 69 percent of the respondentsare employed followed by 15 percent of therespondents being in business.
� It is clear that 73 percent of the respondents geta monthly Income of up to Rs.10,000.
� It is clear that 91 percent of the respondents area member of the family and 9 percent of therespondents are Head of the family.
� It is found that 64 percent of the respondentshave 0-2 dependents and 36 percent of therespondents have above 2 dependents.
� 64 percent of the respondents get up to Rs.20,000family income and 36 percent of the respondentsget above Rs. 20,001.
� It is clearly shown 33 percent of the respondentsget above Rs. 4001 as monthly savings, 32 percentof the respondents get between Rs. 1001 – Rs.2000, 13 percent of the respondents get betweenRs. 3001 – Rs. 4000 and 21 percent of therespondents get up to Rs. 1000 as monthlysavings of the respondents
� It is clear that as the calculated λ value is morethan the table value at 5% level, thus the nullhypothesis is rejected. Hence it could be inferredthat there exists an association between age andtime taken for investment decision.
� It is clear from the study that the calculated λvalue is less than the table value at 5% level, thenull hypotheses is thus accepted. Hence it couldbe inferred that there exhibits no associationbetween marital status and the time taken forinvestment decision.
� It is shown by the study that the calculated λvalue is more than the table value at 5% level,
Dr. N. Kathirvel and A. Mekala
Tecnia Journal of Management Studies Vol. 5 No. 1, April 2010 – September 2010
87
the null hypothesis is thus rejected. Hence it couldbe inferred that there is an association betweeneducational qualification and time taken by theinvestment decision.
� Since the calculated λ value is less than tablevalues at 5% level the null hypotheses is accepted.Hence it could be clear that there is no associationbetween occupation and time taken forinvestment decision.
� It could be clear from the study that the calculatedλ value is less than the table value at 5% level,thus the null hypothesis is accepted. Hence it isclear that there is no association between monthlyincome and time consumption for decisionmaking.
� It could be inferred from the study that thecalculated λ value is less than the table value at5% level the null hypotheses is accepted. Henceit is clear that there exists no association betweenstatus in the family and time taken for investmentdecision.
� It is clear from the study that the calculated λvalue is more than the table value at 5% level;hence the null hypothesis is rejected. So there isan association between family member and timeconsumption for investment decision.
� Since the calculated λ value is less than the tablevalue at 5 % level the null hypothesis is accepted.So it is clear that there is no association betweennumber of dependents and time taken for makinginvestment decision.
� It is clear from the study that the calculated λvalue is less than the table value at 5% level,thus the null hypothesis is accepted. Hence it isclear that there is no association between familyincome per month and time taken for makinginvestment decision.
� It could be seen from the study that the calculatedλ value is less than the table value at 5% level,thus the null hypothesis is accepted. Hence it isclear that there is no association between savingsper month and time taken for investmentdecision.
Suggestions
1. Awareness should be created among the womenespecially among rural women.
2. Investment opportunity’s benefits must be givenmore importance in rural areas by conductingawareness programs.
3. Information and advice related to investmentshould be given to the women investors.
4. Investment articles, journals and T.V. shows canbe increased so that investors are more interestedand take good care of the investmentopportunities.
5. Basic knowledge must be given to the investorsabout all types of investment; so that the investorscan make a better choice that best suits theirinvestment plan.
6. Advertisement in newspaper can easily attractmore investors.
7. The women investors must be careful whilemaking investments. Investors must consider allfactors while investing their hard-earned money.
8. Time is a crucial factor. Investors should not takevery long to make investment decisions. Similarlythey should not take a decision within a shortperiod. The decision must be taken within theproper time.
9. Individual women investors must see the sourceof financial information regularly. Womeninvestors must diversify their portfolio indifferent companies to avoid risks. They musttake good care while making investmentdecisions.
Conclusion
In this research, the researcher studied thefollowing factors associated with the investmentdecision Age, Marital status, Educationalqualification, Monthly income, Status, familymembers, number of dependents, family income andsavings these factors closely influence the investmentdecision of the investors. The study revealed thatInvestment is of greater importance among youngerage group people when compared to the old agepeople. So awareness must be given to them in orderto improve their investment and stay happy. Financialdecision-making process of women investors is alsoan important one. The investors’ time consumptionsfor taking investment decision play a vital role ininvestment process. They should not take much timeto decide their investment channels. And at the same
Women Investors’ Perception Towards Online Trading inTamilnadu with Special Reference to Coimbatore District
Tecnia Journal of Management Studies Vol. 5 No. 1, April 2010 – September 2010
88
time they must be very careful while investing theirmoney.
Bibliography
• Bhole, L.H., “Financial Markets and Institutions”,Tata-McGraw Hill Publishing Co.Ltd., NewDelhi, 1982, p. 360.
• Davis, Yeoman, “Company Finance and the CapitalMarket – Effects of firm size, Cambridge UniversityPress, P.135.
• Gupta, L.C., “The changing Structure of IndustrialFinance in India”, Oxford University Press,London, 1969.
Tecnia Journal of Management Studies Vol. 5 No. 1, April 2010 – September 2010
89
RURAL BUSINESS MANAGEMENT
IMPERATIVES FOR SUSTAINABLE GROWTH
Abstract: The Indian rural markets are currently undergoing a massivetransformation. Basic contributions have come in from Governmentinitiatives in the form of Infrastructural facilities, Health and Educationand Administered pricing for farm inputs and outputs. Rural population,which was surviving under shortages of life sustaining necessities, isable to afford for personal needs after food and necessary clothing.Disposable income, even with the lower strata of the population iscontributing toward generating the demands from rural sector for goodsand services. Per capita demand may be low as of now, but massivepopulation makes it an interesting bouquet of business opportunities.Practical difficulties do exist in transacting the business, but early leadby some of the business houses with innovative planning and concertedinitiatives; would generate a long term market share for them. Thereare no two views on the fact that in very near future, business potentialfrom rural sector is going to surpass the urban sector. For businessmanagers, now is the time to realign their strategies and accord a seriousslot to the Rural Business Management in their plans.
Rajesh Bajaj*
*Rajesh Bajaj, Professor, Tecnia Institute of Advanced Studies, Madhuban Chowk, New Delhi-110085. E-mail id: [email protected]
In Indian context, the word “Rural” strikes animage of basket of rarities and deprivations in
any imaginable field of civilized living. Framewhich appears in our mental horizon ispredominantly cluttered with dusty narrowunpaved lanes with open sewage, small thatchedhutments, semi - dressed and under - nourishedchildren and adults. Pre – independence, this wasthe scenario in our villages and almost 80% of ourpopulation was living under such inhumanconditions; with no access to bare minimumnecessities, which are mandatory for humansurvival. Average longevity at 47 years, nearestmedical help may be was 100 kms away – withcommuting time may be 24 hours or more, withno semblance of communication facilities, even inemergency.
Post independence, mitigation of ruraladversities was the first priority of the national
leaders. This called for building up ofinfrastructure facilities with major priorities fixedon Irrigation, Agro inputs and Education. During60s, Mrs. Indira Gandhi; then Prime Minister ofIndia initiated actions towards enhancement ofagro outputs. This brought in the era of GreenRevolution and over a period of time, a countrydependent upon foreign donors for food, becameself dependent in a time span of 25~30 years.
Green revolution propelled by all around farmrelated initiatives brought in extensive change inour villages. Though initially, beneficiaries werethe farmers with large land holdings; overallimprovement started coming in, due toinfrastructural growth.
On a parallel front, industrial growth in thecountry provided huge employment opportunitiesto working hands. This brought in migration of
Tecnia Journal of Management Studies Vol. 5 No. 1, April 2010 – September 2010
90
large number of unemployed youth from villagesto urban areas. Exposure to urban life, access tothe educational facilities, medical support etc.brought in extensive amount of awareness amongstthe rural population. Consequently, Governmenthad to accord priority to health and educationsectors for rural population. With Governmentsubsidies on Power, Water, Agro inputs andfinancial support to marginal farmers, ruralspectrum started showing appreciableimprovements.
Industrial growth and economic libralisationinitiated in 1990s, brought in its share ofimprovements in farm outputs and remunerations.This started showing the signs in enhancement ofincome for rural population. This also brought inthe improvement in living standard of ruralhabitats, with disposable income being availablefor consumables and lower end durables.
During last 20 years, with communication andIT revolution in the country, awareness gapbetween rural and urban population has startednarrowing down. This has given rise to theappreciable demands from rural population,generating huge amount of business opportunities.
Some of the major business houses took noteof this transformation at an early stage and tooklead in integrating rural markets in their businessplans. To quote a few examples – ITC, HUL. HSBC,PEPSI, Coke, some of the nationalized Banks andmany more. This provided them with virginmarkets, ready to patronize their brandedproducts. With the Govt. initiatives in the form ofinfrastructural facilities viz. motorable road linkageto the villages with population of 500 or morepeople in plains and 250 or more in hilly terrain,rural electrification projects and satellitecommunication and entertainment facilities gettingestablished, gap between rural and semi – urbanliving standards are getting eliminated.
Stage has come, when the rural habitations arenot being seen as farming hubs only. Some of thecorporate have taken initiatives to establish hi –tech projects in rural areas, based on easyavailability of factor inputs. Agro farmingcomprising of basic cereals only, has now gotextended to niche product farming like rare fruits,vegetable and flowers; which were being importedso far. This got further augmented with fish andmeat farming for domestic, as well as; for export
markets. Easy financial support from the banks,provided job and business opportunities to cottageindustry. All these cash crops and additionalincome to artisans, have given considerableamount of disposable income to the ruralpopulation to generate massive demand forproducts and services from rural sector, which wasunimaginable so far.
Qualitative treatment meted to rural businesspotential is getting suitably substantiated by thechanging economic indices relevant to rural sector.Following quantitative data would be furthercorroborating the demand potential available inrural sector.
From the above text, it is quite evident thatrural India is under transformation stage and it ishappening at a very fast pace. Supporting factors,which have been catalyst to this mammoth changeand imperative to sustain it in future withencouraging level of YOY growth are:
(a) Rural Infrastructure: Main contribution beingfrom irrigation, Electric Power Supply andCommunication linkages viz. Roads and Tele-communication networks.
(b) Rural Finance: Crucial role played by Regionaland Rural banks for Agro financing andfinance for Cottage Industry.
(c) Rural Marketing: Initiatives from privatesector in activating the distribution channelsand government policies regarding distributionof Agro inputs.
(d) Rural Human Resource Mgmt.: Initiativesfrom Government and Role of NGOs in basiceducation and Vocational training.
(e) Rural Health: Establishment of primary healthCenters and education to rural population onsanitation and Hygiene.
(f) Government Initiatives: Subsidies on AgroInputs and Administered pricing for Agrooutputs.
(g) MNC Initiatives: Co-operative farming andsupply of Hi-yield seeds.
(h) Corporate Social Responsibility: Ruralwelfare programmes and adoption of villages.
(i) Rural Technology: Role of Bio-Tech in farmingand Rural specific Innovations on products andservice deliveries.
Rajesh Bajaj
Tecnia Journal of Management Studies Vol. 5 No. 1, April 2010 – September 2010
91
It is very necessary that initiatives taken onall the above sectors are maintained with fullsincerity and speed. In fact, in our democratic setup; awakening has taken place already in ruralsector and it is the rural population, who is goingto force the legislature to provide requisiteinfrastructure their growth. This never stoppingwheel has started churning out the economicprosperity in rural area, which would have thespin off effect on creation of massive demands andbusiness opportunities.
There is no denial to the fact that there arepractical difficulties in certain areas and absoluterupee value of the business is not commensuratewith total rural population. With infrastructuresupport being further ramped up, demand is likelyto shoot up in near future. Moreover with urbanmarkets getting saturated, only avenue availablefor business expansion is the Rural Markets. It isup to the business managers of today, to work outinnovative strategies to claim their share in the
huge opportunity in front of them in the form ofuntapped and virgin markets. With technology attheir support, product modifications to suit ruralneeds and deliveries without any servicecompromise, would definitely give them an earlylead. This eventually would result into customerloyalty for a long time to come and better brandacceptability in rural markets, with continuousrevenue streams.
Conclusion
Rural market, catering to 72.2% population ofthe country, with appreciable population alreadyabove the mid income or above segment, offers ahuge business opportunity. With literacy rate onupward trend in rural sector, movement fortransformation is unstoppable. It is matter of timeonly, when rural business is going to be morelucrative than the urban. Business leaders, whotake this wakeup call seriously now, are going tobe beneficiaries in due course of time.
Rural Business Management Imperatives for Sustainable Growth
Sl. Parameter Source Urban sector Rural sector RemarksNo.
1. Population Census 2001 286.1 Mn 742.5 Mn -
2. No. of Settlements OECD 5980 538000 -
3. Literacy Rate Min. of HRD -*Male 82% 63%*Female 63% 32%
4. GDP – Per Capita Indian Budget Rs. 89094 Rs. 9000 Derived(2009-10) (2010-11)
5. No. of Census 2001 53 Mn 128 Mn DerivedHouseholds
6. Households with NCAER Survey 8.74 Mn 16.45 Mn -income > Rs.45000 per annum
8. Mkt. Size - Ibef – Indian Rs. 940000 Mn Rs. 50000 Mn (2008 – 09)Durables Bazar
9 Agro Inputs — Rs. 450000 Mn -
Tecnia Journal of Management Studies Vol. 5 No. 1, April 2010 – September 2010
92
References
• P Kotler, et. al., Marketing Management,(Pearson Prentice Hall, New Delhi 2007)
• V S Ramaswamy and S Namakumari,Marketing Management, (Macmillan India Ltd.New Delhi 2006)
Rajesh Bajaj
• Rural-Urban Linkages and Pro-PoorAgricultural Growth: www.oecd.org/dataoecd/25/8/36562896.pdf
• The great Indian bazaar - The Indian FMCGsector: www.ibef.org/economy/consumermarket.aspx
• Census Data -2001: www.censusindia.gov.in/
Tecnia Journal of Management Studies Vol. 5 No. 1, April 2010 – September 2010
93
Introduction
Human, physical and financial resourcesdetermine economic growth and development
of a country. But an abundance of natural andphysical resources, machinery and capital may gounderutilized or misused, if human resource factorsare not properly cultivated and managed. Thereforethe objective of any planned development is todevelop human resources to their optimumutilization. The present situation demands for rapidindustrialization, which brings social and economicdevelopment of the society at large. In India, majorportion of the female community were involved withdomestic works as a result their entrepreneurial skillsand abilities were not properly utilized for thedevelopment of the nation. The entrepreneur denotesa person who discharges the entrepreneurial functionsof coordination, organization, supervision, riskbearing, high need for achievement, problem solver,setting goals and reaching these goals by one’s ownefforts (McClelland, 1961).
An entrepreneur is one who is willing and ableto initiate and successfully manage for a length of
time an activity that involves at least some degreeof personal and organizational risk. Pareek andNadkarni (1978) viewed that an entrepreneur isone who initiate and establish an economic activityor enterprise. From these, it can be stated that theentrepreneur is perceived as an individual havingcertain ability and potential which will help inthinking about the business activities, initiating,establishing, running and lastly managing anenterprise. Initially an enterprise may originate inthe shape of a small shop and along with time itmay be developed as an industry with sophisticatetechnology. So an entrepreneur takes thechallenges to carry out the activities for the successand survival of the enterprise by integrating his/her attitudes, values, behaviour and leadershipabilities.
The emphasis was given for the promotion ofwomen entrepreneurship after the 1970s with theintroduction of the women’s decade. The governmentof India declared the year 2000-01 as the WomenEmpowerment Year by keeping in view the socialand economic well being of the female community.But majority of women do not undertake
CONNECTIVE LEADERSHIP AND WOMEN ENTREPRENEURS:AN INTEGRAL APPROACH
Abstract: Effective running of a business firm will require a balancebetween two different and often contradictory approaches: managementand leadership. Rapid changes in both internal as well as externalenvironment with respect to technology, govt. policies, customerdemands, workers’ expectations, etc. will require excellententrepreneurial leadership skills. The women entrepreneurs should followthe connective leadership approach, which includes power directachieving style, social instrumental style, and relational achieving styledepending upon the situational demands. The women entrepreneurs in21st century are to be successful because of giving much more attentionon management of intellectual capital, creation of self organizingnetworks, proper counseling and guidance, balance of power, expertiseknowledge and clearly defined organizational goals.
Gautam Budha Sitaram*
*Dr. Gautam Budha Sitaram, Asso. Professor of Tecnia Institute of Advanced Studies, Madhuban Chowk, New Delhi-110085.
Tecnia Journal of Management Studies Vol. 5 No. 1, April 2010 – September 2010
94
entrepreneurial ventures. There is need to strengthenand streamline the role of women in the developmentof various sectors by harnessing their powers towardsnation building and to attain accelerated economicgrowth. As the environment is conducive and perfectatmosphere exists, women have to come forward toutilize their potential in a productive way. Gainfulemployment of women is identified as a major entrypoint in promoting their economic conditions(Chinnadurai, 2005). Now a day some young womenentered the fields of industry, public service as wellas business and are successful in these fields.According to 2001 census, the female population was48.2 per cent of the total population but theirparticipation in economically productive activities isoften underestimated. For last two decades, women’swork participation rate has been increased from 22.73percent in 1991 to 28.6 percent during 2001. This isthe right time to encourage and guide women toorganize business and services to enable them to joinbusiness and services in large numbers.
Factors affecting the degree of womenentrepreneurship
The factors which are blocking the degree ofwomen entrepreneurship are as follows:
a. Orthodox Society
The society or family is not permitting them towork in the organizations which are situated in along distance. Still now men dominated over womenin every aspect of their life. Even the educated andpotential women are simply involved with thehousehold activities, which cause wastage of skillsand resources.
b. Lack of support from men
Situations demand the proprietor has to stay withmanagement to solve the complex problems or totake some important decisions as a result she mayhave to stay up to late night. As a result men dislikeit so that conflict will arise among the couples andthe results are the separation, divorce, etc.
c. Low level of Literacy
Low level of education is another importantbarrier to the entry of women in the entrepreneurshipsector. The low literacy leads to lack of awarenessand courage to get into employment filed.
d. Lack of proper guidance and counselling
Govt. of India has declared a number of schemesand programmes for the socio-economic developmentof women at various levels irrespective of caste, class,place, etc. But due to lack of proper guidance andcounselling these provisions and facilities areunknown for majority of women who are the actualbeneficiaries.
e. Difficulties in availing of loan schemes
Women are not willing to ask for the propertyrights from their parents and their husband’s familybecause of the binding family relation and socialcustom and tradition prevail in the society. Thiscondition does not permit women to avail any benefitfrom the financial institutions.
Connective leadership as the driving forcebehind entrepreneurship
Contrary to traditional beliefs, female leadershipis no longer an underestimated. Viewed from theperspective of global inter dependence, it containsthe seeds of connective leadership, a new integrativemodel of leadership more suited to the dramaticallychanging workplace of the twenty-first-century. Toaddress the complex demands of the 21st centuryworkplace, organizational leadership will need toreflect certain behaviours to which femalestraditionally have been socialized, but which manyof them are being urged to abandon to ensure theiroccupational success.
Connective leadership is a process to influenceindividuals not only to their own tasks and ego drivesbut also to those of the group and community thatdepend upon the accomplishment of mutual goals. Itis such type of leadership that connects individualsto others and others’ goals using a broad spectrumof behavioral strategies (Gilligan, 1982). It proceedsfrom a premise of connection and recognition ofnetworks of relationships that bind society in a webof mutual responsibilities. This new integrative formof leadership not only encompasses both transactionaland transformational behaviours but also stretchesits practitioners beyond individualism and charisma,even beyond competition and collaboration (Gardner,1990). Connective leadership, which connectsindividuals’ creativity to their tasks and visions, toone another, to the immediate group and the largernetwork, empowering others and instilling
Gautam Budha Sitaram
Tecnia Journal of Management Studies Vol. 5 No. 1, April 2010 – September 2010
95
confidence, represents a crucial set of strategies forsuccess, not only in the workplace but also in theexternal environment.
Leadership styles
For effective management of the enterprises,women entrepreneurs or proprietors wereimplementing the following leadership styles toinfluence the behavior of the individuals towards thedesired goal on the basis of the situational demands.
Power direct achieving style
Leaders who prefer the power direct achievingstyle may delegate tasks to others; they retain strictcontrol over both the targeted goals and the meansto their accomplishment. They do not attract andunite their followers simply by the creativity andworthiness of their own dreams & goals but drawthe attention of the followers by identifying theexternal threats.
Social instrumental style
Leaders who use social instrumental strategiesunderstand relationships and networks as vital foraccomplishment of the objectives of the organization.They do things through other people, selectingspecific individuals for specific tasks.
Relational achieving style
This style of leadership required by aninterdependent environment involves an orientationtowards others & their special goals. It contains threecomponents like contributory, collaborative andvicarious- that encompass such inclinations oraffiliations. Women entrepreneurs should takeresponsibility in order to keep the work grouptogether with clarity of roles of the followers. Hencewomen excel in collaborating, contributory andmentoring behaviour, all-important aspects ofconnective leadership.
Connective Leadership for EffectiveManagement
Development will be used to acquire newviewpoint so that the organization can become morecompetitive. Development of the women proprietorsfor the success of the business is an important issuein the competitive business environment. The role
that HRD needs to excel is by making greater effortsin effectively developing the soft skills. This includessuch subjects as diversity, communication & peopleskills that allow people to understand each other anddevelop good team skills. This should be the numberone priority of HRD to build real teams for theorganizational excellence. It will help the womenentrepreneurs in a number of ways such as: to definea clear objective; to attract the good people into theright jobs; to build teams which create synergy andto fulfill the customers demands in a very competitiveenvironment.
So it is the responsibility of the entrepreneurs todevelop the people to acquire new horizons,technologies and viewpoints. It enables leaders toguide their organizations towards new expectationsby being proactive rather than reactive. It enablesworkers to create better products, faster services andmore competitive organizations. In the new workdynamic, job centered leadership is being replacedby worker centered leadership which has the potentialto drastically alter the role of an effective leader. Thereis some justification for regarding the follower as themost crucial factor in any leadership event. Followersaffect the strength of a leader’s influence, the style ofleader’s behaviour and the performance of the groupthrough which many leadership functions are carriedout is critical to workers for production, rewards,morale and work satisfaction.
Successful women entrepreneurship inpeople centered cultures
The growing importance of women in businesshas developed successful leaders at all levels is beingaided by the increasing filled by women. In business,female think as a change from traditional, goaloriented and hierarchical models of interaction tomore caring and familiar one. Since women tend tothink differently than men, they interact withemployees differently, in what has been called a morepeople-centered way. It has been seen that the typicalfemale manages information, emotions andrelationships differently than the typical male. Ifcross-functional collaboration is the medium formanaging innovations then women were mostcomfortable with facilitating discussion andsmoothing organizational conflicts. In twenty firstcentury, women between the ages of twenty five andthirty five will have more education than their malecounterparts; it appears that women may just have
Connective Leadership and Women Entrepreneurs: An Integral Approach
Tecnia Journal of Management Studies Vol. 5 No. 1, April 2010 – September 2010
96
the right and adequate skills for the evolving neweconomy. So the organizations run by women do nottake the form of traditional hierarchical pyramid buta network system, where leaders reach out, not down,to form an interrelating matrix built around a centralpurpose.
In general men view job performance as a seriesof individual transactions with subordinates, withrewards given for good work and punishment metedout for substandard performance. But women on theother hand, encourage employees to align their selfinterests by identifying with the group (Rosner, 1990).These leaders share power, encourage participationand recognize their presence in more significant way.This people centered way favoured by women stemsfrom a belief that allowing employees to contributeand to feel important is a win-win situation. One ofthe reasons women are better leader is that theessence of what women leaders do is to interact withpeople. They do all the things that good leaders do,men or women, but women seem to actively workharder to make their interactions with associatespositive for everyone involved. More specifically, theyshare power and information, enhance others selfworth by listening and get others excited about thetask at hand. The effective and dynamic leadershiplead towards successful women entrepreneurship dueto the following factors:
i) Managing Intellectual Capital
As other skill management leaders will need tomaster is effectively utilizing intellectual capital byidentifying followers’ skills and abilities. Developinghuman capital and converting it into useful productsand services is first becoming the critical executiveskill of the age.
ii) Creating Self-Organizing Networks
An organization’s knowledge worker operates onfour levels within a networked organization, socialinteraction, advanced technical skills, anunderstanding of business process and self-motivatedand directed teams. When decision-making authorityis coupled with peer collaboration, managers find anincrease in self-motivated creativity. So managing anetwork organization, where knowledge is a strategicadvantage, means that how workers are viewed andhow they are developed will be the key to long-termcorporate success.
iii) Counseling of the Workmen
When team members face problems while carryout their work, they seek guidance and advice fromtheir leaders. The problem may be technical oremotional in nature.
iv) Using Proper Power
Leader has to exercise power and authority overthe subordinates as per the demand of the situation.Exercise of power needs to stimulate positiveresponse from the subordinates.
v) Knowledge and Intelligence
One most important requirement of a leader isto have required knowledge of human behaviour,psychological and professional competence. In orderto develop competency, the leader also must updatecontinuously and keep renewing.
vi) Clearly defined Goals
Actions without clear-cut directions leadnowhere. That is why there is very little achievementin spite of a lot of movement in life. Hence, a leaderneeds to be very clear in mind about what to achieve,how to achieve and then reinforce it by a strong willpower and conviction.
Concluding Remarks
Running a business will require a balancebetween two different and often contradictoryapproaches: management and leadership. In thecompetitive business environment, executiveleadership matters more than ever before. Rapidchanges in both internal and external environmentwith respect to technology, govt. policies, customerdemands, workers’ expectations, etc. will requireexcellent entrepreneurial leadership skills. The job ofan executive is to articulate vision. Leaders need tocommunicate a shared picture of the future thatfosters genuine commitment and motivation.Leadership must be augmented through attention todetails on roles, performance measures and reviewsbut always with an eye on proactive strategy ratherthan reactive strategy. Entrepreneurs’ charts a coursefor control, stability and practicality with the othereye on the day-to-day operations, the customer andmarket share (Sinha, 2003). Balancing these tworequirements is vital for the success of every businessenterprise. Interactive leadership relies heavily on
Gautam Budha Sitaram
Tecnia Journal of Management Studies Vol. 5 No. 1, April 2010 – September 2010
97
communication skills. It is about creating the spacefor dialogue and thinking together for the commongood. It requires a level of maturity in which bothleader and followers should work together forbetterment of the organization. Leaders should ensureabout a constant dialogue with the subordinates overfuture directions and resolving the tensions betweencompeting and often opposing ideas. So interactiveleadership is all about creating an emotionalconnection with people. One of the reasons whywomen are finding their way into more and moreleadership jobs is that they tend to know better howto create webs of inclusion and environments for opencommunication. While these skills may come morenaturally to women, they may be the most importantingredients for success in the 21st century as maledominated organizations are struggling for survival.
References
• Chinnadurai, R., (2005), “Women Entrepreneurshipand Service Sector”, Kurukshetra, Vol. 54, No. 1,November. PP, 56-72
Connective Leadership and Women Entrepreneurs: An Integral Approach
• Gardner, John W., (1990), On leadership, NewYork, Free Press.
• Gilligan, Carol (1982), In a Different Voice:Psychological Theory and Women’s Development,Harvard University Press. PP, 105-114
• McClelland, D.C., (1961), The Achieving Society,D.Van Nostrand Reinhold, New York. PP, 34-67
• Pareek, U; Nandkarni. (1978), “Development ofEntrepreneurship: A Conceptual Model”, InDeveloping Entrepreneurship, T.V. Rao & UdaiPareek(Eds), Learning System, New Delhi.84-104
• Rosner, Judy B., (1990), “Ways Women Lead”,Harvard Business Review, November-December.PP, 56-65
• Shinha, Poonam (2003), “Entrepreneurship in theNorth East India: Motivation, Social Support &Constraints”, Indian Journal of IndustrialRelations, Vol. 38, No.04, April, PP. 15-45
Tecnia Journal of Management Studies Vol. 5 No. 1, April 2010 – September 2010
98
ECONOMIC PROSPECTIVE OF MEDIA MANAGEMENT IN REFERENCE
WITH ETHICS AND MARKET FORCES
Abstract: There is a big gap in the business of Media Industries andthe realization of the society about the same. We think that media shouldbe ethical enough to fulfill the responsibility of the business, but thereis a big question of business requirement and the balance of marketforces for the same. This paper will give a model to make balance betweenmarket forces, media and their ethical prospective.
Sudhir K. Rinten*
*Sudhir K. Rinten, Asst. Professor & Programme Coordinator Tecnia Institute of Advanced Studies, Delhi.
Introduction
Mass Media is midas touch now a days.Livelihood to habits, role models to destination,
even our thinking is being affected by the media. .Now a day’s media is not a mere source ofinformation but is mind & mood manager too. Nohouse, mind, work or step can be identified withoutthe interference of the media. We cannot find a singleepisode of life without media; birthday parties toreligious ceremonies all are adopted from the media.Our bedrooms to bathroom are all captured by themedia approach. All these have been possible onlydue to professional attitude of media.
In this LPG era no one can tolerate financialrequirement of any industry. Media Industries arealso a part of this Privatized, global & liberalized(LPG) world. Although there is a big differencebetween a Condom making Company and a MediaCompany, but both are industries at first level, bothrequire financial assets, HR, Supply chain and theyhave to satisfy their customers at the very first level.
Industries have to survive in the market. Everyindustry has its own characteristics and requirements.Those necessities of survival lie between, financialrequirements, ethical support, HR Management,Supply Chain Management etc.
According to Michel Porter’s 5 Factor modelthere are five major factors, which causes an industry.
1. Bargaining Power of customers.
2. Bargaining Power of Suppliers.
3. Entry Barriers
4. Exit Barriers
5. Threats from substitute products.
Media industries also have such barriers in thesame pattern as per its own requirements. Media isnot a missionary activity today. It has been evolvedand proved by the total capital involvement andreturn from the market. Thus market has a pressureon the media organizations also.
1st Bargaining Power of Customers – Thesefactors includes target audiences and their fulfillments& advertisers requirements. Now media content islike a product, and it is the prime necessity of mediaindustry to fulfill the needs of their audiences. If anyorganization of this industry will not able to saturatethe thrust of audiences that will be obsolete. Inanother hand advertisers are also a market force toregulate media organizations in their properfunctioning. They are lifeline breathers in terms ofcapital. But they just want their products to be placedin the popular programmes. This popularprogrammes concept (game of TRP) again goes tothe end of audiences.
2nd Bargaining power of Suppliers – Thesefactors include supply chain of the media likecirculation department, cable operators, DTH serviceproviders etc. In fact these barriers are basicallydependent on the availability, space etc. They are
Tecnia Journal of Management Studies Vol. 5 No. 1, April 2010 – September 2010
99
outcome of such phenomena in which a supplier canaffect the availability and accessibility. Although it isvery much dependent on the suppliers but customerdemand (Audience requirement) can nullify thisfactor if these will be exposed to the customers.
3rd Entry Barriers – These barriers are suchbarriers, which basically, oppose the start of anyindustry. As per Indian constitution each and everyindividual citizen can start any media industry butits not very easy task. In Indian economy at veryfirst level of media emergence it was so easy to starta newspaper, but now a days it’s the boom of mediaculture and this industry requires much more capital,human resources (even a skilled one), satellite andtransmission licenses (for broad cast medium). Sothese are lengthy processes and if a mediaorganization will be in function that will require agood back up.
4th Exit Barriers – These barriers are basicallysuch kind of barriers, which will hold a person, to bein the same trade where he is. In media organizationnobody can leave his job due to ideological andtechnological exit barriers. A journalist wants to be ajournalist and costly infrastructure will not give anychance to media industries to be shifted some whereelse. Even it cannot be utilized anyhow. Satellitehiring, V-SAT, ENG devices all are too costly andcannot be utilized somewhere. Thus a media industrycannot switch over and it is a necessity to be in themarket positively otherwise it will be ejected andruined.
5th Competitors – There are lots of media housesin the industry, that’s why a media organizationshould fulfill all the necessities and requirements ofmedia organizations. Other wise the will besuperseded.
Above mentioned market forces mostly governsany media organization. Over the years mediaindustries and societies both have undergone drasticchanges. Their relationship has also changed. No onecan imagine a society without media interference.No doubt after globalization media sector has beenconverted form missionary activity to industrial form,then a big challenge occurs to establish and survivein the Industrial environments. Audience’s startsbehave like customers. This was a big market forceand industry is libel to bother about. Second marketforce was of advertisers. Advertising sector isdeveloping 22 percent per annum. In year 2007-08this sector will be of Rs. 16, 00,000 lakhs. This sector
involves 0.52 percent of GDP. Such a big budgetcannot be ignored by the industry, and if it will beignored, it will ruin the media sector.
Now the matter of ethics; the word Ethics isderived from the Greek word ‘Ethos’ which means‘Customs’. Ethics is defined as the normative scienceof conduct of human beings living in societies. It isa science, which judges this conduct to be right orwrong, to be good or bad.
It is the science of ‘ought’, what we should do.Ought to derivatively mean customs. What we shoulddo is followed by ‘is’, which explains what is done.When an action happens it is put to moral judgmentof ethics.
Socrates is regarded as the founder of philosophyof ethics. He expressed his views as ‘virtue ofknowledge’. He believed that to understand thenature of goodness it was a necessary condition tolive a good life. With the development of society, thedefinition of ethics changed.
Philosophers like Plato and Aristotle followedSocrates. The modem philosophers like J.S. Mill, T.H.Green, Butler, and Sidgwick named ethics asnormative science. With the passage of time differentviews about ethics emerged. Some thinkers, likeGreek Sophists maintained that the differencebetween right and wrong was merely subjective,depending upon the attitude of the individual makingmoral judgment.
Some like J.S. Mill and Sidgwick maintainedthat the difference between right and wrong dependson the result of our actions and particularly on theirpower of satisfying our desires and causing pleasureto others and us.
Today the issue of ethics demands a newdefinition. There is a debate between two systems ofethics i.e. customary and reflective morality.
Customary morality is meant that stage of ethicaldevelopment in which a man considers to be right,those conduct which are approved by the standardsor customs of the social group to which he belongs.The force of public opinion is the most importantfactor leading to maintenance of customary morality.It is the natural tendency of sympathy, imitativenessand suggestibility that makes us do what ourneighbors approve because nothing is moreunpleasant that ostracized from ones tribe.
Reflective morality is meant that stage of moral
Tecnia Journal of Management Studies Vol. 5 No. 1, April 2010 – September 2010
100 Sudhir K. Rinten
development through which men formulate moraljudgments on the basis of a reflective evaluation orprinciples and the careful examinations of facts intheir relation to human life. The presets of the pastare too rigid to apply to the guidance of conductunder new situations. As exceptional circumstancesand new difficulties arise, men are required to reflectupon customs and laws, reflection is thus added. Itis sometimes important to ask not what was donein the past but what the present demands. Changesin conduct according to the present demands areessential for development.
Media Industries can be ethical if they arefinancially sound to meet their objectives. Now, ethicsand values of any society lie between socio-culturalnorms and conditions. These social factors are beingchanged as per the modernization approach of thesociety. No doubt media will be affected as per thesocio- cultural changes of the society. Affect of thisGlobalize, Privatized and Liberalized world can beseen on the socio-cultural behavior of the country.Now a day a movie like satyam Shivam Sundaram orRam Teri Ganga Maili will not be problematic for thesocieties as they were at the time of release. Nowlove marriages are acceptable, we can accept agirlfriend or boyfriend of our wards. Although thesethings are very small but they are actually a bigreflection of the socio cultural changes and their moralchanges.
In society like India where socio-cultural aspectdepends on ritual, and reflective actions, whereHindu, Muslim, Sikhs & different Dravid societiesand communities are living in the same area andfollowing different customs, it will be so rational onthe scale of morality and ethical values.
Lets imagine about marriage with first cousin. Isit possible in Hindu tradition? Is it will be ethical,but what about Muslim tradition in the same case.Don’t you think that will be an appropriate option,and will be an ethical move also? No body will thinkto marry his nice in northern Indian region but is nottrue that in several southern regions it nice is the toppriority life mate?
Answers of these questions will sketch a sceneof such morality and ethical boundaries where wecan find a lot of differences and it again proves theconcept It is sometimes important to ask not whatwas done in the past but what the present demandsin contemporary scenario.
These changes can be observed in all the societies.So, reflective ethical part is more important to designa message.
There are two major things one the driving forcebargaining power of audiences, their requirementsand their fulfillment along with reflective changes ofthe societies and moralities.
So we can say that ‘market force’ is the force ofdevelopment, force of the culture, force of the currentmain stream. No media organization can go beyondthe audience’s demand. If our society will not accepta value like ‘Neel N Nikki’ it will be ejected from thescene.
Our early media sector was running on the basisof missionary ideological forces. There were nooptions and societies were bound to access thoseforms only. Today myth of missionary activities hasbeen changed. Media is Info-tainment provider. Wecan hear Raju Srivastava on radio or view any AhasanQurashi on TV channels.
If audiences are ready to accept any program orif they wish to hear any programme it will beresponsibility of communicator to provide this to theiraudiences.
Now the question of availability and accessibilitywill arise on the minds, but it’s a fact that there aremore than 100 TV channels 10 Radio Channels 20Newspapers and around 15 periodical in each andevery geographical area. Now it is up to the audiencewhat he will access. Receivers are having majorpower to change media content as per their demand.Remember the days of last millennium when Indiatoday used to publish a column Duniya Rang Rangili.That column contained semi nude pictures from theworld. After a number of letters to editor the columnwas withdrawn from the publication within 6 months.Now the same periodical is publishing such picturesbut there is no objection raised by the audiences.
It’s very clear now if I will change the channel,TRP of the same will go down or if I will say to myHawker to drop any other news paper or periodicalcirculation of the same will go up. If TRP orCirculation of any media is going high, it proves theacceptability of the programmes by the customersand industry is able to meet out the objective relatedto 1st market force ‘Bargaining power of audiences’.
Today all media houses that we are criticizingfor ethical values, are performing well. It means they
Tecnia Journal of Management Studies Vol. 5 No. 1, April 2010 – September 2010
101Economic Prospective of Media Management in Reference with Ethics and Market Forces
are providing content. Now it is very clear that wehave to reframe our ethical parameters as perreflective morality concept that is “It is sometimesimportant to ask not what was done in the past butwhat the present demands.”
Suggestions
Our early media sector was unorganized andmissionary. The person who were controlling mediaorganizations were much more dedicated towardstheir Customary morality is meant that stage ofethical development in which a man considers to beright, those conduct which are approved by thestandards or customs of the social group to which hebelongs. The force of public opinion is the mostimportant. As per this view also then socialrequirements/ values and their reflections were ofsuch kind where they were able to continue withtheir profession. Market forces were present but notin such strength. Industry was not in the shape oftodays.
Our media sector was not in the form of industrybut still working as following model. Where mediaorganizations are in the core and societies, ethicalvalues, market forces etc. all are in the periphery. Acompany has to cooperate with all these factors andtheir reflective moralities. (Fig-1).
Today ethical values have been changed. Mediasector is industry now. It can be categorized in tothree segments as per contemporary requirements.(Fig-2).
1. Hard core Ethical Segment- that is the first circleof the model and contains two major pillars of mediaindustry. A- Audiences & B- Advertisers. Mediaorganizations should be much more ethical to thesefellows at the first level.
2. Rational Segment- This segment contains ethicalvalues in relation to their human resources, Pressuregroups, Market forces and competitors. Althoughthese four figures are very important for any industrybut in media industry they are being connected onbehalf of moral values.
3. Social Segment- This segment contains society,country, economy and our surroundings. A mediaorganization should be ethically responsible for thesethings. Yes it is true that the ethics of this segmentwill come after Hard core and Rational segment.
These segments will show appropriateconcentration of ethical values in the favor of mediaindustries and media professionals. No one can saythat media should not think about their professionalethics or about their customary ethics. As per thismodel of ethics any media can balance both
Fig-1
Tecnia Journal of Management Studies Vol. 5 No. 1, April 2010 – September 2010
102
customary and reflective moralities. This can providea passage of resettlement of media ethics and values.
Bibliography
• Singh Dr Y. P. (2007), Accounting and FinancialManagement for IT Professionals, New AgePublication, New Delhi Pg 76-79.
• Kumar Keval J. (2003), Mass Communication inIndia, Jayco Publications, New Delhi, Pg 120-139.
• Rinten Sudhir K. (2007), Media ethics andresponsibilities, associatedcontent.com.
Sudhir K. Rinten
Fig-2
• Rinten Sudhir K. (2007), Concept of communityradio in the development of rural entrepreneurs,associatedcontent.com.
Sub: Call for papers for publication in “Tecnia Journal of Management Studies”
Dear Sir
The Advisory Board and Editorial Board thank all contributors and readers for making “TecniaJournal of Management Studies” an outstanding success. The Journal has been granted InternationalStandard Serial Number (ISSN) on the basis of its high quality contents. The eighth issue has beenreceived well by one and all. The issue contained articles likes Motivational Patten forEntrepreneurship among Engineering Management & Pharmacy Students: A Comparative, Strategiesto improve sales of Handloom Products with special reference to Pauducherry, A study onOrganisational climate with special reference to Engineering Industries in Coimabatore, FromCompetencies to Organisational Performance-An Empirical study, Motivational and ManagerialBehavior: A Study of Managers in Banks, Strategies Marketing for Higher Education, Challengesfor Indian Economy during Global Recession, Case Study Method: For Training and Case- Writing,Takaful-An Overview.
The Ninth issue, Volume 5, No.1 is submitted. We take this opportunity to invite original researcharticles from faculty members and research scholars. The articles may be based on summary of Ph.D thesis recently completed, Post doctoral research, any other related research work, current businessdevelopment etc. One may send case studies and book reviews also. The detailed guidelines forcontributors are enclosed herewith.
To encourage participation from all the faculty members the Management has decided to confer acertificate of appreciation and a token honorarium of Rs. 1000 to the authors for the best Researchpapers accepted and published in the Journal.
The message may kindly be circulated among all faculty members, research Scholars & Concernedauthors. An early response will be appreciated.
With best Regards.
Sincerely yours
Dr. Nirmal SinghEditor
Tecnia Journal of Management Studies Vol. 5 No. 1, April 2010 – September 2010
104
Guidelines for Contributors
*Manuscripts and all editorial correspondence should be addressed to: The Editor, Tecnia Journal of Management Studies, Tecnia Instituteof Advanced Studies, 3, PSP, Institutional Area, Madhuban Chowk, Rohini, Delhi-110085, e-mail: [email protected]
General Instructions:
The manuscripts should be error free to the maximumextent possible. Along with the manuscript, author(s)should provide declaration that the article is the originalwork of the author(s) and that it has not been publishedor submitted for publication anywhere else.
Authors are requested to submit the manuscript(hardcopy) along with a softcopy (CD-ROM) using MSWord processing package. The soft copy of themanuscript may also be sent through e-mail* withattachment.
The selection of papers for publication will be based ontheir originality, relevance and clarity, the extent towhich they advance knowledge, understanding andapplication and their likely contribution towardsinspiring further research and development.
The articles will be sent to the evaluation board forapproval and only the selected articles will be published.Authors may be asked to revise and resubmit themanuscript based on the referees’ comments.Unaccepted papers will not be sent back. Copyright ofall accepted papers will vest with the journal.
Guidelines: Based on American PsychologicalAssociation (APA) Style Manual:
1. Manuscripts must be typed on one side of the pagein 12-point font on A-4 size paper in double-space,with the margins of 1.5 inches on all sides tofacilitate editing and styling. All text, includingabstract, quotations, notes and references shouldbe typed in double-space.
2. The page number must be on all pages of the paper,including the title page. Use Arabic numerals andposition the page number one inch from the righthand edge of the paper, in the space between thetop edge of the paper and the first line of text.
3. The title of the paper must be typed in upper andlower case letters, and is centered between the leftand right margins and positioned in the upper halfof the page. If the title is two or more lines in length,double-space between the lines.
4. The manuscript must include a reference list at theend, which list the articles, books, etc. cite in thepaper. The reference list must be double-spaced,and in alphabetical order.
5. The manuscript should be sent along with a coverpage containing article title, author’s name,designation, official address, contact address,phones, fax numbers, and e-mail address. Details
of the author’s name and other information shouldnot appear elsewhere in the manuscript.
6. The cover letter should indicate the title, the names,addresses, phone, fax numbers and e-mail addressesof two or three relevant reviewers for your paper.These may or may not be considered by the EditorialAdvisory Board.
7. Articles should not ordinarily exceed 5000 wordsexclusive of charts, tables and other graphics.Present each figure and table on a separate sheet ofpaper, gathering them together at the end of thearticle. Use short and crisp titles and headings intables and figures. Include a mention of each figureor table in the text itself in the margin where thefigure or table should go.
8. Abstract (between 150-200 words) outlining thepurpose, scope and conclusions of the paper. Noabstracts are required for review essays or casestudies.
9. Quotes should be cited accurately from the originalsource, should not be edited and should give thepage numbers of the original publication.
10. Notes should be numbered serially and presentedat the end of the article.
11. No stop after abbreviations (ISO, USA, BBS, MBAetc.) Use stop after initials (B.P. Singh).
12. Only those book reviews will be accepted thatpertain to Business Management or allieddisciplines. The book review must contain the titleof the book, author’s name, publisher’s name, yearof publication, price, ISBN etc. The review shouldnot normally exceed 2000 words.
13(A) Rules for citing the books on the reference list.a) Use the author’s surname and initial(s) only.
Do not use first names, degrees, and the like.b) Cite all authors listed for the book in the order
they are listed.c) Follow the author’s name with the year of
publication. Year of publication will be inparentheses.
d) The title of the book is next and it is italicized.Only the first word in the title or any propername should be in upper case.
e) The place of publication follows.f) The publisher of the book is listed last followed
by a period ( . ).g) Space must be after periods that separate the
parts of the citation and after the periods of theinitials in personal names.
Tecnia Journal of Management Studies Vol. 5 No. 1, April 2010 – September 2010
105
h) Often, no single example from the manual willfit your citation exactly; in that case follow theclosest example possible or combineappropriate elements from two examples.
i) In edited books, pagination should bementioned in parenthesis immediately after thetitle of the book.
References: Books (Citation)
Zeithaml, V.A., Parasuraman, A. & Berry, L.L. (1990).Delivering Quality Service: Balancing Customer Perceptionsand Expectations: p.18. New York: The Free Press.
Edited Book
Harrington, D.M. (1990). The Ecology of HumanCreativity: A psychological perspective. In Runco, M.A.,& Albert, R.S., (Eds). Theories of creativity (pp. 143-169).Newbury Park, CA: Sage.
Book by a Corporate Author
Committee of Public Finance. (1979). Public finance. NewYork: Pitman.
13(B) Rules for citing the periodical articles on thereference list.
The Reference section appears at the end of thepaper and lists all the research materials, which havebeen used.
a) Use the author’s surname and initial(s) only.Do not use first names, degrees, and the like.
b) Cite all authors in the Reference list in the orderthey are listed with the source.
c) Following the author information, give the dateof publication in parentheses.
d) For weekly and daily periodical/magazinessuch as newspapers and popular magazines,cite the year, month and day.For monthly article/magazine, cite the year andthe month.For the professional journals, cite only the year.
e) The title of the article follows. Only the firstletter of the first word of the title or subtitle orany proper name appearing in the title shouldbe in upper case.
f) The title of the journal (in italic) comes next,followed by the volume number, and ifappropriate, the issue number.If the journal uses continuous pagination, i.e.,it runs page numbers throughout a year orvolume; no reference to an issue number isneeded. In that case, the title of the journal isitalicized, as well as the volume number.
g) If the journal is re-paged issue by issue, i.e.,each issue has a page number 1, then the issuenumber must follow the volume number. Theissue number is in parentheses but is notitalicized.
i) The next part of the citation is the pagination.The page designation p is not used except whenciting newspaper articles.
j) If the journal is from an electronic database,retrieval information must be included whichstates the date of retrieval and the proper timeof the database.
k) For more than one publication in one year bythe same author, use small lower case letter todistinguish them.
References: Articles (Citation)
Weekly Magazine/Article:
Singh, N. and Srinivasan T.N. (2005, May 21-27). ForeignCapital, Deficits and Growth. Economic and PoliticalWeekly, XL, (21), 2196-2197.
Monthly Magazine/Article:
Gupta, K. (2005, May). Durables: On a Fast Track. Pitch11(8), 42-50.
Professional Journal (continuous pagination)
Taylor, M.A. & Callahan, J.L. (2005). Bringing creativityinto being: Underlying assumptions that influencemethods of studying organizational creativity. Advancesin Developing Human Resources, 7, 247-270.
(Re-paged issue)
Prasad, T. (2005). Mandi: A Field Sales Campaign forTeaching Personal Selling Skills through ExperientialApproach. IIMB Management Review Advances inDeveloping Human Resources, 17(1), 87-94.
13(C) Other References (Citation)
Newspaper article
Maira, A. (2005, February 25). Putting humanity intocapitalism. The Economic Times. P.16.
Computer Software
Soldan, T.J. & Spain J.D. (1984). Population growth[Computer software]. City, state (2 letters): Conduit.
Electronic Database
U.S. Department of Labor (1991). What work requiresof schools. Retrieved August 15, 24, from http://wdr.doleta.gov/SCANS/whatwork/whatwork.pdf
Paper Presentation
McCollum, E.E. & Callahan, L.L. (22, November). Thenarrative assessment interview: The use of a psychoanalytictool to evaluate a leadership development program. Paperpresented at the American Evaluation AssociationConference, Washington, DC.
Ph.D. Thesis
Antony, D. (2005) “Human Resource Development Practicesand their impact on Organizational Effectiveness (A Studyof Selected Industrial Organizations)”, Ph.D. Thesis,University of Delhi, Delhi.
Tecnia Journal of Management Studies Vol. 5 No. 1, April 2010 – September 2010
106
TECNIA INSTITUTE OF ADVANCED STUDIES
(Approved by AICTE & affiliated to GGS Indraprastha University, Delhi)3 PSP, Institutional Area, Madhuban Chowk, Rohini, Delhi - 110 085
Institute is rated as "A" Category Best Business School by latest AIMA – Business StandardPublications & Business India survey and Rated amongst Top 100 B-Schools & IT Schools in
India by Dalal Street Investment Journal.
Tecnia Journal of Management Studies(A Bi-annual Publication)
Subscription Order Form
I wish to subscribe TECNIA JOURNAL OF MANAGEMENT STUDIES, for 1 / 2 / 3 year(s).
A draft bearing No.________________________dated_______________for Rs.___________________________
____________________________ drawn in favour of “Tecnia Institute of Advanced Studies, Delhi” is enclosed.
We feel delighted to introduce Tecnia Group- of Institutions which carved a niche in the field of educationfrom the level of nursery to higher management and unstoppably soaring to high standard of quality.
The group consists of following Institutions:1. Tecnia Institute of Advanced Studies, Rohini, Delhi2. Tecnia Institute of Applied Studies, Pitampura, Delhi3. Tecnia Institute of Art and Design, Rohini, Delhi4. Tecnia Institute of Teacher Educations, Rohini, Delhi5. Tecnia International School, Rohini, Delhi6. Tecnia Institute of Rehabilitation Sciences, Rohini, Delhi
The group is publishing highly acclaimed ‘Tecnia Journal of Management Studies’ containing high qualityresearch based articles and ‘Tecnia Times’ containing news round up twice a year in the month of March &September every year. 5000 copies of each publication reaches the Families of Students., Universities,Government Officials, Corporate Heads, Educational Intuitions and other Intellectuals in the Country andabroad,
The Journal & News Letter carries selective Advertisement from Public and Private Sector Organizations ofrepute. The Editor expect your good self to make use of this opportunity by booking your advertisementsfrom your esteemed organization in both or either of the above two publication.
The rates of advertisement for Tecnia Journal of Management Studies and Tecnia Times are mentioned hereunder:
Page Rates (Rs.)
Tecnia Journal Tecnia Times
Back Page 40,000/- 50,000/-
2nd Cover (Inside of Front Page) 30,000/- 40,000/-
3rd Cover (Inside of Back Page) 30,000/- 30,000/-
In side Full Page 20,000/- 20,000/-
In side Half Page 15,000/- 15,000/-
The material of the advertisement in soft copy and hard copy should reach the office of the Head CRC byFebruary and August in the respective year.
You are requested to kindly contact the Head CRC for any further clarification in this regards,
Looking forward to your kind co-operation and support.
S.P. DahiyaHead CRCTecnia Institute of Advanced StudiesMadhuban Chowk, DelhiContact No: 92117436824Email Id: [email protected] Email Id: [email protected]
Tecnia Journal of Management Studies Vol. 5 No. 1, April 2010 – September 2010
108
TECNIA GROUP OF INSTITUTIONSTecnia Institute of Advanced Studies (PG Campus)(Aff. to GGSIP University, App. by AICTE, Min. of HRD, Govt. of India)3, PSP, Institutional Area, Madhuban Chowk, Rohini, Delhi-85Website: www.tecniaindia.orgPh.: 27555121-22-23-24 Fax : 27555120
Tecnia Institute of Advanced Studies (UG Campus)(Aff. to GGSIP University, App. by Directorate of Higher Education Dept.)2A/2B, PSP, Institutional Area, Madhuban Chowk, Rohini, Delhi-85Website: www.tecniaindia.org Email : [email protected].: 27550341-42-43-44 Fax : 27555120
Tecnia Institute of Applied Studies(App. by AICTE, UGC & DEC Delhi)BD-1, Near Power House, Pitam Pura, Delhi-34Website: www.tecnia.co.in Email : [email protected].: 27319091-92 Fax : 27319090
Tecnia Institute of Art & Design(Aff. to IKSVV, Khairagarh, (C.G.)F-19/14, Sector-8, Rohini, Delhi-85Website: www.tidmfa.org Email : [email protected].: 27948900 Fax: 47010676
Tecnia Institute of Teachers Education(App. by National Council for Teacher Education)F-19/14, Sector-8, Rohini, Delhi-85Website: www.tite.in Email : [email protected].: 27948909/27948904, Fax: 47010676
Tecnia International School(Proposed Sr. Sec. School, CBSE Board)F-19, Sector-8, Rohini, Delhi-85 Ph.: 27948900/27942400Email : [email protected]
Tecnia Institute of Rehabilitation Sciences(Under Approval of Rehabilitation Council of India)5, PSP, Institutional Area, Madhuban Chowk, Rohini, Delhi-85
* Under active consideration
MBA (F/T), MBA (P/T), MCA (F/T)
BBA (F/T), BJMC (F/T)
PGDM, PGDEL, GDEL, PGDELITIGNOU Courses
MBA, MCA, M.Com, B.Com, BBA
MFA, BFA, B Music, B Dance
Affiliated to SCERT
ETE, ECCEIGNOU Courses
B Ed., MA (Edu), MLIS, BLIS, PGLANCETE, DCE, CTE, CFE, DECE, CIG
Class 1 to 12*
B Ed. (HI)*, B Ed. (MR)* BASLP*, PGDRP*
Where Dreams are Chiselled into Reality
TECNIA INSTITUTE OF ADVANCED STUDIES(Approved by AICTE, Ministry of HRD, Govt. of India and affiliated to GGS Indraprastha University, Delhi.)