41
Technical analysis Learning HotForex.com FOR TRADERS THAT WANT MORE
| Date post: | 23-Dec-2015 |
| Category: |
Documents |
| Upload: | monica-douglas |
| View: | 217 times |
| Download: | 2 times |
Technical analysis Learning
HotForex.com FOR TRADERS THAT WANT MORE
What is technical analysis?
In the study of market action, primarily through the use of charts, for the purpose of forecasting future price trends.

Chart construction

Chart constructionBARCHARTS
The barcharts show the open, high, low, and close of the prices.
Most charts use five day weeks.
Weekends are not shown on the chart.
Whenever an exchange is closed during the trading week, that day’s space is left blank.

Chart construction
The bar charts show the open, high, low, and close prices.

Chart construction
In the line chart, only the closing price is plotted for each successive day.

Chart construction
Candlesticks
• A wide portion of the bar (called the real body) measures a distance between the open and the close.
• A thin line (called the shadow) shows the day’s price range from the high to low.
• If the close is higher than the open, the real body is white (positive).
• If the close is lower than the open, the real body is black (negative)
• You can do everything with a candlestick chart that you can do with a barchart.
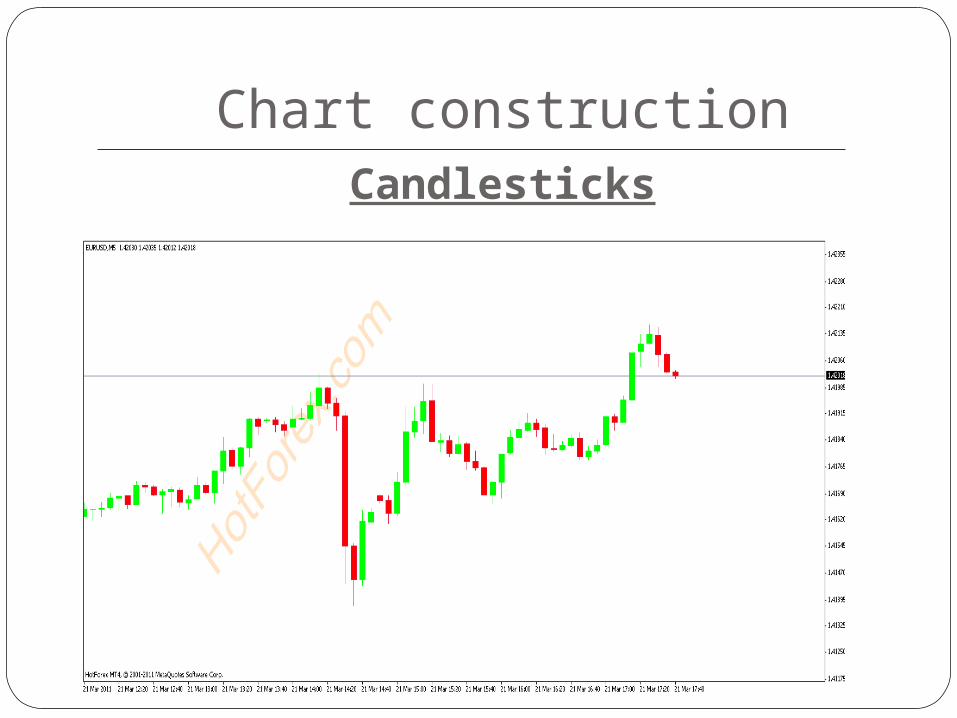
Chart constructionCandlesticks

philosophy

Philosophy or RationaleThere are three principles which the
technical approach is based:
Market action discounts everything.Prices move in trends.History repeats itself.

Market Action Discounts Everything
“market action discounts everything” is probably the cornerstone of technical analysis.
Unless the full significance of this first premise is fully understood and accepted, nothing else that follows makes much sense.

philosophyWhat affects a stock price…
FundamentalsInflation
Interest ratesSales
Political stabilityPsychological issues
… is actually reflected in the market price
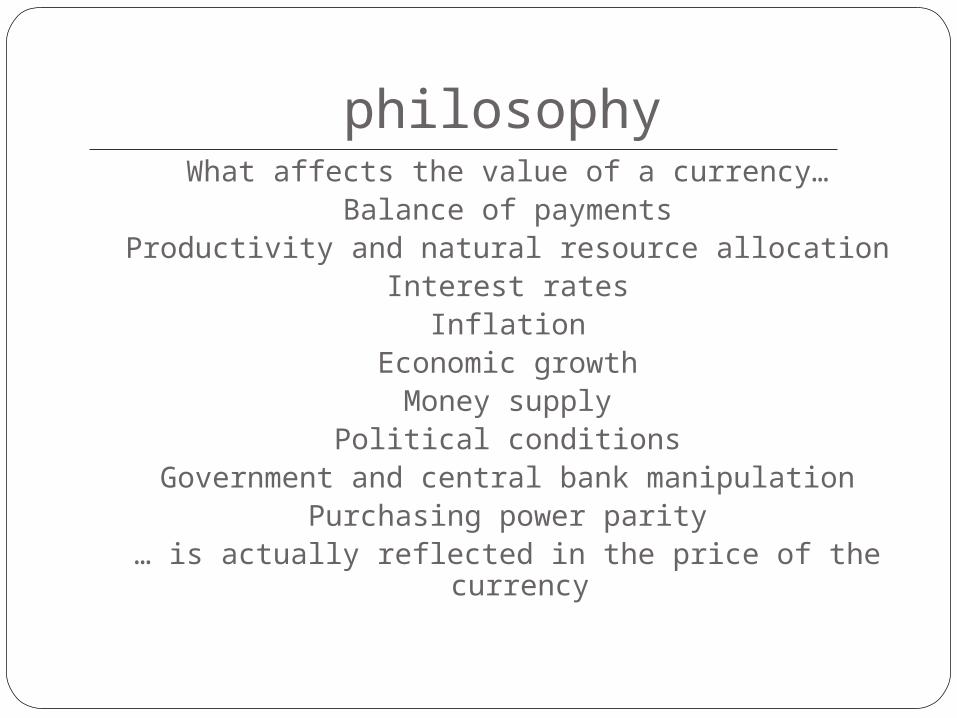
philosophyWhat affects the value of a currency…
Balance of paymentsProductivity and natural resource allocation
Interest ratesInflation
Economic growthMoney supply
Political conditionsGovernment and central bank manipulation
Purchasing power parity… is actually reflected in the price of the
currency

philosophyThe technician arrives to the conclusion that:If prices are rising, for whatever the specific
reasons, demand must exceed supply and the fundamentals must be bullish (good news). If prices fall, the fundamentals must be bearish (bad news).
The technician is indirectly studying fundamentals.
The charts do not in themselves cause markets to move up or down.

philosophyPrices Move in Trends
Unless one accepts the premise that markets do in fact trend, there’s no point in reading any further.
Most of the techniques are trend- following.A trend in motion is more likely to continue
than to reverse (this is an adaptation of Newton’s first law of motion).
philosophyHistory Repeats Itself
Since the patterns (like head and shoulders) have worked well in the past, it is assumed that they will continue to work well in the future.
They are based on the study of human psychology, which tends to change.

philosophyTechnical Versus Fundamental
Forecasting
Both of these approaches attempt to solve the same problem, which is:
to determine the direction prices are likely to move.
philosophyThe Fundamental Approach:• Examines all of the relevant factors affecting
the price of a market in order to determine the intrinsic value of that market.
• If this intrinsic value is under the current market price, then the stock is overpriced and should be sold.
• The fundamental studies the causes of market movement.
• The fundamentalist always has to know why.

philosophyThe technician:Studies the effect of the market movement
and believes that the reasons, or the causes, are unnecessary.
The technical approach includes the fundamentals.
Chart reading becomes a shortcut from of fundamental analysis. The reverse, however, is not true.

philosophyThe problem is that the charts and fundamentals are often in conflict with each other, because:
• Market price tends to lead the known fundamentals.
• While the known fundamentals have already been discounted and are already “in the market”, prices are reacting to the unknown fundamentals.
• Market price acts as a leading indicator of the fundamentals.
philosophy
TECHNICAL ANALYSIS ADVANTAGES

philosophy1. Flexibility and Adaptability
• The chartist can easily follow as many markets as desired, which is generally not true of the fundamentalists.
• The chartist can rotate attention and capital to take advantage of the rotational nature of the markets.
• Most fundamentalists tend to specialize only in one group.
• The technician has the “big picture”.

philosophy2. T.A Applied to Different Trading Mediums
T.A. was first applied to stock markets and later adapted to futures.
Technical principles apply to:Interest rate marketsForeign currenciesOption tradingGenerally in hedging process
philosophy
Is it true that Fundamental analysis is for long term forecasting and T.A is for short term trading ???????
philosophy3. T.A. Applied to Different Time Dimensions
The same principle apply:
For the intra day (tic-by-tic)
Or for day trading purposes
For trend trading the intermediate or long term trend (weekly, monthly, and yearly charts)
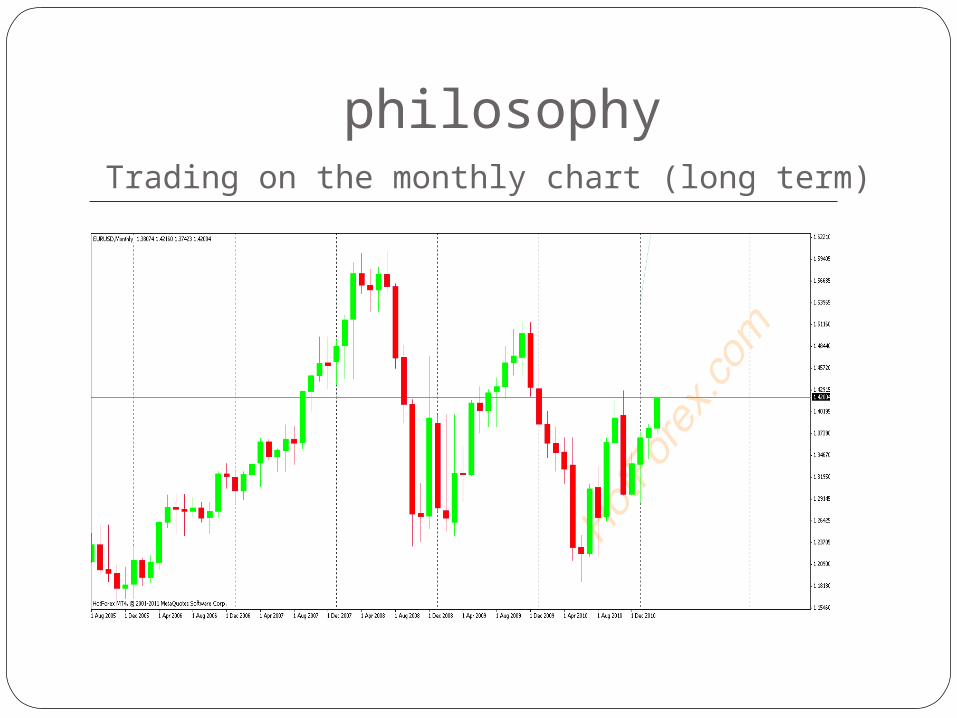
philosophyTrading on the monthly chart (long term)

philosophyWe can look for a trend on the weekly chart (medium
trend)
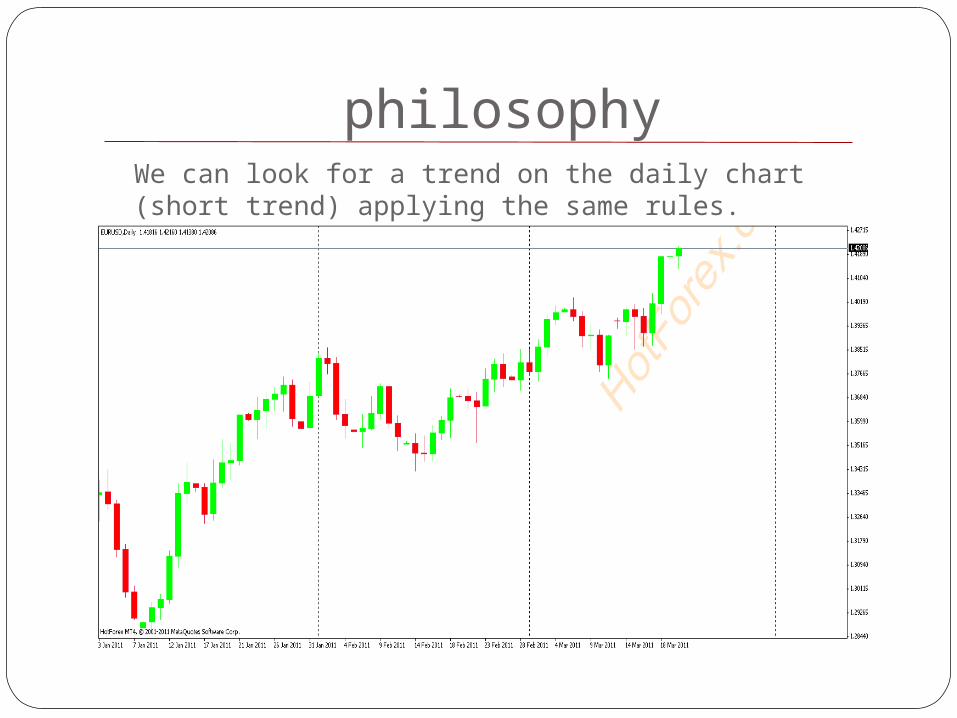
philosophyWe can look for a trend on the daily chart (short trend) applying the same rules.

philosophy4. T.A can play a role for Economic
Forecasting
If someone observes the charts of commodities can predicts the strength or weakness of the economy.
US dollar and foreign currency futures also provide early guidance about the strength or weakness of the respective economy.
Some Criticisms of Technical Analysis

philosophy
a. The Self-Fulfilling ProphecyThe use of most patterns has been widely publicized in the last several years.
Many traders are quite familiar with these patterns and often act on them in concert.
This creates a “Self-Fulfilling Prophecy”, as waves of buying or selling are created in response to “bullish” or “bearish” patterns..

philosophy
b. Chart pattern are almost completely subjective.
No study has yet succeeded in mathematically quantifying any of them.
They are literally in the mind of the beholder.
philosophyThey can’t, on the hand, criticize charting for
being so objective and obvious that everyone will act in the same way at the same time (thereby causing the price pattern to be fulfilled) and then also criticize charting for being too subjective.
Even if most technicians did agree on a market forecast, they would not all necessarily enter the market at the same time and in the same way.

philosophyTraders would rely heavily on charts until their
concerted action started to affect or distort the market.
When this happened, they would either stop using the charts or adjust their trading tactics.
Bull and bear market only occur and are maintained when they are justified by the law of supply and demand.
After all any forecasting technique to become so popular that it begins to influence events, it would have to be pretty good.

philosophy
“charts tell us where the market has been, but can’t tell us where it is going”
!!!!!!!!!!
philosophy
Can the PastBe Used to
Predict the Future?

philosophyEvery known method of forecasting, from
weather predicting to fundamental analysis, is based completely on the study of past data.
Charts analysis, is just another form of time series analysis, based on a study of the past, which is exactly what is done in all forms of time series analysis.
The use of past price data to predict the future in technical analysis is grounded in sound statistical concepts.

philosophyRandom Walk Theory
The academic community claims that:Price changes are “serially independent”
and
That price history is not a reliable indicator of future price direction.
philosophyHow do the “random walkers” explain the
persistence of trends, in all markets, if prices are serially independent, meaning that what happened yesterday, or last week, has no bearing on what may happens today or tomorrow?
How do they explain the profitable “real life” track records of many trend following systems.
How would a buy and hold strategy fare in the commodity futures markets where timing is so crucial?
philosophyThe Efficient Market Hypothesis is very
close to the technical premise that market discounts everything.They believe that markets discount quickly all information and there’s no way to take advantage of that information.
The basis of technical forecasting is that market information is discounted in the market price long before it becomes known.

philosophyA process appears random and
unpredictable only to those who do not understand the rules under which that process operates.
A number of leading American universities have begun to explore Behavioural Finance which maintains that human psychology and securities pricing are interrelated.


