28
Technical Analysis of Equity Markets Tridib Chatterji Al Akhawayn University, Ifrane, Morocco April 2004
| Date post: | 15-Dec-2015 |
| Category: |
Documents |
| Upload: | logan-braham |
| View: | 219 times |
| Download: | 1 times |

Technical Analysis of Equity Markets
Tridib ChatterjiAl Akhawayn University,Ifrane, Morocco
April 2004
Objectives
Learn a little about: Technical Analysis (TA) the relationship between TA and FA types of graphs Indicators TA vocabulary Trends

What I want From You
Participation Ask questions Answer MY questions Keep your eyes open Laugh at my jokes
To have fun
Let’s talk a little about…
Sheep

Fundamental Analysis Ratio Analysis Analysis of Balance Sheet Analysis of Income Statements SEC Form 10K Sector Analysis Analysis of Indices (NYSE, FTSE,
NASDAQ, etc)
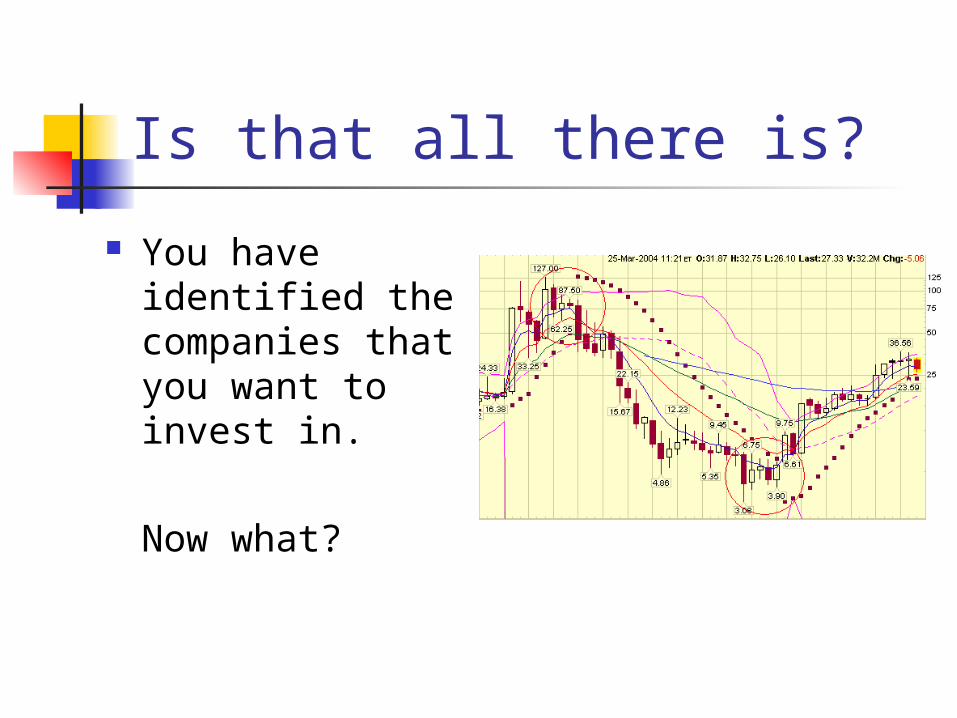
Is that all there is?
You have identified the companies that you want to invest in.
Now what?
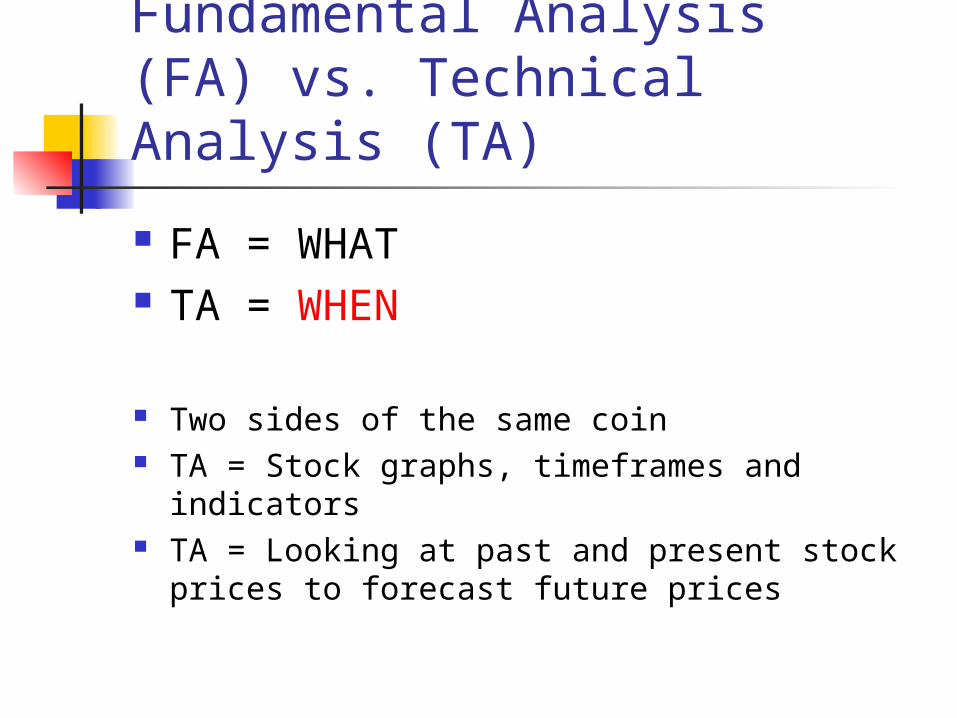
Fundamental Analysis (FA) vs. Technical Analysis (TA)
FA = WHAT TA = WHEN
Two sides of the same coin TA = Stock graphs, timeframes and indicators TA = Looking at past and present stock prices
to forecast future prices
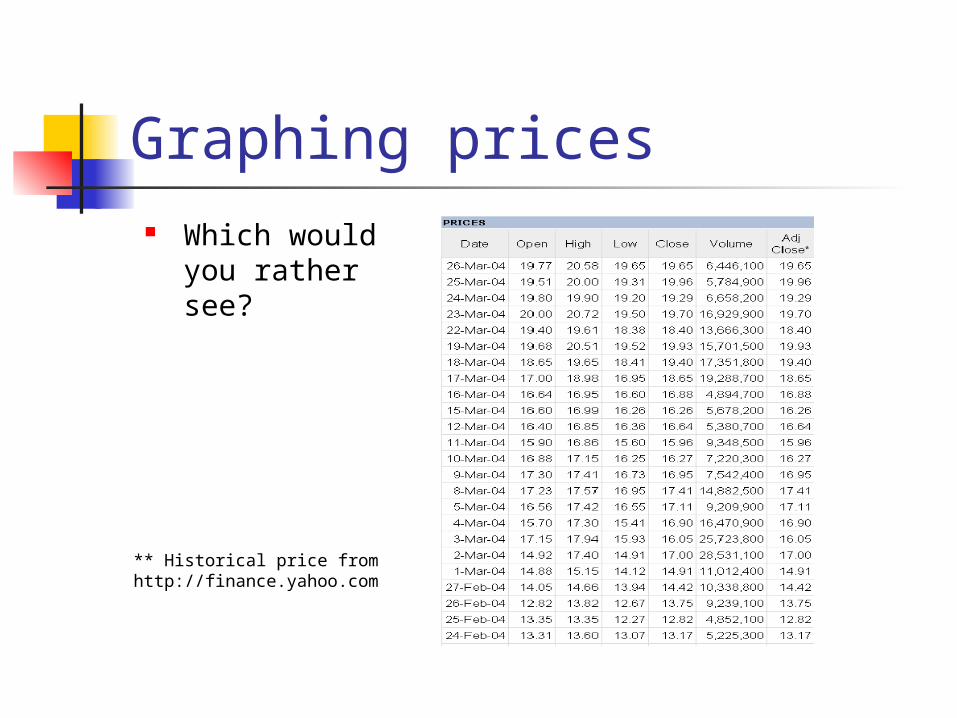
Graphing prices Which
would you rather see?
** Historical price from http://finance.yahoo.com

Graphing prices (#2)
Which would you rather see? #2

Types of Graphs (1) Line Graph

Types of Graphs (2) OHLC (Open, High Low, Close)

Types of Graphs (3) Candlesticks

Types of Graphs – Candlesticks 1 Developed by Japanese rice
traders in the 17th century: Price action is more important
than news (What vs. Why) All news is factored into the price Buying and selling happens
through expectations and emotions
Price may not reflect actual value

Types of Graphs – Candlesticks 2
White body = Up day Black body = Down day

Types of Graphs – Candlesticks 3

What do OHLC and Candlesticks Show?
Opening price Closing price Low of the day (LOD) High of the day (HOD)
What’s missing?

More Graphs… What’s missing?
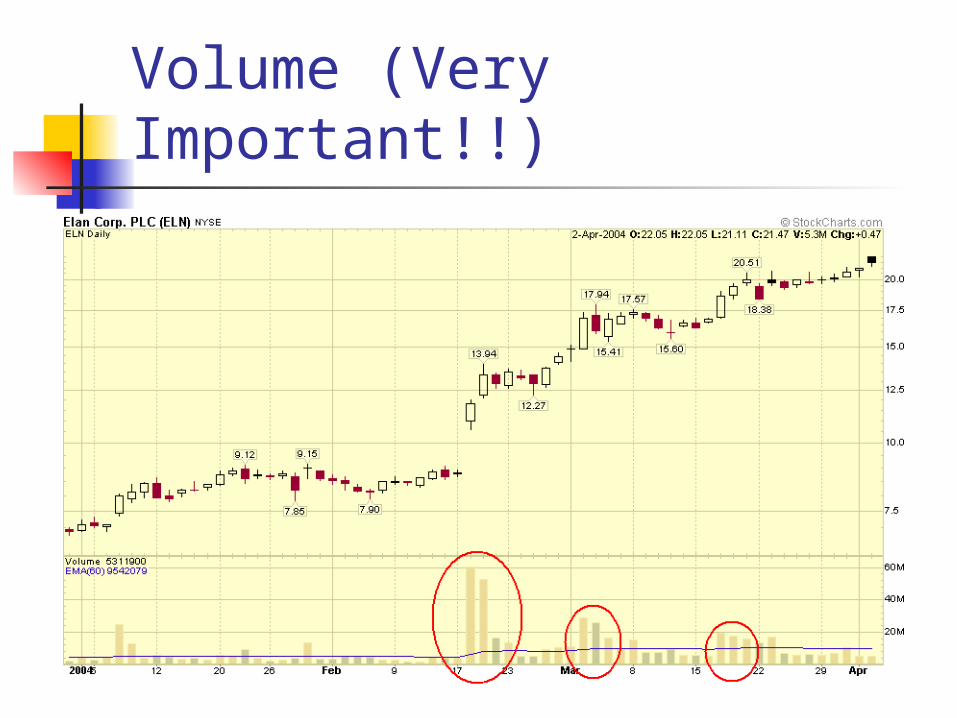
Volume (Very Important!!)

Vocabulary

Indicators – Moving Averages Simple/Exponential Moving Averages:
Building blocks for other indicators Calculated using CLOSING prices Smoothes a data series to spot trends Used over various time periods
(5,10,20,50,200) SMA vs. EMA
SMA gives equal weight to ALL prices EMA gives more weight to RECENT prices
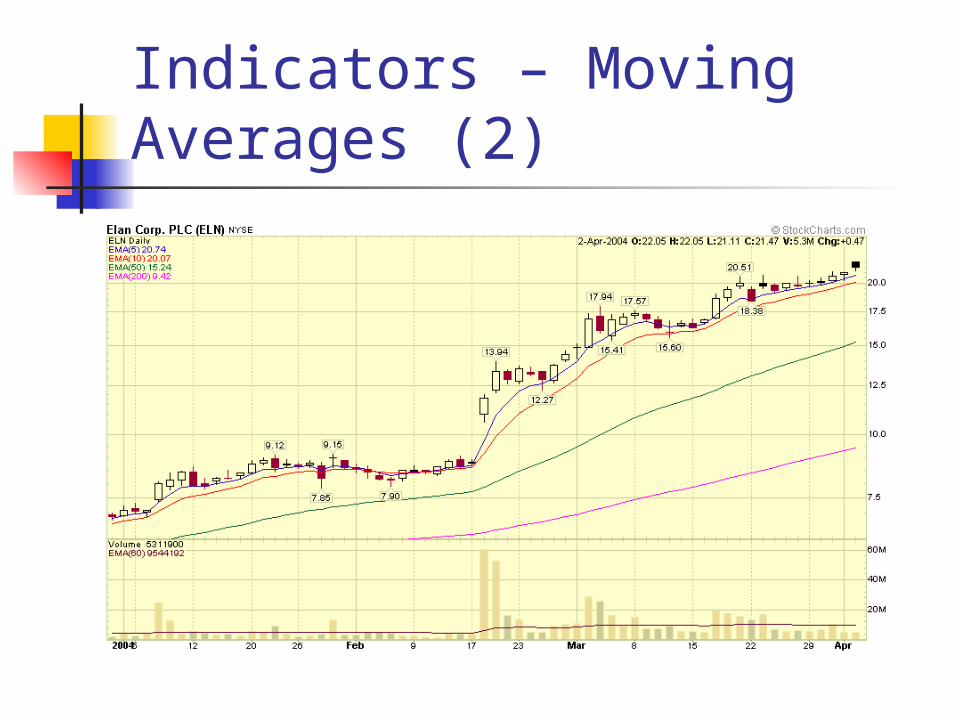
Indicators – Moving Averages (2)

Indicators – Bollinger Bands
Envelope indicator Developed by John Bollinger Used to compare volatility and prices
over a time period 20-period SMA in the middle of the band 20-period SMA + 2 standard deviations
(Upper) 20-period SMA - 2 standard deviations
(Lower)

Indicators – Bollinger Bands (2)
Trends (Dow Theory) Primary Trends:
Can last from a few months to a few years Not usually affected by news
Secondary Trends: Few weeks to a few months Goes against the primary trend
Daily Fluctuations: Affected by news Usually unreliable Used as a building block for longer trends

Trends – Primary Trend

Other indicators Moving Average Convergence
Divergence (MACD) Relative Strength Index (RSI) On Balance Volume (OBV) Stochastics Williams %R Money Flow Index (MFI) And many, many more….

Stock Charting Site
http://www.askresearch.com

Questions?


![Al Akhawayn University in Ifrane - home · 1361.1] (2011 16) 1432 91 (Master ofsciencc in corporate finance) (Mastcr of business administration) business of (Executive master administration)](https://static.documents.pub/doc/80x56/60678207f95c06080d653051/al-akhawayn-university-in-ifrane-13611-2011-16-1432-91-master-ofsciencc-in.jpg)


