16
Technical Analysis Technical Analysis Presentation on Price Action Analysis By Sudeep Tiwari
| Date post: | 17-Dec-2015 |
| Category: |
Documents |
| Upload: | marybeth-mccarthy |
| View: | 220 times |
| Download: | 1 times |

Technical AnalysisTechnical Analysis
Presentation on Price Action
Analysis
By Sudeep Tiwari

Why Price Action Analysis ?Why Price Action Analysis ? Kiss Principle : The ‘KISS’
principle states that most systems work best if they are kept simple rather than made complicated;therefore simplicity should be a key goal in design and unnecessary complexity should be avoided.
Supremacy of Price : Price movement is capable to reflect the movement of the market.
History Repeats Again : Some chart patterns tend to repeat themselves.

Various Price Action Various Price Action Analysis TechniquesAnalysis Techniques
Trades From Supports & Resistance with confirmation. (My favourite)
Breakouts of Support and Resistance.
Trend Line Breakouts After Confirmation. (My Favourite)
Price Pattern Breakouts i.e.; Double Top, Double Bottom, Head & Shoulder Pattern, Saucer, Flag & Pennants, Triangles, Wedges etc.
Pullbacks after Breakouts.(My Favourite)
Failure Breakouts. (My Favourite) Candlestick Patterns. Point & Figure Patterns. Divergence.(My Favourite) Stop & Reverse.
Failure BreakoutsFailure Breakouts
Failures breakout of Important support and resistance.
Failure of price patterns.
Failure of important candlestick patterns.

Failure of Price Patterns Failure of Price Patterns BreakoutsBreakouts
Price patterns are very popular in technical analysis, because of the risk reward ratio.
But the accuracy of price patterns are not too high. Specially patterns like double top and double bottoms fails frequently.
Only few patterns like head & shoulder, wedges, channels and saucer gives good accuracy.
But the failure of these price patterns gives very successful opportunity to trade.
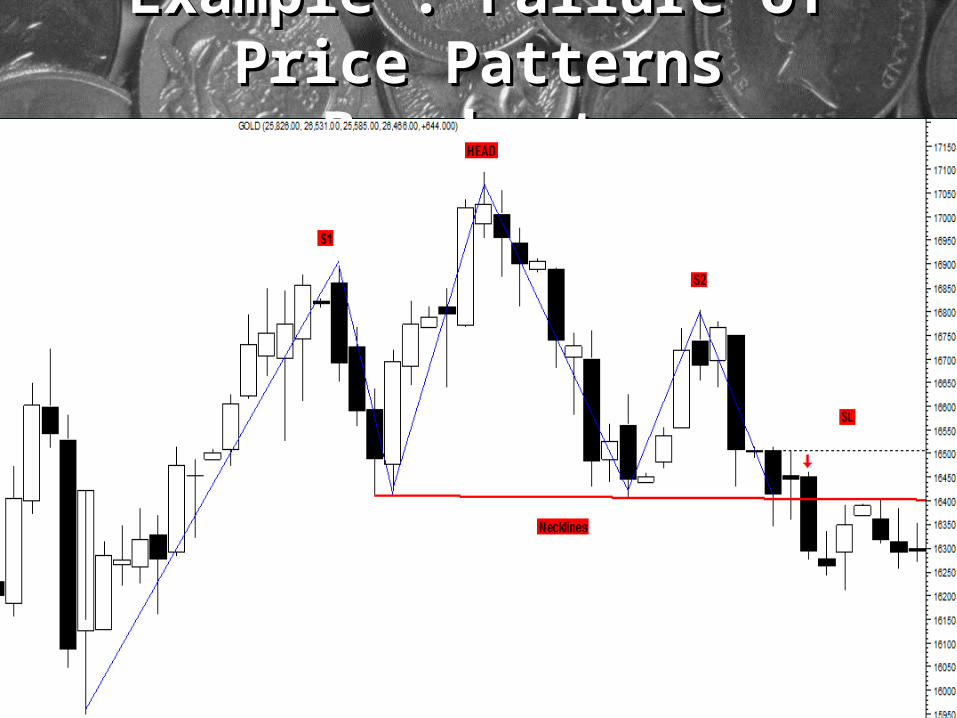
Example : Failure of Example : Failure of Price Patterns Price Patterns
BreakoutsBreakouts

Example: Failure of Example: Failure of Price Pattern Price Pattern
BreakoutsBreakouts

Example : Failure Of Example : Failure Of Price Pattern BreakoutPrice Pattern Breakout

Example: Failure Example: Failure Breakouts of Price Breakouts of Price
PaternsPaterns
Trade Divergence Trade Divergence Through Price ActionThrough Price Action
Divergence forms because of accumulation or distribution.
So breakouts after divergence works more accurately than any other condition.
Divergence also produces opportunity of top and bottom fishing.
Price action is capable to identify regular, hidden and slant divergence.
No indicator is required to identify divergences.

Regular Bearish Regular Bearish Divergence Through Divergence Through
Price ActionPrice ActionBearish Divergence(By Oscillator)
Bearish Divergence(By Price Action)

Regular Bullish Regular Bullish Divergence Through Divergence Through
Price ActionPrice ActionDivergence through oscillator
Divergence through price action

Go Mechanical : Stop & Go Mechanical : Stop & ReverseReverse
Stop & Reverse is a very popular concept of mechanical and algo trading.
Various technical indicators i.e. parabolic sar, supertrend and moving averages are used in mechanical trading.
Price action analysis gives more accurate opportunity of stop & reverse trading.

Go Mechanical : Stop & Go Mechanical : Stop & ReverseReverse

Go Mechanical : Stop & Go Mechanical : Stop & ReverseReverse


