Technical Assistance Consultant’s Report This consultant’s report does not necessarily reflect the views of ADB or the Government concerned, and ADB and the Government cannot be held liable for its contents. (For project preparatory technical assistance: All the views expressed herein may not be incorporated into the proposed project’s design. Project Number: 50158-001 February 2020 Technical Assistance Number: 9245 Regional: Supporting Implementation of Environment- Related Sustainable Development Goals in Asia and the Pacific (Viet Nam Subproject) MONRE Environmental Monitoring and Evaluation Implementation Guidance With Background Documentation on Progress Towards Implementation of the Environment Related SDGs in Viet Nam Prepared by: Katharine Thoday, Nguyen Phong, and Le Duc Chung Asian Development Bank is the executing and implementing agency.
Transcript
Technical Assistance Consultant’s Report
This consultant’s report does not necessarily reflect the views of ADB or the Government concerned, and ADB and the Government cannot be held liable for its contents. (For project preparatory technical assistance: All the views expressed herein may not be incorporated into the proposed project’s design.
Project Number: 50158-001 February 2020 Technical Assistance Number: 9245
Regional: Supporting Implementation of Environment-
Related Sustainable Development Goals in Asia and
the Pacific (Viet Nam Subproject)
MONRE Environmental Monitoring and Evaluation Implementation Guidance
With Background Documentation on Progress Towards Implementation of the Environment Related SDGs in Viet Nam
Prepared by: Katharine Thoday, Nguyen Phong, and Le Duc Chung
Asian Development Bank is the executing and implementing agency.
1
MONRE Environmental Monitoring and
Evaluation Implementation Guidance
With background documentation on progress towards
implementation of the Environment Related SDGs in Viet
Nam
Phase 2 of TA 9245: Supporting Implementation of the Environment-Related
SDGs in Asia and the Pacific Produced with the support of the Asian Development Bank under a regional technical assistance
on Supporting Implementation of Environment-Related Sustainable Development Goals in Asia and
the Pacific
Prepared for ISPONRE by ADB Consultants Katharine Thoday, Nguyen Phong and Le Duc Chung,
This Guidance has been developed with Government stakeholders as a response to Phase 2 of
TA9245: Supporting Implementation of the Environment-Related SDGs in Asia and the Pacific.
Background to its’ development can be found in the accompanying report.
Monitoring, evaluation, and reporting is where efforts are made to monitor progress and track
implementation. It includes collecting and monitoring data and identifying policy effects. The
statistical interpretation of “implementation” is “Can national statistical systems provide reliable
data?”
The governance interpretation is “Can we get these indicators to move in the right direction?” The
Guidance addresses actions needed to improve both policy coherence and data management in
order to achieve implementation of environmental indicators. Consolidated Guidance has also been
provided for 8 of the 10 Viet Nam SDG Indicators that were prioritized for initial implementation. For
each indicator information is provided on Definitions, Methodology, Data Source and Flow with
recommendations made to address gaps and overlaps.
The Guidance is based on the following 5 principles:
1. Targets can only be achieved where there is a co-ordinated policy response
2. Indicators should inform management decisions
3. Ensure professional oversight and quality control of data management
4. Apply new technologies and new sources of data collection
5. Increase data sharing
These Principles inform the 9 actions (See Table below) which are assigned implementation periods
and lead agencies to take forward. Accompanying templates and resources for the Actions can be
found in the Annexes to the Guidance.
Issues Actions to Address
A. Coordinated Policy Response I. Link environmental targets to social and
economic targets
II. Link & prioritise environmental targets
B. Data informs management decisions I. Link investment to environmental criteria
C. Professional oversight I. Strengthen professional management
II. Self-assessment of statistical quality
D. Apply new technologies and sources of
data collection
I. Monitor data collection effectiveness
II. Increase third party data sharing &outsource
4
data collection
III. Increase digital monitoring
E. Data Sharing I. Clearly advise Provinces on data that can be
shared
5
A. COORDINATED POLICY RESPONSE
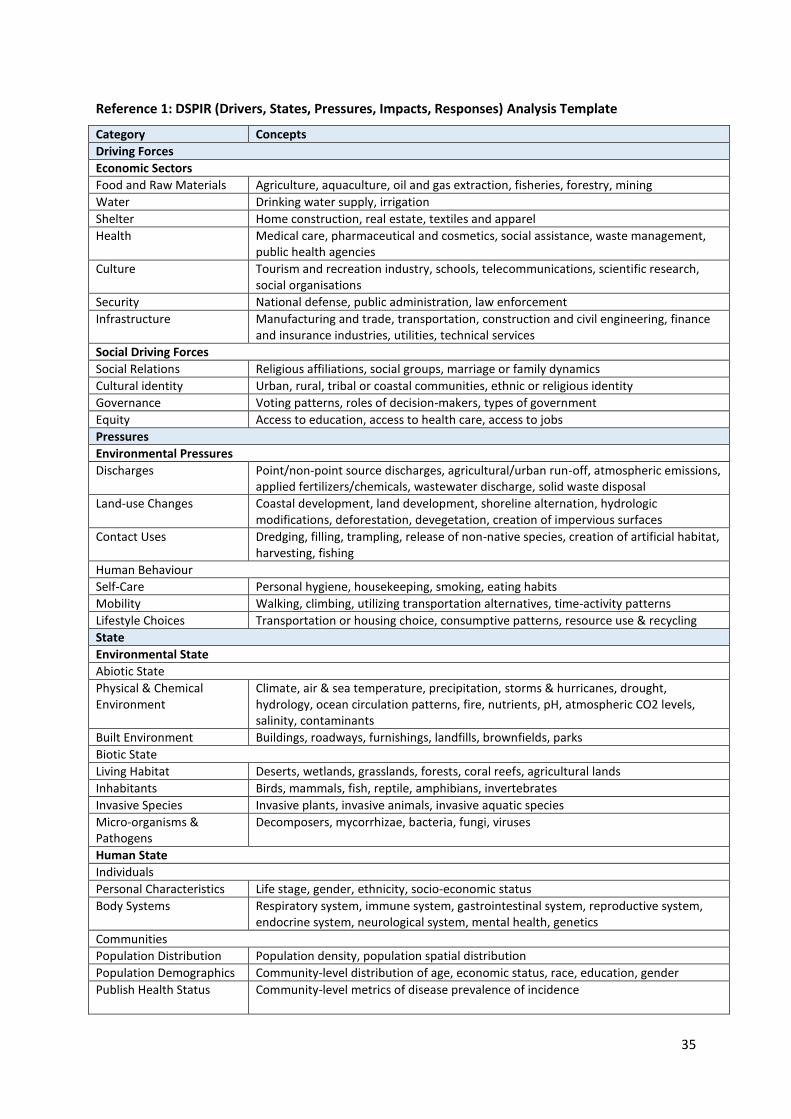
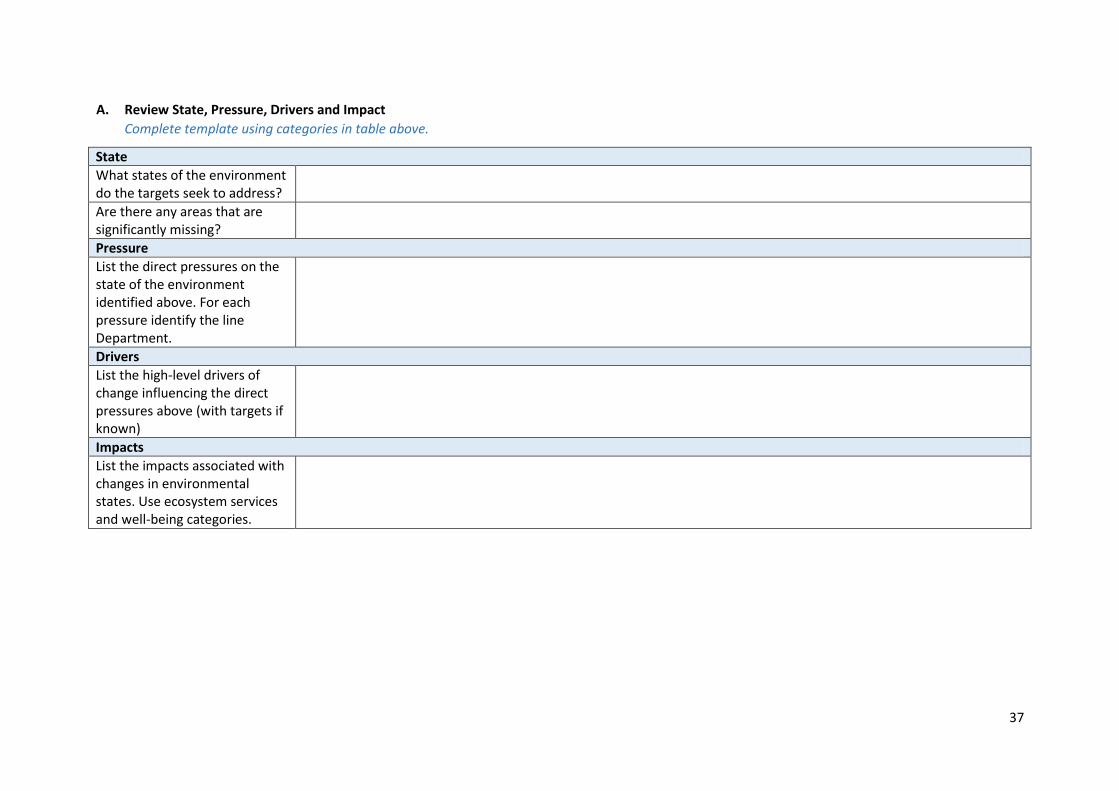
MONRE needs to take a strategic approach to ensure that there is an understanding within MONRE of drivers and pressures outside its’ mandate that will impact on achievement of targets. It can be useful to carry out a DSPIR (Drivers, States, Pressures, Impacts, Responses) analysis with key stakeholders. (See
Reference 1).
For environmental targets to be considered more systematically MONRE should also seek to engage other Ministries where achievement of an
environmental objective will be critical to the achievement of social and economic targets.
It is suggested to use the critical interlinkages template on relevant annual Ministerial targets to facilitate an approach to improving policy coherence. (See
Reference 2).
Action One
Implementation
Period
Lead MONRE
Agency
Other Parties Involved Templates & Resources
Link environmental targets
to social and economic
targets
Annually in line with
Ministerial Target Setting
Department for Finance &
Planning
MONRE Agencies
Other Ministries
Reference 1 – DSPIR template
Reference 2 – Critical
Interlinkages template
6
There will always be new or revised Action Plans and MEA indicators requiring a need for co-ordination and prioritization. There should be a focus on
collecting the information on prioritized indicators before expanding to other indicators. Otherwise there is a risk that data will be collected inconsistently
and may be of no value.
The request for new or amended indicators should be integrated into the existing Ministerial statistical system. The Department for Planning & Investment
should maintain an index of indictors that relate to different indicator codes to minimise confusion and streamline efficiency in sharing information with
different audiences.
Indicators should be reviewed during annual Ministerial target setting to understand the extent they are informing targets and ensure any need for
modification can be incorporated.
The initial focus on data collection should always be on targets in the national and local SEDP andindicators in the NSIS and provincial statistical indicator
systems.
Information on relevant prioritised indicators and methodologies should be shared with all project partners, so that new projects can support relevant data
collection or suggested modifications to existing indicators can be incorporated systematically.
Currently indicators within MONRE are divided into 13 themes relating to 13 institutional responsibilities. It is suggested this makes data sharing across
themes difficult. The following changes are recommended:
“Environment” theme split into “Pollution Control” &“Biodiversity & Ecosystem Services”
Relevant indicators from “Land” and “Water Resources” included in “Pollution Control” & “Biodiversity & Ecosystem Services” themes
Action Two
Implementation
Period
Lead MONRE
Agency
Other Parties Involved Templates & Resources
Link and Prioritise
Environmental Targets
Annually in line with
Ministerial Target Setting
Department for Finance &
Planning
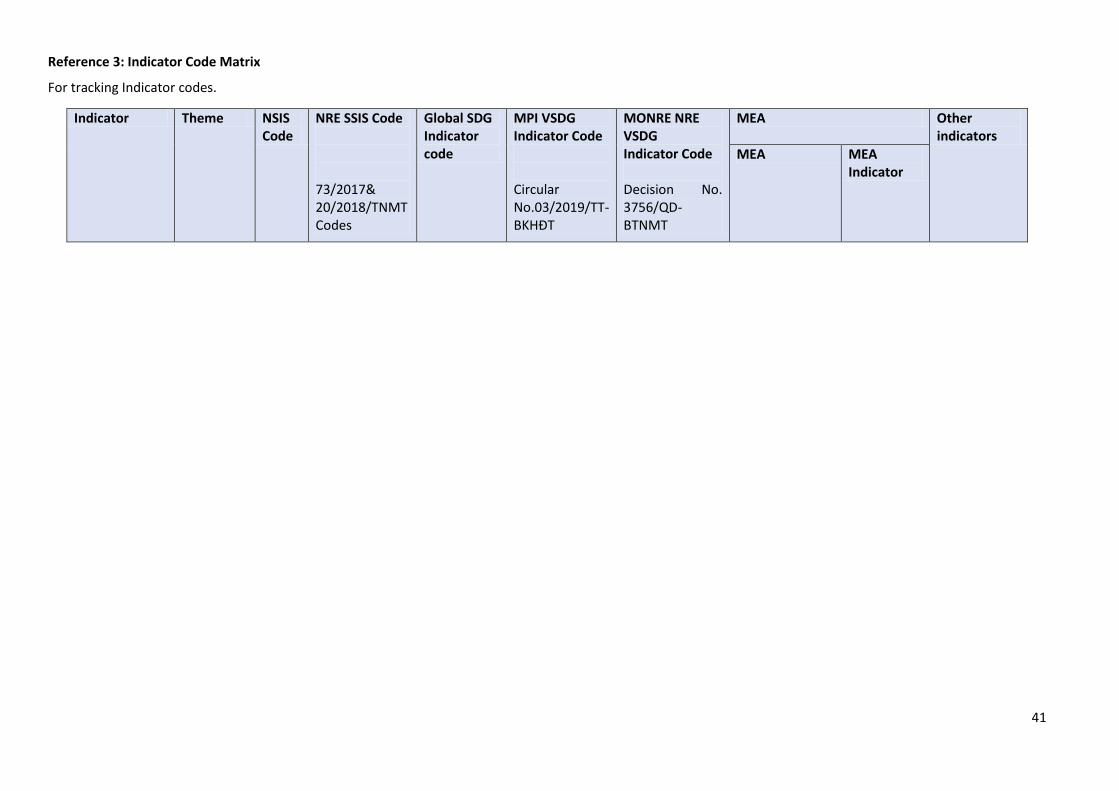
DONREs Reference 3 - template
indicator matrix
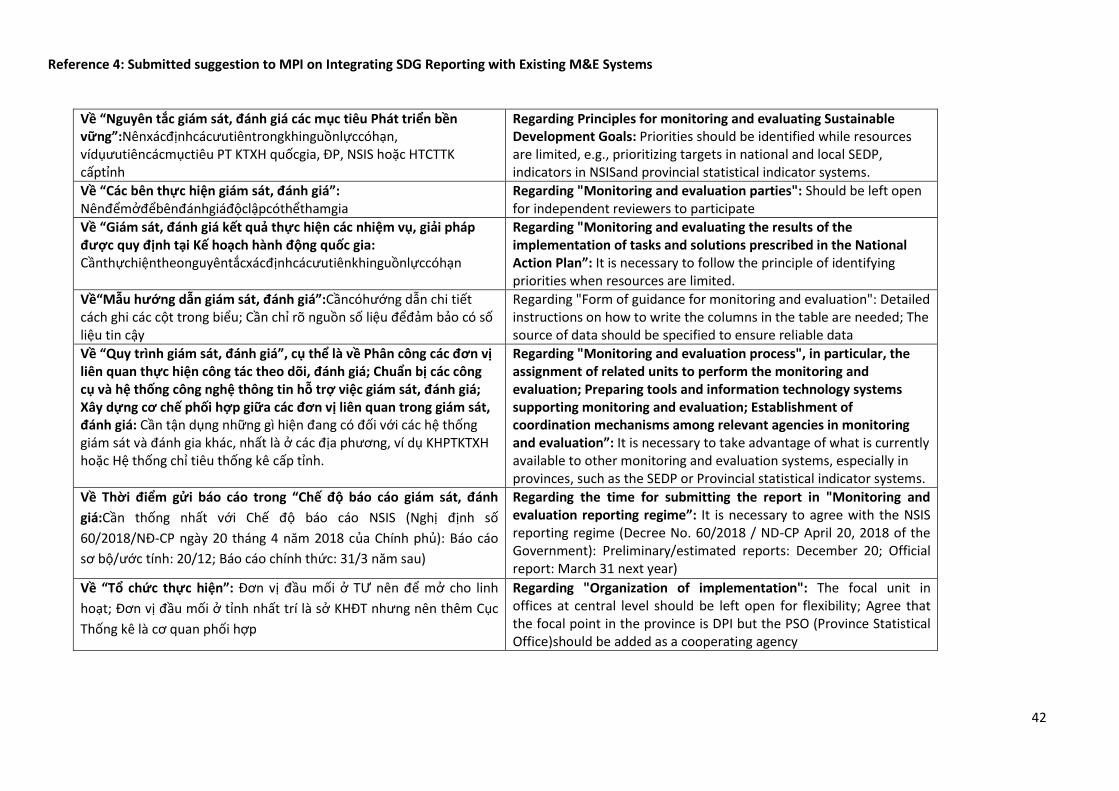
Reference 4 - suggestion to
MPI on integrating SDG
system with existing M&E
systems
7
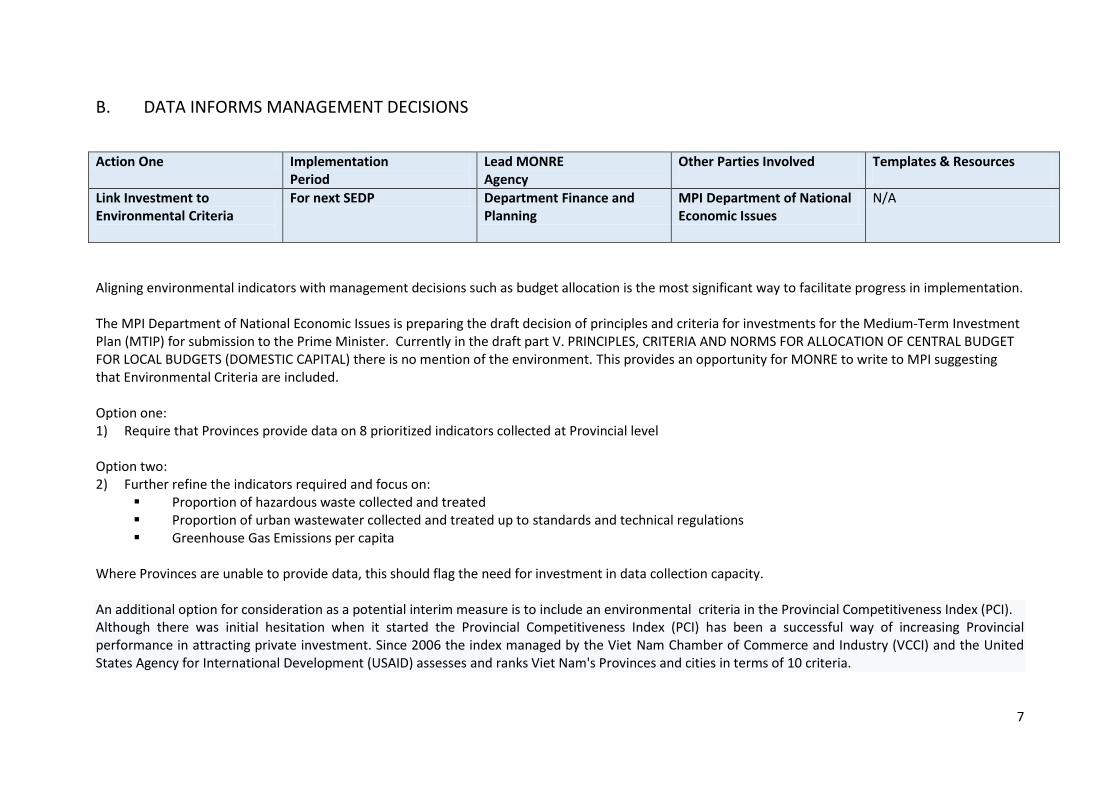
B. DATA INFORMS MANAGEMENT DECISIONS
Aligning environmental indicators with management decisions such as budget allocation is the most significant way to facilitate progress in implementation.
The MPI Department of National Economic Issues is preparing the draft decision of principles and criteria for investments for the Medium-Term Investment
Plan (MTIP) for submission to the Prime Minister. Currently in the draft part V. PRINCIPLES, CRITERIA AND NORMS FOR ALLOCATION OF CENTRAL BUDGET
FOR LOCAL BUDGETS (DOMESTIC CAPITAL) there is no mention of the environment. This provides an opportunity for MONRE to write to MPI suggesting
that Environmental Criteria are included.
Option one:
1) Require that Provinces provide data on 8 prioritized indicators collected at Provincial level
Option two:
2) Further refine the indicators required and focus on:
Proportion of hazardous waste collected and treated
Proportion of urban wastewater collected and treated up to standards and technical regulations
Greenhouse Gas Emissions per capita
Where Provinces are unable to provide data, this should flag the need for investment in data collection capacity.
An additional option for consideration as a potential interim measure is to include an environmental criteria in the Provincial Competitiveness Index (PCI).
Although there was initial hesitation when it started the Provincial Competitiveness Index (PCI) has been a successful way of increasing Provincial
performance in attracting private investment. Since 2006 the index managed by the Viet Nam Chamber of Commerce and Industry (VCCI) and the United
States Agency for International Development (USAID) assesses and ranks Viet Nam's Provinces and cities in terms of 10 criteria.
Action One Implementation
Period
Lead MONRE
Agency
Other Parties Involved Templates & Resources
Link Investment to
Environmental Criteria
For next SEDP Department Finance and
Planning
MPI Department of National
Economic Issues
N/A
8
The VCCI is responsible for VSDG 12.6 Encourage the business community to adopt sustainable practices, including cleaner production technology, efficient
use of natural resources, and environmental protection; carrying out social responsibilities for the poor and vulnerable groups and integrate sustainability
information into periodical reports
There is therefore an opportunity to write to VCCI and suggest the inclusion of an environmental indicator in the PCI that links to achievement of this
objective such as:
Proportion of hazardous waste collected and treated
Proportion of urban wastewater collected and treated up to standards and technical regulations
Greenhouse Gas Emissions per capita
Annual mean levels of fine particulate matter (e.g. PM2.5 and PM10) in cities (population weighted)
9
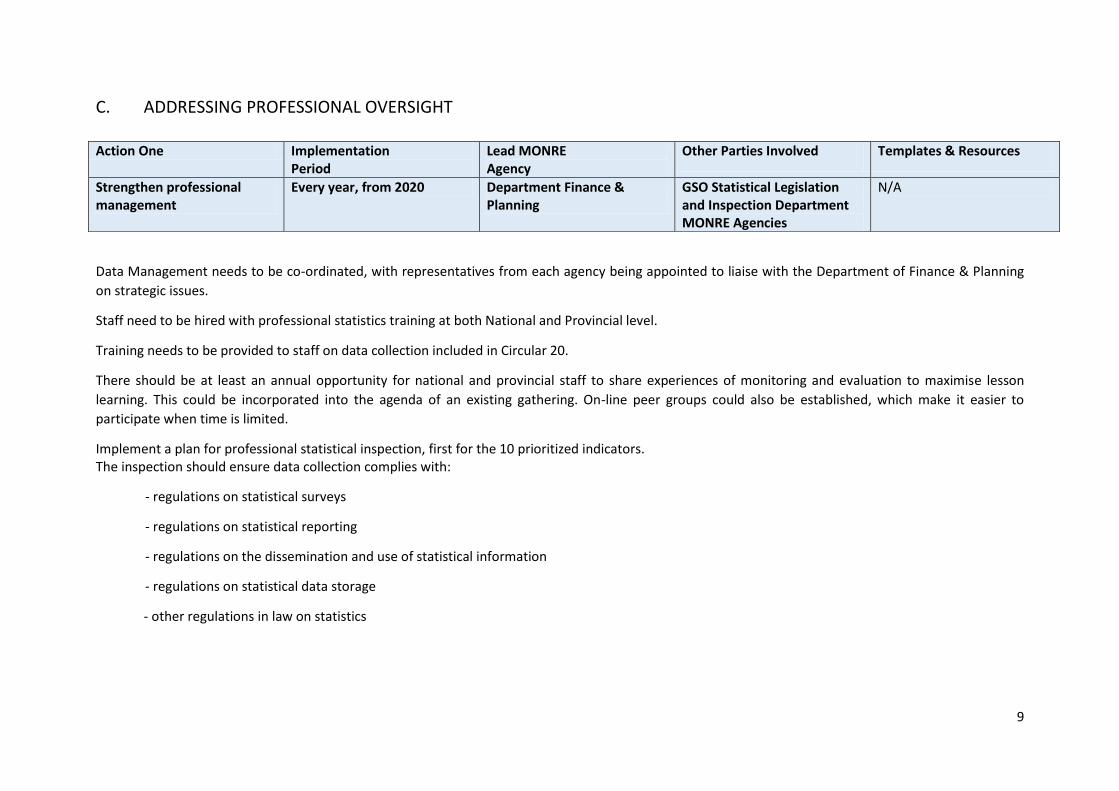
C. ADDRESSING PROFESSIONAL OVERSIGHT
Data Management needs to be co-ordinated, with representatives from each agency being appointed to liaise with the Department of Finance & Planning
on strategic issues.
Staff need to be hired with professional statistics training at both National and Provincial level.
Training needs to be provided to staff on data collection included in Circular 20.
There should be at least an annual opportunity for national and provincial staff to share experiences of monitoring and evaluation to maximise lesson
learning. This could be incorporated into the agenda of an existing gathering. On-line peer groups could also be established, which make it easier to
participate when time is limited.
Implement a plan for professional statistical inspection, first for the 10 prioritized indicators.
The inspection should ensure data collection complies with:
- regulations on statistical surveys
- regulations on statistical reporting
- regulations on the dissemination and use of statistical information
- regulations on statistical data storage
- other regulations in law on statistics
Action One Implementation
Period
Lead MONRE
Agency
Other Parties Involved Templates & Resources
Strengthen professional
management
Every year, from 2020 Department Finance &
Planning
GSO Statistical Legislation
and Inspection Department
MONRE Agencies
N/A
10
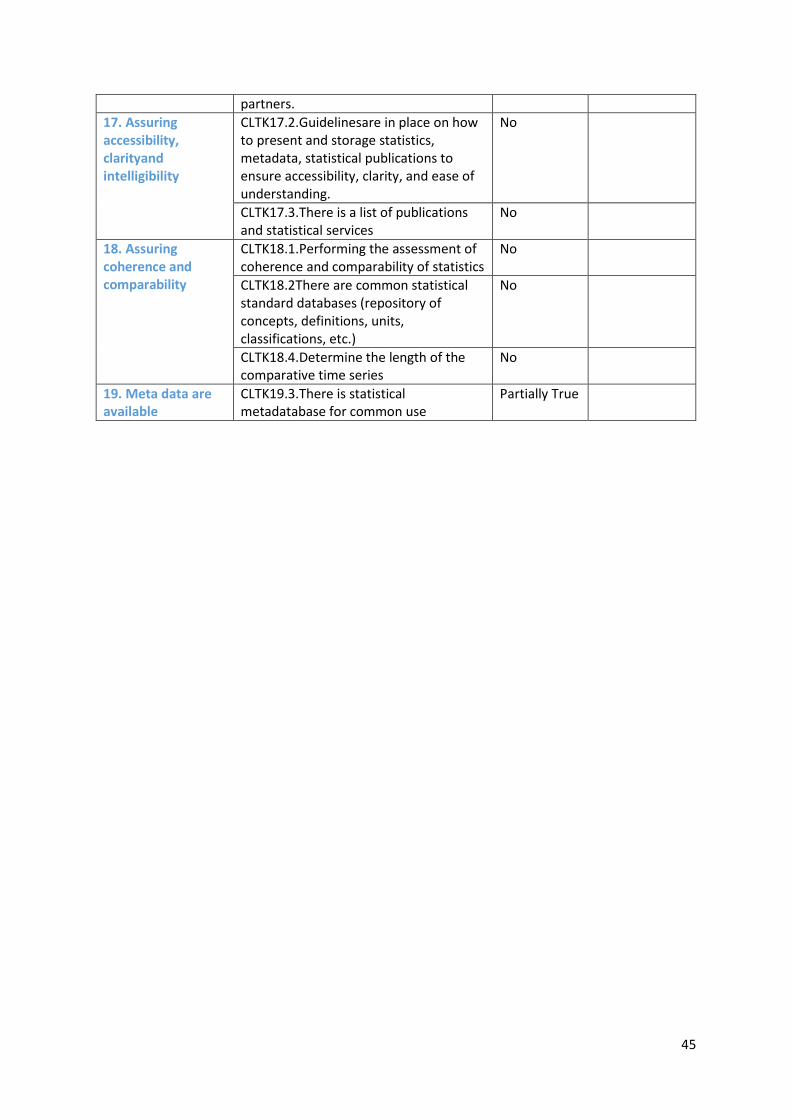
Carry out the self-assessment of statistical quality according to the set of criteria for quality statistics in Decision No.01/2019 on Criteria for Quality of State
Statistics, first for the 10 prioritized indicators. Send to the Ministry of Planning and Investment (GSO) a report on the self-assessment (Article 2, Clause 2,
Decision No. 01/2019/QD-TTg of the Prime Minister promulgating the set of criteria of state statistics to 2030).
Action Two Implementation
Period
Lead MONRE
Agency
Other Parties Involved Templates & Resources
Self-assessment of statistical
quality
Every year, from 2020 Finance and Planning
Department
MONRE units producing
statistics
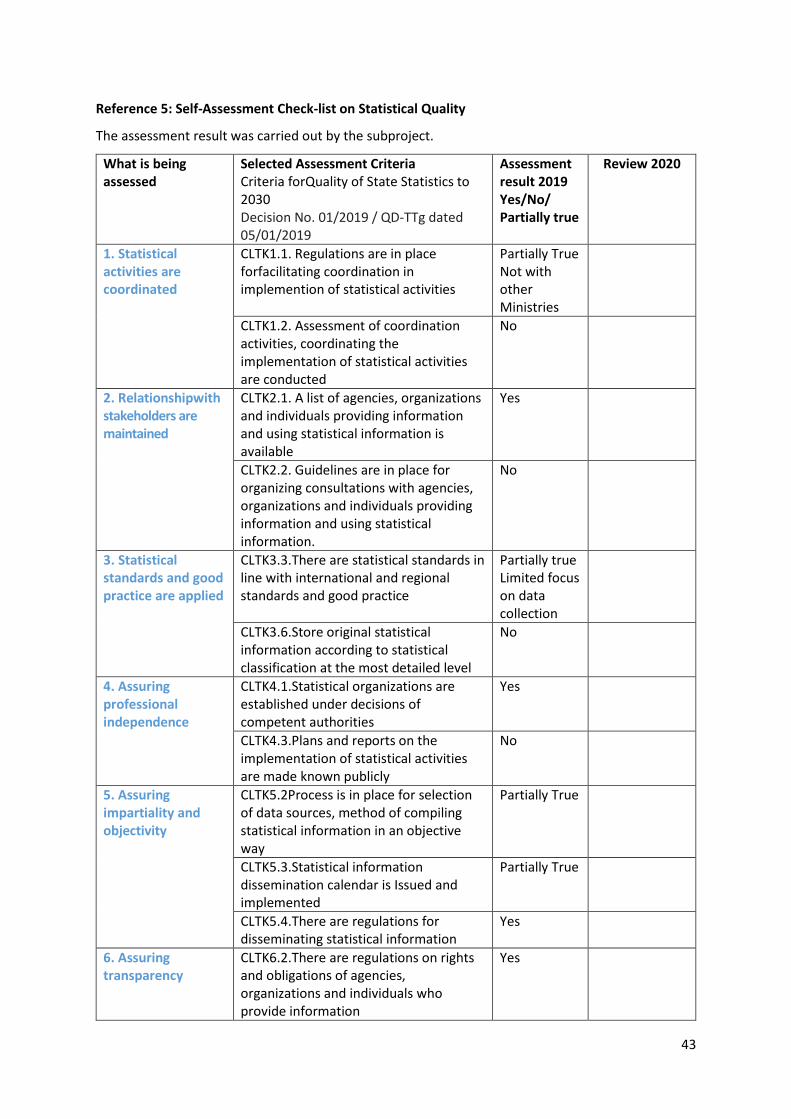
Reference 5 for self-
assessment check-list
on statistical quality
11
D. APPLYING NEW TECHNOLOGIES AND SOURCES OF DATA COLLECTION
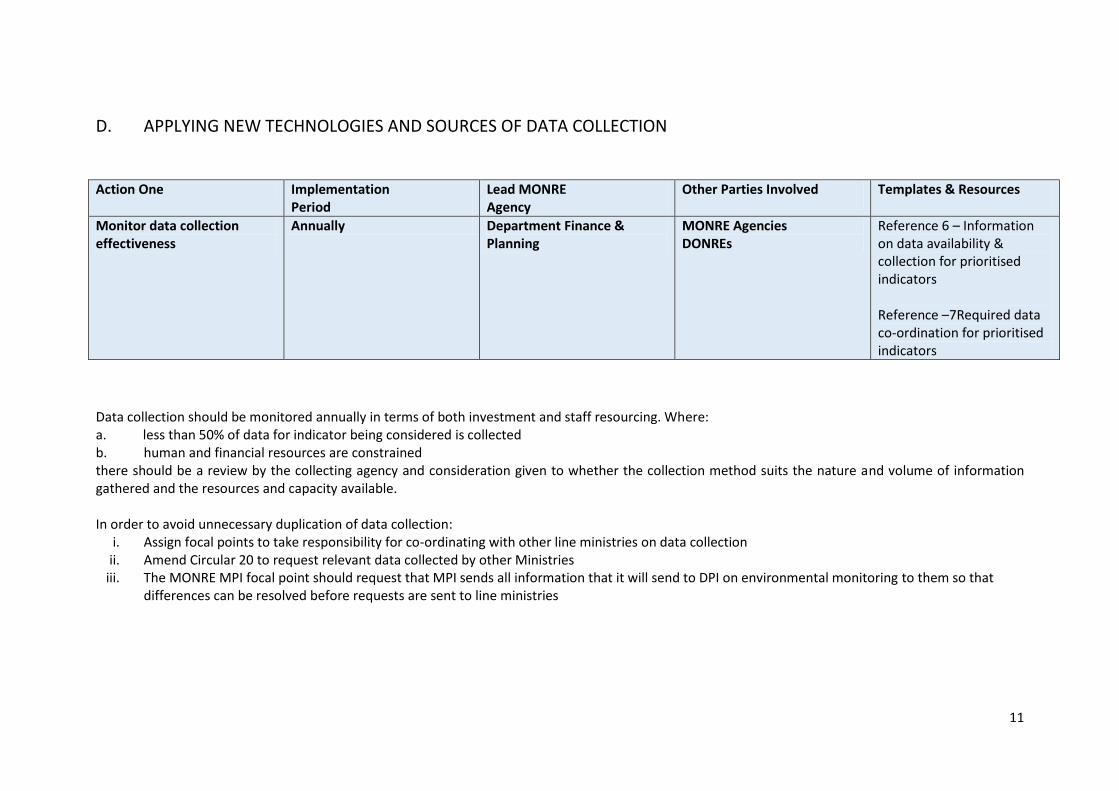
Data collection should be monitored annually in terms of both investment and staff resourcing. Where:
a. less than 50% of data for indicator being considered is collected
b. human and financial resources are constrained
there should be a review by the collecting agency and consideration given to whether the collection method suits the nature and volume of information
gathered and the resources and capacity available.
In order to avoid unnecessary duplication of data collection:
i. Assign focal points to take responsibility for co-ordinating with other line ministries on data collection
ii. Amend Circular 20 to request relevant data collected by other Ministries
iii. The MONRE MPI focal point should request that MPI sends all information that it will send to DPI on environmental monitoring to them so that
differences can be resolved before requests are sent to line ministries
Action One Implementation
Period
Lead MONRE
Agency
Other Parties Involved Templates & Resources
Monitor data collection
effectiveness
Annually Department Finance &
Planning
MONRE Agencies
DONREs
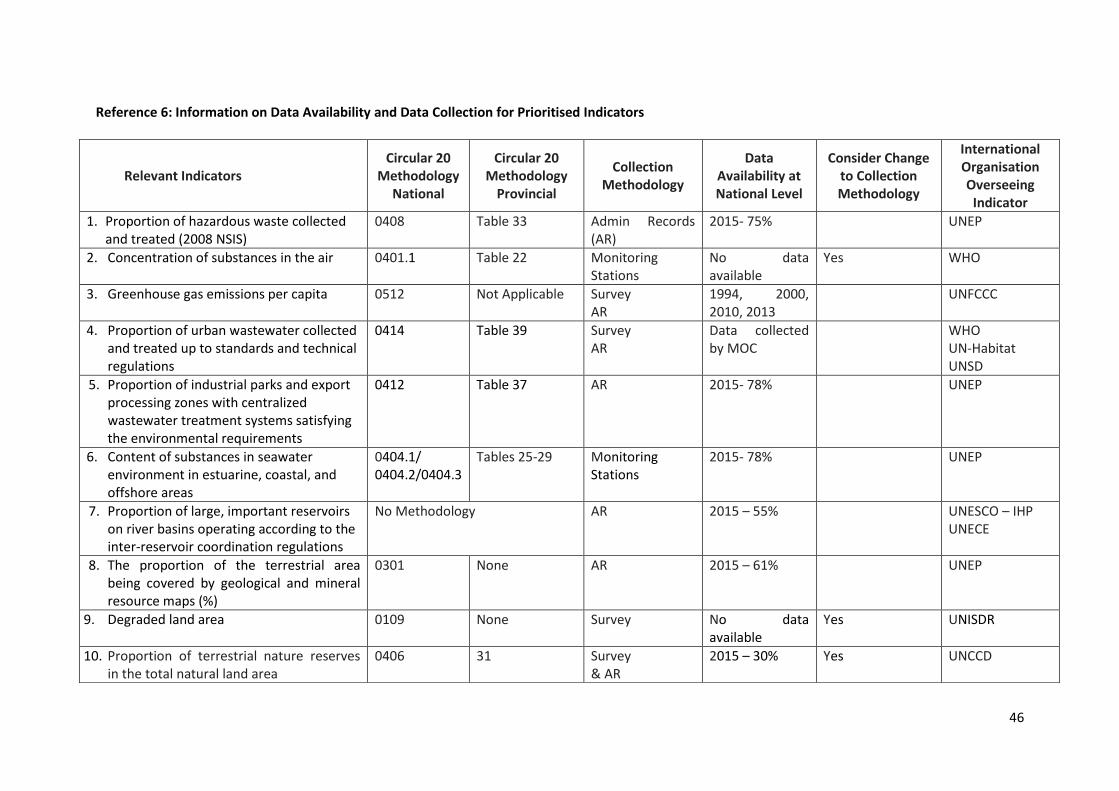
Reference 6 – Information
on data availability &
collection for prioritised
indicators
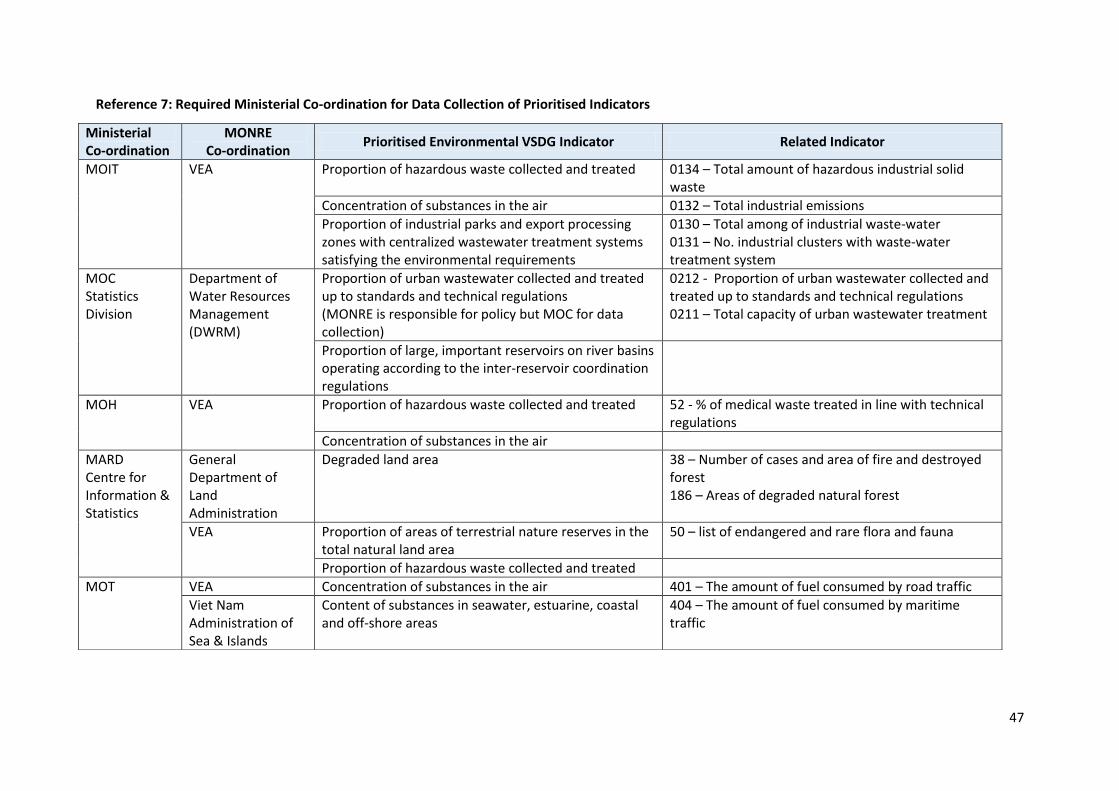
Reference –7Required data
co-ordination for prioritised
indicators
12
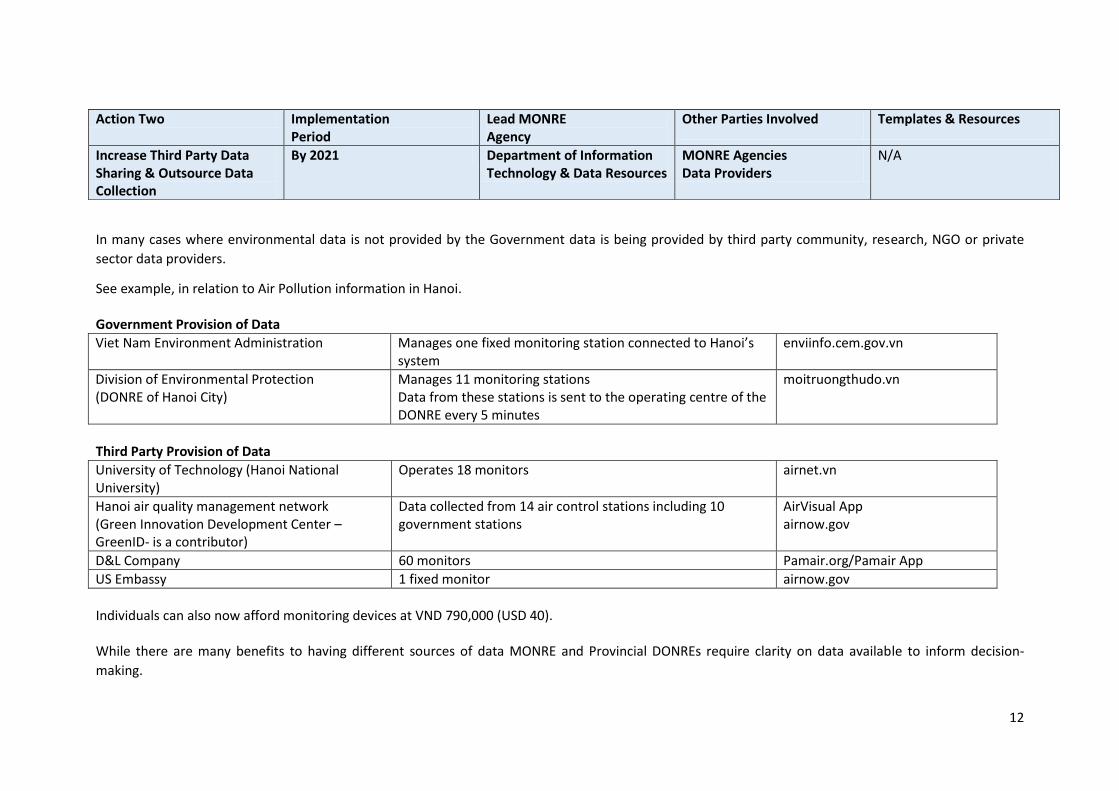
In many cases where environmental data is not provided by the Government data is being provided by third party community, research, NGO or private
sector data providers.
See example, in relation to Air Pollution information in Hanoi.
Government Provision of Data
Viet Nam Environment Administration Manages one fixed monitoring station connected to Hanoi’s system
enviinfo.cem.gov.vn
Division of Environmental Protection
(DONRE of Hanoi City)
Manages 11 monitoring stations
Data from these stations is sent to the operating centre of the
DONRE every 5 minutes
moitruongthudo.vn
Third Party Provision of Data
University of Technology (Hanoi National
University)
Operates 18 monitors airnet.vn
Hanoi air quality management network
(Green Innovation Development Center –
GreenID- is a contributor)
Data collected from 14 air control stations including 10
government stations
AirVisual App
airnow.gov
D&L Company 60 monitors Pamair.org/Pamair App
US Embassy 1 fixed monitor airnow.gov
Individuals can also now afford monitoring devices at VND 790,000 (USD 40).
While there are many benefits to having different sources of data MONRE and Provincial DONREs require clarity on data available to inform decision-
making.
Action Two Implementation
Period
Lead MONRE
Agency
Other Parties Involved Templates & Resources
Increase Third Party Data
Sharing & Outsource Data
Collection
By 2021 Department of Information
Technology & Data Resources
MONRE Agencies
Data Providers
N/A
13
In cases where third party sources are perhaps more comprehensive or more trusted than Government sources of data there are two options to consider:
The relevant MONRE agency could decide to outsource data collection to a third party therefore accrediting the data provider
The relevant MONRE agency could decide to appoint an Independent Advisory Panel comprised of scientific experts from research, NGO and
other monitoring organisations. The Advisory Panel could meet quarterly or on an ad hoc basis, as needed, to provide guidance on standards
and sources of information.
Supporting the outsourcing of environmental monitoring to professional units can increase efficiency in pooling resources and expertise allowing
Government to focus on more strategic management issues. In addition, it can allow for contracting that provides for the ongoing maintenance of
monitoring equipment and hence eliminate suspension of data collection that is an issue with current financing arrangements.
14
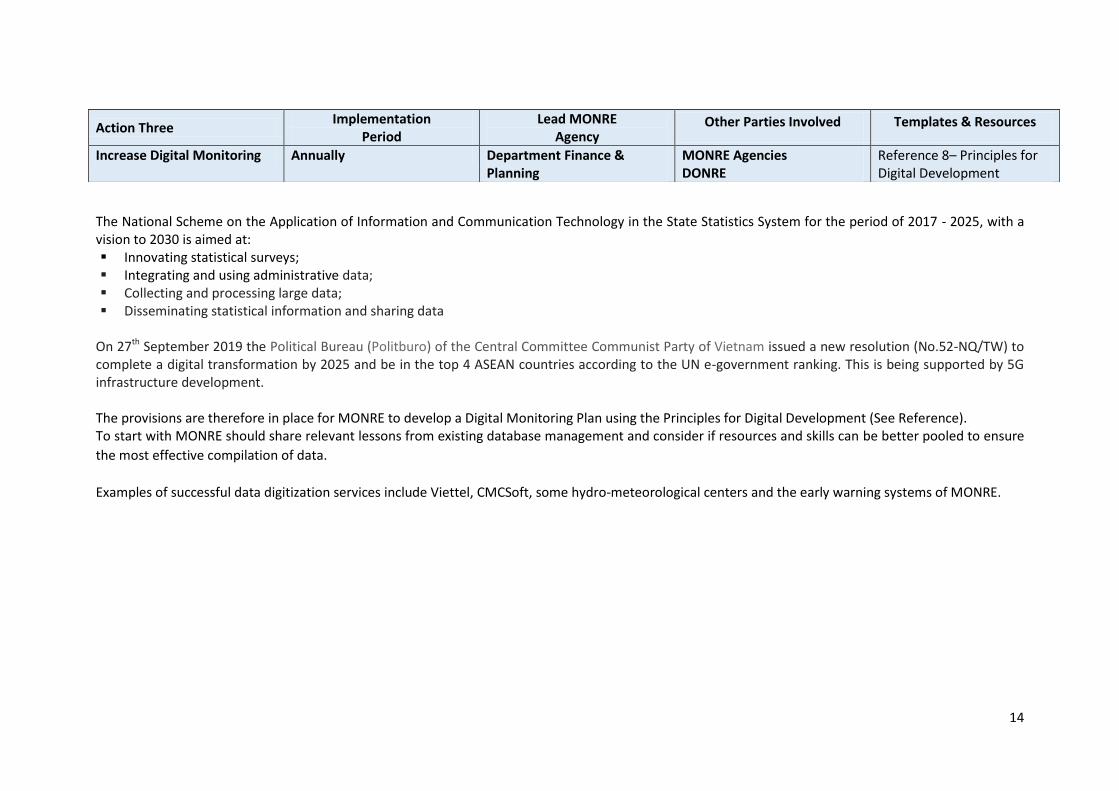
The National Scheme on the Application of Information and Communication Technology in the State Statistics System for the period of 2017 - 2025, with a
vision to 2030 is aimed at:
Innovating statistical surveys;
Integrating and using administrative data;
Collecting and processing large data;
Disseminating statistical information and sharing data
On 27th
September 2019 the Political Bureau (Politburo) of the Central Committee Communist Party of Vietnam issued a new resolution (No.52-NQ/TW) to
complete a digital transformation by 2025 and be in the top 4 ASEAN countries according to the UN e-government ranking. This is being supported by 5G
infrastructure development.
The provisions are therefore in place for MONRE to develop a Digital Monitoring Plan using the Principles for Digital Development (See Reference).
To start with MONRE should share relevant lessons from existing database management and consider if resources and skills can be better pooled to ensure
the most effective compilation of data.
Examples of successful data digitization services include Viettel, CMCSoft, some hydro-meteorological centers and the early warning systems of MONRE.
Action Three Implementation
Period
Lead MONRE
Agency Other Parties Involved Templates & Resources
Increase Digital Monitoring Annually Department Finance &
Planning
MONRE Agencies
DONRE
Reference 8– Principles for
Digital Development
15
E. ADDRESSING DATA SHARING
If information is not shared it can be difficult to build engagement on environmental issues. The information shared at the Provincial level varies
considerably.
Reasons information may not be shared include:
Concern with what is considered state secrets
Concern with the quality of the data
Concern if the information is negative
However, Article 131 in the Law on Environmental Protection (No.55/2014/QH13) makes clear that the following information should be publicly shared:
a) Strategic environmental assessment report, environmental impact assessment report and environmental protection plan;
b) Information of emission sources, emissions and treatment of waste;
c) Areas suffering from serious and particularly serious pollution, degradation, areas at risk of environmental incident;
d) Environmental reports;
đ) Results of environment inspections.
The Department of Information Technology & Data Resources should:
encourage Provinces to share data on prioritised indicators and annually advise on the implications of information that is classified as state secrets.
link Provincial environment webpages to the MONRE webpage. Easier comparison amongst peers will make it easier to share information.
As it is the Provincial People’s Committee that allocates resources at the local level there is a clear need for DONRE’s to: provide more information on environmental linkages with social and economic objectives at regular intervals. Highlighting issues of environmental
health would be a good place to start.
Action Implementation
Period
Lead MONRE
Agency Other Parties Involved Templates & Resources
Clearly advise Provinces on
data that can be shared
Annually Department of Information
Technology & Data Resources
DONREs N/A
16
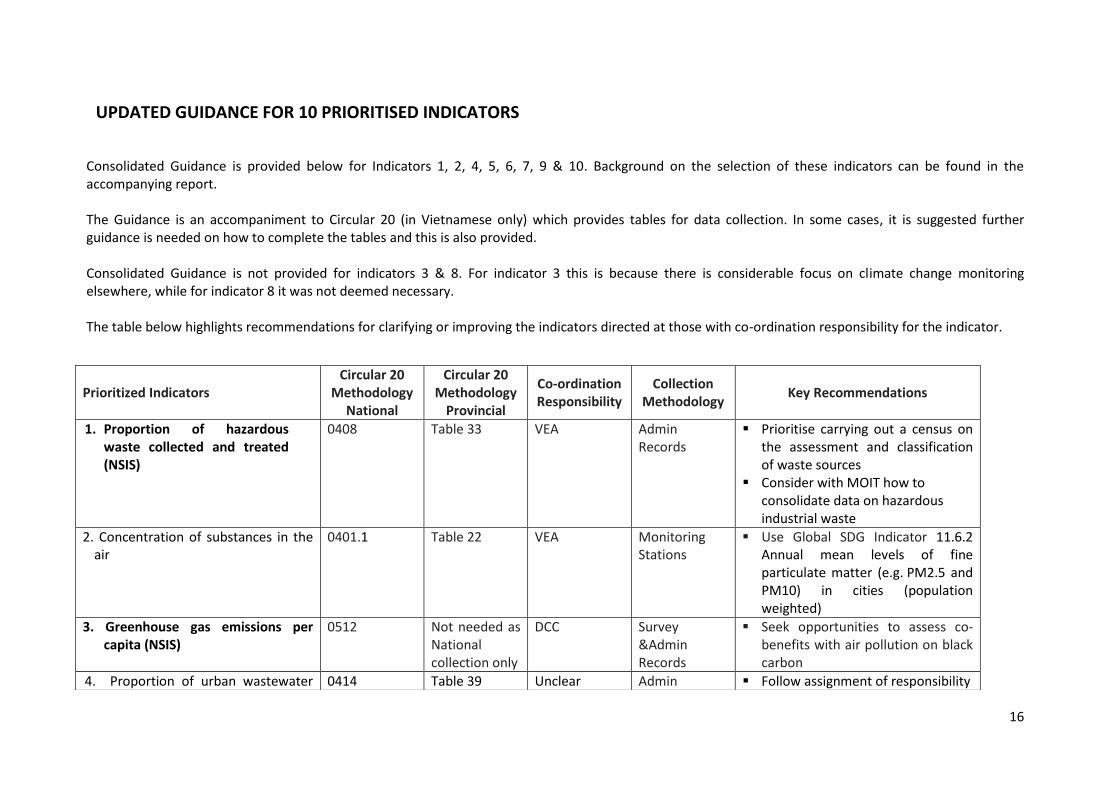
UPDATED GUIDANCE FOR 10 PRIORITISED INDICATORS
Consolidated Guidance is provided below for Indicators 1, 2, 4, 5, 6, 7, 9 & 10. Background on the selection of these indicators can be found in the
accompanying report.
The Guidance is an accompaniment to Circular 20 (in Vietnamese only) which provides tables for data collection. In some cases, it is suggested further
guidance is needed on how to complete the tables and this is also provided.
Consolidated Guidance is not provided for indicators 3 & 8. For indicator 3 this is because there is considerable focus on climate change monitoring
elsewhere, while for indicator 8 it was not deemed necessary.
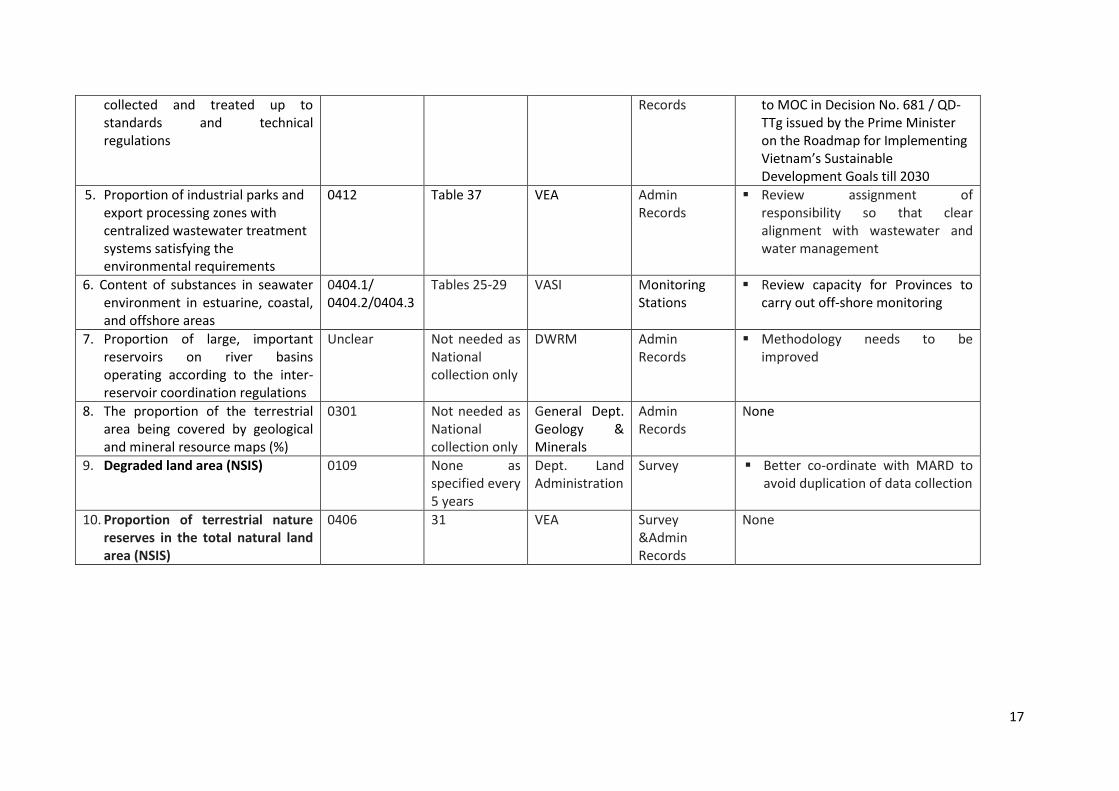
The table below highlights recommendations for clarifying or improving the indicators directed at those with co-ordination responsibility for the indicator.
Prioritized Indicators
Circular 20
Methodology
National
Circular 20
Methodology
Provincial
Co-ordination
Responsibility
Collection
Methodology Key Recommendations
1. Proportion of hazardous
waste collected and treated
(NSIS)
0408 Table 33 VEA Admin
Records
Prioritise carrying out a census on
the assessment and classification
of waste sources
Consider with MOIT how to
consolidate data on hazardous
industrial waste
2. Concentration of substances in the
air
0401.1 Table 22 VEA Monitoring
Stations
Use Global SDG Indicator 11.6.2
Annual mean levels of fine
particulate matter (e.g. PM2.5 and
PM10) in cities (population
weighted)
3. Greenhouse gas emissions per
capita (NSIS)
0512 Not needed as
National
collection only
DCC Survey
&Admin
Records
Seek opportunities to assess co-
benefits with air pollution on black
carbon
4. Proportion of urban wastewater 0414 Table 39 Unclear Admin Follow assignment of responsibility
17
collected and treated up to
standards and technical
regulations
Records to MOC in Decision No. 681 / QD-
TTg issued by the Prime Minister
on the Roadmap for Implementing
Vietnam’s Sustainable
Development Goals till 2030
5. Proportion of industrial parks and
export processing zones with
centralized wastewater treatment
systems satisfying the
environmental requirements
0412 Table 37 VEA Admin
Records
Review assignment of
responsibility so that clear
alignment with wastewater and
water management
6. Content of substances in seawater
environment in estuarine, coastal,
and offshore areas
0404.1/
0404.2/0404.3
Tables 25-29 VASI Monitoring
Stations
Review capacity for Provinces to
carry out off-shore monitoring
7. Proportion of large, important
reservoirs on river basins
operating according to the inter-
reservoir coordination regulations
Unclear Not needed as
National
collection only
DWRM Admin
Records
Methodology needs to be
improved
8. The proportion of the terrestrial
area being covered by geological
and mineral resource maps (%)
0301 Not needed as
National
collection only
General Dept.
Geology &
Minerals
Admin
Records
None
9. Degraded land area (NSIS) 0109 None as
specified every
5 years
Dept. Land
Administration
Survey Better co-ordinate with MARD to
avoid duplication of data collection
10. Proportion of terrestrial nature
reserves in the total natural land
area (NSIS)
0406 31 VEA Survey
&Admin
Records
None
18
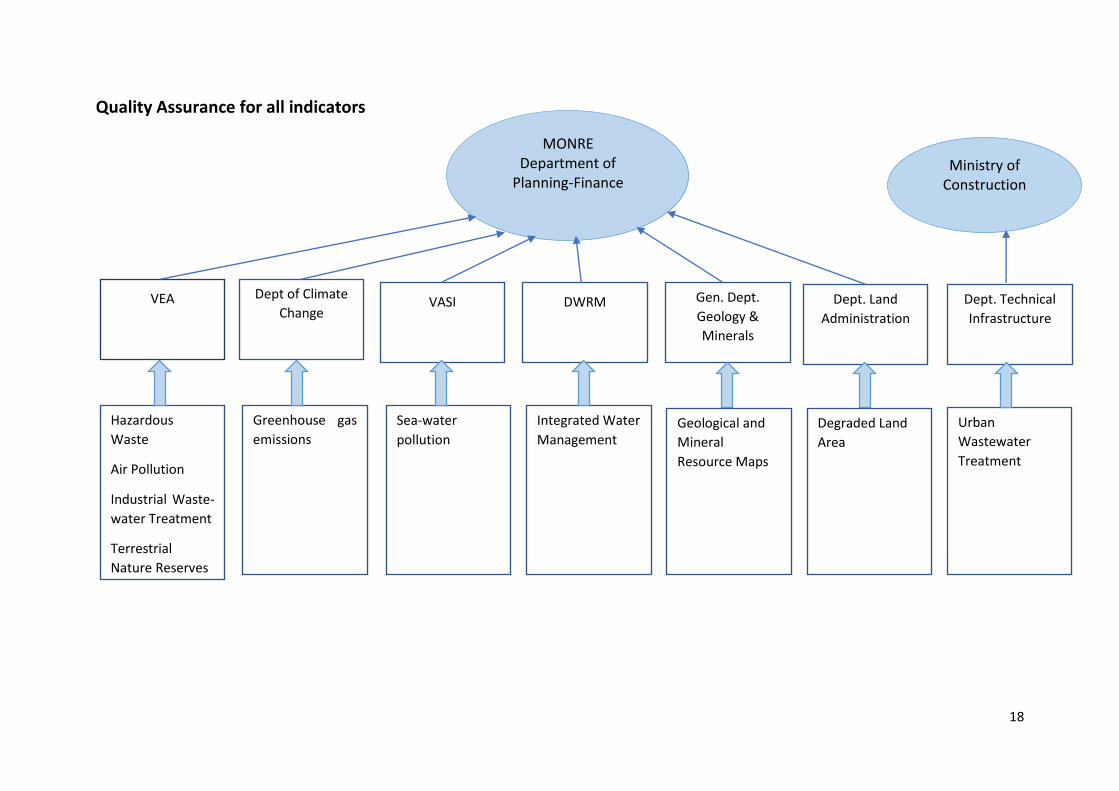
Quality Assurance for all indicators
Sea-water
pollution
Greenhouse gas
emissions
VEA
Dept of Climate
Change
VASI
DWRM
Gen. Dept.
Geology &
Minerals
Dept. Land
Administration
MONRE
Department of
Planning-Finance
Hazardous
Waste
Air Pollution
Industrial Waste-
water Treatment
Terrestrial
Nature Reserves
Integrated Water
Management
Geological and
Mineral
Resource Maps
Degraded Land
Area
Urban
Wastewater
Treatment
Ministry of
Construction
Dept. Technical
Infrastructure
19
Data should be validated through:
1. Data quality checks and cleaning. The checks should consider completeness, accuracy, consistency and reasonableness. In particular, checks should be
made to look for:
unit errors (such as mistaking kilograms for tonnes)
inconsistent coding (for example of wastes from the same company or of the same type)
major gaps (for example, hazardous wastes that are not included in tracking systems)
major differences from previous years (for example, in the quantity of a particular waste type) or from DOIT data.
use of historical reporting codes (these should be converted to modern codes).
2. Comparison with other data sources (such as satellite remote sensing)
3. Inspection (for example the inspection of wastewater treatment operation)
Significant errors should be identified and removed, and significant gaps should be filled to the extent practicable. Suspect data should be identified in the
submission
20
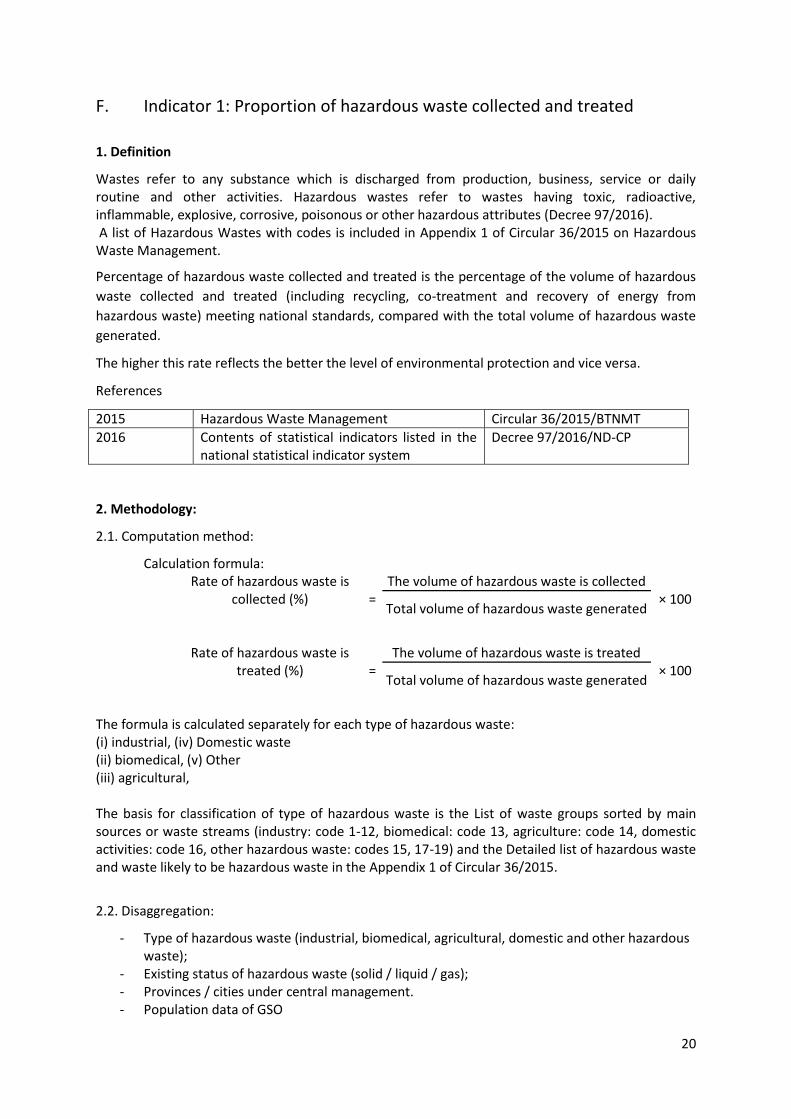
F. Indicator 1: Proportion of hazardous waste collected and treated
1. Definition
Wastes refer to any substance which is discharged from production, business, service or daily
routine and other activities. Hazardous wastes refer to wastes having toxic, radioactive,
inflammable, explosive, corrosive, poisonous or other hazardous attributes (Decree 97/2016).
A list of Hazardous Wastes with codes is included in Appendix 1 of Circular 36/2015 on Hazardous
Waste Management.
Percentage of hazardous waste collected and treated is the percentage of the volume of hazardous
waste collected and treated (including recycling, co-treatment and recovery of energy from
hazardous waste) meeting national standards, compared with the total volume of hazardous waste
generated.
The higher this rate reflects the better the level of environmental protection and vice versa.