ROCKY FLATS ENVIRONMENTAL TECHNOLOGY SITE TBD-OO163 Technical Basis Document for Radiological Characterization of Surface Contaminated Objects Revision 0 March 19, 2001 Reviewed For Classification/UNCI By: V. S. sendelweck~s/~~"" Date: March 19, 2001, -~~ ~ -t~.&_~~.~ page 1 of43 RFETS Radiological Engineering TBD-OO163 Technical Basis for Characterization of SCO
Transcript
ROCKY FLATS ENVIRONMENTAL TECHNOLOGY SITE
TBD-OO163
Technical Basis Document for RadiologicalCharacterization of Surface Contaminated Objects
Revision 0
March 19, 2001
Reviewed For Classification/UNCIBy: V. S. sendelweck~s/~~""Date: March 19, 2001, -~~ ~
-t~.&_~~.~
page 1 of43RFETS Radiological Engineering TBD-OO163Technical Basis for Characterization of SCO
Preparation, Review, and Approval
~ /l1~ 3//'1/01Prepared by: Robert Morris
Radiological :ngineerSvst ,.colorado
v -"3 \
: RayWasteKaiser-Hill
Reviewed by: TomStatisticianTENERA
by: K. F lenarcicTraffic ManagerRocky Flats Closure Site Services~
pproved
Ra~iolog!calKaiser-Hili
Manager
./J.~ I
: Wil ZurlierteProtection Manager
Kaiser-Hill
page 2 of 43RFETS Radiological Engineering TBD-OO163Technical Basis for Characterization of SCO
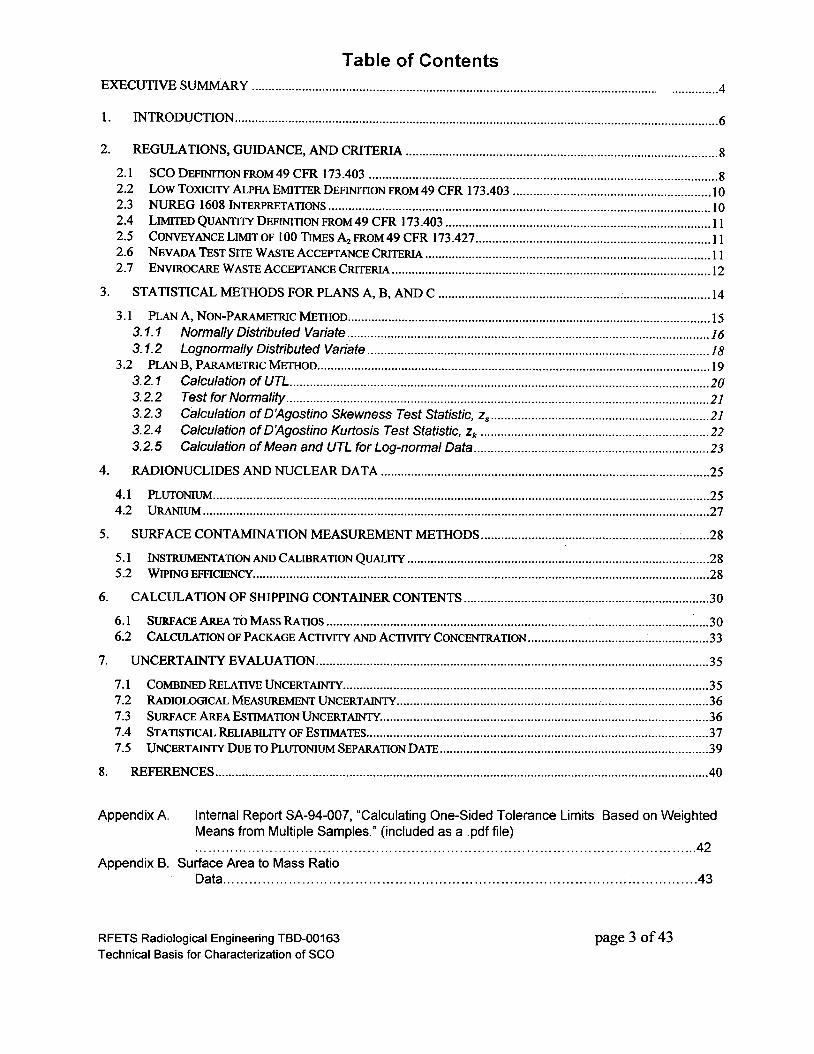
Table of ContentsEXECUnVE SUMMARY '.'.""'.'.'.'.'.'..'.""""".'."".'.'."'.." 4
1. INTRODUCTION
2.
3.
4.
5.
6.
REGULA nONS, GUIDANCE, AND CRITERIA 8
2.1 SCO DEFINITION FROM 49 CFR 173.403 82.2 Low TOXICITY ALPHA EMITTER DEFINITION FROM 49 CFR 173.403 102.3 NUREG 1608 INTERPRETATIONS 102.4 LIMITED QUANTITY DEFINITION FROM 49 CFR 173.403 112.5 CONVEYANCE LIMIT OF 100 TIMESA2FROM49 CFR 173.427 112.6 NEVADA TEST SITE WASTE ACCEPTANCE CRITERIA 112.7 ENVIROCARE WASTE ACCEPTANCE CRITERIA 12
STA nsnCAL METHODS FOR PLANS A, B, AND C 14
3.1 PLAN A, NON-PARAMETRIC METHOD 153.1.1 Normally Distributed Variate 163.1.2 Lognormally Distributed Variate 18
3.2 PLAN B, PARAMETRIC METHOD 193.2.1 Calculation of UTL '.'.".'.' '." 203.2.2 Test for Normality 213.2.3 Calculation of D~gostino Skewness Test Statistic, Zs' '..'.' ' ' 213.2.4 Calculation of D~gostino Kurtosis Test Statistic, Zk 223.2.5 Calculation of Mean and UTL for Log-normal Data 23
5.1 INSTRUMENTATION AND CALIBRATION QUALITY 285.2 WIPING EFFICIENCY 28
CALCULAnON OF SHIPPING CONTAINER CONTENTS 30
6.1 SURFACE AREA TO MAss RATIOS ,.,.,.,.,., , : 306.2 CALCULATION OF PACKAGE ACTIVITY AND AcTIVITY CONCENTRATION 33
UNCERTAINTY EV ALUAnON ' '.' ' 35
7.1 COMBINED RELATIVE UNCERTAINTY 357.2 RADIOLOGICAL MEASUREMENT UNCERTAINTY ; 367.3 SURFACE AREA ESTIMATION UNCERTAINTY 367.4 STATISTICAL RELIABILITY OF ESTIMATES 377.5 UNCERTAINTY DUE TO PLUTONIUM SEPARATION DATE 39
REFERENCES 40
7.
8.
Appendix A. Internal Report SA-94-007, "Calculating One-Sided Tolerance Limits Based on WeightedMeans from Multiple Samples." (included as a .pdf file)
42Appendix B. Surface Area to Mass Ratio
Data... 43
page 3 of 43RFETS Radiological Engineering TBD-OO163
Technical Basis for Characterization of SCO
EXECUTIVE SUMMARY
This technical basis document (TBD) provides the basis for Radiological Safety Practice(RSP)-O9.05, "Radiological Characterization for Surface Contaminated Objects." ASurface Contaminated Object (SCO) is a solid object which is itself not radioactive, butwhich has fixed and/or removable radioactive contamination distributed on any of itssurfaces.
The characterization methods described here are used to determine:
.compliance with DOT regulations for categorization of SCO
.total radioactivity for all radionuclides within a shipping container packed withSCOs
.radioactivity concentration (activity per gram of waste) in the shipping containerto demonstrate conformance to portions of disposal site waste acceptancecriteria (WAC) for near-surface land disposal.
Two statistical methods used to characterize populations of objects that are candidatesfor SCO classification are defined. The first method, Plan A, has been implemented inprocedures since 1998. However, Plan A employs non-parametric analysis andproduces results that are sufficiently accurate to ensure compliance with shippingregulations and waste acceptance criteria. Because of built-in conservatism, Plan Aincludes a high potential for inappropriately failing surface contaminated objects that, infact, may conform to shipping and waste acceptance criteria.
Plan B is newly defined in this document. Plan B is a parametric approach thatincludes tests for detecting significant non-normality of the sample data and forsufficiency of the sample size. After passing at least one of the tests, an uppertolerance limit (UTL) and the estimated mean are calculated. The UTL is used forcomparison to the SCO limit. This method provides 90% confidence that at least 98%of the surfaces in the sampled population will be less than the UTL. The estimatedmean is used to calculate package contents and specific activity. The result is a lessconservative analysis that will enable more low-level radioactive waste to beappropriately shipped under the SCO classification for near-surface land disposal.
Methods for estimating surface area of waste container contents based on weight aredefined, as are the methods for calculating total activity and activity concentration in awaste package.
Uncertainties of the characterization methods are considered. Plan A includes anintentional bias intended to overestimate both contamination level (a DOT compliancevalue) and specific activity (a disposal site waste acceptance criterion) to ensure neitherare violated. This results in a conservative estimate of key quantities, and a wideuncertainty band around each estimate. For Plan A, combined relative uncertainty maybe as little as 40%, more typically on the order of 120%, with the worst case beingabout 400%. For Plan 8, which is not intentionally biased, the estimates are: best case
page 4 of 43RFETS Radiological Engineering TBD-OO163
Technical Basis for Characterization of SCO
is 30%, typical is 40%, and worst case is 90%. Plan C uncertainties are similar to PlanB for best and typical case, and 60% for worst case.
page 5 of 43RFETS Radiological Engineering TBO-00163
Technical Basis for Characterization of SCO
1 INTRODUCTION
This technical basis document (TBO) defines the concepts implemented in Radiological
Safety Practice (RSP)-O9.05, "Radiological Characterization for Surface ContaminatedObjects."1 The TBO supercedes, "Radiological Field Characterization of Low LevelWaste by Measuring Surface Contamination and Calculating Total and Specific
Activity," RF/RMRS-98-2422, which was effective June 22, 1998. The methodsdescribed here are used to determine
.compliance with DOT regulations for categorization of Surface Contaminated
Objects (SCO).total radioactivity for all radionuclides within a shipping container packed with
SCOs.radioactivity concentration (activity per gram of waste) in the shipping container
to demonstrate conformance to portions of disposal site waste acceptancecriteria (WAC) for near-surface land disposal.
An SCO is a solid object which is itself not radioactive, but which has fixed and/orremovable radioactive contamination distributed on any of its surfaces. Examples ofSCOs that are being disposed as low-level radioactive waste during Rocky FlatsEnvironmental Technology Site (Site) closure activities include: tools, desks, cabinets,computers, laboratory cabinets, bench tops, fume hoods, ducting, safes, bakeoutovens, vacuum cleaners and air movers with filter media removed, sinks, sheet metal,metal bar stock, piping, rigid plastics, wallboard, flooring, plastic sheeting, cardboard,light fixtures, and glovebox components. Books and paper, especially unbound paper,and cloth items may fit the definition of SCO, but are more likely to be well-characterized as Low Specific Activity (LSA) material.
If radioactive material is incorporated into the volume of an object through irradiation orabsorption, or if an quantitative survey could not be made on an accessible surface ofan item, then the waste does not qualify as SCO using the methods defined here.Instead it may be categorized as "Dry, Active Waste," LSA-II, in accordance withNUREG 16084.1.1. Objects with painted surfaces may be categorized if processknowledge and/or radiochemical analyses are used to evaluate the inaccessible(painted) area contamination levels.
It is not necessary to survey every object or potentially contaminated surface in order to
characterize it. Knowledge of the process in which the objects were used,contamination levels where the objects are stored, and statistical sampling can all beused to infer the contamination levels for a population of items.
The statistical method RSP-O9.05, Revisions 0 and 1 was based on a non-parametricstatistical method, described in two memoranda,3,4. The method, called Plan A in thisreport, includes calculation of total activity and activity concentration in the shippingcontainer based on an extreme value estimator of the surface contamination level. The
page 6 of 43RFETS Radiological Engineering TBD-OO163
Technical Basis for Characterization of SCO
non-parametric method, which is summarized in this report, is not altered, and itcontinues to be implemented in RSP-O9.05.
An alternate parametric statistical method, called Plan 8, is newly defined in this report.The alternate method is especially intended for use when contamination levelsapproach the U.S. Department of Transportation (DOT) Surface Contaminated Objects(SCO) limits, but could be used in any activity scenario. When this alternate statisticalmethod is selected, the calculations of total activity and activity concentration in theshipping container use a mean estimator of surface contamination level. The newmethod is less conservative, yet continues to provide high confidence that the materialmeets the criteria for shipment under the appropriate SCO classification.
Other minor changes or additions include:
.an expanded table of surface area to mass ratios
.a calculation method for non-fixed contamination wiping efficiency
.a definition for a non-statistical method, called Plan C, for characterization whenthe entire surface of the object(s) is measured.
page 7 of 43RFETS Radiological Engineering TBD-OO163
Technical Basis for Characterization of SCO
2. Regulations, Guidance, and Criteria
The regulations, guidance and criteria pertinent to this process are identified andsummarized in this section.
2.1 SCO Definition from 49 CFR 173.403
"Surface Contaminated Object (SCO) means a solid object which is not itselfradioactive but which has Class 7 (radioactive) material distributed on any of itssurfaces. SCO must be in one of two groups with surface activity not exceeding thefollowing limits:
(1) SCQ-I: A solid object on which:(i) The non-fixed contamination on the accessible surface averaged over 300
cm2 (or the area of the surface if less than 300 cm2) does not exceed 4 Bq/cm2 (10-4
microcurie/cm2) for beta and gamma and low toxicity alpha emitters, or 0.4 Bq/cm2 (10-5microcurie/ cm2) for alpha emitters;
(ii) The fixed contamination on the accessible surface averaged over 300 cm2 (orthe area of the surface if less than 300 cm2) does not exceed 4 x 10⁴ Bq/cm2 (1.0
microcurie/cm2) for beta and gamma and low toxicity alpha emitters, or 4 x 10³ Bq/cm2(0.1 microcurie/cm2) for all other alpha emitters; and
(iii) The non-fixed contamination plus the fixed contamination on the inaccessiblesurface averaged over 300 cm2 (or the area of the surface if less than 300 cm2) doesnot exceed 4 x 10⁴ Bq/cm2 (1 microcurie/cm2) for beta and gamma and low toxicityalpha emitters, or 4 x 10³ Bq/ cm2 (0.1 microcurie/cm2) for all other alpha emitters.
(2) SCQ-II: A solid object on which the limits for SCQ-I are exceeded and onwhich
(i) The non-fixed contamination on the accessible surface averaged over 300cm2 (or the area of the surface if less than 300 cm2) does not exceed 400 Bq/cm2 (10-2
microcurie/cm2) for beta and gamma and low toxicity alpha emitters or 40 Bq/cm2 (10-3microcurie/ cm2) for all other alpha emitters;
(ii) The fixed contamination on the accessible surface averaged over 300 cm2 (orthe area of the surface if less than 300 cm2) does not exceed 8 x 10⁵ Bq/cm2 (20
microcurie/cm2) for beta and gamma and low toxicity alpha emitters, or 8 x 10⁴ Bq/cm2(2 microcuries/ cm2) for all other alpha emitters; and
(iii) The non-fixed contamination plus the fixed contamination on the inaccessible
surface averaged over 300 cm2 (or the area of the surface if less than 300 cm2) doesnot exceed 8 x 10⁵ Bq/cm2 (20 microcuries/cm2) for beta and gamma and low toxicityalpha emitters, or 8 x 10⁴ Bq/cm2 (2 microcuries/cm2) for all other alpha emitters."
This definition is interpreted in Table 2-1 "SCO Upper Limits" for the materials likely tobe encountered at RFETS:
page 8 of 43RFETS Radiological Engineering TBD-OO163
Technical Basis for Characterization of SCO
Table 2-1. SCO Upper Limits for Radionuclides Typically Found at RFETS a,
Type of Contamination SCO I Limit
(dpm/100 cm2)
SCO II Limit
(dpm/100 cm2)
Plutonium or EnrichedUranium
Plutonium or EnrichedUranium, non-fixed conaccessible surfaces
2400 240, 000
2.4 X 10⁷Plutonium or EnrichedUranium, fixed onaccessible surfaces
4.8 X 10⁸
2.4 X 10⁷ 4.8 X 10⁸Plutonium or EnrichedUranium, non-fixed + fixedon inaccessible surfaces
Natural or DepletedUranium
Natural or DepletedUranium, non-fixed onaccessible surfaces
24,000 2,400,000
2.4x10⁸Natural or DepletedUranium, fixed onaccessible surfaces
4.8 X 10⁹
2.4x10⁸ 4.8 X 10⁹Natural or DepletedUranium, fixed + non-fixedon inaccessible surfaces
a. This table is derived from the definition of SCO in 49 CFR Part 173.403, using the conversionconvention shown in 49 CFR Part 173.443, Table 11. The conversion convention is 0.4 Bq equals 22
dpm.
b. When the radionuclide(s) emit both alpha and beta/gamma radiation the limits for alpha andbeta/gamma are applied separately. For example, if a 100 cm2 depleted uranium wipe indicated 15,000dpm alpha and 15,000 dpm beta/gamma, the non-fixed SCO I limitation would not be exceeded.
c. The non-fixed (removable) accessible limits in this table have NOT been adjusted to reflect the default10% swipe efficiency.
page 9 of 43RFETS Radiological Engineering TBO-00163
Technical Basis for Characterization of SCO
Low Toxicity Alpha Emitter Definition from 49 CFR 173.403
Low toxicity alpha emitters are: (1) Natural uranium, depleted uranium, and naturalthorium; (2) Ores, concentrates, or tailings containing uranium-235, uranium-238,thorium-232, thorium-228 and thorium-230; or (3) Alpha emitters with a half-life of lessthan 10 days.
NUREG 160B/nterpretations
NUREG 1608 RAM REG 0035 is a joint guidance document prepared by NRC andDOT. It is not a regulation, but provides a great deal of guidance about methods andconcepts for compliant categorization of SCO. For purpose of this paper, it is referredto simply as NUREG 1608. The following excerpts are especially pertinent, howeverthe complete text of the guidance document should be consulted in order to assurecompliance with the regulations.
NUREG 1608, Section 3.2.3 defines an accessible and inaccessible surface in thecontext of SCO shipments: "An accessible surface is any surface which can readily bewiped by hand, using standard radiation-measuring techniques. Any other surface isan inaccessible surface." This definition applies under normal non-accident conditionsand represents what a person would encounter if the package were opened undernormal conditions. If a 300-cm2 area could be reached by a person's hand it is anaccessible surface, otherwise it is not. Small openings are not accessible by thisdefinition. It is generally good practice to seal off openings and the ends of pipes ortanks. This will minimize the likelihood that contamination will be released within thepackage due to rough handling during packaging, storage or shipment.
In NUREG 1608 section 3.1.4, the clarification is made that an object could becategorized as SCO, even if the surfaces were contaminated to both the limits for betaand gamma emitters and low toxicity alpha emitters, and to the limit for all other alphaemitters.
In NUREG 1608 section 3.1.6, guidance is provided that the most appropriate categoryshould be used to assure that response to any incidents is suitable for the materialspresent. However, it is permissible to categorize radioactive material to highercategorization levels and package and ship them accordingly.
In NUREG 1608 section 3.1 "[DOT] regulations do not require measurements ofcontamination as the only means of accomplishing [SCO] determinations."Furthermore, "A reasoned argument could be used to categorize the great majority ofcandidate SCOs without the need for detailed quantitative measurements of fixed,accessible contamination, or total inaccessible contamination."
page 10 of 43RFETS Radiological Engineering TBD-OO163
Technical Basis for Characterization of SCO
In NUREG 1608 section 6.2 guidance is provided for methods of rendering accessiblesurfaces inaccessible and fixing removable contamination.
Limited Quantity Definition from 49 CFR 173.403
"Limited quantity of Class 7 (radioactive) material means a quantity of Class 7(radioactive) material not exceeding the materials package limits specified in Sec173.425 and conforming with requirements specified in Sec. 173.421."
Section 173.421 describes the conditions under which exceptions to the specificationpackaging, marking, labeling, and certification can be taken.
Table 7 in Section 173.425 shows that Limited Quantity for solids is up to 10 -3 times
the A2 quantity for a particular radionuclide or mixture of radionuclides. The A2 quantityfor weapons grade plutonium changes as a function of time. The calculated values forA2 are shown in Table 4-2 of this document. These A2 values are the same as the onesused in the WEMS database.
2.5 Conveyance Limit of 100 Times A2 from 49 CFR 173.427
Table 9 of the regulation shows the "Conveyance Activity Limits for LSA Material andSCO." Conveyances carrying SCO are limited to 100 times the A2 value.
Nevada Test Site Waste Acceptance Criteria
The Nevada Test Site (NTS) is the principal recipient of low-level waste characterizedusing an SCO method. The NTS Waste Acceptance Criteria6 (WAC) specifies that allwaste acceptable at NTS must be radioactive and meet certain criteria which aresummarized below:
Radiological Characteristics./" The concentration of alpha-emitting transuranic nuclides with half-lives
greater than 20 years must not exceed 100 nCi/g../" The net weight of the waste, excluding the weight of the container and
shielding, must be used to calculate the specific activity of the waste in eachcontainer.
./" Sealed sources are evaluated individually against specific limitations.
./" Waste equivalent to "Greater-than-Class C"l is not acceptable
Accuracy and Uncertainty
of43RFETS Radiological Engineering TBD-OO163
Technical Basis for Characterization of SCOpage
./' Characterization of waste shall be done with sufficient accuracy to permit
proper segregation, treatment, storage, and disposal../' When waste streams are characterized by sampling and analysis, the
process shall be controlled and documented. The propagation of errorthroughout the sampling and analysis process shall be evaluated andconsidered when ascertaining usability of data for characterization of waste
.
Package Restriction./ Weight limits of 9000 pounds per box or 1200 pounds per 55-gallon drum
apply. Special provisions for disposal of bulk waste or large items may beavailable. Void space in packaging must be minimized.
./ Large quantities of fine particulates shall be immobilized or in enclosed
secure packaging.
Other Hazardous Constituentsv'" Hazardous waste is not acceptable. This includes compressed gasses,
pathogens, reactive material, pyrophorics, and explosives.v'" Limits on the concentration of PCBs and chelating agents apply.v'" Waste containing asbestos is acceptable in some cases, subject to certain
marking requirements, notification and segregation.v'" Beryllium waste is acceptable if the container is appropriate and certain
labels are applied.v'" Lead may be added to a container for shielding purposes if it was not
contaminated when it was added.
2.7 Envirocare Waste Acceptance Criteria
Envirocare of Utah, Inc may be used by RFETS for disposal of mixed wastecharacterized using an SCO method. Envirocare's WAC8 establishes these pertinentlimits:
Prohibited Items
......
Hazardous waste that is not also a radioactive wasteBulk liquid wastes, non-aqueous liquids, or wastes with an organic liquid
phaseWater or air reactive wastes and materialsPyrophoric wastes and materialsDOT Forbidden, Class 1.1, Class 1.2 and Class 1.3 explosivesShock sensitive wastes and materialsBatteriesCompressed gas cylinders, unless they meet the definition of emptycontainersMixed waste where the radioactive portion, at the time of disposal, willexceed the limits set forth in Envirocare's Radioactive Material License
.
page 12 of 43RFETS Radiological Engineering TBD-OO163
Technical Basis for Characterization of SCO
.
EPA waste codes FO20, FO21, FO22, FO23, FO26, and FO27; and Utah wastecodes F999 and P999.
Activi Limits and Uncertain Constraints
Envirocare's Radioactive Materials License (License # UT 2300249 Amendment#11) allows for disposal of special nuclear materials found in weapons gradeplutonium at concentrations up to 10 nCi/g.a Explicit in this limit is thatmeasurement uncertainty at the one-sigma level cannot exceed 1.5 nCi/g. Thismeasurement uncertainty limit does not include the uncertainty introduced bysampling error. In other words, 15% measurement uncertainty is allowable.
This level of measurement uncertainty is difficult to achieve with standard radiation
safety procedures and instruments, which are calibrated to within :t 10%, and
performance tested daily to within :t 20%. Instrument procedure modifications maybe required to meet this criterion for disposal at Envirocare.
.The limit for Pu-24 I disposal is 350 nCi/g and the measurement uncertainty limit for this is 50 nCi/g. In practicalterms, this higher value has little impact on the 10 nCi/g limit for a WG Pu mixture.RFETS Radiological Engineering TBD-OO163 page 13 of 43Technical Basis for Characterization of SCO
3. Statistical Methods for Plans A, B, and C
Two statistical methods, Plans A and 8, and one non-statistical method, Plan C, havebeen developed for characterization of surface contaminated objects. Plan A is a non-parametric approach that was implemented in revisions 0 and 1 to RSP-O9.05. Thegoal of Plan A is to conservatively estimate the amounts of activity in a group of surfacecontaminated objects and provide high confidence that applicable regulatory limits andwaste acceptance criteria are met. In exchange for high confidence of compliance, thismethod produces a high potential for inappropriately failing surface contaminatedobjects that, in fact, conform to shipping and waste acceptance criteria.
Plan B is newly defined in this document. Plan B is a parametric approach thatincludes a test for non-normality of the sample data. After failing to reject the nullhypothesis that the sample data are normally or log normally distributed, the mean andupper tolerance limit (UTL) are calculated. The UTL is used for comparison to theapplicable SCO limit. The mean is used to calculate package contents and specificactivity. The result is a less conservative and more powerful statistical analysis thatmakes fewer inappropriate Type II errors.
Plan C, a non-statistical approach is also newly defined. In this simple case, where oneor several surface contaminated objects can be completely measured, no statisticalinference is required. Since the contamination levels are fully known, the measuredmaximum values shall be used for comparison to SCO limits and the mean value maybe used in calculation of package contents specific activity.
Both Plans A and B require that candidate objects for SCO classification be groupedinto populations with similar contamination levels. This grouping is based on location,knowledge of process, and professional judgement. After grouping has occurred,sampling and measurement is performed to obtain data that are used to infer
population characteristics. Not all objects or surfaces in the population need to besampled (measured), but all accessible areas must have an equal opportunity to besampled. Inaccessible surfaces are assumed to be an unsampled subset representedby the sampled accessible surfaces. This approach for inaccessible surfaces issupported in NUREG-1608: "[DOT] regulations do not require measurements ofcontamination as the only means of accomplishing [SCO] determinations."Furthermore, "A reasoned argument could be used to categorize the great majority ofcandidate SCOs without the need for detailed quantitative measurements of fixed,accessible contamination, or total inaccessible contamination."
If contamination levels of inaccessible surfaces are not expected to be similar toaccessible surfaces (which might occur on a tank or pipe interior or inside an airmover), then the inaccessible surfaces must be measured using a different, reliablemethod, or the inaccessible surface must be made accessible for measurement (cutopen), or the object must be removed from the population.
page 14 of 43RFETS Radiological Engineering TBD-OO163
Technical Basis for Characterization of SCO
3.1 Plan A, Non-Parametric Method
Plan A is a simple and conservative non-parametric statistical method. The goal ofPlan A is to estimate the maximum percent of objects that may exceed the applicableSCO limit with an acceptable level of confidence.
At least 30 randomly collected measurements of surface activity are gathered and
individually evaluated. None of the 30+ samples may exceed the applicable SCO limit.Additionally, neither the median and standard deviation of the sample data may exceedY2 the SCO limit. The median is the value, which demarks the middle of the data, i.e.,half of the data is above and half is below. In a symmetric data set, the median andmean (average) coincide but in a skewed data set they diverge, with the mean beingdrawn more in the direction of the few extreme values.
The choice of minimum sample size of 30 is based in using the sign-test (described in
MARSSIM 9). The collection of swipes from randomly selected locations ensures that
the total data set will tend to be like the total surface area being evaluated with thedegree of similarity between the sample and the represented population growing largeras the sample size increases.
Because non-parametric methods derive from general probabilistic considerations andare meant to apply regardless of the shape or quantitative characteristics of the actualunderlying data distribution, the results obtained can often be improved by takingadvantage of known parametric restrictions on the data and the phenomenon beingevaluated. However, without resorting to the use of those restrictions, the followingsimple results can be obtained.
Whatever the underlying data distribution, if the tail probability for values above theSCO limit is some value P, then the level of confidence associated with a sample ofsize n which contains no observations exceeding the SCO limit is 1-(1-p)n that theproportion of material in the population which has greater than the SCO limit ofcontamination does not exceed P. Table 3-1 shows the level of confidence associatedwith a sample size of n = 30 and the proportion of population which may exceed the
SCO limit of contamination given that no observation in the sample exceeds the SCOlimit. For example, the method provides 95.8% confidence that the proportion ofmaterial which could exceed the limit is no greater than 10%. However, there can beonly 78.5% confidence that it is no greater than 5%, based solely on the non-parametric
approach.
page 15 of 43RFETS Radiological Engineering TBD-OO163Technical Basis for Characterization of SCO
Table 3-1. Level of Confidence that Proportion is No Greater Than P% forSample of Size 30, Given that No Observation Exceeds SCO Limit
The additional restrictions that the median and the standard deviation of the observeddata shall not exceed a value of one-half the applicable SCO limit may serve tostrengthen confidence that only a small proportion, if any, of the material being sampledexceeds the SCO limit. The effect of restrictions of known or expected distributionalparameters is that we are approximately 95% confidence that the proportion ofcontaminated surface area exceeding SCO limit would be less than 5%. The rationalefor this conclusion is described below.
Very-low and near-background contamination data most often approximately follow alog-normal probability distribution 1°, while generally elevated contamination data maytend to be less right-skewed in distribution and may more closely approximate a normaldistribution. Therefore the median and standard deviation restrictions must beevaluated both under an assumption of normality and under an assumption of log-
normality.
3.1.1 Normally Distributed Variate
Under the assumption of normality, the mean and the median should be nearlycoincident and equal. However, the constraints of median and standard deviation lessthan one-half SCO limit could only be approached by the median. Since the measuredvalues are also constrained by zero on the left, no sample from a normal populationcould be expected to demonstrate a standard deviation of the same magnitude as theconstraint defined for the median. The standard deviation of a sample from anunderlying population which could be treated as approximately normally distributedwhile bounded by zero on the left could not exceed a magnitude of less than about one-half the mean. Otherwise, the sample would be too right-skewed to be adequatelymodeled by a normal distribution and would fail accepted tests for non-normality. Thus,for a sample with median (and mean) near one-half SCO limit and from an
page 16 of 43RFETS Radiological Engineering TBD-OO163Technical Basis for Characterization of SCO
approximately normally distributed population, the sample standard deviation would beat most about one-quarter of the SCO limit.
Modeling such a population shows that a sample of size 30 taken from a normallydistributed population and having a sample mean of one-half SCO limit and samplestandard deviation of one-quarter of the SCO limit would yield approximately 95%confidence that the proportion of contaminated surface area exceeding SCO limit wouldbe less than 5%. This conclusion is derived as follows:
For computational convenience, we will set the SCO limit equal to 1 with appropriateunits. This implies that both median and mean are less than or equal to one-half (0.5)and the standard deviation is no greater than about one-quarter (0.25) in the same unitsin order to meet the criteria. The limiting case exists when the sample mean does, infact, equal one-half the SCO limit, and the sample standard deviation equals one-quarter of the SCO limit. If either value is less, the conclusion is stronger. Under thelimiting conditions the probability that any single observation on X is less than the SCOlimit is
1-0.50.25
x-,u0"
1-,u-<--0"
=2
where Z is the Standard Normal variate
Because the observed mean, median, and standard deviation are estimates of the trueparameters, the probability calculations must also be performed using the associatedupper confidence limit values for the estimates of mean and standard deviation. Thiswill serve to put bounds on the achievable levels of confidence for the likely estimatesof proportions of material, which may exceed the SCO limit under the given conditions.Since the mean and standard deviation of deposited surface contamination often exhibitsome degree of positive correlation, the effect would tend to liberalize the confidencelevel estimates. Therefore, the more conservative choice could be made when
computing confidence to offset this influence. However, the confidence intervalestimates for the limiting case are largely independent of each other, so the combinedinfluence may be treated as multiplicative. Thus, use of upper 80% confidence limits forthe two parameter estimates should yield a combined upper confidence level of about96% ( 1 -0.22 ) or more that the proportion exceeding the SCO level is less than the
calculated value.
For relatively large (n >29) samples the upper (1-a)100% confidence limit for the
population mean is found by11
page 17 of 43RFETS Radiological Engineering TBO-00163
Technical Basis for Characterization of SCO
For sample size n = 30; observed mean x equal to 0.5; observed standard deviation sequal to 0.25; and a = 0.2, this equation yields UCLso for ~ as follows:
In addition, the upper confidence limit for standard deviation is found fromi
Under the same conditions, this yields:
Solving the earlier equation for the probability that anyone X exceeds the defined SCOLimit of 1.0 while using these conservative estimates for mean and standard deviation
yields
Pr(X < 1) = pr( Z = 1- 0.5390
0.2840x-.u
0"l-,u-<--
0"
=1.623
) = Pr(Z < 1.623) = O.9477~ 95%
Assuming relative independence of the two UCL parameter values, this result implieswe can be at least 95% confident that the proportion of the population exceeding theSCO limit is less than 5%.
3.1.2 Lognormally Distributed Variate
If the variate L has a Lognormal probability distribution, then lognL (or Ln(L)) has a
Normal probability distribution with mean f.t and standard deviation cr with the followingrelationships between the Lognormal and Normal distributions 12
For the restrictions that the median and standard deviation of L both be no greater thanone-half the SCO limit, and by defining the SCO Limit in this case as 2.0 withappropriate units, the mean of Ln(L) is Ln(1) or ~ = 0 and the standard deviation ofLn(L) is cr = 0.69369. The transformed SCO limit is Ln(2) = 0.693147.
page 18 of 43RFETS Radiological Engineering TBD-OO163
Technical Basis for Characterization of SCO
As before, under these conditions the probability that any single observation on L isless than the SCO limit is
O.693147-,uPr(L < 0.693147) == prl0.693147-0
0.693690" 0"
= Pr(Z < 0.9992) = 0.8412
where Z is the Standard Normal variate.
This result is similar to that for the normal variate. Applying the UCLso formulas fornormal variates to the log-transformed data yields:
Solving the earlier equation for the probability that anyone L exceeds the defined SCOLimit of 0.693147 while using these conservative estimates for mean and standarddeviation yields
For UCLgO,UL) & UCLgo,(CJ):
0.693147-0.108180.693147 -,uPr(L < 0.693147) = pri
0.78798a 0-
= Pr(Z < 0.7424) = 0.7711
Assuming relative independence of the two UCL values, this result implies we can be95% confident that the proportion of the population exceeding the SCO Limit is lessthan 22.89%
Again, this result is similar to, but less restrictive than, that obtained for a normallydistributed variate. For log-normally distributed variates, the theoretical results indicatethat the non-parametric approach of the first section yields greater confidence and/orlower proportions of material potentially exceeding the SCO limit.
Plan B, Parametric Method3.2
In application, Plan A, the non-parametric approach, may prove to be undulyconservative. Plan B takes advantage of the observed data distributional features togenerate more definitive quantitative characterization results.
page 19 of 43RFETS Radiological Engineering TBD-OO163
Technical Basis for Characterization of SCO
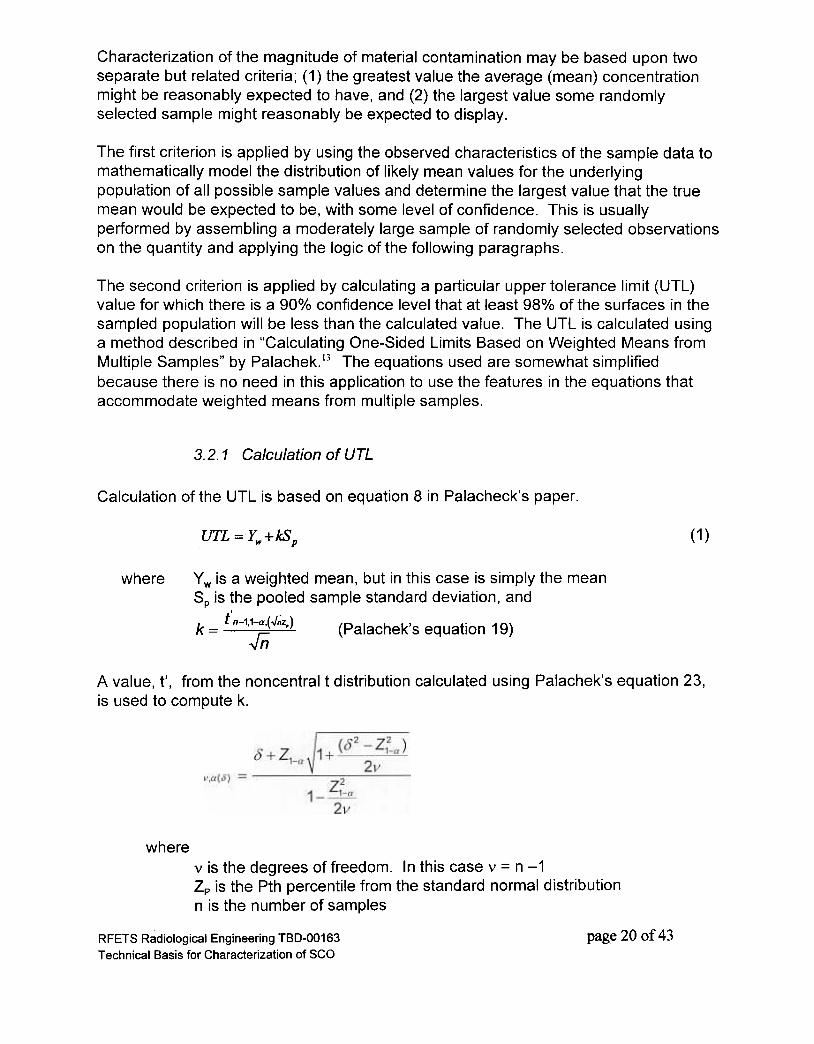
Characterization of the magnitude of material contamination may be based upon twoseparate but related criteria; (1) the greatest value the average (mean) concentrationmight be reasonably expected to have, and (2) the largest value some randomlyselected sample might reasonably be expected to display.
The first criterion is applied by using the observed characteristics of the sample data tomathematically model the distribution of likely mean values for the underlyingpopulation of all possible sample values and determine the largest value that the truemean would be expected to be, with some level of confidence. This is usuallyperformed by assembling a moderately large sample of randomly selected observationson the quantity and applying the logic of the following paragraphs.
The second criterion is applied by calculating a particular upper tolerance limit (UTL)value for which there is a 90% confidence level that at least 98% of the surfaces in thesampled population will be less than the calculated value. The UTL is calculated usinga method described in "Calculating One-Sided Limits Based on Weighted Means from
Multiple Samples" by Palachek.13 The equations used are somewhat simplified
because there is no need in this application to use the features in the equations thataccommodate weighted means from multiple samples.
3.2.1 Calculation of UTL
Calculation of the UTL is based on equation 8 in Palacheck's paper.
(1)UTL =Y +kSw p
where Y w is a weighted mean, but in this case is simply the meanSp is the pooled sample standard deviation, and
k = ¥ (Palachek's equation 19)
A value, t', from the noncentral t distribution calculated using Palachek's equation 23,is used to compute k.
wherev is the degrees of freedom. In this case v = n-1
Zp is the Pth percentile from the standard normal distribution
n is the number of samples
page 20 of 43RFETS Radiological Engineering TBD-OO163
Technical Basis for Characterization of SCO
() is the non-centrality parameter. In this case () = Zp x n 1/2
Both criteria (the mean and UTL) are valid only when certain assumptions are met.Specifically, for the mean criteria the sample data must either have been drawn from anunderlying population having a normal (Gaussian) probability distribution or the samplesize must be large enough to be able to validly apply the Central Limit Theorem (CL T),also known as the Normality Convergence Theorem, and for the UTL criteria thesample data must have been drawn from an underlying population having a normal(Gaussian) probability distribution.
3.2.2 Test for Normality
The normality of the underlying distribution can be mathematically tested using one ofseveral statistical tests. We have chosen to use the D'Agostino Omnibus test, whichconsiders both skewness and kurtosis. This test is considered increasingly valid forsample sizes larger than about 20, but is adequate for sample sizes as small as 15.Sample size less than 20 is justified, as we are most concerned with generating a goodestimate for the mean and kurtosis has less impact for this application than skewness.Kurtosis is not concerned with the degree of non-symmetry, only the degree of spread.Data spread has no direct influence on the arithmetic mean. Smaller sample sizescould be used if an alternative test for non-normality, such as the Shipiro-Wilk test, waschosen.
R. B. D'Agostino, et al,14describe a test for non-normality that combines statistics from
tests for both skewness and kurtosis. These two statistics are Zs and Zk which are
calculated as described later. The Omnibus test statistic, K2, is approximatelydistributed as a chi-square with two degrees of freedom and is calculated as:
K 2 2 2= Zs +Zk
Thus, if K2 is greater than 5.991, the data are significantly non-normal at a = 0.05. That
is, there is less than 5% chance that the data is from a normal (Gaussian) distribution.
3.2.3 Calculation ofD'Agostino Skewness Test Statistic, Zs
Because the normal distribution is symmetrical, the skewness coefficient, Jb:, is equal
to zero for normal data. D'A9.ostino describes a test to determine if the value of Jb: is
significantly different from zero. The skewness statistic, zs' is, under the null hypothesisof data normality, itself approximately normally distributed. This statistic, which isrestricted to sample sizes n > 8, is computed as:
Zs = dlnl ~+m:;
page 21 of 43RFETS Radiological Engineering TBD-OO163Technical Basis for Characterization of SCO
where
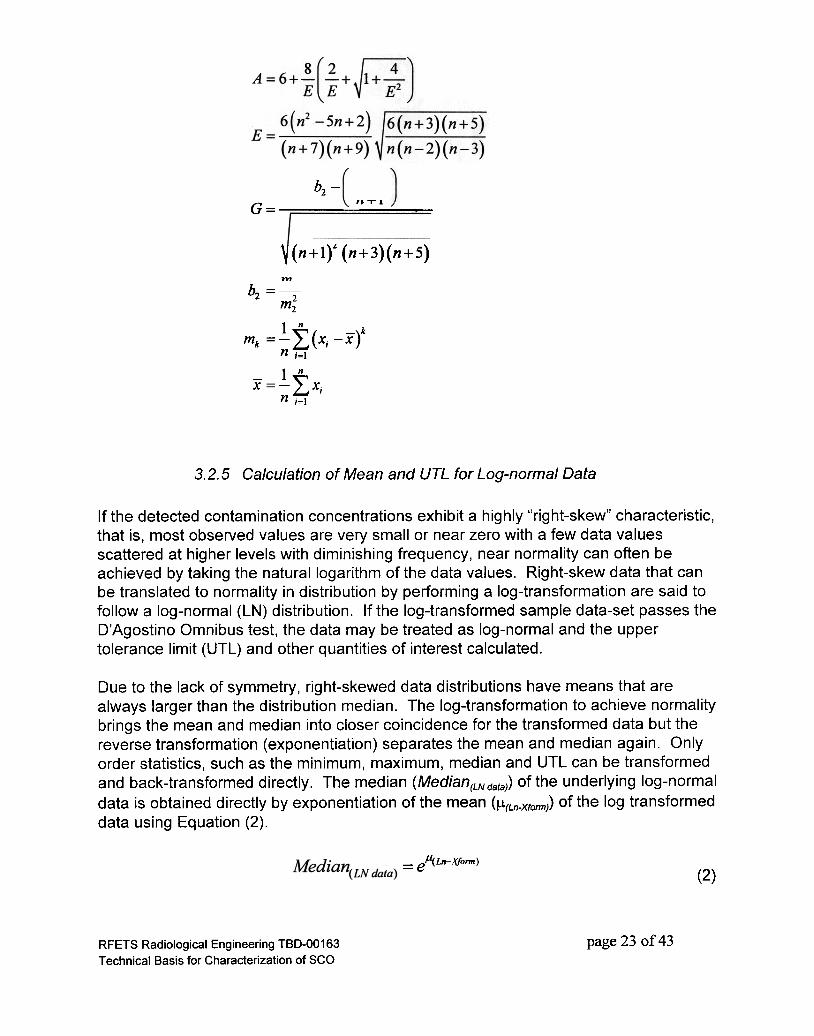
3.2.4 Calculation ofD'Agostino Kurtosis Test Statistic, Zk
In the normal distribution, the theoretical value of the kurtosis coefficient, b2, is equal tothree. D'Agostino describes a test to determine if the value of b2 is significantly differentfrom three. The statistic, Zk , is, under the null hypothesis of normality, approximately
normally distributed. This statistic, which is an approximation for sample sizes n < 20, is
computed as:
ZJ. =
where
page 22 of 43RFETS Radiological Engineering TBO-00163
Technical Basis for Characterization of SCO
b2 -G = " .J.c,
24n(n -2)(n -3)
V(n+l)2 (n+3)(n+5)
m4b2 =m22
1 ~ ( _ )kmk =- L" X;-Xn ;=1
1 nX = -LX;
n ;=1
3.2.5 Calculation of Mean and UTL for Log-normal Data
If the detected contamination concentrations exhibit a highly "right-skew" characteristic,that is, most observed values are very small or near zero with a few data valuesscattered at higher levels with diminishing frequency, near normality can often beachieved by taking the natural logarithm of the data values. Right-skew data that canbe translated to normality in distribution by performing a log-transformation are said tofollow a log-normal (LN) distribution. If the log-transformed sample data-set passes theD'Agostino Omnibus test, the data may be treated as log-normal and the uppertolerance limit (UTL) and other quantities of interest calculated.
Due to the lack of symmetry, right-skewed data distributions have means that arealways larger than the distribution median. The log-transformation to achieve normalitybrings the mean and median into closer coincidence for the transformed data but thereverse transformation (exponentiation) separates the mean and median again. Onlyorder statistics, such as the minimum, maximum, median and UTL can be transformed
and back-transformed directly. The median (Median(LNdata)) of the underlying log-normal
data is obtained directly by exponentiation of the mean (!l(Ln-Xfonn)) of the log transformed
data using Equation (2).
= e.ll(Ln-Xjorm)(2)
page 23 of 43RFETS Radiological Engineering TBO-00163
Technical Basis for Characterization of SCO
Although the mean (Mean(LN dataJ of the underlying log-normal data is necessarily largerthan the median, the statistical literature shows that it can be calculated from the mean
and variance (cr2(Ln-XfOI171» of the log-transformed data using Equation (3).
(3)
The upper tolerance limit (UTL(LNdataj) of the underlying log-normal data is obtained
directly by exponentiation of the upper tolerance limit (UTL(Ln-XfOfmj) of the log-transformed data using Equation (4).
~LN-X/onlr) (4)'T -eUT L.(LNdata) -
UTL(LN-XfOrm) is obtained using Equation (1) with parameters Y wand Sp calculated from the log-transformed data.
page 24 of 43RFETS Radiological Engineering TBD-OO163
Technical Basis for Characterization of SCO
4. Radionuclides and Nuclear Data
4.1 Plutonium
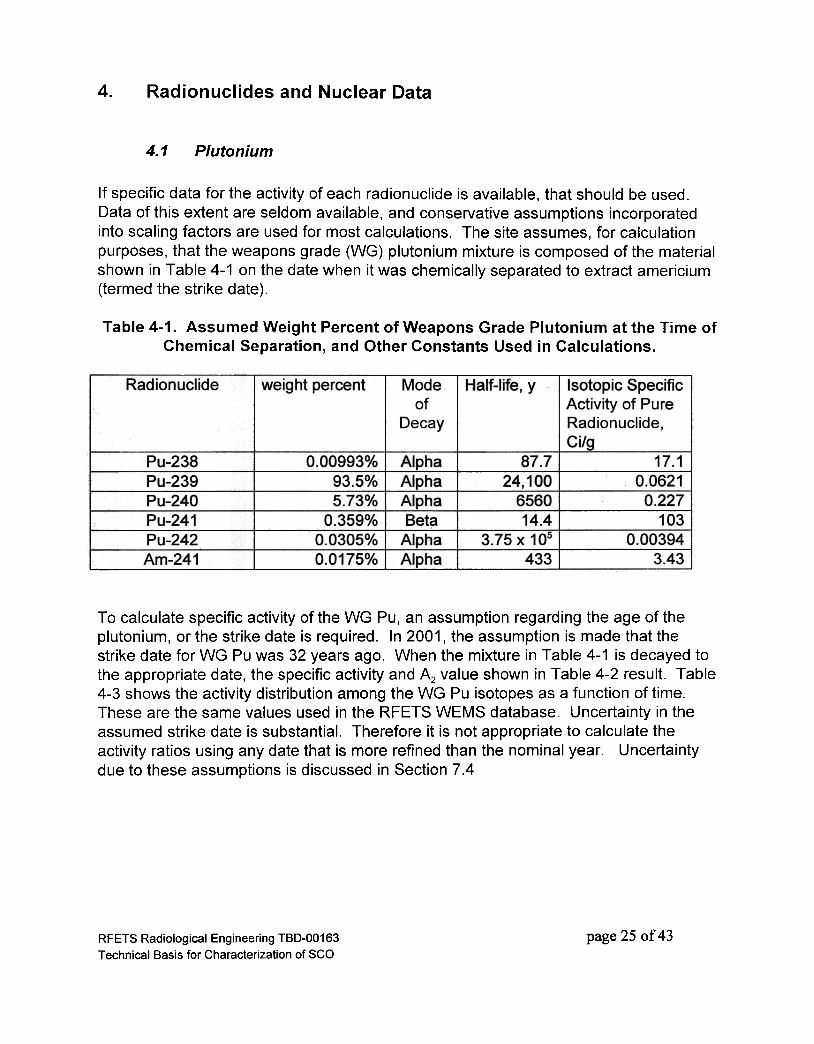
If specific data for the activity of each radionuclide is available, that should be used.Data of this extent are seldom available, and conservative assumptions incorporatedinto scaling factors are used for most calculations. The site assumes, for calculationpurposes, that the weapons grade (WG) plutonium mixture is composed of the materialshown in Table 4-1 on the date when it was chemically separated to extract americium(termed the strike date).
Table 4-1. Assumed Weight Percent of Weapons Grade Plutonium at the Time ofChemical Separation, and Other Constants Used in Calculations.
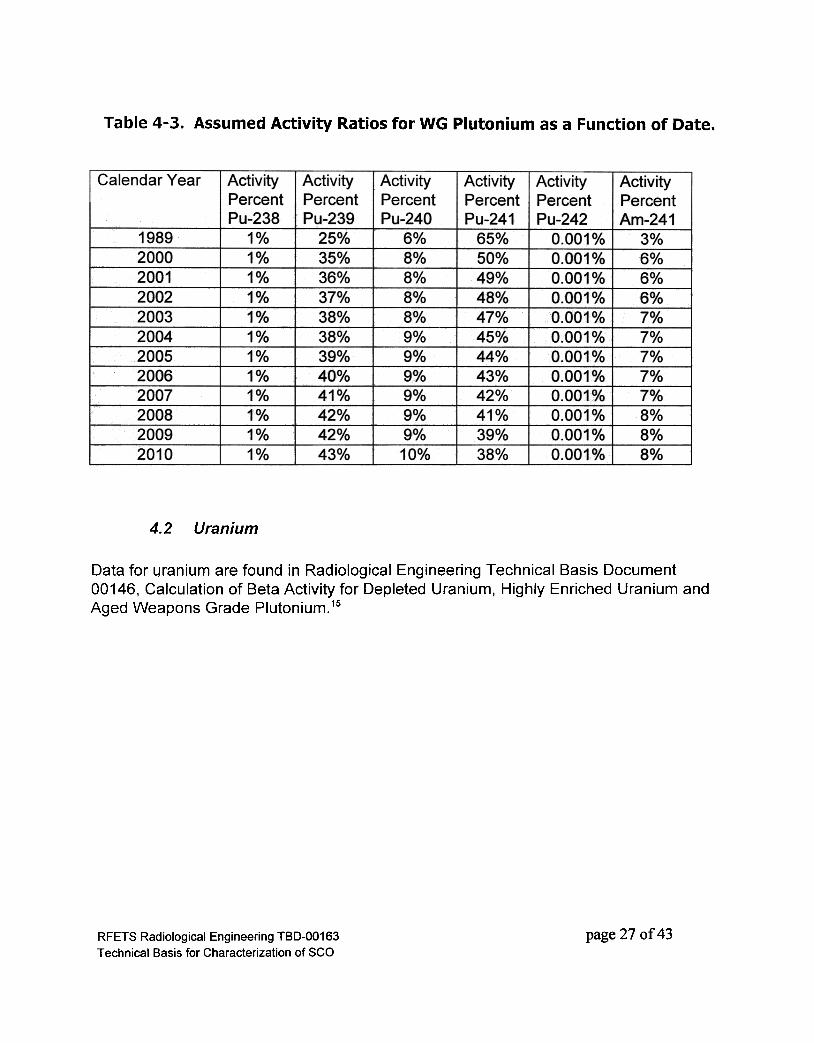
To calculate specific activity of the WG Pu, an assumption regarding the age of theplutonium, or the strike date is required. In 2001, the assumption is made that thestrike date for WG Pu was 32 years ago. When the mixture in Table 4-1 is decayed tothe appropriate date, the specific activity and Az value shown in Table 4-2 result. Table4-3 shows the activity distribution among the WG Pu isotopes as a function of time.These are the same values used in the RFETS WEMS database. Uncertainty in theassumed strike date is substantial. Therefore it is not appropriate to calculate theactivity ratios using any date that is more refined than the nominal year. Uncertaintydue to these assumptions is discussed in Section 7.4
page 25 of 43RFETS Radiological Engineering TBD-OO163
Technical Basis for Characterization of SCO
Table 4-2. Specific Activity and A2 Value of WG Pu as a function of date.
Data for uranium are found in Radiological Engineering Technical Basis Document00146, Calculation of Beta Activity for Depleted Uranium, Highly Enriched Uranium andAged Weapons Grade Plutonium.15
page 27 of 43RFETS Radiological Engineering TBD-OO163
Technical Basis for Characterization of SCO
5. Surface Contamination Measurement Methods
5.1 Instrumentation and Calibration Quality
Only measurement systems capable of providing quality-assured data and approved foruse at RFETS shall be used to obtain data needed to characterize surfacecontaminated objects.
Any radiological measurement data used to characterize SCO shall be obtained withinstruments that have NIST (or other national or international standard) traceability. Ifno traceability to national or international standards is available, as may be the case forsurface contamination standards approaching the SCO II limits, the best availabletechnology shall be applied.
For measurement of contamination levels within the range of standard survey meters (0to 1.2 million dpm/1 00 cm2) the requirements of ANSI N32316 shall apply. Calibration
uncertainty shall be no greater than::!: 10%. Daily performance testing of the
instrumentation shall limit instrument uncertainty to less than::!: 20%.
5.2 Wiping efficiency
Wiping efficiency, which is discussed in NUREG 1608, is normally assumed to be adefault value of 10%. However, it may be useful to calculate wiping efficiency for aspecific case or a group of items. The practice is specifically allowed for SCOdeterminations provided those efficiencies are documented and accounted for incontamination determinations. 17 There is no mandatory standard method for
determining wiping efficiency.b However, ISO 7503-1 (1988)18 does provide a methodfor determination of a removal factor. If wiping efficiency, or removal factor, isempirically determined, the following method based on ISO 7503-1 should be followedfor each important combination of contaminant and surface material:
On a surface where readily detectable amounts of non-fixed contamination exists, takesequential wipes on exactly the same area, using -to the extent possible -identicaltechnique, until exhaustive removal is accomplished. In other words, continue to take
sequential wipes until a wipe picks up only statistically negligible activity.
To calculate the removal factor, divide the activity on the first wipe by the sum of activityon all wipes as shown in the following equation.
b Based on personal conversations between Robert Morris with Wendell Carriker of DOT and between Robert
Morris with Rick Boyle of DOT. Both conversations were held on July 5, 2000.RFETS Radiological Engineering TBD-OO163 page 28 of 43Technical Basis for Characterization of SCO
W; /WTremovalF actor =
whereW1 is the net activity removed in the first wipe, andWT is the net activity removed all subsequent wipes, including the first.
In practical terms, statistically negligible difference for this sequence of wipes would bereached when a subsequent wipe showed only 5% to 10% of the activity collected onthe first wipe. For example, if the true removal factor was 20% and the sequence ofwipes was stopped after a subsequent wipe contained only 10% of the activity found inthe first wipe, the removal factor would be estimated to be 22%. This difference fromthe true value of 20% is judged to be insignificant for the use described here.
Non-fixed contamination levels are determined by dividing the activity removed in awipe by the appropriate removal factor.
In some cases when operating near instrument detection limits, the wiping efficiency-corrected non-fixed level exceeds the fixed plus non-fixed contamination levelmeasured prior taking to the wipe at that location. This illogical outcome stems from theerror propagated by multiplying two poorly defined values. When this occurs, the fixedplus non-fixed contamination value (i.e., the direct measurement of total contamination)should be substituted for the non-fixed contamination value. In other words, if theremovable contamination level exceeds the total contamination level, the removablecontamination value is discarded and replaced with the total value and then all of thatcontamination is assumed to be removable.
page 29 of 43RFETS Radiological Engineering TBD-OO163Technical Basis for Characterization of SCO
6. Calculation of Shipping Container Contents
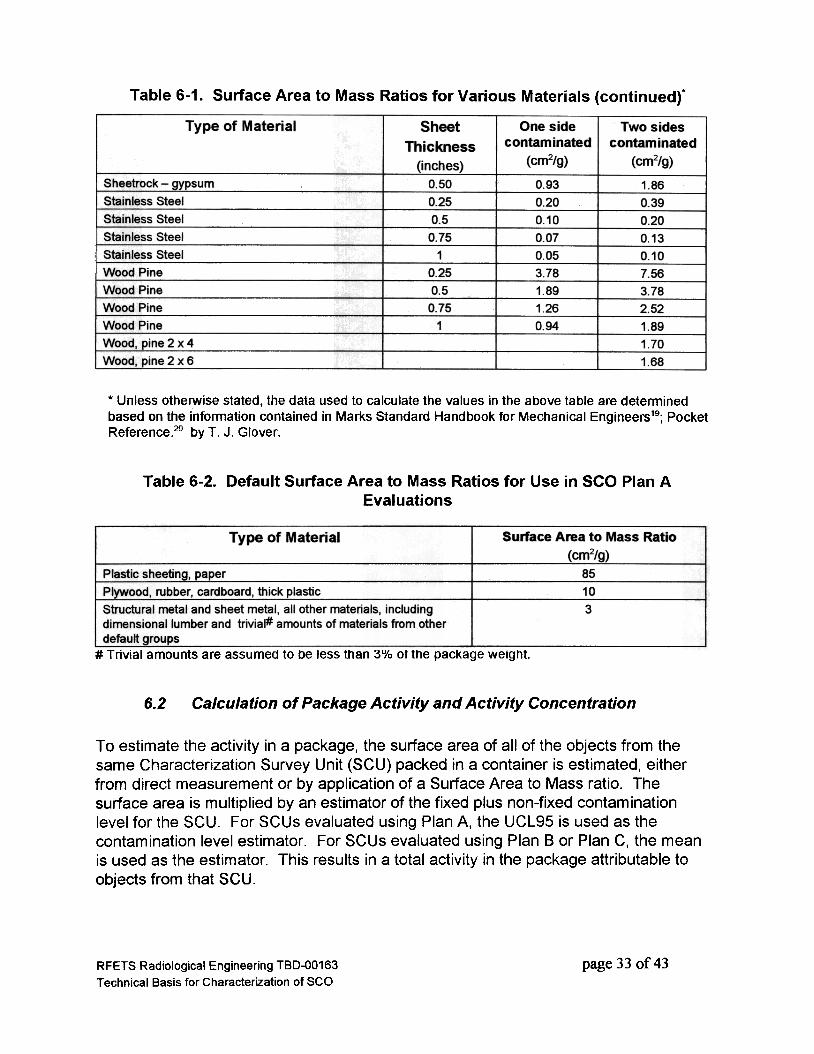
6.1 Surface Area to Mass Ratios
The SCO characterization method establishes either a conservative (UCL95) estimateof the surface contamination level on the objects of interest (Plan A) or an unbiasedestimate (mean) of the contamination level (Plans B and C). The contamination levelsare in units of activity (dpm) per unit area (cm2). To determine the total activity oractivity concentration in a shipping container the surface area of the contaminatedobjects in the container must be known. Surface area can be directly measured;however, the direct measurement method may, in some cases, be difficult or error-prone. An alternate method is to weigh the items of interest, then multiply the weight bya predetermined Surface Area to Mass Ratio that is representative of the material.Surface Area to Mass Ratios, based on measured or tabulated data, have beenestablished for a wide variety of materials and objects. Table 6-1 shows the SurfaceArea to Mass Ratio for several materials. Appendix B documents some empiricalmeasurements used to create Table 6-1. For sheet materials (materials in which theedge area is negligible) not covered here, the ratio may be approximately derived usingtabulated handbook data and the following equation for objects contaminated on onesurface only:
1SAtoMassRatio] =
(Thickness x density)
In some cases, materials may be intimately mixed (commingled) and it may be difficultto determine what ratio to apply. RF/RMRS-98-242 documented a survey of thematerials identified for disposal in Building 779. This work suggests that wastematerials can be conservatively characterized by assuming that all of the waste is 22-gauge sheet metal. Subsequent experience with SCO waste has shown that this isusually, though not always, a conservative assumption.
For Plan A evaluations only, the Surface Area to Mass Ratio may be accuratelyestimated or may be estimated using one of three default values shown in Table 6.2. Inmost cases, Plan A evaluations are performed when the surface contamination levelsare relatively low and the applicable SCO limits and waste acceptance criteria limits arenot challenged. Consequently, the error induced by use of default values will nottypically result in total or specific activity differences that are important to waste disposalfacilities.
RFETS Radiological Engineering TBD-OO163 page 30 of 43Technical Basis for Characterization of SCO
The default values in Table 6-2 were selected to conservatively represent the SurfaceArea to Mass Ratio of waste categories without grossly overestimating the value.Paper and plastic sheeting are represented by the value for 0.01" plastic. Uncertaintystudies described in Section 7.3 guided the selection of these default values. Plywood,rubber, cardboard, and thick plastic (similar to tupperware or thicker) is a mediumcategory. All other objects, including trivial amounts from the other categories, may usethe lowest value. Trivial amounts are assumed to less than about 3% of the net weightof the container.
When default assumptions are applied, the uncertainty in the calculation of shippingcontainer activity and activity concentration is significantly affected by the default valuechosen. Therefore, any use of a default Surface Area to Mass Ratio must be done withcaution and knowledge of the waste stream.
page 31 of 43RFETS Radiological Engineering TBD-OO163Technical Basis for Characterization of SCO
Table 6-1. Surface Area to Mass Ratios for Various Materials.'
Type of Material Sheet
Thickness
(inches)
One sidecontaminated
(cm2/g)
Two sidescontaminated
(cm2/g)
0.125
0.125
4
2
1.191.28
0.040.14
2.382.57
0.09
0.28
9.20.40
0.20
0.1042
0.08
0.28
0.14
0.09
0.071.2
65.48
0.56
0.4085.11
42.5621.28
10.641.22
0.61
0.41
0.312.62
1.310.87
0.66
2.56
1.713.17
4.14
2.07
2.76
I
Aluminum,
Asbestos -Transite Panels
Asphalt -Pavement
Benelux (ARBORON@)
Bucket. plastic
Carbon Steel -Rolled
Carbon Steel
Carbon Steel -Rolled
Cardboard box
Concrete -4" Slab
Lead-Rolled
Lead-Rolled
Lead-Rolled
Lead-Rolled
Lead glass -0.3125" (5/16")
Pacer
0.250.51
0.20
0.10
0.05
0.04
0.14
0.07
0.050.030.6
32.74
4
0.25
0.50.75
1
0.3125
0.01Personal comDuter case and contents
Personal computer monitor
Polyethylene Sheeting (Plastic sheet -10 mil)
Polyethylene Sheeting (~Iastic sheet -20 mil) I
Polyethylene Sheeting (Plastic sheet -40 mil)
Polyethylene Sheeting (Plastic sheet -80 mil)
Plate Glass
0.010.020.040.080.25
0.50
0.75
10.25
0.50
0.75
10.50
0.75
42.56
21.2810.64
5.32
0.610.310.200.15
1.310.660.440.331.280.85
Plate Glass
Plate Glass
Plate Glass
Plexi9las@
Plexiglas@
Plexiglas@
Plexiglas@
Plywood
PlywoodPrinted circuit board
Rubber Goods 0.125~
0.036
2.071.03
1.38Sheet metal- 18 gage
Sheet metal -20 gage
Sheet metal -22 gage 0.030 1.66 3.32
page 32 of 43RFETS Radiological Engineering TBD-OO163Technical Basis for Characterization of SCO
Table 6-1. Surface Area to Mass Ratios for Various Materials (continued)"
Type of Material Sheet
Thickness
(inches)
One sidecontaminated
(cm2/g)
Two sidescontaminated
(cm2/g)Sheetrock -gypsum .
Stainless Steel
0.50
0.25
0.50.75
10.25
0.50.75
1
0.93
0.200.10
0.07
0.05
3.78
1.89
1.26
0.94
1.860.39
0.20
0.13
0.10
7.563.78
2.521.891.70
1.68
Stainless Steel
Stainless Steel
Stainless Steel
Wood Pine
Wood Pine
Wood Pine
Wood Pine
Wood, pine 2 x 4
Wood, pine 2 x 6
* Unless otherwise stated, the data used to calculate the values in the above table are determined
based on the information contained in Marks Standard Handbook for Mechanical Engineers19; PocketReference.2o by T. J. Glover.
Table 6-2. Default Surface Area to Mass Ratios for Use in SCO Plan AEvaluations
# Trivial amounts are assumed to be less than 3% of the package weight.
6.2 Calculation of Package Activity and Activity Concentration
To estimate the activity in a package, the surface area of all of the objects from thesame Characterization Survey Unit (SCU) packed in a container is estimated, eitherfrom direct measurement or by application of a Surface Area to Mass ratio. Thesurface area is multiplied by an estimator of the fixed plus non-fixed contaminationlevel for the SCU. For SCUs evaluated using Plan A, the UCL95 is used as thecontamination level estimator. For SCUs evaluated using Plan B or Plan C, the meanis used as the estimator. This results in a total activity in the package attributable toobjects from that SCU.
page 33 of 43RFETS Radiological Engineering TBD-OO163
Technical Basis for Characterization of SCO
If a container is packed with objects from more than one SCU, a mass-weighted
average is used to establish the total and specific activity in the package.
The activity concentration in the package is estimated by dividing the total activity inthe package by the net weight of the surface contaminated objects. Dunnage, suchas initially uncontaminated blocking and bracing material or incidental quantities of oil-dry, shall not be included in the net weight.
page 34 of 43RFETS Radiological Engineering TBD-OO163
Technical Basis for Characterization of SCO
7. Uncertainty Evaluation
Evaluation and consideration of uncertainty is a requirement typically found in wasteacceptance criteria. Uncertainty derives from many different sources during thecharacterization of waste. Major sources of uncertainty are described here usingterms and methods defined in NIST Technical Note 1297.
Uncertainty is not used to bias the reported values developed from data. Instead it isused to judge the adequacy of the data for its intended purposes. The numbers citedhere are intended for illustration and as a rough estimate leading to combinedstandard uncertainty. They should not be used beyond that purpose, because insome cases the component uncertainty values are based only on observation and
professional judgement.
Components of uncertainty may be categorized according to the method used toevaluate them.
.Type A method of evaluation of uncertainty by the statistical analysis of series of
observations,.Type B method of evaluation of uncertainty by means other than the statisticalanalysis of series of observations.
Each component of uncertainty, however evaluated, is represented by an estimatedstandard deviation, termed standard uncertainty, equal to the positive square root ofthe estimated variance.
Type A standard uncertainty is obtained by statistically estimating standard deviation.Type B standard uncertainty component is obtained by estimating a quantity whichmay be considered an approximation to the corresponding standard deviation; it isequal to the square root of the corresponding variance and is obtained from anassumed probability distribution based on all the available information. Whenstandard uncertainty is reported as a percentage, it becomes relative uncertainty.
7.1 Combined Relative Uncertainty
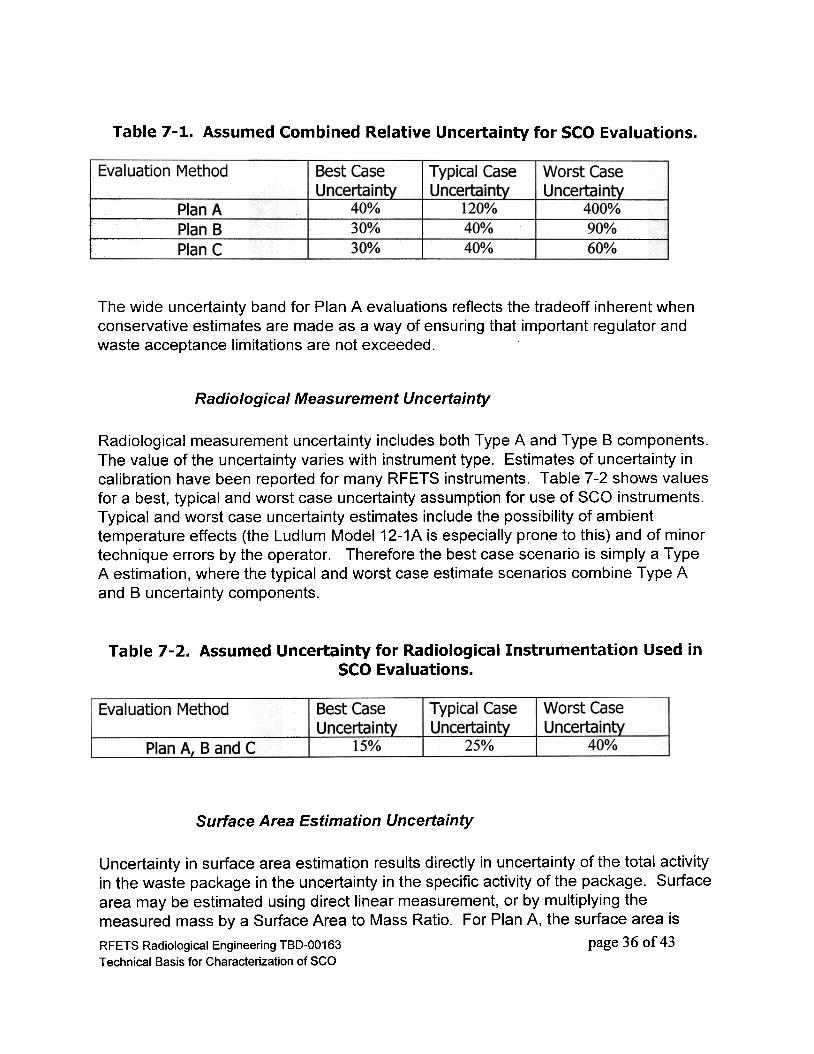
The combined relative uncertainty is estimated by a method typically called the "root-sum-of-the-squares." Values for the various uncertainty terms detailed in Sections 7.2through 7.5 are included in a sum of squares calculation for a best, typical, and worstcase. The results, which are rounded to avoid the appearance that these values arewell known, shown in Table 7-1.
page 35 of 43RFETS Radiological Engineering TBD-OO163
Technical Basis for Characterization of SCO
Table 7-1. Assumed Combined Relative Uncertainty for SCO Evaluations.
Evaluation Method Best CaseUncertainty
Typical CaseUncertainty
40%30%30%
PlanAPlan BPlan C
120%40%40%
Worst CaseUncertainty
400%90%60%
The wide uncertainty band for Plan A evaluations reflects the tradeoff inherent whenconservative estimates are made as a way of ensuring that important regulator andwaste acceptance limitations are not exceeded.
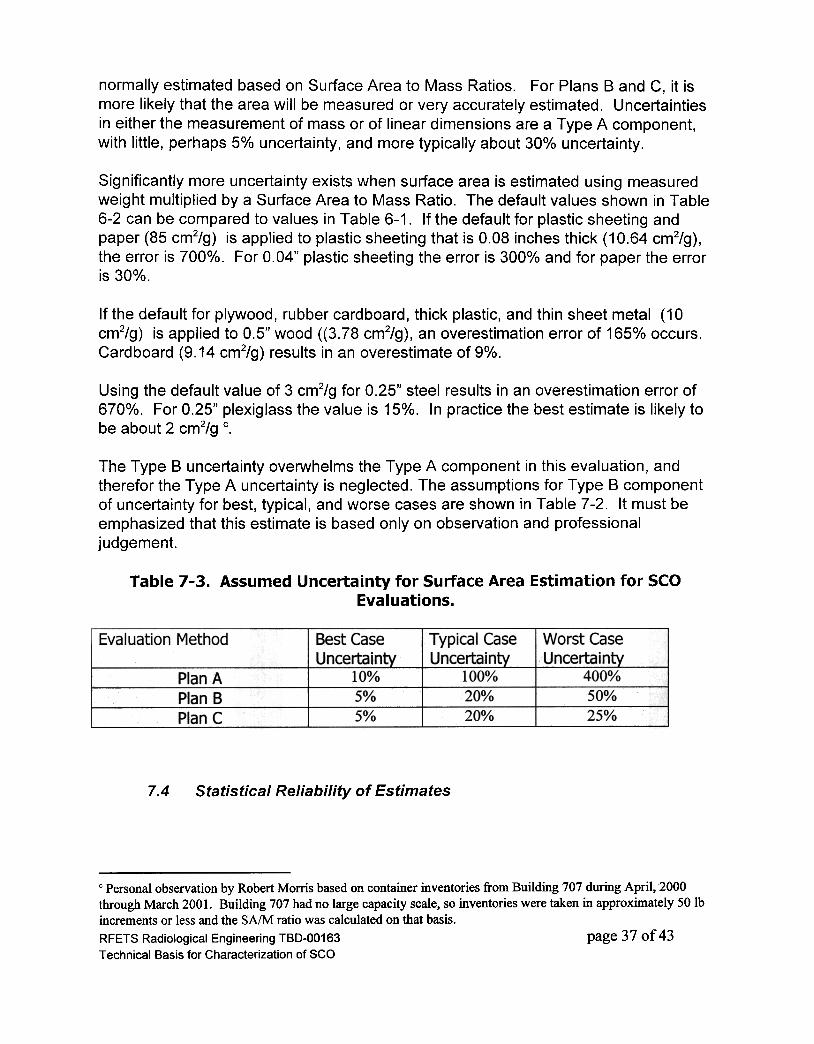
Radiological Measurement Uncertainty
Radiological measurement uncertainty includes both Type A and Type B components.The value of the uncertainty varies with instrument type. Estimates of uncertainty incalibration have been reported for many RFETS instruments. Table 7-2 shows valuesfor a best, typical and worst case uncertainty assumption for use of SCO instruments.Typical and worst case uncertainty estimates include the possibility of ambienttemperature effects (the Ludlum Model 12-1A is especially prone to this) and of minortechnique errors by the operator. Therefore the best case scenario is simply a TypeA estimation, where the typical and worst case estimate scenarios combine Type Aand B uncertainty components.
Table 7-2. Assumed Uncertainty for Radiological Instrumentation Used inSCO Evaluations.
Typical CaseUncertainty
Worst CaseUncertainty
Evaluation Method Best Case
Uncertainty25% 40%15%Plan A, Band C
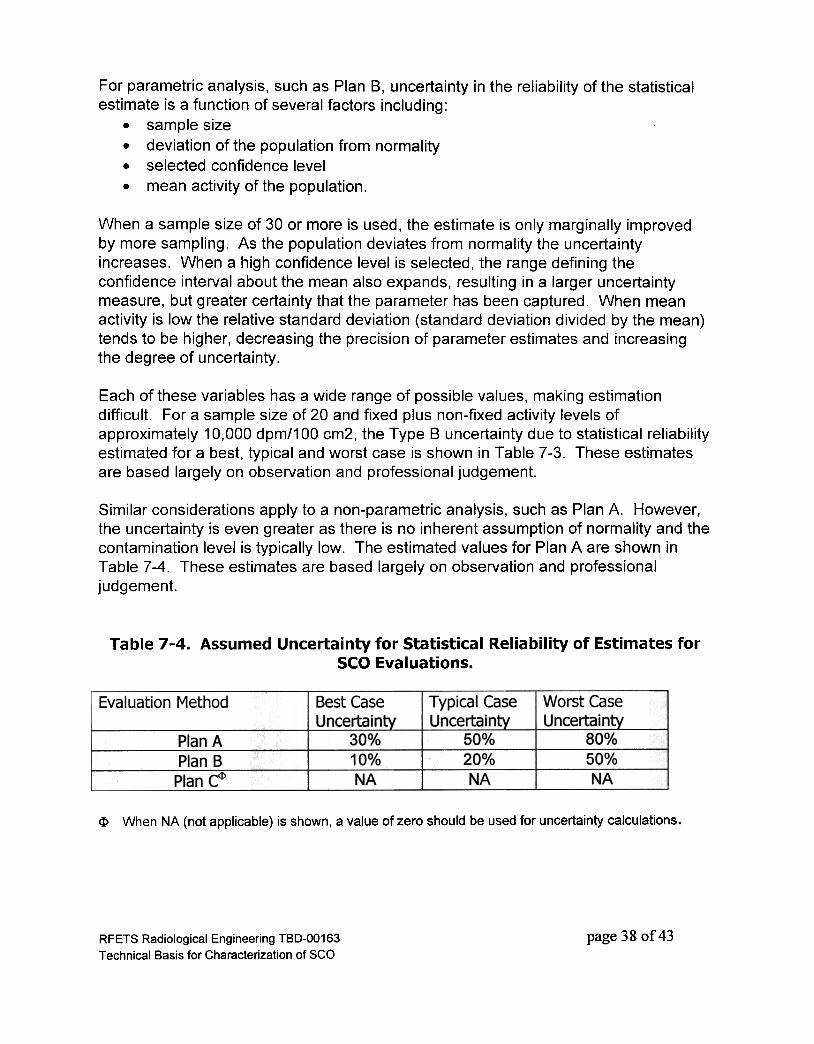
Surface Area Estimation Uncertainty
Uncertainty in surface area estimation results directly in uncertainty of the total activityin the waste package in the uncertainty in the specific activity of the package. Surfacearea may be estimated using direct linear measurement, or by multiplying themeasured mass by a Surface Area to Mass Ratio. For Plan A, the surface area is
RFETS Radiological Engineering TBO-00163 page 36 of 43
Technical Basis for Characterization of SCO
normally estimated based on Surface Area to Mass Ratios. For Plans Band C, it ismore likely that the area will be measured or very accurately estimated. Uncertaintiesin either the measurement of mass or of linear dimensions are a Type A component,with little, perhaps 5% uncertainty, and more typically about 30% uncertainty.
Significantly more uncertainty exists when surface area is estimated using measuredweight multiplied by a Surface Area to Mass Ratio. The default values shown in Table6-2 can be compared to values in Table 6-1. If the default for plastic sheeting andpaper (85 cm2/g) is applied to plastic sheeting that is 0.08 inches thick (10.64 cm2/g) ,the error is 700%. For 0.04" plastic sheeting the error is 300% and for paper the erroris 30%.
If the default for plywood, rubber cardboard, thick plastic, and thin sheet metal (10cm2/g) is applied to 0.5" wood ((3.78 cm2/g) , an overestimation error of 165% occurs.Cardboard (9.14 cm2/g) results in an overestimate of 9%.
Using the default value of 3 cm2/g for 0.25" steel results in an overestimation error of670%. For 0.25" plexiglass the value is 15%. In practice the best estimate is likely tobe about 2 cm2/g c.
The Type B uncertainty overwhelms the Type A component in this evaluation, andtherefor the Type A uncertainty is neglected. The assumptions for Type B componentof uncertainty for best, typical, and worse cases are shown in Table 7-2. It must beemphasized that this estimate is based only on observation and professional
judgement.
Table 7-3. Assumed Uncertainty for Surface Area Estimation for SCOEvaluations.
Typical Case
UQ~ertainty
Evaluation Method Best CaseUncertainty
10%5%5%
100%20%20%
Worst Case
Uncertainty400%50%25%
Plan APlan BPlan C
7.4 Statistical Reliability of Estimates
C Personal observation by Robert Morris based on container inventories from Building 707 during April, 2000through March 2001. Building 707 had no large capacity scale, so inventories were taken in approximately 50 Ibincrements or less and the SA/M ratio was calculated on that basis.RFETS Radiological Engineering TBD-OO163 page 37 of 43Technical Basis for Characterization of SCO
For parametric analysis, such as Plan 8, uncertainty in the reliability of the statisticalestimate is a function of several factors including:
.sample size
.deviation of the population from normality
.selected confidence level
.mean activity of the population.
When a sample size of 30 or more is used, the estimate is only marginally improvedby more sampling. As the population deviates from normality the uncertaintyincreases. When a high confidence level is selected, the range defining theconfidence interval about the mean also expands, resulting in a larger uncertaintymeasure, but greater certainty that the parameter has been captured. When meanactivity is low the relative standard deviation (standard deviation divided by the mean)tends to be higher, decreasing the precision of parameter estimates and increasingthe degree of uncertainty.
Each of these variables has a wide range of possible values, making estimationdifficult. For a sample size of 20 and fixed plus non-fixed activity levels ofapproximately 10,000 dpm/1 00 cm2, the Type B uncertainty due to statistical reliabilityestimated for a best, typical and worst case is shown in Table 7-3. These estimatesare based largely on observation and professional judgement.
Similar considerations apply to a non-parametric analysis, such as Plan A. However,the uncertainty is even greater as there is no inherent assumption of normality and thecontamination level is typically low. The estimated values for Plan A are shown inTable 7-4. These estimates are based largely on observation and professional
judgement.
Table 7-4. Assumed Uncertainty for Statistical Reliability of Estimates forSCO Evaluations.
Typical CaseUncertainty
Worst Case
UncertaintyEvaluation Method Best Case
Uncertainty30%10%NA
50%20%NA
80%50%NA
Plan APlan B~~
When NA (not applicable) is shown, a value of zero should be used for uncertainty calculations.<I>
page 38 of 43RFETS Radiological Engineering TBD-OO163
Technical Basis for Characterization of SCO
7.5 Uncertainty Due to Plutonium Separation DateAssumptions regarding the plutonium separation (strike) date are discussed in Section4.1. If the strike date where 1989, the last year of production, instead of theconservatively assumed date of 1969, the values used in scaling factors would bealtered. Table 7-5 compares pertinent activity data, based on 1989 and 2001 strikedates.
Table 7-5. Comparison of Specific Activity and A2 Value of WG Pu Separated in1989 and 1969.
The difference in TRU alpha activity between the two dates, 2%, is negligible. TRUalpha activity is use for comparison to SCO limits and in determining acceptability fordisposal in a near-surface landfill. The differences in total activity concentration and inthe A2 value are approximately -40%, and are closely correlated. The total activity in apackage is compared to the A2 value for compliance with SCO shipping regulations.Because of their correlation, this uncertainty has little or no effect on quantitiesimportant to compliance with SCO shipping regulations. If the plutonium had beenmore recently separated, the total activity in the package would be underestimated byabout 40%. This would result in underestimation of the activity buried at the waste
disposal site.
Considering these facts, the component uncertainty based on plutonium strike date issummarized in Table 7-6.
Table 7-6. Uncertainty Based WG Pu Separation Date for SCO Evaluations.
Evaluation Method Best CaseUncertainty
Typical CaseUncertainty
Worst CaseUncertainty
30%5% 15%Plan A, B, and C
page 39 of 43RFETS Radiological Engineering TBD-OO163
Technical Basis for Characterization of SCO
8.
REFERENCES
PRO-267-RSP-09.05. "Radiological Characterization for Surface ContaminatedObjects." Rocky Flats Environmental Test Site. Radiological Safety PracticesManual. 2001.
RF/RMRS-98-242, Rev. O. Technical Basis Document, "Radiological FieldCharacterization of Low Level Waste by Measuring Surface Contamination andCalculating Total and Specific Activity." Rocky Flats Environmental TechnologySite. June 15, 1998.
RFETS Interoffice Correspondence from Thomas R. Gatliffe to Gary J. Bracken,dated November 24, 1998. Subject: "Statistical Analysis of Proposed SampleData Restriction for Classification of Surface Contamination Objects (SCO) inRFETS Draft Procedure PRO-267-RSP 09.05 (Rev 1)." TRG-036-98.
RFETS Interoffice Correspondence from Thomas R. Gatliffe to Gary J. Bracken,dated December 23, 1998. Subject: "Statistical Review of Technical BasisDocument RF/RMRS-98-242 and Further Analysis of Sample Data Restrictions inRFETS Draft Procedure PRO-267-RSP 09.05 (Rev 1)." TRG-040-98.
NUREG 1608/RAMREG-OO3. "Categorizing and Transporting Low Specific ActivityMaterials and Surface Contaminated Objects." Research and Special ProgramsAdministration, U.S. Department of Transportation, Washington, DC. 1998.
"Nevada Test Site Waste Acceptance Criteria (NTSWAC), Revision 3." WasteManagement Division, Nevada Operations Office, U.S. Department of Energy
December 2000. www.nv.doe.gov/programs/envmgmUrwap/ntswac.htm.
10CFR61.55
"Waste Acceptance Guidelines, Revision 2." Envirocare of Utahwww.envirocareutah.com
March, 2001
Multi-Agency Radiation Survey and Site Investigation Manual (MARSSIM),NUREG-1575/EPA 402-R-97-016, December 1997.
10 Ott, W.R., Environmental Statistics and Data Analysis, CRC Press LLC, BocaRaton, 1995.
Mayer, A.D. and A.M. Sykes, 1996. "Statistics"; Arnold, London.
page 40 of 43RFETS Radiological Engineering TBD-OO163
Technical Basis for Characterization of SCO
Evans, Merran; Nicholas Hastings; and Brian Peacock; 1993.Distributions", 2nd ed.; John Wiley & Sons, New York.
"Statistical
A. D. Palachek, Statistical Applications, Internal Report SA-94-007. EG&G RockyFlats Inc. Golden, Colorado. August 10, 1994.
14 D'Agostino, R.B., A. Belanger, and R.B. D'Agostino Jr. 1990. "A Suggestion forUsing Powerful and Informative Tests of Normality.", The American Statistician,November, 1990, Vol. 44 No.4, pp. 316-321.
15 TBD-OO146. "Calculation of Beta Activity for Depleted Uranium, Highly Enriched
Uranium and Aged Weapons Grade Plutonium," RFETS Radiological TechnicalBasis Document.
16 ANSI N323A-1997. "Radiation Protection Instrumentation Test and Calibration -
Portable Survey Instruments." American National Standards Institute. 1997.
NUREG 1608, Section 3.2.5
18 ISO 7503-1: 1988 (E). "Evaluation of Surface Contamination -Part 1: Beta-emitters (maximum energy greater than 0.15 MeV) and alpha emitters."International Organization for Standardization.
"Marks' Standard Handbook for Mechanical Engineers". McGraw-Hili. 1996.19
20 T. J. Glover. "Pocket Reference." Sequoia Publishers. 1994.
page 41 of 43RFETS Radiological Engineering TBD-OO163Technical Basis for Characterization of SCO
Appendix A.
Calculating One-Sided Tolerance Limits Based on WeightedMeans from Multiple Samples
A. D. Palachek
PakJchekUT~.pdf
page 42 of 43RFETS Radiological Engineering TBD-OO163Technical Basis for Characterization of SCO
A.D. PalachekStatistical Applications
August 10, 1994
SA-94-007
Statistical Applications
EG&G Rocky Flats Inc.Rocky Fl~ts Plant.
P.o. Box 464Golden, Colorado 80402-0464
Internal Report -Not Cleared for Publication
Reviewed ForCI;",ification/UCNIB ; ~~~~~A~:~~:~~~~ y -
Date 1:3 i""'A d.
Appendix A. Page 1 of 11RFETS Radiological Engineering T80-O0163Technical Basis for Characterization of SCO
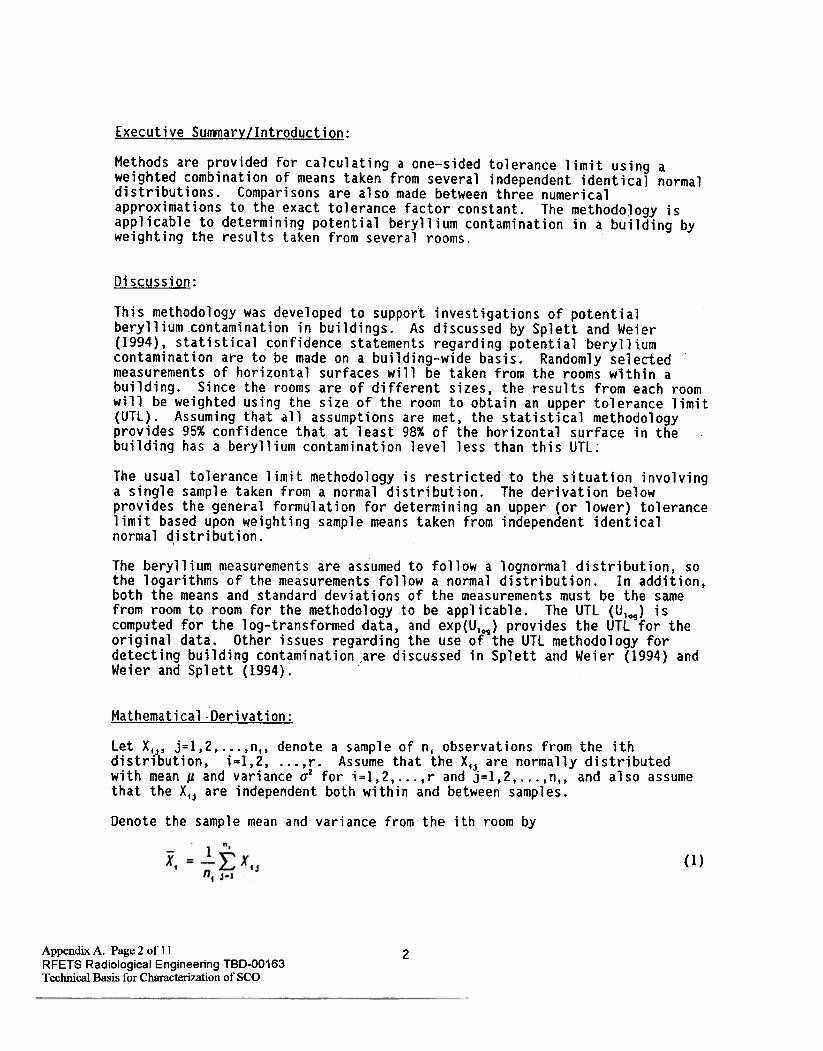
Executive SummarY/Introduction:
Methods are provided for calculating a one-sided tolerance limit using aweighted combination of means taken from several independent identical normaldistributions. Comparisons are also made between three numericalapproximations to the exact tolerance factor constant. The methodoJogy isapplicable to determining potential beryllium contamination in a building byweighting the results taken from several rooms.
Discussion:
This methodology was developed to support investigations of potentialberyllium contamination in buildings. As discussed by Splett and Weier(1994), statistical confidence statements regarding potential 'berylli.um .contamination are to be made on a building-wide basis. Randomly selectedmeasurements of horizontal surfaces will be taken from the rooms within abuilding. Since the rooms are of different sizes, the results from each roomwill be weighted using the size of the room to obtain an upper tolerance limit(UTL). Assuming that all assumptions are met, the statistical methodologyprovides 95% confidence that at least 98% of the horizontal surface in thebuilding has a beryllium contamination level less than this UTL;
The usual tolerance limit methodology is restricted to the situation involvinga single sample taken from a normal distribution. The derivation belowprovides the general formulation for determining an upper (or lower) tolerancelimit based upon weighting sample means taken from independent identicalnormal distribution.
The beryllium measurements are assumedthe logarithms of the measurements follboth the means and standard deviationsfrom room to room for the methodology tcomputed for the log~transformed data,original data. Other issues regardingdetecting building contamination ,are diWeier and Splett (1994).
Mathematical-Derivation:
let Xl~, j=1,2,. ..,nl, denote a sample of nj observations from the ithdistrlbution, i=1,2, ...,r. Assume that the Xij are normally distributedwith mean ~ and variance a2 for i=1,2,...,r and j=1,2, ...,nl, and also assumethat the Xlj are independent both within and between samples.
Denote the sample mean and variance from the ith room by
(I)
2Appendix A. Page 2 of 11RFETS Radiological Engineering TBD-OO163Technical Basis for Characterization of SCO
to follow a lognormal distribution, soow a normal distribution. In addition,of the measurements must be the same0 be applicable. The UTl (UI0g) isand exp(U1~) provides the UTl for thethe use of the UTl methodology forscussed in Splett and Weier (1994) and
and t respectively.
let wI» Wz» wr denote the weightings assigned to the r samples» where0 ~ WI ~.1 for i~1»2 r and
r,
LWt = 1t~l
(3)
The weighted estimate of the mean is defined byr
Yw =}:"1X1. (4i-I
As a result of the normality assumptions, Yw is also a normal random variablewith mean p, and variance aw2 = ca2,
r loll" ,':where c = L .1.. ':it" I~
i-I n1
The parameter ~ may be estimated by the pooled sample variance, which isgiven by
(6)
,.N = L nf
f-lwhere is the combined sample size.
As a result of the distributional assumptions,
{N-rJ Sp'(7)~
has a chi-square distribution with N-r degrees of freedom.
The remainder of the derivation of the tolerance limit follows the sameapproach described by Owen (1958) to determine the "usual" (unweighted) one-sided tolerance limit constants.
An upper tolerar).C,~ 11,lJJ.i,~, is, a value U for which at lea~t lOOP% of thepopulation is smaller than the limit with c.onfidence 1 -(t.. This limit ismathematically denoted ~s
Yw + kSp . (8)
:3Appendix A. Page 3 of 11RFETS Radiological Engineering T80-O0163Technical Basis for Characterization of SCO
This probability statement may be rewritten as
rdx ~ p = 1 -(l
ThenLet Zp denote the Pth percentile from the standard normal distribution.the tolerance probability statement becomes
[ y +kS-p. .Pr w p ~ Zp= I-a.
u
This may then be rewritten as
Zp
{C
y -p.w
~rc-Pr =}-O;,sp
0'
k
JC"
< -k--{C
or =!a
The random variable
Y- p. Zw -P
(14)Sp0'
has a non central t'distribution with N -.r degrees of freedom and
4Appendix A. Page 4 of 11RFETS Radiological Engineering T80-O0163Technical Basis for Characterization of SCO
The factor k is selected to satisfy the probability state~ent
pr(pr{XS Y. +kSp) ~P] = l-Q, (Q\
noncentraJ itY!lparameter, ~j;~ --,E~.
.fC
I t'..a{6) denote the ath percentile from a noncentral t random variable
wi th u degrees of freedom and noncentra 1.i ty parameter O.statement (13) results jn
k = -{C. t I (-z / JCi .~H a pYf;/
let
Then
the probability
Using properties of the noncentral t distribution (see Patel," Kapadia, Owen(1976), p.228), the tolerance factor is equivalent to
k = .;c. t'N-r,l-a(Zp/v'C) .(:
The same tolerance factor is used to obtain a lower tolerance limit.lower tolerance limit is given by
Yw -kSp .
The
J
The usual one sample tolerance interval may be viewed as a special case ofdetermining a tolerance limit based on a sample from a single sample. Forthis situation, the constants become r=l, N=n, w1=1, and c=ljn. The tolerancefactor becomes
) aR ;. s~l,s'r:r1.
(19).iii
which is the usual one sample tolerance factor as given by Owen (1958).(
Numerical Aooroximations:
Calculation of the tolerance factor requires the percentile from thenonc-entral t distribution. A closed form solution for this percentile doesnot exist, so numerlcal approximations and/or algorithms must be used toobtain an approximate value for t'.a(6). The Statistical Analysis System(SAS) software used by Statistical Applications contains an internal function,TINV, that performs a numerical algorithm to approximate the percentile.Appli~ation of this approximation when calculating the usual one-sampletolerance factor leads to results that match those published by Hahn (1970)..
.However, the SAS function TINV can fail for large absolute values of thenoncentrality parameter 6. For the tolerance factor, large values of 6 areassociated with small values.of c, indicating large n,. Large n, also resultin 1 arger .degrees of freedom.
5Appendix A. Page 5 of 11RFETS Radiological Engineering T80-O0163Technical Basis for Characterization of SCO
b = Ii; r(1-;Y- .
The Ganwna function is defined as
where
-
Ir (t) =
xt-le-Xdx.
The noncentrality parameter for the t percentile for the tolerance factor is
given by
z ..0 = -!.- .(24)
r;So a large noncentrality parameter occurs when a small value is obtained for
r w2C = L -!- ..(25)
t-1 n1
The minimum noncentrality parameter is obtained when one sample has samplesize 1 and all of the weight is assigned to this room. This leads to c=l anda minimum noncentrallty parameter of
OM!" = Zp .(26)
However, the noncentrallty parameter could get large if many samples exi~twith sample sizes of n1=l.
~~
Comparisons of the approximations were made for the particular case of P =0.98 and a = 0.05. The evaluations were made for 20,60, and""lOO degrees offreedom. Figures 1 through 3 plot the tolerance factors obtained for varying
6Appendix A. Page 6 of 11RFETS Radiological Engineering TBD-OO163Technical Basis for Characterization of SCO
Conclusions:
Under the assumptions given '(independent identical normal distributions), aone-sided tolerance limit may be calculated using a weighted combination ofthe sample means. If a single numerical approximation is desired, StatisticalApplications recommends using the Jennett-Welch approximation (equation (2O))which gives conservative intervals.
References:
Hahn, G.J. (1970). Statistical Intervals for a Normal Population, Part I.Tables, Examples, and Application$, Journal of Quality Technology, 2, 115-125.
Jennett, W.J. and Welch, B.l. (1939). The Control of Proportion Defective asJudged by a Single Quality Characteristic Varying on a Continuous Scale,Journal of the Roya1 Statistical Society, Series,B, 6, 80-88.
Johnson, N.L. and Kotz, S. (1970).Houghton Mifflin, Boston.
Cont;nuous Un;var;ate O;str;but;ons -2.
Johnson, N.l. and Welch, B.l. (1940).Distribution, Biometrika, 31, 362-389.
Applications of the Noncentral t
Owen, 0.8. (1958). Tables of Factors for One-Sided Tolerance Limits for aNormal Distribution, Monograph. No. SCR-13, Sandia Corporation, Albuquerque,NM.