67
ASVAB Technical Bulletin No. 2 CAT-ASVAB Forms 3 and 4 Personnel Testing Division Defense Manpower Data Center August 2009

ASVAB Technical Bulletin No. 2
CAT-ASVAB Forms 3 and 4
Personnel Testing Division Defense Manpower Data Center
August 2009

Table of Contents Executive Summary...........................................................................................................v 1. Introduction....................................................................................................................1 1.1. Overview of the ASVAB.......................................................................................1 1.2. CAT-ASVAB Forms 1 and 2 ................................................................................3 2. Development of CAT-ASVAB Forms 3 and 4.............................................................3 2.1. Item Development and Tryout...............................................................................3 2.2. Analysis of the Tryout Items .................................................................................7 2.2.1. Item Calibration...........................................................................................7 2.2.2. Equating of the non-AO Tests to the 1980 Reference Scale .......................8 2.2.3. Analysis of Differential Item Functioning ..................................................9 2.2.4. Final Tryout Pools .......................................................................................9 2.2.5. Scaling and Equating of the Assembling Objects (AO) Test ....................10 2.2.6. Factor Structure of General Science (GS) and Assembling Objects (AO).........................................................................11 2.2.6.1. Factor Structure of General Science (GS) Booklets ............................11 2.2.6.2. Factor Structure of Assembling Objects (AO) Booklets......................14 2.2.7. Gender Differences in Assembling Objects (AO).....................................14 2.3. Assembly of CAT-ASVAB Forms 3 and 4 .........................................................16 2.3.1. Phase 1: Item Assignment to Two Primary Forms....................................16 2.3.2. Phase 2: Evaluation of the Primary Forms and Construction of the Final CAT-ASVAB Forms 3 and 4 .................................................17 2.4. Comparability Study: New Test Administration Order and Construct Equivalence between CAT Forms 1 and 2 and Forms 3 and 4...........19 2.4.1. Study Description ......................................................................................19 2.4.2. Examination of Group Equivalence ..........................................................21 2.4.3. Impact of Change in Test Administration Order .......................................23 2.4.4. Construct Equivalence Between CAT Forms 1 and 2 and Forms 3 and 4............................................................................................27 3. Equating of CAT Forms 3 and 4 ................................................................................30 3.1. Provisional Equating............................................................................................30 3.1.1. Data Collection..........................................................................................30 3.1.2. Group Equivalence ....................................................................................31 3.1.3. Two Equating Designs ..............................................................................31 3.1.4. Equating Method .......................................................................................32 3.2. Final Operational Equating .................................................................................34 3.3. Evaluation of the Equating/Transformation Tables ............................................36 3.3.1. Evaluation of the Equating Tables Based on Composite Scores...............36 3.3.2. Evaluation of the Equating Tables for the Subgroups...............................38 3.4. Comparison of the Provisional and Final Score Transformations.......................40 3.5. Simulated Test-Retest Reliabilities of CAT- ASVAB Forms 3 and 4 ................42
i

4. Conclusion ....................................................................................................................42
References ....................................................................................................................44 Appendices ....................................................................................................................47 Appendix A: Actual Tryout Sample Size by Test Book.............................................47 Appendix B: Service-Specific Components (2008) ...................................................49 Appendix C: Scatter Plots of Ability Estimates across Forms ...................................51 Appendix D: Score Information Functions across Forms ..........................................54
ii
List of Tables
1.1. CAT-ASVAB Content Summary ............................................................................1 1.2. CAT-ASVAB Forms 1 and 2 Test Lengths and Form Sizes ...................................3 2.1. Structure of the Books for the CAT-ASVAB Forms 3 and 4 Tryout Study............5 2.2. Characteristics of the Tryout Sample by Series.......................................................6 2.3. Characteristics of the Actual Tryout Sample Obtained ...........................................7 2.4. Summary of Eliminated Records from the Item Tryout Study Data .......................7 2.5. Size of the Final Tryout Pools ...............................................................................10 2.6. Numbers of Items and Numbers of Examinees Included
in GS Factor Analyses ...........................................................................................12 2.7. Numbers of Factors Identified for Each GS Booklet.............................................13 2.8. Mean Number-Right Scores by Gender and Subcategories for AO ......................14 2.9. Weighted Mean P-values by Gender and Subcategories for AO...........................15 2.10. Pool Sizes and Sources for the Final CAT Forms 3 and 4.....................................18 2.11 Comparability Study Sites, Test Dates, and N Counts ..........................................19 2.12 Comparability Study Design..................................................................................20 2.13 Summary of Deleted Records for Comparability Study ........................................20 2.14. Comparability Study CAT Group Equivalence: Site.............................................21 2.15. Comparability Study CAT Group Equivalence: Gender .......................................21 2.16. Comparability Study CAT Group Equivalence: Ethnicity/Race ...........................22 2.17. Comparability Study CAT Group Equivalence:
Mean Operational Standard Scores........................................................................23 2.18. Significance Tests on Mean Standard Score Differences between
Old and New Administration Orders of Tests .......................................................24 2.19. CAT Forms 1 and 2 Reliabilities and Disattenuated Correlations between
Old-Order and New-Order Scores .........................................................................25 2.20. Reliabilities and Disattenuated Correlations between
Old-Order and New-Order Composites .................................................................26 2.21. Significance Tests for Mean Composite Score Differences between
Old and New Administration Orders of Tests ......................................................27 2.22. Reliabilities and Disattenuated Correlations between
Old and New CAT Form by Scores ......................................................................28 2.23. Reliabilities and Disattenuated Correlations between
Old and New CAT Forms by Composites .............................................................29 3.1. Design for the CAT Forms 3 and 4 Provisional Equating Study ..........................30 3.2. Example Conversion Table for a Test ...................................................................33 3.3. Distribution of Examinees across the MEPS that Participated
in the Operational Equating Study.........................................................................34 3.4. Distributions of Gender by Form for the Operational Sample
used in the Final Equating ............................................................................................35 3.5. Distributions of Ethnicity/Race by Form for the Operational Sample
used in the Final Equating .....................................................................................35
iii
3.6. 5% Confidence Intervals of Mean Length of Education by Form for the Operational Sample used in the Final Equating ..........................36
3.7. Distributional Equivalence of Composites ...........................................................37 3.8. Equivalence of Score Distributions for Females ...................................................38 3.9. Equivalence of Score Distributions for African-Americans/Blacks .....................39 3.10. Equivalence of Score Distributions for Latino-Americans/Hispanics...................39 3.11. Comparison of Mean Raw-Scores Based on Provisional and
Final Transformation Tables .................................................................................41 3.12. Comparison of Raw-Score Standard Deviations Based on Provisional and
Final Transformation Tables .................................................................................41 3.13. Test-retest Reliabilities of CAT-ASVAB Forms 1–4 (N = 2,000) ........................42
List of Figures
3.1 Two Equating Designs...........................................................................................31 C.1. Scatter plot of ability estimates for AR Across CAT Forms 3 and 4 ....................52 C.2. Scatter plot of ability estimates for AR Across CAT Forms 1 and 4 ....................53 D.1. Score Information Functions for CAT Forms 1–4 and P&P 9A for GS................55 D.2. Score Information Functions for CAT Forms 1–4 and P&P 9A for AR ...............55 D.3. Score Information Functions for CAT Forms 1–4 and P&P 9A for WK .............56 D.4. Score Information Functions for CAT Forms 1–4 and P&P 9A for PC ...............56 D.5. Score Information Functions for CAT Forms 1–4 and P&P 9A for MK ..............57 D.6. Score Information Functions for CAT Forms 1–4 and P&P 9A for EI .................57 D.7. Score Information Functions for CAT Forms 1–4 and P&P 9A for AI.................58 D.8. Score Information Functions for CAT Forms 1–4 and P&P 9A for SI .................58 D.9. Score Information Functions for CAT Forms 1–4 and P&P 9A for MC...............59 D.10. Score Information Functions for CAT Forms 3 and 4 and P&P 9A for AO .........59
iv

Executive Summary
The Armed Services Vocational Aptitude Battery (ASVAB) is administered annually to more than one million military applicants and high school students. ASVAB scores are used to determine enlistment eligibility, assign applicants to military occupational specialties, and aid students in career exploration. The ASVAB is administered as a paper and pencil (P&P) test in the Student Testing Program. It is administered as both a P&P test and a computerized adaptive test (CAT) in the Enlistment Testing Program. To ensure satisfactory levels of security and fairness in testing, it is important to refresh available pools of items on a regular basis. CAT-ASVAB Forms 1 and 2 were in operational use from 1992 until 1999 when two new pools, CAT-ASVAB Forms 3 and 4, were added. This technical bulletin describes the process of building CAT-ASVAB Forms 3 and 4 and the results of the research studies that were conducted to evaluate the quality of the forms. Chapter 1 provides a historical background of the CAT-ASVAB and its fundamental content information, as well as various scores that the test yields and the number of items per test in CAT-ASVAB Forms 1 and 2. Chapter 2 describes the actual development of the CAT-ASVAB Forms 3 and 4. A content-related feature of the CAT-ASVAB Forms 3 and 4 that was not present with the CAT-ASVAB Forms 1 and 2 was the addition of a new and tenth test, Assembling Objects (AO), to CAT-ASVAB. After item writing and content and sensitivity reviews in the late 1980s and early 1990s, a total of 2,770 items were tried out at the Military Entrance Processing Stations (MEPS) and Mobile Examining Team (MET) sites from August through mid-November 1994. The tryout study involved 151,811 examinees and 56 tryout books, 9 of which contained anchor items from the Paper-and-Pencil (P&P)-ASVAB Form 8A and CAT-ASVAB Forms 1 and 2. Using the tryout response data, the items were calibrated to obtain item response theory (IRT) parameter estimates that were then placed onto the 1980 Reference Score Scale. The tryout data were also analyzed for such additional aspects as differential item functioning (DIF), factor structures, and gender differences (for AO only). The DIF analysis eliminated some items from the tryout pool for potential bias. The factor analysis, conducted because the IRT analysis assumes that each test measures a single trait (i.e., unidimensionality), indicated the need for a continuous close watch on the General Science (GS) and AO tests for the potential violation of the IRT assumption. The analysis of AO showed some gender differences, particularly for Connection items, again suggesting the need for regular monitoring. After the tryout analyses, a total of 2,598 items were available for the assembly of new forms. Generally, the development of CAT Forms 3 and 4 paralleled that of CAT-ASVSAB Forms 1 and 2 with a few exceptions: (1) greater consideration of content taxonomy, and (2) use of different exposure control values (e.g., Hetter and Sympson, 1997). Two primary forms were assembled on the basis of content taxonomy and information functions and compared through simulation against the information functions for P&P Forms 8A and 9A and CAT-ASVAB Forms 1 and 2. The evaluation revealed that the
v

primary forms needed to be supplemented with additional items for all tests except Paragraph Comprehension (PC) and AO. The final CAT-ASVAB Forms 3 and 4, after the augmentation using items written for P&P-ASVAB Forms 25 and 26, contained 2,079 items (1,040 items for Form 3 and 1,039 items for Form 4). A special study was conducted in 1996 to evaluate whether the same constructs were being assessed by CAT-ASVAB Forms 3 and 4 as by CAT-ASVAB Forms 1 and 2. Because a new administration order of the CAT-ASVAB tests was being considered at the time, the study was designed to also assess the impact of changing the administration order. Generally, CAT-ASVAB Forms 3 and 4 were found to be similar to CAT-ASVAB Forms 1 and 2 in terms of reliability and the constructs being measured. Furthermore, the new order was found to have little impact on scores. Chapter 3 describes the equating activities for CAT-ASVAB Forms 3 and 4. The IRT item calibration and equating during the tryout analyses placed all the item parameter estimates in CAT-ASVAB Forms 3 and 4 onto the same 1980 score scale as those for the P&P-ASVAB and CAT-ASVAB Forms 1 and 2 items. Therefore, ability estimates obtained from Forms 3 and 4 should, in theory, be comparable to ability estimates obtained from Forms 1 and 2. However, it is always prudent to take an additional step of directly equating scores. Score equating for CAT-ASVAB Forms 3 and 4 was performed in two phases: provisional and final. The provisional equating study was conducted in 1998 by operationally administering CAT-ASVAB Forms 3 and 4 along with P&P-ASVAB Form 8A and CAT-ASVAB Form 1 to 16,927 recruits at the MEPS. Using an equipercentile equating method with smoothing, the study produced provisional score conversion tables as soon as minimally adequate data were collected. The operational data collection continued after the provisional equating until sufficient data were gathered for the final equating, i.e., until mid-December, 1998. The data for the final equating initially contained responses from 25,397 examinees. After data screening, the final equating was performed using 22,802 cases and an equipercentile equating method with smoothing. An analysis verified that the score transformation tables that had been generated through the equating at the test level (and not at the composite level) produced comparable composite scores between CAT-ASVAB and P&P-ASVAB administrations. Additionally, a comparison of score distributions between CAT-ASVAB and P&P-ASVAB for such subgroups as female, African-American/Black, and Latino-American/Hispanic, demonstrated significant differences for some tests. However, the significant differences were either deemed to have little practical impact based on prior investigations or were small in magnitude. Furthermore, the two sets of score transformation tables ― provisional and final ― were compared to see if they would yield similar scores (as they should). Examinees’ IRT theta scores based on CAT-ASVAB Forms 3 and 4 were converted to number-correct scores using the two sets of transformation tables, and the resulting two sets of number-correct scores were compared. The results showed that the two sets of transformation tables resulted in number-correct distributions that were very similar in the first two moments.
vi
vii
The final section of Chapter 3 provides estimated reliabilities for CAT-ASVAB Forms 3 and 4. Within each test, they are largely comparable with estimated reliabilities for CAT-ASVAB Forms 1 and 2. The closing chapter, Chapter 4, notes that a goal for CAT-ASVAB Forms 3 and 4 was to make information functions as high as possible without going below those of P&P-ASVAB or CAT-ASVAB Forms 1 and 2 as much as possible. The information functions given in Appendix D demonstrate that this goal was generally attained. Based on the largely positive results from the various analyses, CAT-ASVAB Forms 3 and 4 were incorporated into operational use in 1999, along with the final score transformation tables. CAT-ASVAB Forms 1–3 are used for regular administrations ― one is selected randomly for each examinee ― while Form 4 is used for special administrations only (i.e., the 1996 ASVAB Norming Study).
1. Introduction
This document describes the process of developing the third and fourth item pools (or forms) for the computer-adaptive administration of the Armed Services Vocational Aptitude Battery (CAT-ASVAB).
1.1. Overview of the ASVAB
The ASVAB was first introduced in 1968 as part of the Student Testing Program (STP). Since 1976, the ASVAB has also been administered to all military applicants as part of the Enlistment Testing Program (ETP). The ASVAB for the career-exploration STP is a paper-and-pencil (P&P) test, while it is available in P&P or computerized adaptive test (CAT) format for the ETP. The ASVAB for the STP and ETP combined is administered each year to more than one million examinees. The operational administration of the CAT-ASVAB started in 1990 after 20 years of extensive research and evaluation. See Sands, Waters, and McBride (1997), and in ASVAB Technical Bulletin #1 (DMDC, 2006) for the research and development of the CAT-ASVAB. The decision to operationally implement the CAT-ASVAB was based on the administrative and psychometric advantages of CAT-ASVAB over P&P administration. These advantages included reduced testing times, more flexible scheduling, greater standardization of administration procedures, immediate scoring, increased measurement precision, and increased test security (Sands & Waters, 1997). The CAT-ASVAB is now taken by approximately two-thirds of military applicants and administered in all Military Entrance Processing Stations (MEPS) and in a few Mobile Examining Team (MET) sites. All ASVAB tests, regardless of administration mode or purpose, are constructed to the same test content specifications. The ASVAB tests are designed to measure aptitudes in four domains: Verbal (V), Math (M), Science and Technical (T), and Spatial (S). Table 1 describes the content of the ASVAB tests across the testing programs and administration platforms.
1

Table 1.1. CAT-ASVAB Content Summary
Domain Test Description V M T S
General Science (GS) Knowledge of physical and biological sciences
μ
Arithmetic Reasoning (AR) Ability to solve arithmetic word problems μ
Word Knowledge (WK) Ability to select the correct meaning of words presented in context and to identify best synonym for a given word
μ
Paragraph Comprehension (PC) Ability to obtain information from written passages
μ
Math Knowledge (MK) Knowledge of high school mathematics principles
μ
Electronics Information (EI) Knowledge of electricity and electronics μ
Auto Information (AI) a Knowledge of automobile technology and auto shop practices
μ
Shop Information (SI) a Knowledge of tools and shop terminology and practices
μ
Mechanical Comprehension (MC) Knowledge of mechanical and physical principles
μ
Assembling Objects (AO) b Ability to figure out how an object will look when its parts are put together
μ
Note: Domains measured are Verbal (V), Math (M), Science and Technical (T), and Spatial (S). a AI and SI are administered as separate tests in the computer administration but combined into one single score (labeled
AS). AI and SI are combined into one test (AS) in the P&P version. b AO is not administered in the Student Testing Program.
In 1980, a standard score scale was developed using data collected by administering P&P-ASVAB Form 8A to a nationally representative sample of American youth. The Profile of American Youth, 1980 (PAY80) scale was created to have a mean of 50 and a standard deviation of 10 and was in use until the Profile of American Youth, 1997 (PAY97) scale became operational in July 2004. (See the Development and Evaluation of the 1997 ASVAB Score Scale [Segall, 2004] for details of the PAY97 development process.) During the use of the PAY80 scale, ASVAB standard scores were obtained by converting Item Response Theory (IRT) theta estimates to number-correct scores which were then converted to standard scores based on the P&P-ASVAB Form 8A conversion tables. With the introduction of the PAY97 scale, a new procedure for converting IRT ability estimates to standard scores was instituted. See Development and Evaluation of the 1997 ASVAB Score Scale (Segall, 2004). Various service classification composite scores are computed using ASVAB standard scores. (See Appendix B for a list of the composites and the tests that contribute to them.) The service classification composites are used to qualify applicants for specific military occupations. Standard scores from the PC, WK, AR, and MK tests are also used to compute scores on the Armed Forces Qualification Test (AFQT), which is used to determine enlistment eligibility. Specifically, the AFQT is computed as 2(VE) + AR + MK, where VE is a verbal score computed and reported as a weighted composite of WK and PC standard scores. AFQT scores are expressed in a percentile metric.
2

1.2. CAT-ASVAB Forms 1 and 2
Initial implementation of CAT-ASVAB took place at selected test sites in 1992. It was then implemented operationally at all MEPS in 1996–1997, and at a few MET sites in 2000. Prior to CAT-ASVAB Forms 3 and 4, two CAT-ASVAB forms were available for operational administration (referred to as CAT-ASVAB Forms 1 and 2). Table 1.2 summarizes the CAT-ASVAB test lengths and pool sizes for Forms 1 and 2. CAT-ASVAB Forms 1 and 2 were introduced when CAT-ASVAB was first implemented, and CAT-ASVAB Forms 3 and 4 were introduced in 1999. (The procedures used to develop Forms 1 and 2 are discussed in Sands, Waters, and McBride [1997] and in ASVAB Technical Bulletin #1 [DMDC, 2006])).
Table 1.2. CAT-ASVAB Forms 1 and 2 Test Lengths and Form Sizes
Form Size
Test Test Length (in minutes)
Form 1 Form 2
GS 15 72 67 AR 15 94 94 WK 15 95 99 PC 10 50 52 MK 15 84 85 EI 15 61 61 AI 10 53 53 SI 10 51 49 MC 15 64 64
2. Development of CAT-ASVAB Forms 3 and 4
Although the use of CAT-ASVAB, which administers different sets of items to different examinees, significantly improves test security over P&P administration, repeated exposure of CAT item pools over time can also lead to item or test compromise. Generally, Forms 3 and 4 were developed using the same procedures as those used to build Forms 1 and 2 (e.g., Sands, et al., 1997) with a few exceptions. The procedures used to develop CAT-ASVAB Forms 3 and 4 are provided below.
2.1. Item Development and Tryout
Fifty-two hundred new, five-option multiple-choice items were developed in 1987 and 1988 for all the ASVAB tests (except AO ― see below for more about AO) by the Educational Testing Service (ETS) under contract to the Navy Personnel Research and Development Center (NPRDC). As detailed in Massad, Schratz, and Anderson (1988), the items were written according to ETS item-development standards over a 13-month period starting on June 22, 1987.
3
In addition to item authoring, new classification profiles were defined detailing the content domain (i.e., categories and skills) represented in each ASVAB test. For each new item, its classification profile was determined and verified by several reviewers. All the items were entered and stored in a central database (ETS Test Development/Document Creation System) along with their identifying information, classification profiles and reviewers’ comments. Furthermore, prior to collecting empirical data, extensive reviews of the items were conducted for conformance to standard item writing principles and for sensitivity to the concerns of minority groups. In 1993, all the items were reclassified according to ASVAB content taxonomies and considered for inclusion in an item tryout study. Of the 5,200 items written by ETS, 2,590 items were selected into the study on the basis of their taxonomy coverage and estimated range of difficulty. The goal was for the content of the CAT Forms 3 and 4 to match the content of CAT Forms 1 and 2 as closely as possible. A 15-item Assembling Objects (AO) test had been included in the CAT-ASVAB Forms 1 and 2 as a non-adaptive experimental test. It was decided to make AO adaptive starting with CAT Forms 3 and 4. Thirty AO items from earlier Enhanced Computer Administered Testing (ECAT) studies (e.g., Wolfe, 1997) were available for inclusion in the CAT Forms 3 and 4 tryout study. Additionally, 150 new AO items were developed by the Personnel Testing Division (PTD) item writers. As a new CAT-ASVAB test, no AO score scale existed at the time of the tryout study. Including the 180 AO items, the total number of tryout items was 2,770. The selected tryout items underwent a final edit by the PTD staff for accuracy, sensitivity, and format. The tryout study for CAT Forms 3 and 4 was conducted from August through mid-November 1994 at the MEPS and METS. As shown in Table 2.1, tryout items and anchor items were organized into 56 tryout books, each containing 50 or 60 items. Each booklet was designed to take one hour and contained items from two tests, except for three AO booklets that contained only AO items. The tryout items were assigned to the books with no regard to content taxonomies, and as a result, each tryout book was not content-balanced. Nine of the 56 books consisted of anchor items, half of which came from P&P-ASVAB Form 8A and the remaining half from CAT-ASVAB Forms 1 and 2. The 56 tryout books were divided into 9 groups called “series” (shown in the rightmost column of Table 2.1), each containing 3 to 7 tryout booklets. Each series was administered in one of nine matched groups of MEPS and MET sites. 1
1 The five MEPS that were using CAT-ASVAB Forms 1 and 2 at the time of the tryout did not participate in the study. However, the MET sites associated with those MEPS took the T series (AO booklets).
4

Table 2.1. Structure of Books for the CAT-ASVAB Forms 3 and 4 Tryout Study
Tryout Book #
Tests (# of Items) in
Each Tryout Book Total # of Items in
Tryout Books Series
111 Anchor AR (30) Anchor WK (30) 60 H
122, 133, 144, 155, 166, 177
AR (30) WK (30) 60
181 Anchor AR (30) Anchor WK (30) 60 J
192, 203, 214, 225, 236, 247
AR (30) WK (30) 60
251 Anchor MK (30) Anchor AI (30) 60 K
262 ,273, 284, 295, 306, 317
MK (30) AI (30) 60
321 Anchor MK (30) Anchor SI (30) 60 L
332, 343, 354, 365, 376, 387
MK (30) SI (30) 60
391 Anchor MC (30) Anchor EI (30) 60 M
402, 413, 424, 435, 446
MC (30) EI (30) 60
451 Anchor MC (30) Anchor EI (30) 60 N
462, 473, 484, 495, 706
MC (30) EI (30) 60
501 Anchor PC (25) Anchor GS (25) 50 R
512, 523, 534, 545, 556, 567
PC (25) GS (25) 50
571 Anchor PC (25) Anchor GS (25) 50 S
582, 593, 604, 615, 626
PC (25) GS (25) 50
631 AO (30) Previous AO (30) 60 T
642, 653 AO (30) AO (30) 60
5
The groupings of MEPS and MET sites were defined based on analyses of past data so that the groups would be very similar in term of the following seven variables (the time period for the data analyzed is given in the parentheses):
average AFQT percentile score (July 1993–September 1993), average standardized score on Mechanical Comprehension (July 1993–September 1993), number of applicants tested in February 1994 (estimated using the percentage of
applicants tested in February 1993), percentage of female applicants (July 1993–September 1993), percentage of African-American/Black applicants (July 1993–September 1993), percentage of Latino-American/Hispanic applicants (July 1993–September 1993), number of examinees tested (July 1993–September 1993).
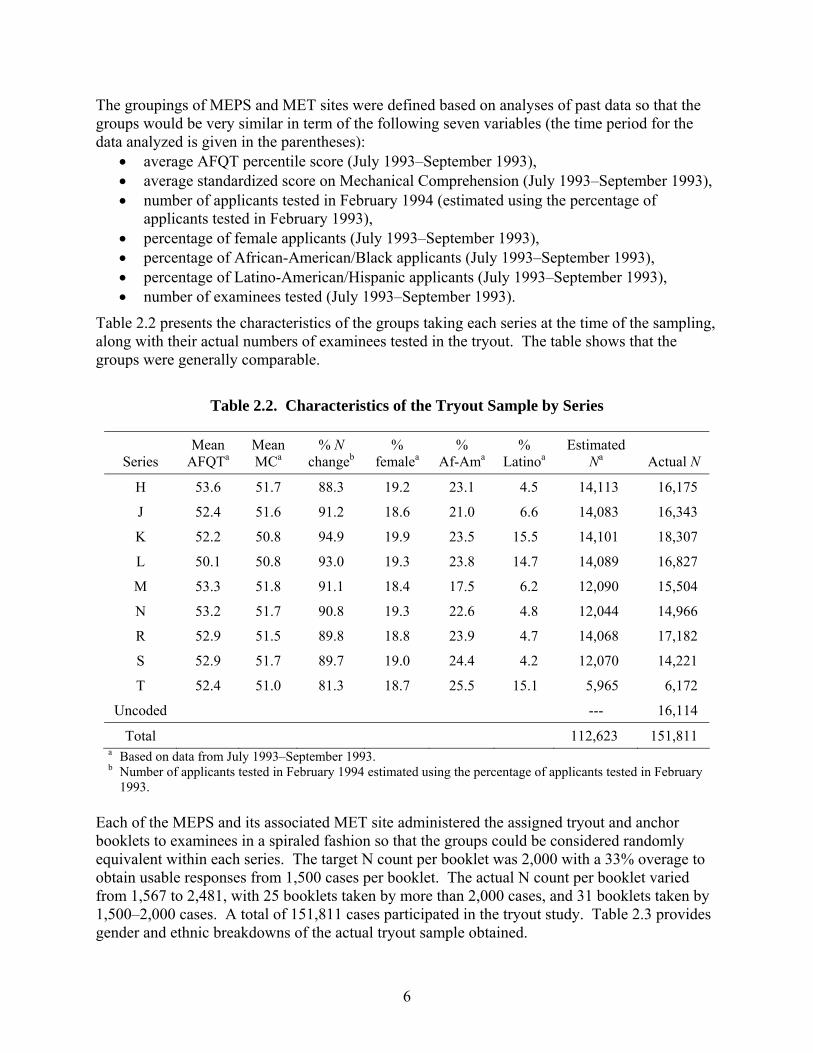
Table 2.2 presents the characteristics of the groups taking each series at the time of the sampling, along with their actual numbers of examinees tested in the tryout. The table shows that the groups were generally comparable.
Table 2.2. Characteristics of the Tryout Sample by Series
Series Mean
AFQTa Mean MCa
% N changeb
% femalea
% Af-Ama
% Latinoa
Estimated Na Actual N
H 53.6 51.7 88.3 19.2 23.1 4.5 14,113 16,175
J 52.4 51.6 91.2 18.6 21.0 6.6 14,083 16,343
K 52.2 50.8 94.9 19.9 23.5 15.5 14,101 18,307
L 50.1 50.8 93.0 19.3 23.8 14.7 14,089 16,827
M 53.3 51.8 91.1 18.4 17.5 6.2 12,090 15,504
N 53.2 51.7 90.8 19.3 22.6 4.8 12,044 14,966
R 52.9 51.5 89.8 18.8 23.9 4.7 14,068 17,182
S 52.9 51.7 89.7 19.0 24.4 4.2 12,070 14,221
T 52.4 51.0 81.3 18.7 25.5 15.1 5,965 6,172
Uncoded --- 16,114
Total 112,623 151,811 a Based on data from July 1993–September 1993. b Number of applicants tested in February 1994 estimated using the percentage of applicants tested in February
1993.
Each of the MEPS and its associated MET site administered the assigned tryout and anchor booklets to examinees in a spiraled fashion so that the groups could be considered randomly equivalent within each series. The target N count per booklet was 2,000 with a 33% overage to obtain usable responses from 1,500 cases per booklet. The actual N count per booklet varied from 1,567 to 2,481, with 25 booklets taken by more than 2,000 cases, and 31 booklets taken by 1,500–2,000 cases. A total of 151,811 cases participated in the tryout study. Table 2.3 provides gender and ethnic breakdowns of the actual tryout sample obtained.
6
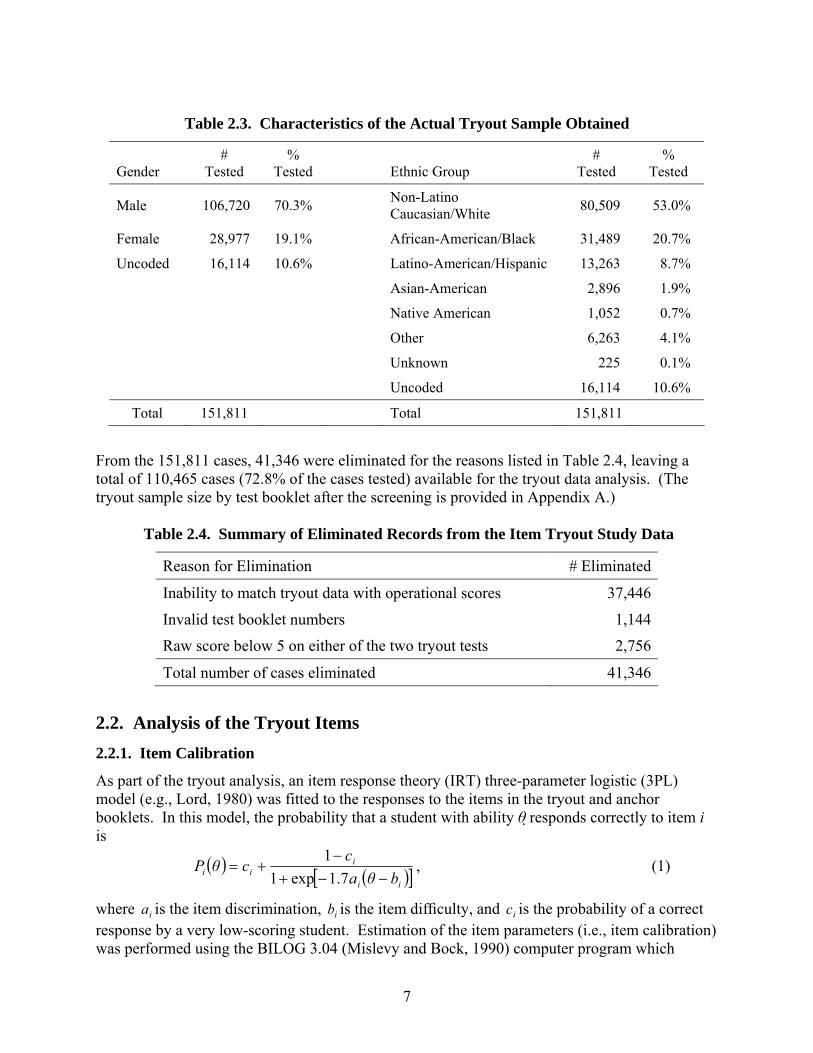
Table 2.3. Characteristics of the Actual Tryout Sample Obtained
Gender #
Tested %
Tested
Ethnic Group #
Tested %
Tested
Male 106,720 70.3% Non-Latino
Caucasian/White 80,509 53.0%
Female 28,977 19.1% African-American/Black 31,489 20.7%
Uncoded 16,114 10.6% Latino-American/Hispanic 13,263 8.7%
Asian-American 2,896 1.9%
Native American 1,052 0.7%
Other 6,263 4.1%
Unknown 225 0.1%
Uncoded 16,114 10.6%
Total 151,811 Total 151,811
From the 151,811 cases, 41,346 were eliminated for the reasons listed in Table 2.4, leaving a total of 110,465 cases (72.8% of the cases tested) available for the tryout data analysis. (The tryout sample size by test booklet after the screening is provided in Appendix A.)
Table 2.4. Summary of Eliminated Records from the Item Tryout Study Data
Reason for Elimination # Eliminated
Inability to match tryout data with operational scores 37,446
Invalid test booklet numbers 1,144
Raw score below 5 on either of the two tryout tests 2,756
Total number of cases eliminated 41,346
2.2. Analysis of the Tryout Items
2.2.1. Item Calibration
As part of the tryout analysis, an item response theory (IRT) three-parameter logistic (3PL) model (e.g., Lord, 1980) was fitted to the responses to the items in the tryout and anchor booklets. In this model, the probability that a student with ability θ responds correctly to item i is
ii
iii bθa
ccθP
1.7exp1
1, (1)
where is the item discrimination, is the item difficulty, and is the probability of a correct response by a very low-scoring student. Estimation of the item parameters (i.e., item calibration)
ia ib ic
was performed using the BILOG 3.04 (Mislevy and Bock, 1990) computer program which
7
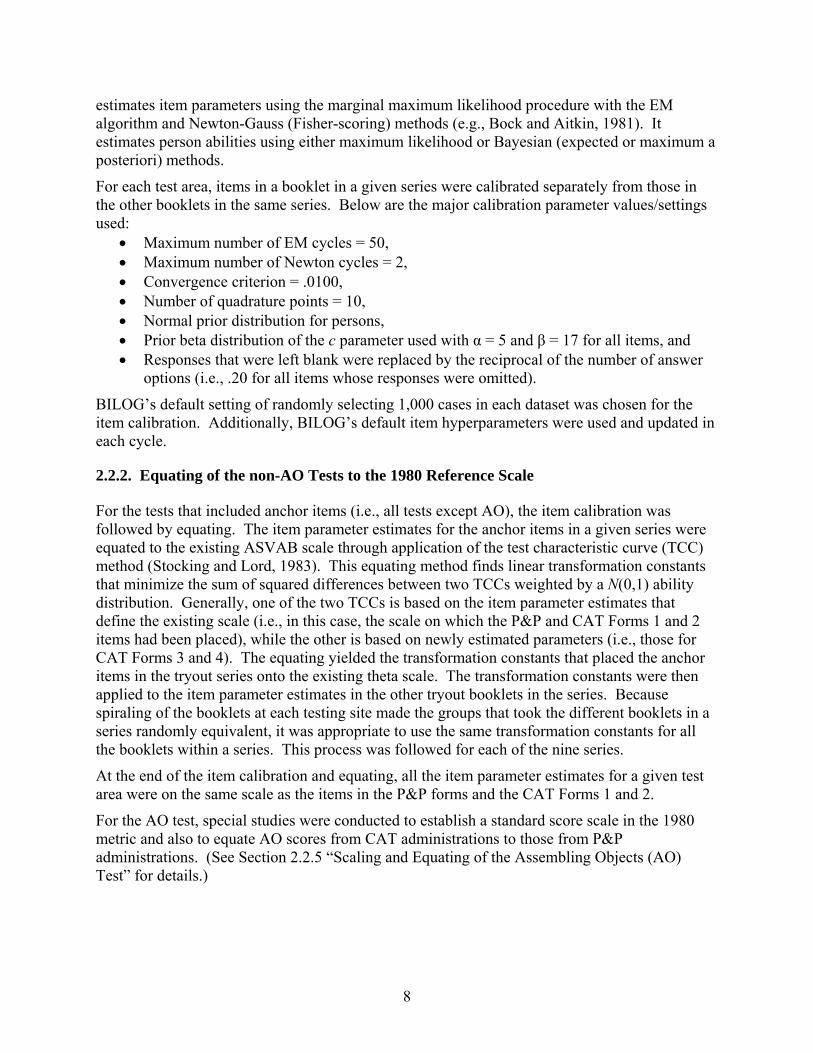
estimates item parameters using the marginal maximum likelihood procedure with the EM algorithm and Newton-Gauss (Fisher-scoring) methods (e.g., Bock and Aitkin, 1981). It estimates person abilities using either maximum likelihood or Bayesian (expected or maxiposteriori) methods.
For each test area, ite
mum a
ms in a booklet in a given series were calibrated separately from those in
Maximum number of EM cycles = 50, 2,
0, s,
er used with α = 5 and β = 17 for all items, and r
aset was chosen for the in
2.2.2. Equating of the non-AO Tests to the 1980 Reference Scale
For the tests that included anchor items (i.e., all tests except AO), the item calibration was ere
2
s in a
a given test
1980
ts (AO)
the other booklets in the same series. Below are the major calibration parameter values/settingsused:
Maximum number of Newton cycles = Convergence criterion = .0100, Number of quadrature points = 1 Normal prior distribution for person Prior beta distribution of the c paramet Responses that were left blank were replaced by the reciprocal of the number of answe
options (i.e., .20 for all items whose responses were omitted).
BILOG’s default setting of randomly selecting 1,000 cases in each datitem calibration. Additionally, BILOG’s default item hyperparameters were used and updated each cycle.
followed by equating. The item parameter estimates for the anchor items in a given series wequated to the existing ASVAB scale through application of the test characteristic curve (TCC) method (Stocking and Lord, 1983). This equating method finds linear transformation constants that minimize the sum of squared differences between two TCCs weighted by a N(0,1) ability distribution. Generally, one of the two TCCs is based on the item parameter estimates that define the existing scale (i.e., in this case, the scale on which the P&P and CAT Forms 1 anditems had been placed), while the other is based on newly estimated parameters (i.e., those for CAT Forms 3 and 4). The equating yielded the transformation constants that placed the anchoritems in the tryout series onto the existing theta scale. The transformation constants were then applied to the item parameter estimates in the other tryout booklets in the series. Because spiraling of the booklets at each testing site made the groups that took the different bookletseries randomly equivalent, it was appropriate to use the same transformation constants for all the booklets within a series. This process was followed for each of the nine series.
At the end of the item calibration and equating, all the item parameter estimates for area were on the same scale as the items in the P&P forms and the CAT Forms 1 and 2.
For the AO test, special studies were conducted to establish a standard score scale in the metric and also to equate AO scores from CAT administrations to those from P&P administrations. (See Section 2.2.5 “Scaling and Equating of the Assembling ObjecTest” for details.)
8

2.2.3. Analysis of Differential Item Functioning
In addition to the IRT item calibration and equating, the tryout items were examined for statistical bias or differential item functioning (DIF) for gender and ethnic/racial subgroups. An item is deemed to have DIF if it displays differential statistical properties (e.g., item difficulty) for different subgroups when the subgroups are matched on ability (e.g., total test scores). The tryout items were examined for DIF using the Mantel-Haenszel method (Mantel and Haenszel,
1959). As a measure of the amount of DIF, the procedure computes the delta statistic
(Holland and Thayer, 1988) for the studied item. is related to the Mantel-Haenszel
common odds-ratio estimate,
MH
MH , as follows:
(2) .)ˆ(nl35.2ˆMHMH
is the ratio of the probability of a focal group member responding correctly to the probability of a reference group member answering correctly when both group members have the same overall ability on the trait of interest. Typically, overall ability is measured by total test score. The statistic is asymmetrically distributed from 0 to with 1.0 as a “no DIF” value, where < 1.0 indicates that the item favored the focal group and > 1.0 indicates that the item
favored the reference group. The logarithmic transformation yields a statistic (i.e., ) that is
symmetric around 0 (no DIF) and easier to interpret. Negative values of MH indicate that members of a focal group found the studied item more difficult than did comparable members of a reference group. In the gender DIF analysis, “male” was treated as the reference group for the “female” focal group. In the ethnic DIF analyses, “Caucasian/White” was regarded to be the reference group for the African-American/Black or Latino-American/Hispanic focal group.
Items with MH > |3.00| for any of the focal groups were deleted from the tryout pool as items that would potentially disadvantage their members.
MH
ˆ
2.2.4. Final Tryout Pools
Table 2.5 summarizes for each test (excluding AO) the number of items that were removed from the tryout pool for non-convergence during the BILOG item calibrations and for DIF, the number of items that remained in the pool, and the percentage of items that were retained. After the analyses, a total of 2,420 tryout items, as well as 178 AO items, were available for the assembly of CAT-ASVAB Forms 3 and 4.
9

Table 2.5. Size of the Final Tryout Pools
Tests
# Items Tried Out
Removed due to Non-Convergence
Removed due to DIF
# Items in Final Tryout Pool
% Retained
GS 275 10 0 265 96
AR 360 12 1 347 96
WK 360 8 8 344 96
PC 275 2 1 272 99
MK 360 19 0 341 95
EI 300 35 1 264 88
AI 180 10 0 170 94
SI 180 22 4 154 86
MC 300 36 1 263 88
AOa 180 178 99
Total 2,770 154 16 2,598 a Reasons for the removal of two AO items have not been documented.
2.2.5. Scaling and Equating of the Assembling Objects (AO) Test
Before AO could be used operationally for classification decisions (and combined into a composite with other tests) some method of converting raw scores to a standard score scale was required. Using the convention applied to other tests, the desired scale would be one in which the AO test standard score would have mean 50 and SD 10 in the 1980 youth population. However, AO was not administered in the PAY 80 data collection study. In order to estimate what the AO mean and standard deviation would have been if it had been administered as part of the study, the Lawley formulas (e.g., Lord and Novick, 1968, p. 147) were used. In this analysis, all tests (except AO) were treated as explicit selection variables, with AO treated as the incidental selection variable. Two covariance matrices were computed for the explicit variables, one from the PAY 80 population and another from a large group of military applicants. For the latter group, the correlations between all the tests and AO were also computed. From these data and the application of the Lawley formulas, the PAY 80 AO mean and standard deviation were calculated for AO raw (IRT) scores. The estimated AO moments resulting from the Lawley formulas were then used to develop a linear transformation that would be expected to provide AO standard scores with mean 50 and SD 10 in the PAY 80 population. This scaling was used from January 2002 to July 2004. In July of 2004, a new AO scaling was implemented based on data collected in the PAY 97 study (Segall, 2004). In this study, AO was administered along with all the other tests, so it’s mean and SD could be estimated directly from the collected data without the need for the Lawley correction formulas.
10

2.2.6. Factor Structure of General Science (GS) and Assembling Objects (AO)
The 3PL model used for the development of all CAT-ASVAB pools belongs in a class of unidimensional IRT models. These models assume a single latent trait underlying examinee performance. Because serious violation of the unidimensional assumption could induce bias in IRT parameter estimates, it is a good practice to examine the dimensionality or factor structure of a test prior to applying a unidimensional IRT model. Using the tryout data, the factor structures of the tests were examined using the TESTFACT program (Wilson, Wood, and Gibbons, 1991). The program implements Bock and Aitkin’s (1981) full information item factor analysis with the marginal maximum likelihood method to estimate item parameters for multidimensional item response models. The factor structures of the ASVAB tests other than GS and AO were found to be similar to previous results reported for CAT Forms 1 and 2. (Refer to Segall, Moreno, and Hetter [1997] for the prior factor analytic results.) The new results for GS, which differed from the previous results, are summarized below. The results for AO, whose dimensionality had never been evaluated, are also described below. The prior factor analyses of the GS test (Segall and Moreno, 1986; Segall et al., 1997; Zimowski and Bock, 1987) identified four dimensions: Life/Biological Science, Physical Science/ Earth/Space Science, Chemistry, and Nonacademic Items. Items loading on the nonacademic factor were easy items that were taught through everyday experiences rather than through classroom instruction or specialized experience. The content-related factors roughly corresponded to the intended content domains. Chemistry likely appeared as a separate factor because it was a component to many items that were coded as Botany (e.g., photosynthesis), Atomic Structure (when they referred to the periodic table), and Ecology.
2.2.6.1. Factor Structure of General Science (GS) Booklets
As shown in Table 2.6, the GS tryout and anchor items were assembled into 13 booklets of 25 items each. Prior to initial TESTFACT runs, items that were linear combinations of other items (i.e., collinear), or had very low biserial correlations, were removed from the data to maximize interpretability of factor analytic results. The problem of collinearity would have led to high communalities (over .95) and made covariance matrices almost singular (unsolvable). Items with very low biserial correlations (< .2) typically emerge as single factors and obscure the presence of other factors. For similar reasons, very difficult items (p < .2) were also removed if they also had low point biserial correlations. Table 2.6 presents the numbers of items left in each booklet after the screening, along with the number of examinees per booklet. (The number of examinees used in the GS factor analyses differs from those given in Appendix A because the latter included the cases that took PC but not GS.)
11

Table 2.6. Numbers of Items and Numbers of Examinees
Included in GS Factor Analyses
Booklet # # of items # of examinees
Series R
501 (anchor) 24 1,885
512 22 1,816
523 20 1,767
534 21 1,706
545 23 1,655
556 22 1,628
567 22 1,582
Series S
571 (anchor) 23 2,022
582 21 1,936
593 23 1,876
604 22 1,808
615 21 1,779
626 18 1,754
The stepwise factor analysis feature of TESTFACT was used to choose an optimal number of factors for each booklet. The stepwise procedure starts with one factor and calculates the improvement gained by adding a new factor using a chi-square approximation to the likelihood ratio of a normal ogive IRT model with a given number of factors to the general multinomial model. An optimal number of factors is reached when the chi-square statistic shows insignificant improvement at the .05 level. Since the previous CAT-ASVAB research had shown four factors for GS, in addition to the above default stepwise procedure to estimate the number of factors, another procedure was tried by starting with four factors and examining if adding the fifth factor would significantly improve the model fit. Table 2.7 presents the number of factors identified in each analysis for each GS booklet.
12
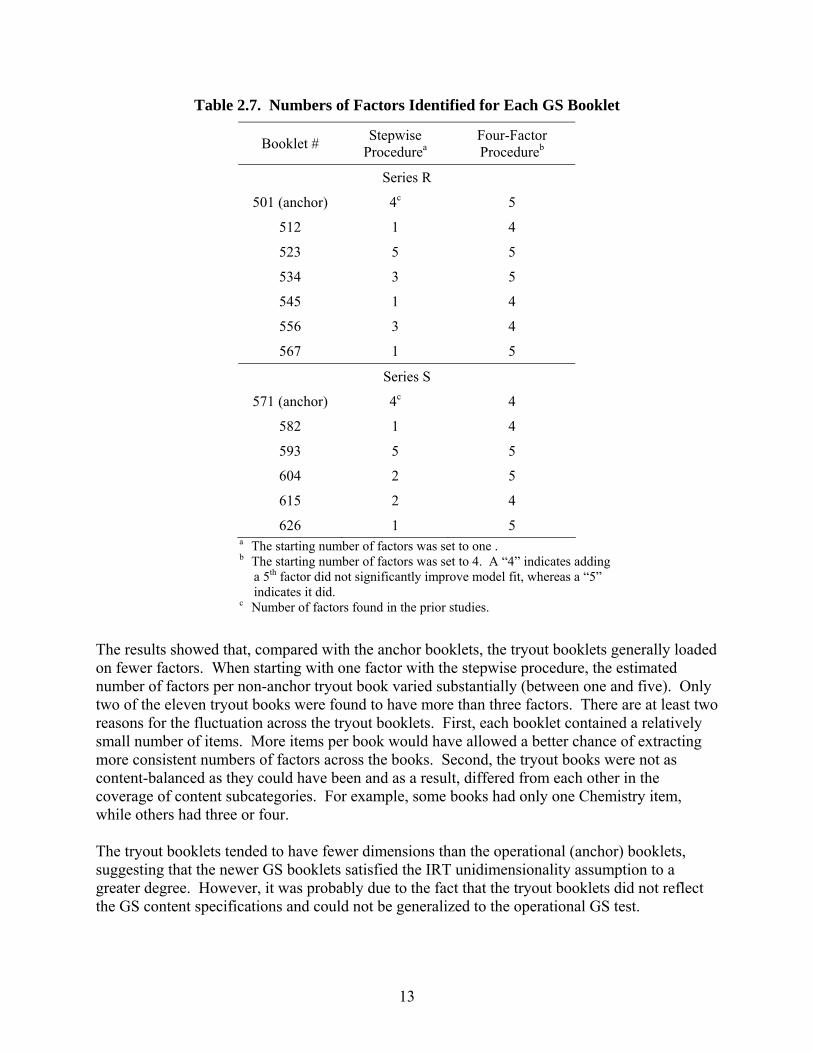
Table 2.7. Numbers of Factors Identified for Each GS Booklet
Booklet # Stepwise
Procedurea Four-Factor Procedureb
Series R
501 (anchor) 4c 5
512 1 4
523 5 5
534 3 5
545 1 4
556 3 4
567 1 5
Series S
571 (anchor) 4c 4
582 1 4
593 5 5
604 2 5
615 2 4
626 1 5 a The starting number of factors was set to one . b The starting number of factors was set to 4. A “4” indicates adding
a 5th factor did not significantly improve model fit, whereas a “5” indicates it did.
c Number of factors found in the prior studies.
The results showed that, compared with the anchor booklets, the tryout booklets generally loaded on fewer factors. When starting with one factor with the stepwise procedure, the estimated number of factors per non-anchor tryout book varied substantially (between one and five). Only two of the eleven tryout books were found to have more than three factors. There are at least two reasons for the fluctuation across the tryout booklets. First, each booklet contained a relatively small number of items. More items per book would have allowed a better chance of extracting more consistent numbers of factors across the books. Second, the tryout books were not as content-balanced as they could have been and as a result, differed from each other in the coverage of content subcategories. For example, some books had only one Chemistry item, while others had three or four. The tryout booklets tended to have fewer dimensions than the operational (anchor) booklets, suggesting that the newer GS booklets satisfied the IRT unidimensionality assumption to a greater degree. However, it was probably due to the fact that the tryout booklets did not reflect the GS content specifications and could not be generalized to the operational GS test.
13

2.2.6.2. Factor Structure of Assembling Objects (AO) Booklets
Each of the three 60-item AO booklets administered in Series T of the tryout (Table 2.8) was factor-analyzed separately by employing the default stepwise procedure. AO has two item types: Connection and Puzzle. In each book, items 1–15 and 31–45 were Connection items, and the remaining items (16–30 and 46–60) were Puzzle items. For all booklets, the resulting factor structure clearly corresponded to the two item types, with Connection items loading on a first factor and Puzzle items loading on a second factor. The factor analysis results provided strong evidence that AO was measuring two distinct constructs and was therefore multidimensional. These factor analytic results indicate the need for a continuous close watch on the GS and AO tests for the potential violation of the IRT unidimensional assumption.
2.2.7. Gender Differences in Assembling Objects (AO)
Gender bias is a concern for visual-spatial tests, like AO, that tend to exhibit differential performance between the gender groups. A test with significant gender differences should be examined for potential discrimination against the group with lower average performance. Thus, performance on the AO items was evaluated for gender differences using the tryout data. Mean number-right scores by test booklet, gender, and item type are provided in Table 2.8.
Table 2.8. Mean Number-Right Scores by Gender and Subcategories for AO
Booklet
Gender
N
Connection
Puzzle
Total
Diff:
(P – C)
631 Female 420 20.96 24.25 45.21
Male 1,430 21.13 24.11 45.24
Total 1,850 21.09 24.14 45.24 3.05**
Diff: (F – M) -0.17 0.13 -0.03
642 Female 380 19.24 23.61 42.85
Male 1,386 19.72 23.53 43.25
Total 1,766 19.62 23.55 43.17 3.93**
Diff: (F – M) -0.48 0.08 -0.40
653 Female 385 17.64 18.38 36.02
Male 1,320 18.57 18.96 37.53
Total 1,705 18.36 18.83 37.19 0.47
Diff: (F – M) -0.93* -0.58 -1.51*
* p < .05 (two-tailed); ** p < .01 (two-tailed)
14

As shown by the positive differences in the “Diff: (P – C)” column, Connection items were consistently more difficult than Puzzle items across the test booklets. Also consistently across the booklets, both the AO test as a whole and the Connection category favored males over females, as indicated by consistently negative differences for “Diff: (F – M)” in the “Total” and “Connection” columns. However, only two of the six gender differences were statistically significant. When compared with the (F – M) differences for the Connection category, the (F – M) differences for the Puzzle category were smaller and exhibited no consistency across the booklets, suggesting that the Puzzle items were more gender neutral than the Connection items.
Additionally, gender differences were examined in terms of item difficulties (i.e., p-values or proportions of correct responses). Table 2.9 provides mean p-values weighted by the frequency of examinees used in the calculation of the item p-value. Across the three books, the overall mean gender difference in weighted p-values was –.0107, slightly favoring males. The p-value comparisons exhibited patterns that were very similar to those observed with the mean test scores in Table 2.9; the Connection category was consistently more difficult than the Puzzle category across the three booklets, Connection items showed a consistent advantage for males over females, and gender differences for Puzzle items were not consistent across the booklets, tending to be considerably smaller than those for Connection items. These findings suggest that potential gender bias continues to be a concern for AO and needs to be monitored on a regular basis.
Table 2.9. Weighted Mean P-values by Gender and Subcategories for AO
Booklet Gender Connection Puzzle Total
631 Female .7066 .8168 .7614
Male .7113 .8116 .7615
Total .7103 .8127 .7615
Diff: (F – M) –.0047 .0046 –.0001
642 Female .6502 .7943 .7222
Male .6656 .7939 .7297
Total .6623 .7941 .7282
Diff: (F – M) –.0154 .0004 –.0075
653 Female .5966 .6247 .6107
Male .6272 .6430 .6351
Total .6203 .6390 .6296
Diff: (F – M) –.0305 –.0182 –.0244
Overall mean
diff. (F – M)
–.0107
15

2.3. Assembly of CAT-ASVAB Forms 3 and 4
Generally, the development of CAT-ASVAB Forms 3 and 4 paralleled that of CAT-ASVAB Forms 1 and 2, which is documented in Sands, et al. (1997) and in ASVAB Technical Bulletin #1 (DMDC, 2006). However, several modifications were made to the form assembly and exposure control procedures that were used to create CAT-ASVAB Forms 1 and 2. For example, content taxonomy, which was an important factor in the CAT-ASVAB Forms 3 and 4 assembly, was not considered in the CAT Forms 1 and 2 assembly except for GS and AS (i.e., Auto and Shop Information). The Forms 3 and 4 assembly used no weighting in computing differences in item information functions during the matching process (see below for more details). Additionally, different maximum possible exposure control values (e.g., Hetter and Sympson, 1997) were used for the Forms 3 and 4 assembly than those for Forms 1 and 2. Furthermore, the tryout items for Forms 3 and 4 were calibrated using BILOG 3.04 (1990), while ASCAL (Vale and Gialluca, 1985) was used for the item parameter estimation of Forms 1 and 2. The form assembly consisted of two phases:
Phase 1. Assignment of the items that survived the tryout analysis to two primary forms on the basis of content taxonomy and information functions, and Phase 2. Evaluation of the quality of the primary forms through simulation, followed by selection of the final CAT Forms 3 and 4.
Each of the phases is described below.
2.3.1. Phase 1: Item Assignment to two Primary Forms
Two new primary CAT-ASVAB forms were assembled to achieve the following three goals: 1. The forms should have similar measurement precision, 2. The forms should have similar content coverage, and 3. The forms should contain items with high measurement precision over a wide range of ability, but especially over regions of ability where most examinees are located.
First, for each of the items in the final tryout pool, its information function was computed using its item parameter estimates for a theta range from -2.25 to +2.25. The item information function for the 3PL model and for item i is:
,)(
)(2'
ii
ii QP
PI (3)
where
,1
)('
i
iiiii c
cPQaDP
(4)
and Pi is the probability of answering the item correctly, and Qi = 1 - Pi. Second, a weighted information statistic (wis) was calculated for the item as the sum of information weighted by a N(0,1) density function ranging from -2.25 to +2.25. Each of the items also had a taxonomic code assigned to it. Next, for each test, all the items in the final tryout pool were sorted in descending order of their wis values. All items with the same taxonomic code as the item at the top of the sorted wis list were then identified, and the item that yielded the smallest unweighted sum of squared differences in item information functions was
16

identified and matched with the top item. One of the two items was then assigned to one of the two forms, while the other item was assigned to the other form. This matching/assigning process was repeated without replacement while alternating between the two forms until as many items in the same taxonomic category as possible were assigned to the forms. The items that were left were matched to form pairs in terms of information alone (i.e., with no regard to content taxonomy) and alternately assigned to the forms. When all items in one taxonomic category in a given test were assigned to the forms, items in the remaining taxonomic categories were handled using the same procedure.
2.3.2. Phase 2: Evaluation of the Primary Forms and Construction of the Final CAT-ASVAB Forms 3 and 4
To assess whether the primary CAT-ASVAB forms that were developed in Phase 1 could support satisfactory CAT-ASVAB administrations, computer simulations were conducted. The quality of the primary forms was evaluated by comparing score information functions across CAT and P&P administrations. Score information functions can be readily computed for P&P test forms using number-right scores because all examinees take the same fixed items. Computer simulations are required to compute score information functions for CAT tests because the items taken vary from examinee to examinee. P&P-ASVAB Forms 8A and 9A were selected as reference forms, providing targets for score information to be met by the new CAT-ASVAB forms. The simulations were conducted for 10,000 examinees at each of 61 thetas from -3.0 to +3.0 and with an information table with 37 theta levels from -2.25 to +2.25 in 0.125 increments. Provisional thetas were estimated using the sequential Bayes procedure (Owen, 1975), while the final thetas were estimated using the Bayes modal method. They also implemented the Sympson-Hetter item exposure control procedure (1985) with the target maximum item exposure set to 1/3 for tests comprising the AFQT score (PC, WK, AR, MK) and 2/3 for the remaining tests. The simulations revealed that the primary CAT-ASVAB Forms 3 and 4 typically had more information (i.e., less measurement error) than the P&P-ASVAB Form 8A but less information than the CAT-ASVAB Forms 1 and 2. They also tended to have less information than the P&P-ASVAB Form 9A near the middle of the theta range, especially for the WK, AR, GS, and EI tests. The findings suggested the need to supplement the primary CAT-ASVAB Forms 3 and 4 with additional items for all tests but PC and AO.2 Thus, the primary CAT Forms 3 and 4 were augmented for some tests using items in the pool for the assembly of P&P Forms 25 and 263 . Augmenting the primary forms with P&P items posed no comparability issues because all the P&P items and those in CAT Forms 1–4 were on the same ASVAB scale. New simulations were performed using the Supplemented CAT-ASVAB Forms 3 and 4 to verify that they would be able to support CAT administrations in a satisfactory manner. The new
2 Items never administered in the simulation (which is a side effect of using a maximum information item selection procedure) were dropped from the tryout pool. 3 The items used to augment CAT Forms 3 and 4 had previously undergone a similar sort of processing (i.e., field-testing, calibration and scaling, and statistical evaluations) as discussed here. They were viable candidates for inclusion on P&P Forms 25 and 26 that were not selected in the form assembly process.
17

simulations were conducted under the same conditions as the first simulations, except for a modification to the item exposure control procedure. The original Sympson-Hetter procedure was modified to fix the maximum exposure control indices at 0.70 for the PC, WK, AR, MK tests and 0.85 for the other tests.4 The information functions from the new simulations showed that like the CAT-ASVAB Forms 1 and 2, the Supplemented CAT-ASVAB Forms 3 and 4 generally had higher information than the reference forms of P&P-ASVAB Forms 8A and 9A throughout the theta range. Thus, the Supplemented CAT-ASVAB Forms 3 and 4 were retained as the final forms. Table 2.10 presents the final numbers of items and their source for the Supplemented CAT Forms 3 and 4. The number of 1994 tryout items that were retained, 1,115, was approximately 40% of the entire tryout pool of 2,770 items. This retention percentage is consistent with a typical usage rate observed in CAT testing using maximum likelihood item selection and Sympson-Hetter exposure control procedures.
Table 2.10. Pool Sizes and Sources for the Final CAT-ASVAB Forms 3 and 4
Source Final CAT-ASVAB Forms 3 and 4
Test 1994
Tryout Items from
P&P
Form 3 Form 4 Total
GS 69 199 135 133 268
AR 177 96 137 136 273
WK 146 128 137 137 274
PC 138 0 68 70 138
MK 139 119 126 132 258
EI 114 70 92 92 184
AI 80 70 77 73 150
SI 66 80 73 73 146
MC 98 112 106 104 210
AO 178 0 89 89 178
Total 1,115 964 1,040 1,039 2,079
4 The operational maximum exposure control value was subsequently set to .70 for all tests for CAT Forms 3 and 4.
18
2.4. Comparability Study: New Test Administration Order and Construct Equivalence Between CAT Forms 1 and 2 and Forms 3 and 4
2.4.1. Study Description
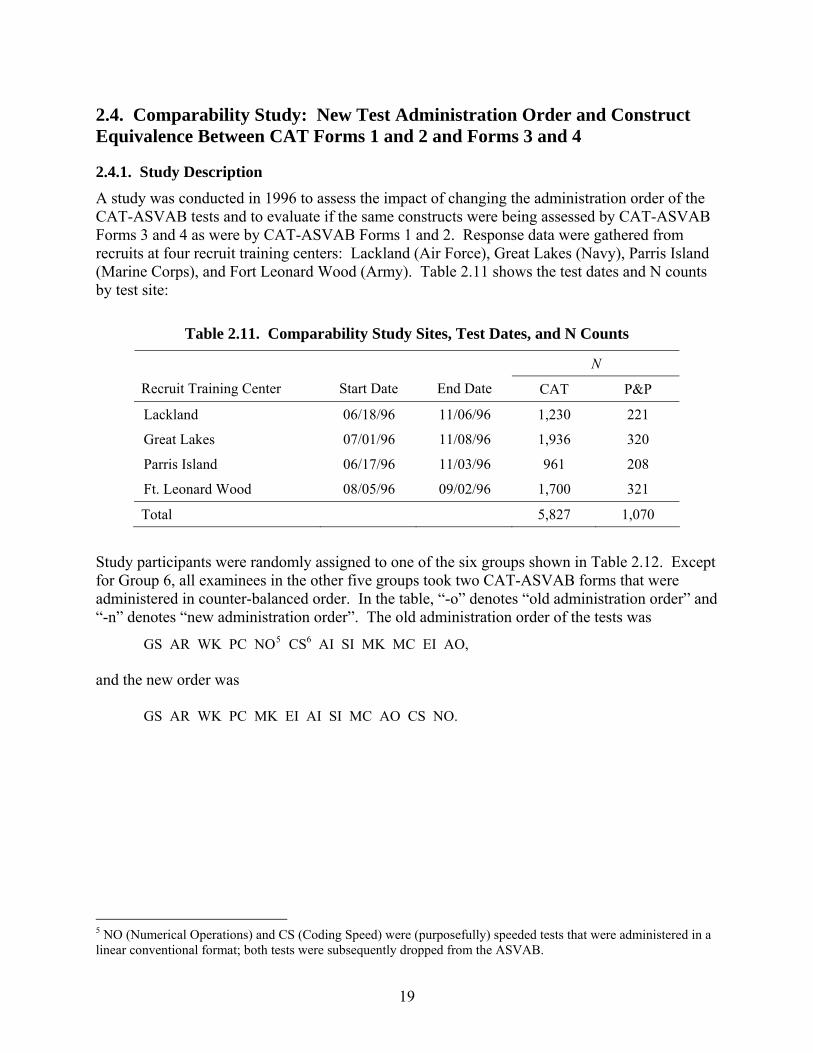
A study was conducted in 1996 to assess the impact of changing the administration order of the CAT-ASVAB tests and to evaluate if the same constructs were being assessed by CAT-ASVAB Forms 3 and 4 as were by CAT-ASVAB Forms 1 and 2. Response data were gathered from recruits at four recruit training centers: Lackland (Air Force), Great Lakes (Navy), Parris Island (Marine Corps), and Fort Leonard Wood (Army). Table 2.11 shows the test dates and N counts by test site:
Table 2.11. Comparability Study Sites, Test Dates, and N Counts
N
Recruit Training Center Start Date End Date CAT P&P
Lackland 06/18/96 11/06/96 1,230 221
Great Lakes 07/01/96 11/08/96 1,936 320
Parris Island 06/17/96 11/03/96 961 208
Ft. Leonard Wood 08/05/96 09/02/96 1,700 321
Total 5,827 1,070
Study participants were randomly assigned to one of the six groups shown in Table 2.12. Except for Group 6, all examinees in the other five groups took two CAT-ASVAB forms that were administered in counter-balanced order. In the table, “-o” denotes “old administration order” and “-n” denotes “new administration order”. The old administration order of the tests was
GS AR WK PC NO5 CS6 AI SI MK MC EI AO,
and the new order was
GS AR WK PC MK EI AI SI MC AO CS NO.
5 NO (Numerical Operations) and CS (Coding Speed) were (purposefully) speeded tests that were administered in a linear conventional format; both tests were subsequently dropped from the ASVAB.
19
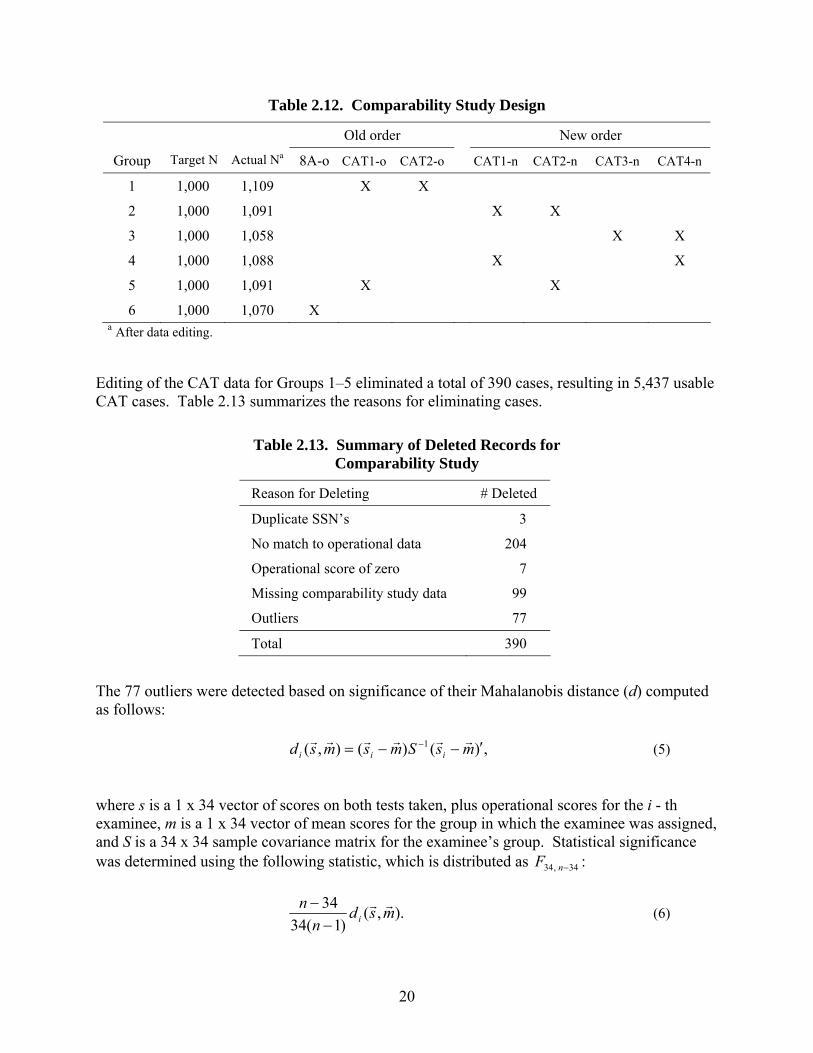
Table 2.12. Comparability Study Design
Old order New order
Group Target N Actual Na 8A-o CAT1-o CAT2-o CAT1-n CAT2-n CAT3-n CAT4-n
1 1,000 1,109 X X
2 1,000 1,091 X X
3 1,000 1,058 X X
4 1,000 1,088 X X
5 1,000 1,091 X X
6 1,000 1,070 X a After data editing.
Editing of the CAT data for Groups 1–5 eliminated a total of 390 cases, resulting in 5,437 usable CAT cases. Table 2.13 summarizes the reasons for eliminating cases.
Table 2.13. Summary of Deleted Records for Comparability Study
Reason for Deleting # Deleted
Duplicate SSN’s 3
No match to operational data 204
Operational score of zero 7
Missing comparability study data 99
Outliers 77
Total 390
The 77 outliers were detected based on significance of their Mahalanobis distance (d) computed as follows: ,)()(),( 1 msSmsmsd iii
(5)
where s is a 1 x 34 vector of scores on both tests taken, plus operational scores for the i - th examinee, m is a 1 x 34 vector of mean scores for the group in which the examinee was assigned, and S is a 34 x 34 sample covariance matrix for the examinee’s group. Statistical significance was determined using the following statistic, which is distributed as :34,34 nF
).,()1(34
34msd
n
ni
(6)
20

2.4.2. Examination of Group Equivalence
After the data screening, equivalence of frequencies across CAT groups 1–5 was examined by site, gender, and ethnicity/race, using three significant tests: Pearson chi-square, likelihood-ratio (LR) chi-square, and Mantel-Haenszel (MH) chi-square for linear association. The results, presented in Tables 2.14–2.16, demonstrate group equivalence with regard to all three variables.
Table 2.14. Comparability Study CAT Group Equivalence by Site
CAT Group
Site 1 2 3 4 5
Ft. Wood 330 323 320 325 322
Great Lakes 382 370 356 361 381
Parris Island 173 175 167 176 166
Lackland 224 223 215 226 222
Total 1,109 1,091 1,058 1,088 1,091
Significance tests
Statistic df Value Prob.
Chi-square 12 1.207 1.000
LR chi-square 12 1.208 1.000
MH chi-square 1 0.136 0.713
Table 2.15. Comparability Study CAT Group Equivalence byGender
CAT Group Male Female Total % female
1 882 227 1,109 22%
2 852 239 1,091 23%
3 833 225 1,058 22%
4 841 247 1,088 21%
5 852 239 1,091 21%
Total 4,260 1,177 5,437 22%
Significance tests
Statistic df Value Prob.
Chi-square 4 1.799 0.773
LR chi-square 4 1.803 0.772
MH chi-square 1 0.799 0.371
21
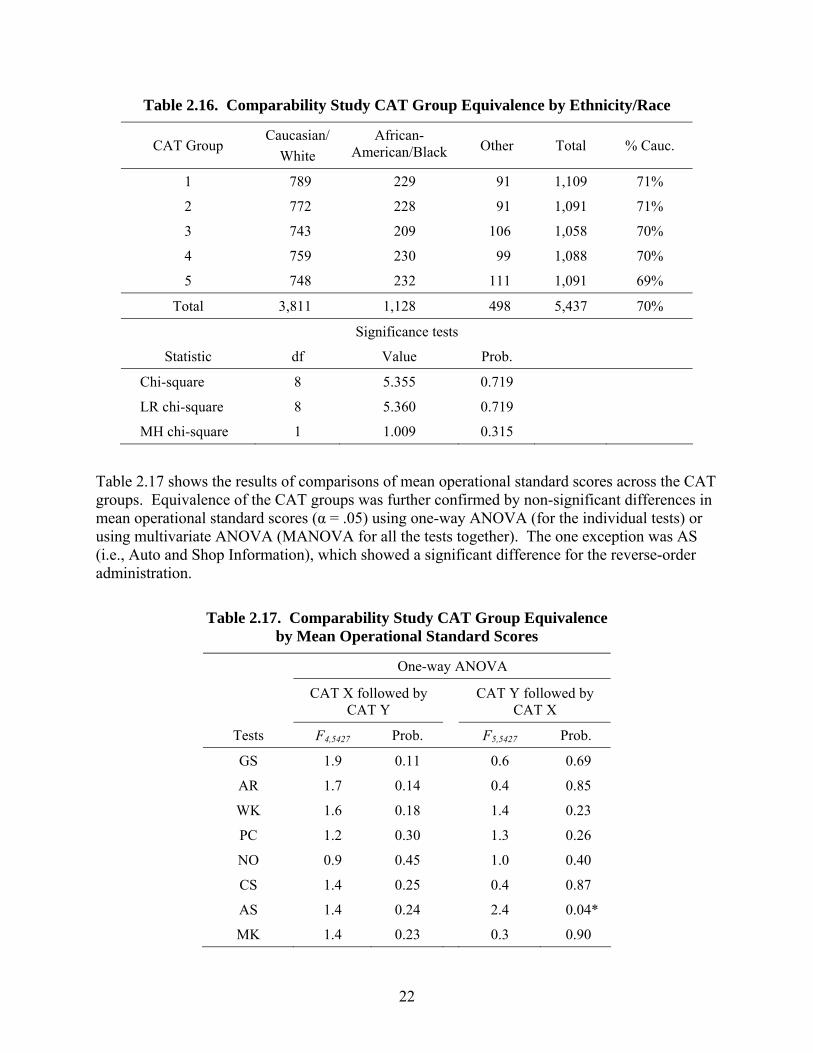
Table 2.16. Comparability Study CAT Group Equivalence by Ethnicity/Race
CAT Group Caucasian/
White
African-American/Black Other Total % Cauc.
1 789 229 91 1,109 71%
2 772 228 91 1,091 71%
3 743 209 106 1,058 70%
4 759 230 99 1,088 70%
5 748 232 111 1,091 69%
Total 3,811 1,128 498 5,437 70%
Significance tests
Statistic df Value Prob.
Chi-square 8 5.355 0.719
LR chi-square 8 5.360 0.719
MH chi-square 1 1.009 0.315
Table 2.17 shows the results of comparisons of mean operational standard scores across the CAT groups. Equivalence of the CAT groups was further confirmed by non-significant differences in mean operational standard scores (α = .05) using one-way ANOVA (for the individual tests) or using multivariate ANOVA (MANOVA for all the tests together). The one exception was AS (i.e., Auto and Shop Information), which showed a significant difference for the reverse-order administration.
Table 2.17. Comparability Study CAT Group Equivalence by Mean Operational Standard Scores
One-way ANOVA
CAT X followed by CAT Y
CAT Y followed by CAT X
Tests F4,5427 Prob. F5,5427 Prob.
GS 1.9 0.11 0.6 0.69
AR 1.7 0.14 0.4 0.85
WK 1.6 0.18 1.4 0.23
PC 1.2 0.30 1.3 0.26
NO 0.9 0.45 1.0 0.40
CS 1.4 0.25 0.4 0.87
AS 1.4 0.24 2.4 0.04*
MK 1.4 0.23 0.3 0.90
22
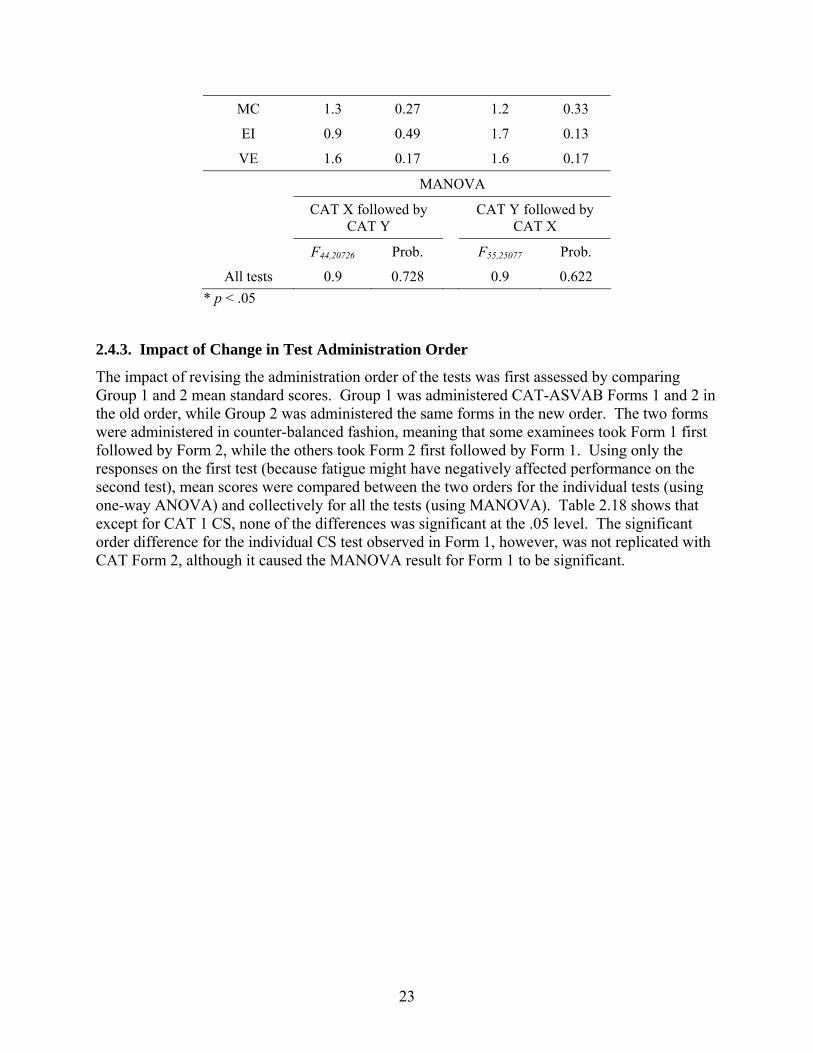
MC 1.3 0.27 1.2 0.33
EI 0.9 0.49 1.7 0.13
VE 1.6 0.17 1.6 0.17
MANOVA
CAT X followed by CAT Y
CAT Y followed by CAT X
F44,20726 Prob. F55,25077 Prob.
All tests 0.9 0.728 0.9 0.622
* p < .05
2.4.3. Impact of Change in Test Administration Order
The impact of revising the administration order of the tests was first assessed by comparing Group 1 and 2 mean standard scores. Group 1 was administered CAT-ASVAB Forms 1 and 2 in the old order, while Group 2 was administered the same forms in the new order. The two forms were administered in counter-balanced fashion, meaning that some examinees took Form 1 first followed by Form 2, while the others took Form 2 first followed by Form 1. Using only the responses on the first test (because fatigue might have negatively affected performance on the second test), mean scores were compared between the two orders for the individual tests (using one-way ANOVA) and collectively for all the tests (using MANOVA). Table 2.18 shows that except for CAT 1 CS, none of the differences was significant at the .05 level. The significant order difference for the individual CS test observed in Form 1, however, was not replicated with CAT Form 2, although it caused the MANOVA result for Form 1 to be significant.
23
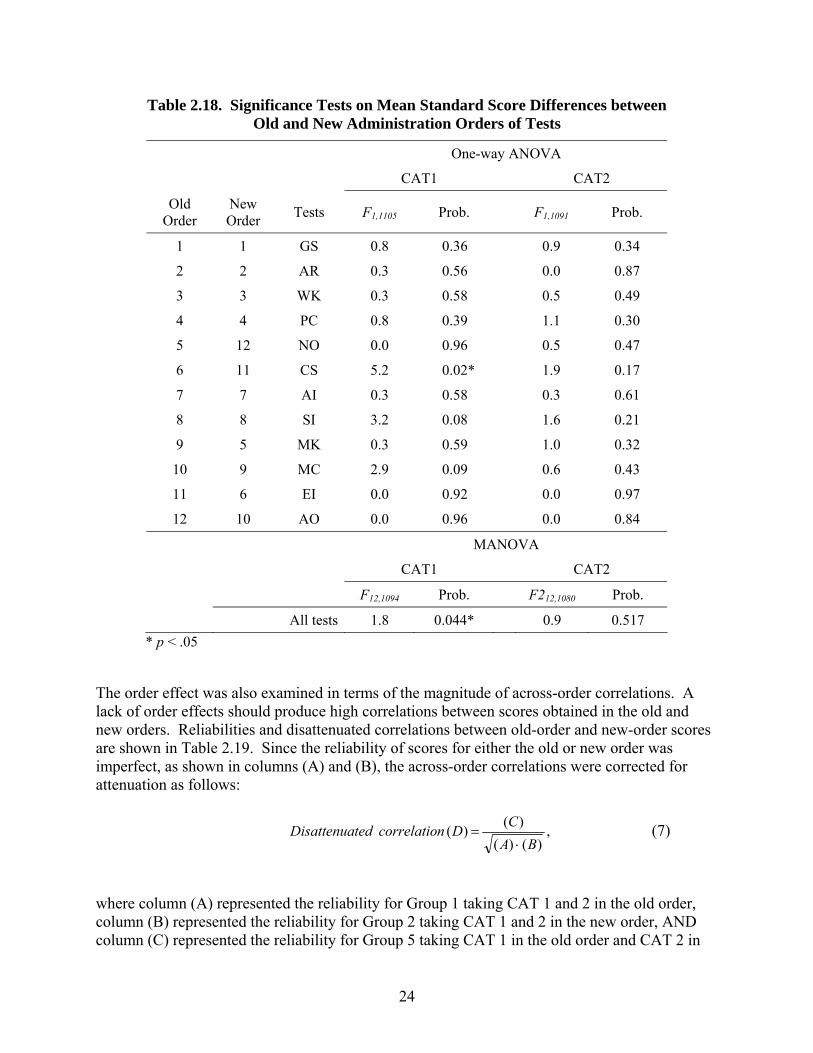
Table 2.18. Significance Tests on Mean Standard Score Differences between Old and New Administration Orders of Tests
One-way ANOVA
CAT1 CAT2
Old Order
New Order
Tests F1,1105 Prob. F1,1091 Prob.
1 1 GS 0.8 0.36 0.9 0.34
2 2 AR 0.3 0.56 0.0 0.87
3 3 WK 0.3 0.58 0.5 0.49
4 4 PC 0.8 0.39 1.1 0.30
5 12 NO 0.0 0.96 0.5 0.47
6 11 CS 5.2 0.02* 1.9 0.17
7 7 AI 0.3 0.58 0.3 0.61
8 8 SI 3.2 0.08 1.6 0.21
9 5 MK 0.3 0.59 1.0 0.32
10 9 MC 2.9 0.09 0.6 0.43
11 6 EI 0.0 0.92 0.0 0.97
12 10 AO 0.0 0.96 0.0 0.84
MANOVA
CAT1 CAT2
F12,1094 Prob. F212,1080 Prob.
All tests 1.8 0.044* 0.9 0.517
* p < .05
The order effect was also examined in terms of the magnitude of across-order correlations. A lack of order effects should produce high correlations between scores obtained in the old and new orders. Reliabilities and disattenuated correlations between old-order and new-order scores are shown in Table 2.19. Since the reliability of scores for either the old or new order was imperfect, as shown in columns (A) and (B), the across-order correlations were corrected for attenuation as follows:
,)()(
)()(
BA
CDncorrelatiotedDisattenua
(7)
where column (A) represented the reliability for Group 1 taking CAT 1 and 2 in the old order, column (B) represented the reliability for Group 2 taking CAT 1 and 2 in the new order, AND column (C) represented the reliability for Group 5 taking CAT 1 in the old order and CAT 2 in
24

the new order. The resulting “disattenuated” across-order correlations are shown in column (D). Disattenuated correlations could exceed 1.0 if different samples were used to estimate the intercorrelation and the reliabilities. Since the maximum correlation is 1.0, one should only be concerned with correlations less than perfect and not with correlations greater than 1.0. One-directional significance tests (reported in column E) revealed that none of the disattenuated correlations was significantly lower than the perfect correlation at the .05 level (Z < -1.65), indicating that the order change did not significantly affect the construct being measured for any of the tests. Additionally, as given in column (G), none of the new-order reliabilities was significantly lower than the old-order reliabilities. Namely, Z-scores for (A) minus (B) were not significantly greater than 0 at the .05 level (Z > 1.65).
Table 2.19. CAT Forms 1 and 2 Reliabilities and Disattenuated Correlations between Old-Order and New-Order Scores
Reliability Disattenuated Correlation
Test Old
Order New Order
(A) Old Order (Group 1)
(B) New Order (Group 2)
(C) Old-New Order
(Group 5) (D)
r (E) Z
(F) SDr
(G) Z((A) – (B))
GS 1 1 .765 .754 .753 .991 -.409 .021 .587
AR 2 2 .744 .726 .733 .997 -.132 .023 .927
WK 3 3 .830 .817 .819 .994 -.414 .015 .926
PC 4 4 .612 .599 .571 .943 -1.440 .040 .480
NO 5 12 .803 .799 .799 .998 -.138 .017 .314
CS 6 11 .716 .696 .744 1.053 2.130 .025 .934
AI 7 7 .818 .818 .820 1.001 .099 .015 .021
SI 8 8 .792 .779 .783 .998 -.119 .018 .806
MK 9 5 .742 .769 .790 1.046 2.334 .020 -1.478
MC 10 9 .687 .696 .688 .996 -.156 .028 -.404
EI 11 6 .664 .701 .692 1.015 .527 .029 -1.596
AO 12 10 .674 .692 .661 .968 -1.075 .030 -.777 N 1,109 1,091 1,091
Finally, the effect of the change in test order was examined in terms of the composite scores that are reported for the ASVAB. (See Appendix B for a list of the composite scores and how they are computed.) Table 2.20 summarizes the reliabilities and disattenuated correlations between old-order and new-order composites. Column (E) shows that none of the disattenuated correlations between the two orders was significantly lower than 1.0 (i.e., Z < -1.65), while column (G) shows that none of the new-order reliabilities was significantly lower than the old-order reliabilities at the .05 level (i.e., Z > 1.65). Additionally, comparisons of mean composite score differences for the AFQT score (using one-way ANOVA) and collectively for all of the
25
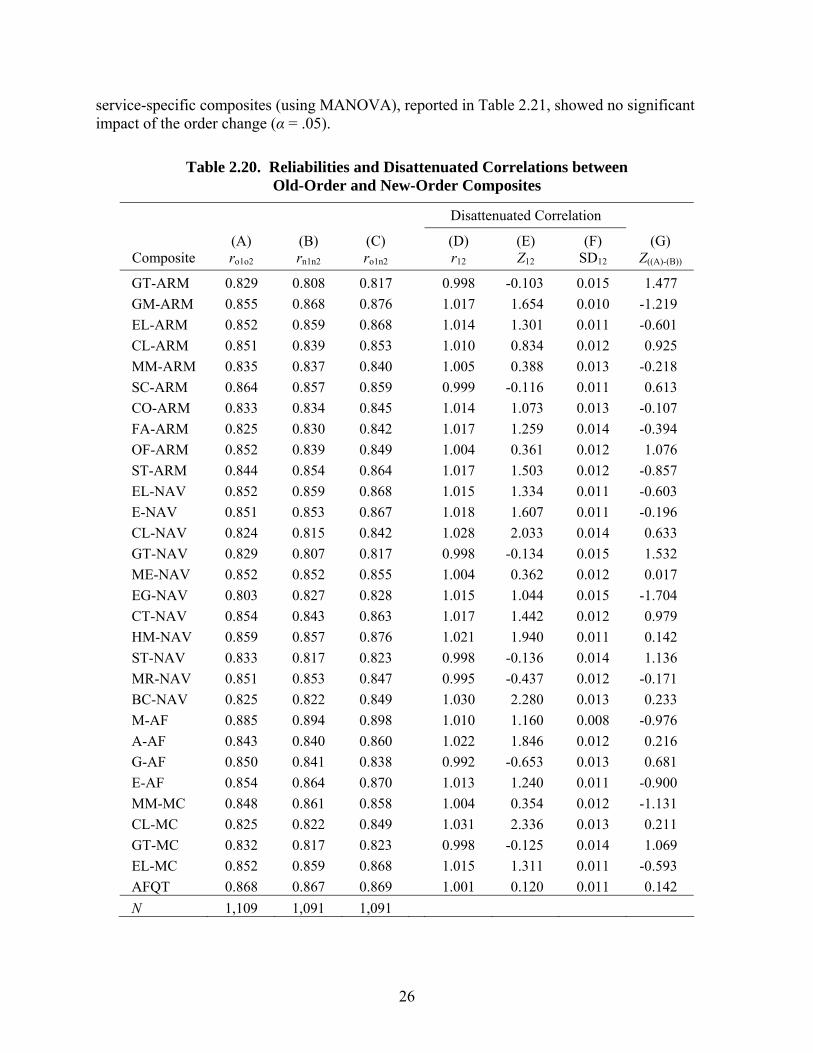
service-specific composites (using MANOVA), reported in Table 2.21, showed no significant impact of the order change (α = .05).
Table 2.20. Reliabilities and Disattenuated Correlations between Old-Order and New-Order Composites
Disattenuated Correlation
Composite (A) ro1o2
(B) rn1n2
(C) ro1n2
(D) r12
(E) Z12
(F) SD12
(G) Z((A)-(B))
GT-ARM 0.829 0.808 0.817 0.998 -0.103 0.015 1.477
GM-ARM 0.855 0.868 0.876 1.017 1.654 0.010 -1.219
EL-ARM 0.852 0.859 0.868 1.014 1.301 0.011 -0.601
CL-ARM 0.851 0.839 0.853 1.010 0.834 0.012 0.925
MM-ARM 0.835 0.837 0.840 1.005 0.388 0.013 -0.218
SC-ARM 0.864 0.857 0.859 0.999 -0.116 0.011 0.613
CO-ARM 0.833 0.834 0.845 1.014 1.073 0.013 -0.107
FA-ARM 0.825 0.830 0.842 1.017 1.259 0.014 -0.394
OF-ARM 0.852 0.839 0.849 1.004 0.361 0.012 1.076
ST-ARM 0.844 0.854 0.864 1.017 1.503 0.012 -0.857
EL-NAV 0.852 0.859 0.868 1.015 1.334 0.011 -0.603
E-NAV 0.851 0.853 0.867 1.018 1.607 0.011 -0.196
CL-NAV 0.824 0.815 0.842 1.028 2.033 0.014 0.633
GT-NAV 0.829 0.807 0.817 0.998 -0.134 0.015 1.532
ME-NAV 0.852 0.852 0.855 1.004 0.362 0.012 0.017
EG-NAV 0.803 0.827 0.828 1.015 1.044 0.015 -1.704
CT-NAV 0.854 0.843 0.863 1.017 1.442 0.012 0.979
HM-NAV 0.859 0.857 0.876 1.021 1.940 0.011 0.142
ST-NAV 0.833 0.817 0.823 0.998 -0.136 0.014 1.136
MR-NAV 0.851 0.853 0.847 0.995 -0.437 0.012 -0.171
BC-NAV 0.825 0.822 0.849 1.030 2.280 0.013 0.233
M-AF 0.885 0.894 0.898 1.010 1.160 0.008 -0.976
A-AF 0.843 0.840 0.860 1.022 1.846 0.012 0.216
G-AF 0.850 0.841 0.838 0.992 -0.653 0.013 0.681
E-AF 0.854 0.864 0.870 1.013 1.240 0.011 -0.900
MM-MC 0.848 0.861 0.858 1.004 0.354 0.012 -1.131
CL-MC 0.825 0.822 0.849 1.031 2.336 0.013 0.211
GT-MC 0.832 0.817 0.823 0.998 -0.125 0.014 1.069
EL-MC 0.852 0.859 0.868 1.015 1.311 0.011 -0.593
AFQT 0.868 0.867 0.869 1.001 0.120 0.011 0.142
N 1,109 1,091 1,091
26

Table 2.21. Significance Tests for Mean Composite Score Differences between Old and New Administration Orders of Tests
CAT Form Composite F df1 df2 Prob.
1 AFQT .01 1 1,105 .915
2 AFQT .13 1 1,091 .721
MANOVA
1 Non-AFQT 1.2 28 1,078 .250
2 Non-AFQT 1.2 28 1,064 .247
In summary, the new order was found to have little impact when scores were compared across old-order and new-order administrations.
2.4.4. Construct Equivalence Between CAT Forms 1 and 2 and Forms 3 and 4
Potential change in the constructs being measured by the new CAT-ASVAB Forms 3 and 4 as compared with the old CAT-ASVAB Forms 1 and 2 was evaluated for the individual tests by examining reliabilities and disattenuated correlations between scores obtained using the old and new forms. The disattenuated correlations were computed as follows:
,)()(
)()(
BA
CDncorrelatiotedDisattenua
(8)
where (A) represented the reliability for Group 2 taking CAT-ASVAB Forms 1 and 2 in the new order, (B) represented the reliability for Group 3 taking CAT-ASVAB Forms 3 and 4 in the new order, and (C) represented the reliability of Group 4 taking CAT-ASVAB Forms 1 and 4 in the new order. Hence, the analyses controlled for test administration order by including only groups taking the new order. The reliabilities and disattenuated correlations are shown in the like-named columns in Table 2.22.
27
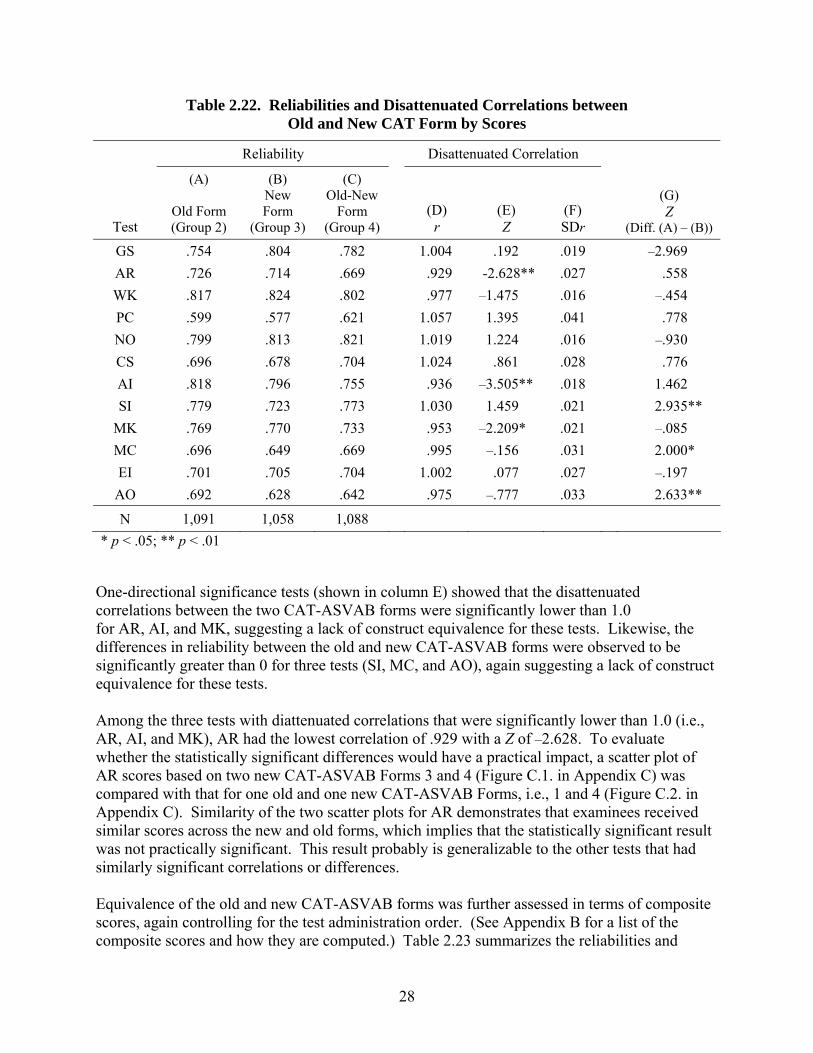
Table 2.22. Reliabilities and Disattenuated Correlations between Old and New CAT Form by Scores
Reliability Disattenuated Correlation
Test
(A)
Old Form (Group 2)
(B) New Form
(Group 3)
(C) Old-New
Form (Group 4)
(D) r
(E) Z
(F) SDr
(G) Z
(Diff. (A) – (B))
GS .754 .804 .782 1.004 .192 .019 –2.969
AR .726 .714 .669 .929 -2.628** .027 .558
WK .817 .824 .802 .977 –1.475 .016 –.454
PC .599 .577 .621 1.057 1.395 .041 .778
NO .799 .813 .821 1.019 1.224 .016 –.930
CS .696 .678 .704 1.024 .861 .028 .776
AI .818 .796 .755 .936 –3.505** .018 1.462
SI .779 .723 .773 1.030 1.459 .021 2.935**
MK .769 .770 .733 .953 –2.209* .021 –.085
MC .696 .649 .669 .995 –.156 .031 2.000*
EI .701 .705 .704 1.002 .077 .027 –.197
AO .692 .628 .642 .975 –.777 .033 2.633**
N 1,091 1,058 1,088
* p < .05; ** p < .01
One-directional significance tests (shown in column E) showed that the disattenuated correlations between the two CAT-ASVAB forms were significantly lower than 1.0 for AR, AI, and MK, suggesting a lack of construct equivalence for these tests. Likewise, the differences in reliability between the old and new CAT-ASVAB forms were observed to be significantly greater than 0 for three tests (SI, MC, and AO), again suggesting a lack of construct equivalence for these tests. Among the three tests with diattenuated correlations that were significantly lower than 1.0 (i.e., AR, AI, and MK), AR had the lowest correlation of .929 with a Z of –2.628. To evaluate whether the statistically significant differences would have a practical impact, a scatter plot of AR scores based on two new CAT-ASVAB Forms 3 and 4 (Figure C.1. in Appendix C) was compared with that for one old and one new CAT-ASVAB Forms, i.e., 1 and 4 (Figure C.2. in Appendix C). Similarity of the two scatter plots for AR demonstrates that examinees received similar scores across the new and old forms, which implies that the statistically significant result was not practically significant. This result probably is generalizable to the other tests that had similarly significant correlations or differences. Equivalence of the old and new CAT-ASVAB forms was further assessed in terms of composite scores, again controlling for the test administration order. (See Appendix B for a list of the composite scores and how they are computed.) Table 2.23 summarizes the reliabilities and
28

disattenuated correlations between old-form and new-form composites. Column (E) shows that none of the disattentuated correlations was significantly lower than 1.0 at the .05 level (i.e., Z < –1.65). Similarly, column (G) shows that none of the new-form reliabilities was significantly lower than the old-form reliabilities at the .05 level. These results suggest that the construct being measured by the new CAT Forms is comparable to that of the old CAT Forms with regard to the composites.
Table 2.23. Reliabilities and Disattenuated Correlations between
Old and New CAT Forms by Composites
Disattenuated Correlation
Composite (A) rn1n2
(B) rn3n4
(C) rn1n4
(D) r1234
(E) Z1234
(F) SD1234
(G) Z((B)-(A))
GT-ARM 0.808 0.796 0.787 0.982 –1.061 0.017 –0.779
GM-ARM 0.868 0.880 0.876 1.002 0.200 0.010 1.098
EL-ARM 0.859 0.864 0.850 0.987 –1.074 0.012 0.448
CL-ARM 0.839 0.836 0.819 0.977 –1.606 0.014 –0.256
MM-ARM 0.837 0.847 0.841 0.999 –0.085 0.013 0.797
SC-ARM 0.857 0.846 0.847 0.995 –0.398 0.012 –0.934
CO-ARM 0.834 0.821 0.822 0.994 –0.421 0.014 –0.976
FA-ARM 0.830 0.824 0.813 0.983 –1.151 0.015 –0.440
OF-ARM 0.839 0.850 0.836 0.990 –0.751 0.013 0.929
ST-ARM 0.854 0.866 0.851 0.989 –0.908 0.012 1.051
EL-NAV 0.859 0.864 0.851 0.987 –1.086 0.012 0.431
E-NAV 0.853 0.854 0.836 0.980 –1.618 0.013 0.119
CL-NAV 0.815 0.841 0.827 1.000 –0.030 0.014 1.937
GT-NAV 0.807 0.796 0.788 0.982 –1.035 0.017 –0.713
ME-NAV 0.852 0.849 0.847 0.997 –0.282 0.012 –0.234
EG-NAV 0.827 0.832 0.805 0.971 –1.935 0.015 0.326
CT-NAV 0.843 0.855 0.840 0.989 –0.862 0.013 1.027
HM-NAV 0.857 0.872 0.859 0.993 –0.586 0.011 1.404
ST-NAV 0.817 0.800 0.803 0.994 –0.376 0.016 –1.169
MR-NAV 0.853 0.834 0.834 0.989 –0.870 0.013 –1.493
BC-NAV 0.822 0.834 0.822 0.992 –0.526 0.014 0.885
M-AF 0.894 0.891 0.884 0.990 –1.143 0.009 –0.273
A-AF 0.840 0.858 0.853 1.005 0.410 0.012 1.467
G-AF 0.841 0.829 0.823 0.986 –1.016 0.014 –0.948
E-AF 0.864 0.867 0.858 0.991 –0.792 0.011 0.304
MM-MC 0.861 0.855 0.855 0.997 –0.275 0.012 –0.579
CL-MC 0.822 0.834 0.822 0.993 –0.484 0.014 0.846
GT-MC 0.817 0.800 0.803 0.993 –0.449 0.016 –1.183
EL-MC 0.859 0.864 0.850 0.988 –1.062 0.012 0.448
AFQT 0.867 0.859 0.854 0.989 –0.940 0.011 –0.662
N 1,091 1,058 1,088
29
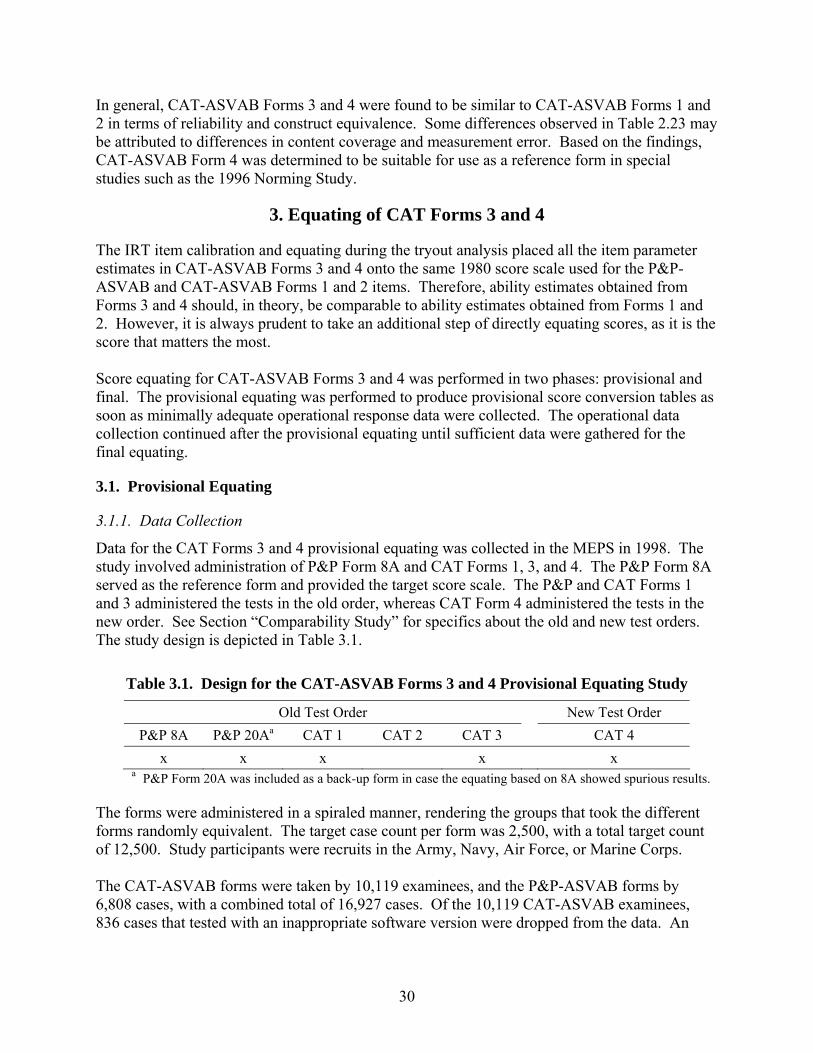
In general, CAT-ASVAB Forms 3 and 4 were found to be similar to CAT-ASVAB Forms 1 and 2 in terms of reliability and construct equivalence. Some differences observed in Table 2.23 may be attributed to differences in content coverage and measurement error. Based on the findings, CAT-ASVAB Form 4 was determined to be suitable for use as a reference form in special studies such as the 1996 Norming Study.
3. Equating of CAT Forms 3 and 4
The IRT item calibration and equating during the tryout analysis placed all the item parameter estimates in CAT-ASVAB Forms 3 and 4 onto the same 1980 score scale used for the P&P-ASVAB and CAT-ASVAB Forms 1 and 2 items. Therefore, ability estimates obtained from Forms 3 and 4 should, in theory, be comparable to ability estimates obtained from Forms 1 and 2. However, it is always prudent to take an additional step of directly equating scores, as it is the score that matters the most. Score equating for CAT-ASVAB Forms 3 and 4 was performed in two phases: provisional and final. The provisional equating was performed to produce provisional score conversion tables as soon as minimally adequate operational response data were collected. The operational data collection continued after the provisional equating until sufficient data were gathered for the final equating.
3.1. Provisional Equating
3.1.1. Data Collection
Data for the CAT Forms 3 and 4 provisional equating was collected in the MEPS in 1998. The study involved administration of P&P Form 8A and CAT Forms 1, 3, and 4. The P&P Form 8A served as the reference form and provided the target score scale. The P&P and CAT Forms 1 and 3 administered the tests in the old order, whereas CAT Form 4 administered the tests in the new order. See Section “Comparability Study” for specifics about the old and new test orders. The study design is depicted in Table 3.1.
Table 3.1. Design for the CAT-ASVAB Forms 3 and 4 Provisional Equating Study
Old Test Order New Test Order
P&P 8A P&P 20Aa CAT 1 CAT 2 CAT 3 CAT 4
x x x x x a P&P Form 20A was included as a back-up form in case the equating based on 8A showed spurious results.
The forms were administered in a spiraled manner, rendering the groups that took the different forms randomly equivalent. The target case count per form was 2,500, with a total target count of 12,500. Study participants were recruits in the Army, Navy, Air Force, or Marine Corps. The CAT-ASVAB forms were taken by 10,119 examinees, and the P&P-ASVAB forms by 6,808 cases, with a combined total of 16,927 cases. Of the 10,119 CAT-ASVAB examinees, 836 cases that tested with an inappropriate software version were dropped from the data. An
30
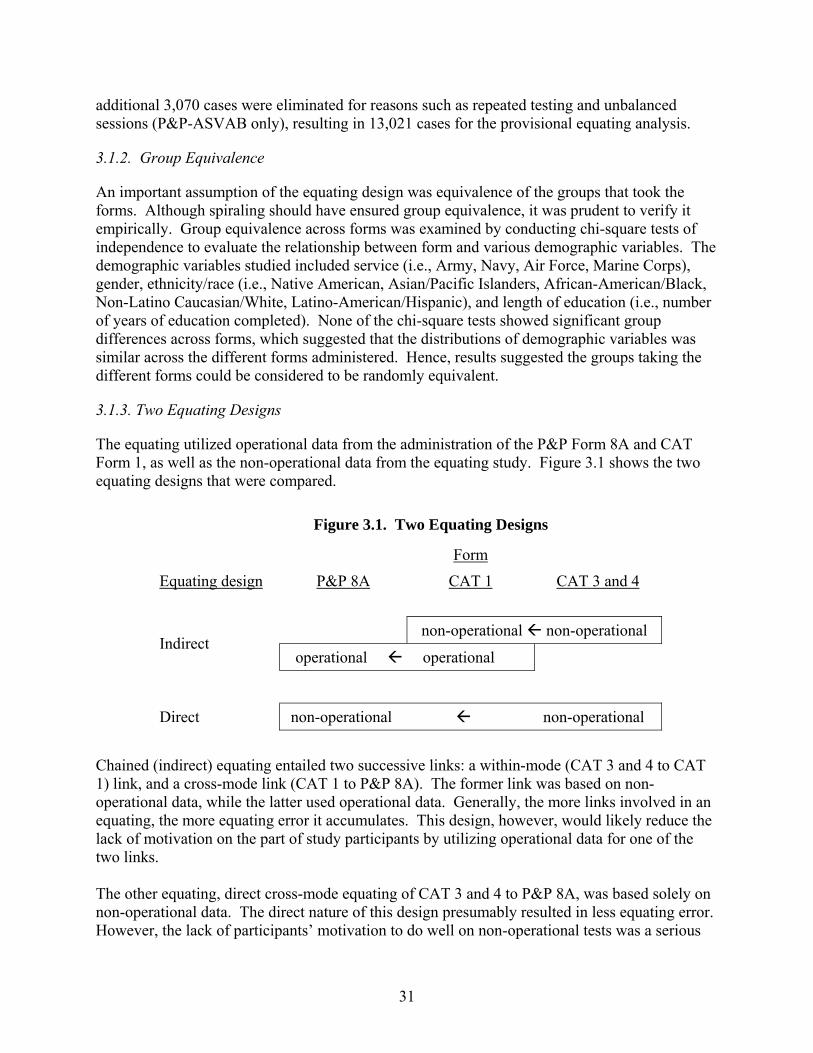
additional 3,070 cases were eliminated for reasons such as repeated testing and unbalanced sessions (P&P-ASVAB only), resulting in 13,021 cases for the provisional equating analysis.
3.1.2. Group Equivalence
An important assumption of the equating design was equivalence of the groups that took the forms. Although spiraling should have ensured group equivalence, it was prudent to verify it empirically. Group equivalence across forms was examined by conducting chi-square tests of independence to evaluate the relationship between form and various demographic variables. The demographic variables studied included service (i.e., Army, Navy, Air Force, Marine Corps), gender, ethnicity/race (i.e., Native American, Asian/Pacific Islanders, African-American/Black, Non-Latino Caucasian/White, Latino-American/Hispanic), and length of education (i.e., number of years of education completed). None of the chi-square tests showed significant group differences across forms, which suggested that the distributions of demographic variables was similar across the different forms administered. Hence, results suggested the groups taking the different forms could be considered to be randomly equivalent.
3.1.3. Two Equating Designs
The equating utilized operational data from the administration of the P&P Form 8A and CAT Form 1, as well as the non-operational data from the equating study. Figure 3.1 shows the two equating designs that were compared.
Figure 3.1. Two Equating Designs
Form
Equating design
P&P 8A CAT 1 CAT 3 and 4
non-operational non-operational Indirect
operational operational
Direct non-operational non-operational
Chained (indirect) equating entailed two successive links: a within-mode (CAT 3 and 4 to CAT 1) link, and a cross-mode link (CAT 1 to P&P 8A). The former link was based on non-operational data, while the latter used operational data. Generally, the more links involved in an equating, the more equating error it accumulates. This design, however, would likely reduce the lack of motivation on the part of study participants by utilizing operational data for one of the two links. The other equating, direct cross-mode equating of CAT 3 and 4 to P&P 8A, was based solely on non-operational data. The direct nature of this design presumably resulted in less equating error. However, the lack of participants’ motivation to do well on non-operational tests was a serious
31
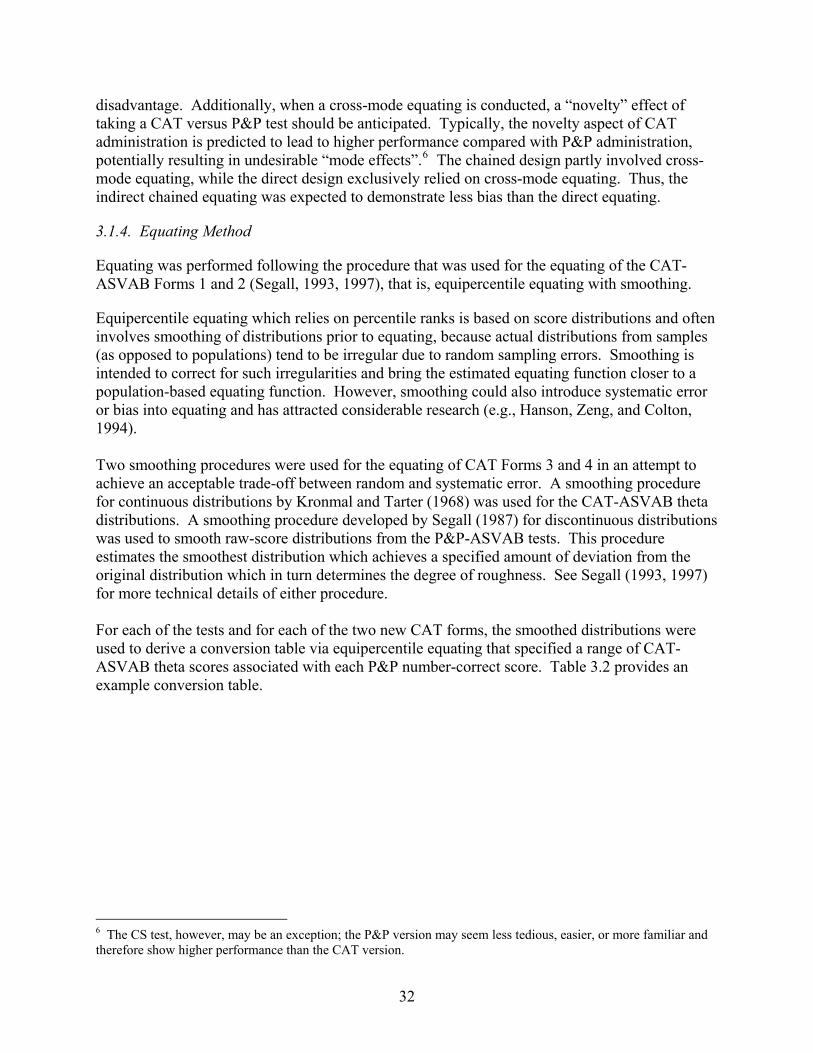
disadvantage. Additionally, when a cross-mode equating is conducted, a “novelty” effect of taking a CAT versus P&P test should be anticipated. Typically, the novelty aspect of CAT administration is predicted to lead to higher performance compared with P&P administration, potentially resulting in undesirable “mode effects”.6 The chained design partly involved cross-mode equating, while the direct design exclusively relied on cross-mode equating. Thus, the indirect chained equating was expected to demonstrate less bias than the direct equating.
3.1.4. Equating Method
Equating was performed following the procedure that was used for the equating of the CAT-ASVAB Forms 1 and 2 (Segall, 1993, 1997), that is, equipercentile equating with smoothing.
Equipercentile equating which relies on percentile ranks is based on score distributions and often involves smoothing of distributions prior to equating, because actual distributions from samples (as opposed to populations) tend to be irregular due to random sampling errors. Smoothing is intended to correct for such irregularities and bring the estimated equating function closer to a population-based equating function. However, smoothing could also introduce systematic error or bias into equating and has attracted considerable research (e.g., Hanson, Zeng, and Colton, 1994). Two smoothing procedures were used for the equating of CAT Forms 3 and 4 in an attempt to achieve an acceptable trade-off between random and systematic error. A smoothing procedure for continuous distributions by Kronmal and Tarter (1968) was used for the CAT-ASVAB theta distributions. A smoothing procedure developed by Segall (1987) for discontinuous distributions was used to smooth raw-score distributions from the P&P-ASVAB tests. This procedure estimates the smoothest distribution which achieves a specified amount of deviation from the original distribution which in turn determines the degree of roughness. See Segall (1993, 1997) for more technical details of either procedure. For each of the tests and for each of the two new CAT forms, the smoothed distributions were used to derive a conversion table via equipercentile equating that specified a range of CAT-ASVAB theta scores associated with each P&P number-correct score. Table 3.2 provides an example conversion table.
6 The CS test, however, may be an exception; the P&P version may seem less tedious, easier, or more familiar and therefore show higher performance than the CAT version.
32

Table 3.2. Example Conversion Table for a Test
P&P CAT Form X Thetas CAT Form Y Thetas
Number-Correct Score
% (after smoothing)
Lower Bound
Upper Bound
Lower Bound
Upper Bound
0 0.0 –999.000 –3.484 –999.000 –3.497
1 0.1 –3.484 –2.923 –3.497 –2.976
2 0.2 –2.923 –2.483 –2.976 –2.566
3 0.4 –2.483 –2.081 –2.566 –2.192
4 0.9 –2.081 –1.695 –2.192 –1.833
5 1.9 –1.695 –1.316 –1.833 –1.481
6 2.3 –1.316 –1.072 –1.481 –1.207
7 3.2 –1.072 –0.877 –1.207 –0.931
8 5.1 –0.877 –0.667 –0.931 –0.673
9 7.3 –0.667 –0.438 –0.673 –0.449
10 10.0 –0.438 –0.164 –0.449 –0.218
11 13.2 –0.164 0.154 –0.218 0.061
12 16.2 0.154 0.483 0.061 0.447
13 17.0 0.483 0.839 0.447 0.908
14 14.2 0.839 1.321 0.908 1.374
15 8.0 1.321 999.000 1.374 999.000
For comparison purposes, the equipercentile equating was performed for each of the two equating designs: indirect chained equating and direct equating. Based on the results, it was recommended that the indirect chained equating approach be employed to construct provisional conversion tables for CAT Forms 3 and 4 and that the provisional tables be used for operational scoring until sufficient operational data were collected to produce final transformation tables. Subsequent monitoring of their adequacy based on operational data demonstrated the need to replace the provisional tables for the speeded tests (CS and NO) with those based on interim operational data. Revised provisional equating tables were constructed for CS and NO using the directing equating procedure rather than the indirect chained procedure. The provisional equating tables for the remaining tests were found to be satisfactory and were left unchanged. The interim operational data were collected between August 03, 1998, and September 13, 1998, at the 12 MEPS that were selected to be representative of the population of military applicants: Boston, Buffalo, Raleigh, Richmond, Dallas, Houston, Kansas City, Chicago, Indianapolis, Milwaukee, San Diego, and Seattle. Three ASVAB forms were administered in spiraled fashion meaning that each examinee took one of the three forms: CAT Form,3, CAT Form 4, and P&P Form 15H. Sample sizes for the interim operational data after editing were 2,398 for CAT Form 3; 2,489 for CAT Form 4; and 2,361 for P&P Form 15H.
33
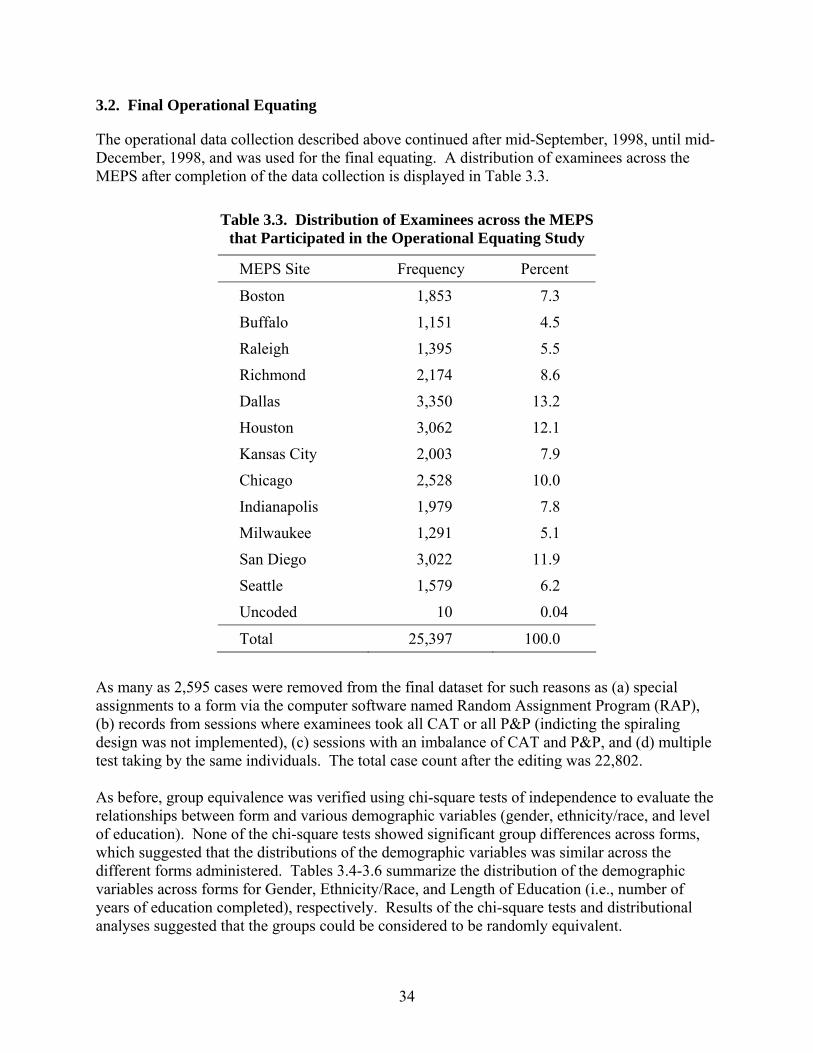
3.2. Final Operational Equating
The operational data collection described above continued after mid-September, 1998, until mid-December, 1998, and was used for the final equating. A distribution of examinees across the MEPS after completion of the data collection is displayed in Table 3.3.
Table 3.3. Distribution of Examinees across the MEPS that Participated in the Operational Equating Study
MEPS Site Frequency Percent
Boston 1,853 7.3
Buffalo 1,151 4.5
Raleigh 1,395 5.5
Richmond 2,174 8.6
Dallas 3,350 13.2
Houston 3,062 12.1
Kansas City 2,003 7.9
Chicago 2,528 10.0
Indianapolis 1,979 7.8
Milwaukee 1,291 5.1
San Diego 3,022 11.9
Seattle 1,579 6.2
Uncoded 10 0.04
Total 25,397 100.0
As many as 2,595 cases were removed from the final dataset for such reasons as (a) special assignments to a form via the computer software named Random Assignment Program (RAP), (b) records from sessions where examinees took all CAT or all P&P (indicting the spiraling design was not implemented), (c) sessions with an imbalance of CAT and P&P, and (d) multiple test taking by the same individuals. The total case count after the editing was 22,802. As before, group equivalence was verified using chi-square tests of independence to evaluate the relationships between form and various demographic variables (gender, ethnicity/race, and level of education). None of the chi-square tests showed significant group differences across forms, which suggested that the distributions of the demographic variables was similar across the different forms administered. Tables 3.4-3.6 summarize the distribution of the demographic variables across forms for Gender, Ethnicity/Race, and Length of Education (i.e., number of years of education completed), respectively. Results of the chi-square tests and distributional analyses suggested that the groups could be considered to be randomly equivalent.
34

Table 3.4. Distributions of Gender by Form for the Operational Sample used in the Final Equating
Form
Gender CAT 3 CAT 4 P&P 15H Total
Female N 1,556 1,618 1,589 4,763
% 32.7% 34.0% 33.4% 100.0%
Male N 5,940 6,134 5,965 18,039
% 32.9% 34.0% 33.1% 100.0%
Total N 7,496 7,752 7,554 22,802
% 32.9% 34.0% 33.1% 100.0%
Table 3.5 Distributions of Ethnicity/Race by Form for the Operational Sample used in the Final Equating
Form Ethnicity/ Race CAT 3 CAT 4 P&P 15H Total
N 4,658 4,907 4,842 14,407 Caucasian/ White % 32.3% 34.1% 33.6% 100.0%
N 1,669 1,682 1,590 4,941 African-Am/
Black % 33.8% 34.0% 32.2% 100.0%
N 539 520 538 1,597 Latino-Am/ Hispanic % 33.8% 32.6% 33.7% 100.0%
N 630 643 584 1,857 Other
% 33.9% 34.6% 31.4% 100.0%
N 7,496 7,752 7,554 22,802 Total
% 32.9% 34.0% 33.1% 100.0%
35
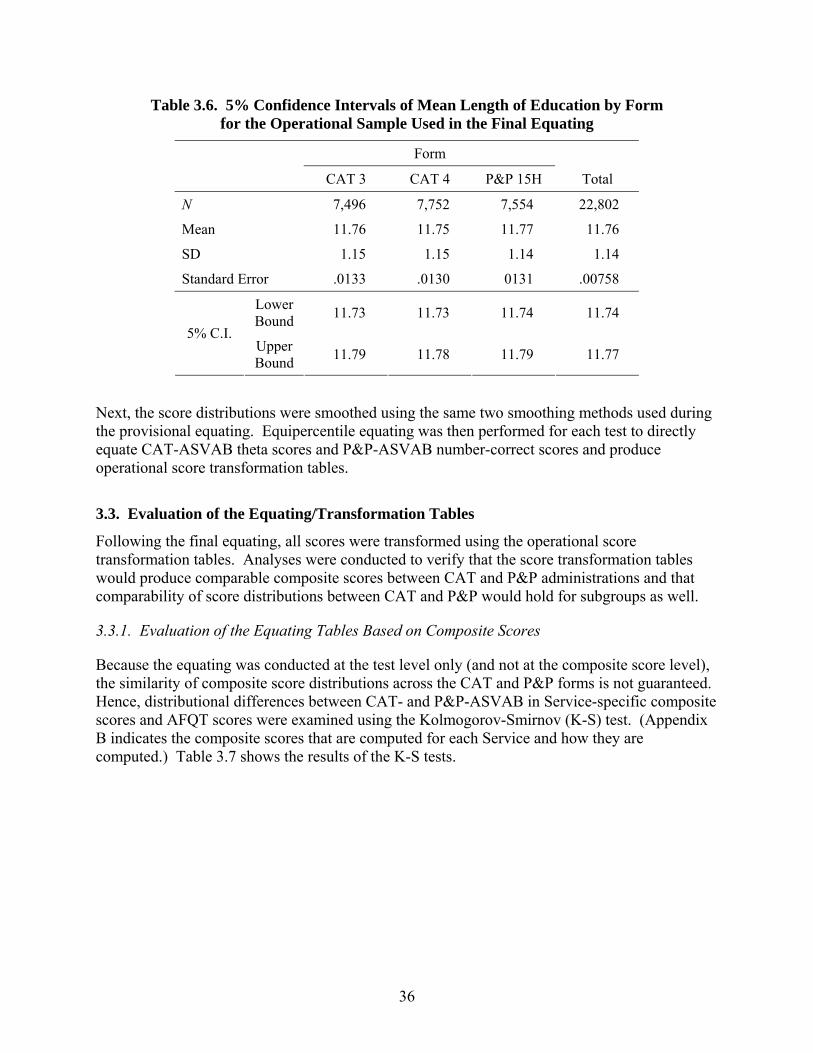
Table 3.6. 5% Confidence Intervals of Mean Length of Education by Form for the Operational Sample Used in the Final Equating
Form
CAT 3 CAT 4 P&P 15H Total
N 7,496 7,752 7,554 22,802
Mean 11.76 11.75 11.77 11.76
SD 1.15 1.15 1.14 1.14
Standard Error .0133 .0130 0131 .00758
Lower Bound
11.73 11.73 11.74 11.74
5% C.I. Upper Bound
11.79 11.78 11.79 11.77
Next, the score distributions were smoothed using the same two smoothing methods used during the provisional equating. Equipercentile equating was then performed for each test to directly equate CAT-ASVAB theta scores and P&P-ASVAB number-correct scores and produce operational score transformation tables.
3.3. Evaluation of the Equating/Transformation Tables
Following the final equating, all scores were transformed using the operational score transformation tables. Analyses were conducted to verify that the score transformation tables would produce comparable composite scores between CAT and P&P administrations and that comparability of score distributions between CAT and P&P would hold for subgroups as well.
3.3.1. Evaluation of the Equating Tables Based on Composite Scores
Because the equating was conducted at the test level only (and not at the composite score level), the similarity of composite score distributions across the CAT and P&P forms is not guaranteed. Hence, distributional differences between CAT- and P&P-ASVAB in Service-specific composite scores and AFQT scores were examined using the Kolmogorov-Smirnov (K-S) test. (Appendix B indicates the composite scores that are computed for each Service and how they are computed.) Table 3.7 shows the results of the K-S tests.
36

Table 3.7. Distributional Equivalence of Composites
Most Extreme Differences K-S Test
Composite Absolute Positive Negative Z Prob.
GT_ARM .010 .010 –.008 .716 .684
GM_ARM .015 .008 –.015 1.041 .229
EL_ARM .011 .011 –.011 .759 .613
CL_ARM .012 .010 –.012 .887 .411
MM_ARM .016 .010 –.016 1.140 .149
SC_ARM .011 .004 –.011 .792 .557
CO_ARM .011 .008 –.011 .808 .532
FA_ARM .012 .009 –.012 .838 .483
OF_ARM .013 .010 –.013 .915 .373
ST_ARM .010 .010 –.006 .698 .715
EL_NAV .012 .011 –.012 .831 .495
E_NAV .014 .011 –.014 .986 .285
CL_NAV .018 .018 –.013 1.250 .088
GT_NAV .010 .010 –.008 .716 .684
ME_NAV .007 .004 –.007 .494 .968
EG_NAV .019 .014 –.019 1.351 .052
CT_NAV .015 .015 –.012 1.046 .223
HM_NAV .012 .012 –.012 .866 .442
ST_NAV .007 .007 –.007 .495 .967
MR_NAV .016 .006 –.016 1.133 .154
BC_NAV .013 .013 –.007 .891 .406
M_AF .016 .008 –.016 1.149 .143
A_AF .018 .018 –.012 1.250 .088
G_AF .010 .010 –.008 .716 .684
E_AF .012 .009 –.012 .831 .495
MM_MC .017 .007 –.017 1.190 .118
CL_MC .011 .011 –.007 .806 .535
GT_MC .007 .007 –.006 .475 .978
EL_MC .011 .011 –.011 .759 .613
AFQT .010 .010 -.007 .692 .725
37

All of the composite scores showed small, non-significant distributional differences across the CAT and P&P forms at the .05 level.
3.3.2. Evaluation of the Equating Tables for the Subgroups
One of the desirable properties of equating relationships is group invariance (e.g., Harris and Crouse, 1993). Under the group invariance property, an equating relationship remains the same, irrespective of the group of examinees used to derive the relationship. Thus, it was of interest whether the relationships obtained using the entire sample to equate scores on CAT Forms 3 and 4 to the P&P forms were equally applicable to subgroups. Group invariance was examined by assessing whether subgroups would perform similarly across the CAT and P&P forms. Specifically, score distributions were compared between CAT and P&P for various minority subgroups, using the K-S test. Additionally, significance of mean score differences between CAT and P&P was assessed using the analysis of variance (ANOVA) method. The subgroups examined were female, African-American/Black, and Latino-American/Hispanic. The results are shown in Tables 3.8–3.10.
Table 3.8 Equivalence of Score Distributions for Females
K-S Test ANOVA
Test
Z
Prob.
F
Prob. Mean CAT
Mean P&P
Advantage
GS 1.200 .112 3.359 .067 48.09 47.63 None
AR .570 .901 .625 .429 48.73 48.93 None
WK .577 .893 .709 .400 50.74 50.55 None
PC 1.776 .004* 9.224 .002* 51.36 52.05 P&P
NO 1.213 .105 .278 .598 54.34 54.46 None
CS .619 .838 .054 .817 55.21 55.16 None
AS 1.966 .001* 26.022 .000** 42.02 43.00 P&P
MK .807 .532 .608 .436 52.94 52.75 None
MC .640 .808 1.534 .216 45.26 45.56 None
EI 1.579 .014* 9.665 .002* 43.94 44.63 P&P
VE .912 .377 .084 .772 50.96 51.02 None
AFQT .818 .514 .139 .709 51.43 51.68 None * p < .05; ** p < .001
38

Table 3.9. Equivalence of Score Distributions for African-Americans/Blacks
K-S Test ANOVA
Test
Z
Prob.
F
Prob. Mean CAT
Mean P&P
Advantage
GS .881 .419 1.468 .226 45.33 45.63 None
AR .553 .920 .005 .942 46.09 46.08 None
WK 1.011 .258 .140 .708 48.13 48.05 None
PC .736 .651 .116 .734 48.37 48.45 None
NO 2.830 .000** 25.862 .000** 53.06 51.82 CAT
CS 1.176 .126 5.254 .022* 51.71 51.15 CAT
AS .924 .360 .481 .488 42.91 42.77 None
MK .757 .616 .475 .491 49.82 49.65 None
MC .745 .636 .885 .347 44.32 44.09 None
EI .884 .414 1.760 .185 44.55 44.23 None
VE .782 .574 .048 .826 48.14 48.09 None
AFQT .788 .564 .038 .845 41.78 41.66 None
* p < .05; ** p < .001
Table 3.10. Equivalence of Score Distributions for Latino-Americans/Hispanics
K-S Test ANOVA
Test
Z
Prob.
F
Prob. Mean CAT
Mean P&P
Advantage
GS .916 .371 .506 .477 47.77 48.08 None
AR 1.101 .177 2.211 .137 49.56 48.93 None
WK 1.136 .152 1.630 .202 49.04 49.51 None
PC .678 .747 1.085 .298 49.67 49.22 None
NO 1.727 .005* 6.117 .013* 52.29 53.30 PandP
CS .959 .317 3.746 .053 52.13 52.91 None
AS .782 .573 .076 .783 45.79 45.91 None
MK .539 .934 .022 .883 51.43 51.36 None
MC .695 .720 1.147 .284 48.64 48.15 None
EI .915 .372 .185 .667 46.89 47.08 None
VE .748 .631 .343 .558 49.20 49.41 None
AFQT .669 .762 .019 .890 47.72 47.56 None
* p < .05
39
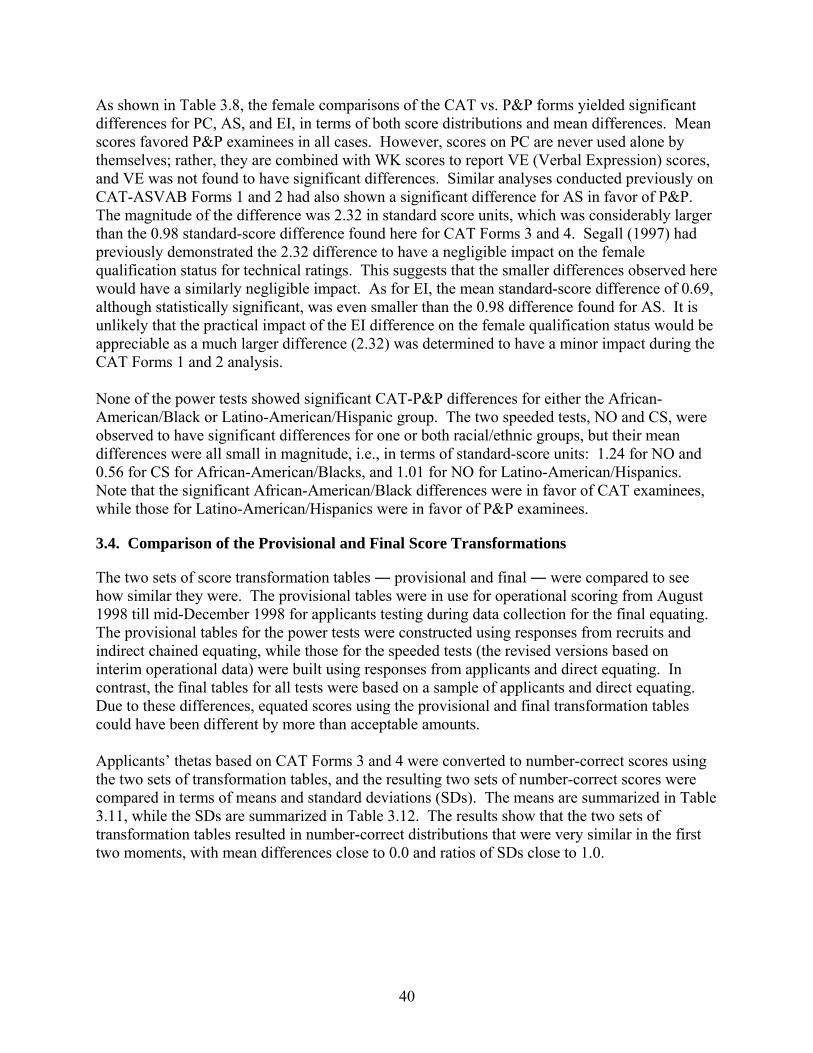
As shown in Table 3.8, the female comparisons of the CAT vs. P&P forms yielded significant differences for PC, AS, and EI, in terms of both score distributions and mean differences. Mean scores favored P&P examinees in all cases. However, scores on PC are never used alone by themselves; rather, they are combined with WK scores to report VE (Verbal Expression) scores, and VE was not found to have significant differences. Similar analyses conducted previously on CAT-ASVAB Forms 1 and 2 had also shown a significant difference for AS in favor of P&P. The magnitude of the difference was 2.32 in standard score units, which was considerably larger than the 0.98 standard-score difference found here for CAT Forms 3 and 4. Segall (1997) had previously demonstrated the 2.32 difference to have a negligible impact on the female qualification status for technical ratings. This suggests that the smaller differences observed here would have a similarly negligible impact. As for EI, the mean standard-score difference of 0.69, although statistically significant, was even smaller than the 0.98 difference found for AS. It is unlikely that the practical impact of the EI difference on the female qualification status would be appreciable as a much larger difference (2.32) was determined to have a minor impact during the CAT Forms 1 and 2 analysis. None of the power tests showed significant CAT-P&P differences for either the African-American/Black or Latino-American/Hispanic group. The two speeded tests, NO and CS, were observed to have significant differences for one or both racial/ethnic groups, but their mean differences were all small in magnitude, i.e., in terms of standard-score units: 1.24 for NO and 0.56 for CS for African-American/Blacks, and 1.01 for NO for Latino-American/Hispanics. Note that the significant African-American/Black differences were in favor of CAT examinees, while those for Latino-American/Hispanics were in favor of P&P examinees.
3.4. Comparison of the Provisional and Final Score Transformations
The two sets of score transformation tables ― provisional and final ― were compared to see how similar they were. The provisional tables were in use for operational scoring from August 1998 till mid-December 1998 for applicants testing during data collection for the final equating. The provisional tables for the power tests were constructed using responses from recruits and indirect chained equating, while those for the speeded tests (the revised versions based on interim operational data) were built using responses from applicants and direct equating. In contrast, the final tables for all tests were based on a sample of applicants and direct equating. Due to these differences, equated scores using the provisional and final transformation tables could have been different by more than acceptable amounts. Applicants’ thetas based on CAT Forms 3 and 4 were converted to number-correct scores using the two sets of transformation tables, and the resulting two sets of number-correct scores were compared in terms of means and standard deviations (SDs). The means are summarized in Table 3.11, while the SDs are summarized in Table 3.12. The results show that the two sets of transformation tables resulted in number-correct distributions that were very similar in the first two moments, with mean differences close to 0.0 and ratios of SDs close to 1.0.
40
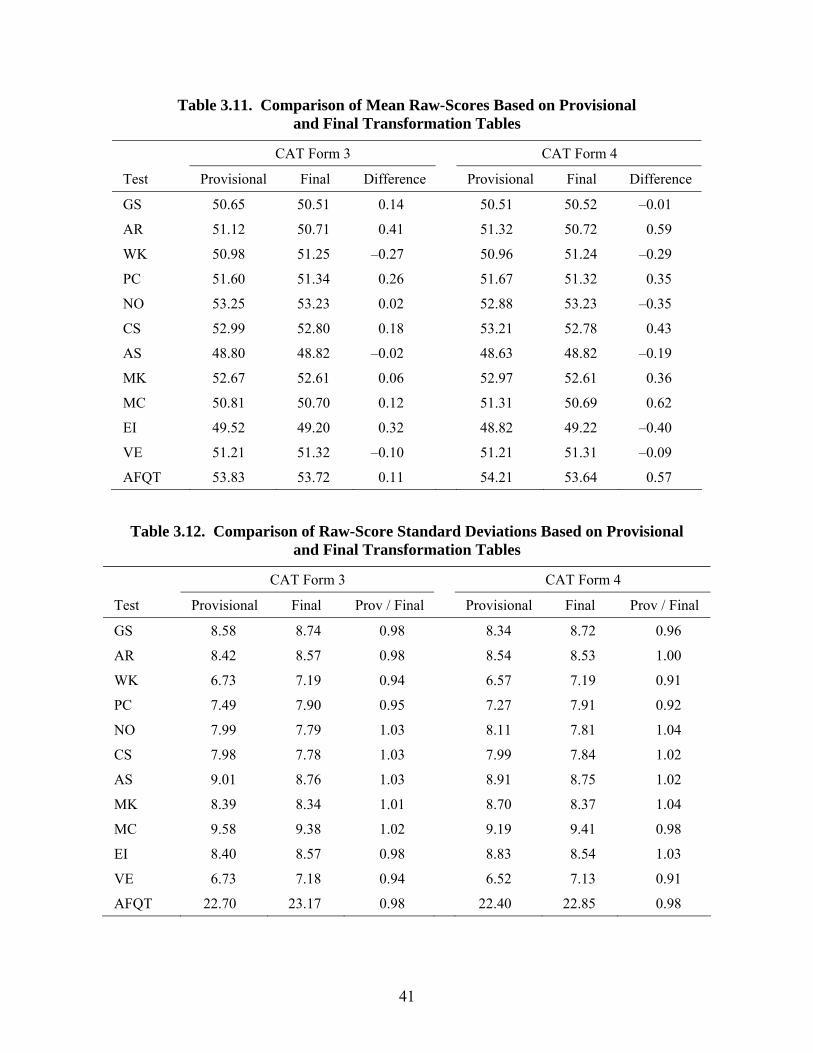
Table 3.11. Comparison of Mean Raw-Scores Based on Provisional and Final Transformation Tables
CAT Form 3 CAT Form 4
Test Provisional Final Difference Provisional Final Difference
GS 50.65 50.51 0.14 50.51 50.52 –0.01
AR 51.12 50.71 0.41 51.32 50.72 0.59
WK 50.98 51.25 –0.27 50.96 51.24 –0.29
PC 51.60 51.34 0.26 51.67 51.32 0.35
NO 53.25 53.23 0.02 52.88 53.23 –0.35
CS 52.99 52.80 0.18 53.21 52.78 0.43
AS 48.80 48.82 –0.02 48.63 48.82 –0.19
MK 52.67 52.61 0.06 52.97 52.61 0.36
MC 50.81 50.70 0.12 51.31 50.69 0.62
EI 49.52 49.20 0.32 48.82 49.22 –0.40
VE 51.21 51.32 –0.10 51.21 51.31 –0.09
AFQT 53.83 53.72 0.11 54.21 53.64 0.57
Table 3.12. Comparison of Raw-Score Standard Deviations Based on Provisional and Final Transformation Tables
CAT Form 3 CAT Form 4
Test Provisional Final Prov / Final Provisional Final Prov / Final
GS 8.58 8.74 0.98 8.34 8.72 0.96
AR 8.42 8.57 0.98 8.54 8.53 1.00
WK 6.73 7.19 0.94 6.57 7.19 0.91
PC 7.49 7.90 0.95 7.27 7.91 0.92
NO 7.99 7.79 1.03 8.11 7.81 1.04
CS 7.98 7.78 1.03 7.99 7.84 1.02
AS 9.01 8.76 1.03 8.91 8.75 1.02
MK 8.39 8.34 1.01 8.70 8.37 1.04
MC 9.58 9.38 1.02 9.19 9.41 0.98
EI 8.40 8.57 0.98 8.83 8.54 1.03
VE 6.73 7.18 0.94 6.52 7.13 0.91
AFQT 22.70 23.17 0.98 22.40 22.85 0.98
41

3.5 Simulated Test-Retest Reliabilities of CAT- ASVAB Forms 3 and 4
Test-retest reliabilities were estimated for each CAT-ASVAB Form through simulated test sessions. A group of 2,000 simulees was sampled from a N(0,1) distribution, and two CAT sessions were simulated for each CAT form. The reliability of each form was computed as the correlation between the pairs of Bayesian modal ability estimates from the two simulated test administrations. The reliabilities are listed in Table 3.13. Within each test, the estimated reliabilities for CAT Forms 3 and 4 were largely comparable with the estimated reliabilities for CAT Forms 1 and 2.
Table 3.13. Test-retest reliabilities of CAT-ASVAB Forms 1–4 (N = 2,000)
Test CAT1 CAT2 CAT3 CAT4
GS .896 .895 .895 .896
AR .923 .929 .921 .923
WK .932 .933 .912 .918
PC .823 .841 .873 .870
SI .850 .864 .870 .874
AI .890 .894 .892 .885
MK .925 .924 .910 .907
MC .868 .879 .887 .899
EI .867 .870 .829 .849
AO .891 .886 .888 .886
4. Conclusion
One way to evaluate the relative quality of item pools is to compare them in terms of their information functions. The information function for each of the CAT-ASVAB Forms 1–4 was estimated based on simulated test sessions taken by 2,000 examinees at each of 31 equally-spaced levels between ± 3.0. In the simulation, CAT-ASVAB item selection and scoring algorithms were applied to the item parameters and exposure control parameters. At each level, the mean m and variance s2 of the 2,000 final scores were computed. Using the m and s2 and the following formula (Lord, 1980, eq. 10-7), the approximate information function for the maximum likelihood estimator (MLE) of ability can be computed at each of the levels:
,
)ˆ()(
)ˆ()ˆ(ˆ,0
2211
2
11
s
mmI
(9)
42

where 101 ,, denote the successive levels of . However, the approximate information
function often appears uneven. For that reason, the following formula was used to compute the smoothed approximate information function instead of the above Equation 9:
,
)ˆ()(
)ˆ()ˆ()ˆ()ˆ(25ˆ,22
22
2112
2
2112
kks
mmmmI
(10)
where 21012 ,,,, denote the successive levels of . Ability was estimated for the
simulation using the Bayes modal method with the standard normal distribution as a prior. The Bayes modal ability estimator equals the MLE when a uniform prior is used. For an n-item paper-and-pencil test, the information function for a number-right score x was computed as follows:
,)()(
)(
),(
1
2
1
'
n
iii
n
ii
QP
P
xI
(11)
where
.1
)()('
i
iiiii c
cPQDaP
(12)
Figures D.1–D-10 in Appendix D show the resulting information functions for CAT-ASVAB Forms 1–4 in comparison with those for P&P 9A. A goal for CAT Forms 3 and 4 was to make information functions as high as possible without going below those of P&P or CAT Forms 1 and 2 as much as possible. The figures demonstrate that, generally, this goal was attained. Based on the largely positive results from the various analyses, CAT-ASVAB Forms 3 and 4 were incorporated into operational use in 1999, along with the final score transformation tables. The new forms included the AO test as part of the CAT-ASVAB. As noted earlier, CAT Form 4 was reserved for special studies. Introduction of CAT Form 3 to operational CAT-ASVAB administrations increased the number of CAT forms available from two (1 and 2) to three (1–3).7 Examinees are randomly assigned to one of the multiple operational CAT Forms.
7 The AO test uses one CAT pool, CAT-ASVAB Form 3.
43
References
Bock, R.D., & Aitkin, M. (1981). Marginal maximum likelihood estimation of item parameters: Application of an EM algorithm. Psychometrika, 46, 443-459; 47, 369 (Errata).
DMDC (2006). CAT-ASVAB Forms 1 and 2 (Technical Bulletin No. 1). Seaside, CA: Defense
Manpower Data Center. DMDC (2008). CAT-ASVAB Forms 5-9 (Technical Bulletin No. 3). Seaside, CA: Defense
Manpower Data Center. Hanson, B. A., Zeng, L., & Colton, D. (1994). A comparison of presmoothing and postsmoothing
methods in equipercentile equating (ACT Research Report 94-4). Iowa City, IA: American College Testing.
Harris, D. J., & Crouse, J. D. (1993). A study of criteria used in equating. Applied Measurement
in Education, 6, 195-240. Hetter, R. D., & Sympson, J. B. (1997). Item exposure control in CAT-ASVAB. In W. A. Sands,
B. K. Waters, & J. R. McBride (Eds.), Computerized Adaptive Testing: From Inquiry to Operation (pp. 141-144). Washington, DC: American Psychological Association.
Holland, P. W., & Thayer, D. T. (1988). Differential item performance and the Mantel-Haenszel
procedure. In H. Wainer & H. I. Braun (Eds.), Test Validity (pp. 129-145). Hillsdale, NJ: Lawrence Erlbaum.
Kolen, M. J., & Brennan, R. L. (2004). Test Equating, Scaling, and Linking: Methods and
Practices (2nd ed.). New York: Springer. Kronmal, R. & Tarter, M. (1968). The estimation of probability density and cumulatives by
Fourier series methods. Journal of the American Statistical Association, 69, 925-952. Mantel, N., & Haenszel, W. (1959). Statistical aspects of the analysis of data from retrospective
studies of disease. Journal of the National Cancer Institute, 22, 719-748. Massad, E. E., Schratz, M. I., & Anderson, G. (1988). Second Generation CAT-ASVAB Tests:
Phase 1, Item Authoring and Review. San Diego, CA: Navy Personnel Research and Development Center.
Mislevy, R. J., & Bock, R. D. (1990). The PC-BILOG computer program. Mooresville, IN:
Scientific Software International, Inc. Lord, F. M. (1980). Applications of item response theory to practical testing problems.
Hillsdale, NJ: Erlbaum. Lord, F. M., & Novick, M. R. (1968). Statistical theories of mental test scores. Reading, MA:
Addison-Wesley.
44

Owen, R. J. (1975). A Bayesian sequential procedure for quantal response in the context of adaptive mental testing. Journal of the American Statistical Association, 70, 351-356.
Sands, W. A., & Waters, B. K. (1997). Introduction to ASVAB and CAT. In W. A. Sands, B. K.
Waters, & J. R. McBride (Eds.), Computerized Adaptive Testing: From Inquiry to Operation (pp. 3-9). Washington, DC: American Psychological Association.
Sands, W. A., Waters, B. K., & McBride, J. R. (Eds.). (1997). Computerized Adaptive Testing:
From Inquiry to Operation. Washington, DC: American Psychological Association. Segall, D. O. (1987). A procedure for smoothing discrete distributions. Unpublished manuscript.
San Diego, CA: Navy Personnel Research and Development Center. Segall, D. O. (1993, November). Score Equating Verification Analyses of the CAT-ASVAB (Draft
technical report). San Diego, CA: Navy Personnel Research and Development Center. Segall, D. O. (1997). Equating the CAT-ASVAB. In W.A. Sands, B.K. Waters, & J.R. McBride
(Eds.), Computerized adaptive testing: From inquiry to operation (pp. 181-198). Washington, DC: American Psychological Association.
Segall, D. O. (2004). Development and Evaluation of the 1997 ASVAB Score Scale. Monterey,
CA: Defense Manpower Data Center. Segall, D. O., & Moreno, K. E. (1986, March). Dimensionality of the ACAP item pools. Paper
presented at the meeting of the CAT-ASVAB Technical Committee. Segall, D. O., Moreno, K. E., & Hetter, R. D. (1997). Item pool development and evaluation. In
W.A. Sands, B.K., Waters, & J.R. McBride (Eds.), Computerized Adaptive Testing: From Inquiry to Operation (Chapter 11, pp. 117-130). Washington, DC: American Psychological Association.
Stocking, M. L., & Lord, F. M. (1983). Developing a common metric in item response theory.
Applied Psychological Measurement, 7, 201–210. Sympson, J. B., & Hetter, R. D. (1985). Controlling item exposure rates in computerized
adaptive tests. Paper presented at the Annual Conference of the Military Testing Associations. San Diego, CA: Military Testing Association.
Vale, C. D., & Gialluca, K. A. (1985). ASCAL: A microcomputer program for estimating logistic
IRT item parameters. St. Paul, MN: Assessment Systems Corporation. Wilson, D.T., Wood, R., & Gibbons, R. D. (1991). TESTFACT: Test scoring, item statistics, and
item factor analysis [Computer program]. Chicago, IL: Scientific Software International, Inc.
45

Wolfe, J. H. (1997). Enhanced computer-administered test (ECAT) battery [Special Issue]. Military Psychology, 9(1).
Zimowski, M., Muraki, E., Mislevy, R., & Bock, R. D. (2003). BILOG-MG [Computer
program]. Lincolnwood, IL: Scientific Software International, Inc.
46

Appendix A
Actual Tryout Sample Size by Test Book
47

Series Test Book # N Series Test Book # N
H AR, WK 111 2,009 M MC, EI 391 2,210
122 1,948 402 2,038
133 1,873 413 2,073
144 1,757 424 1,979
155 1,716 435 1,968
166 1,647 446 1,909
177 1,567 N MC, EI 451 2,239
J AR, WK 181 2,224 462 2,218
192 2,157 473 2,129
203 2,114 484 2,088
214 2,027 495 2,052
225 2,001 706 2,007
236 1,932 R PC, GS 501 1,887
247 1,886 512 1,818
K MK, AI 251 2,481 523 1,768
262 2,439 534 1,705
273 2,402 545 1,666
284 2,332 556 1,631
295 2,322 567 1,584
306 2,210 S PC, GS 571 2,029
317 2,217 582 1,945
L MK, SI 321 2,150 593 1,877
332 2,094 604 1,803
343 1,991 615 1,781
354 1,938 626 1,754
365 1,898 T AO 631 1,855
376 1,862 642 1,770
387 1,771 653 1,717
Total 110,465
48

Appendix B
Service-Specific Composites (2008)
49
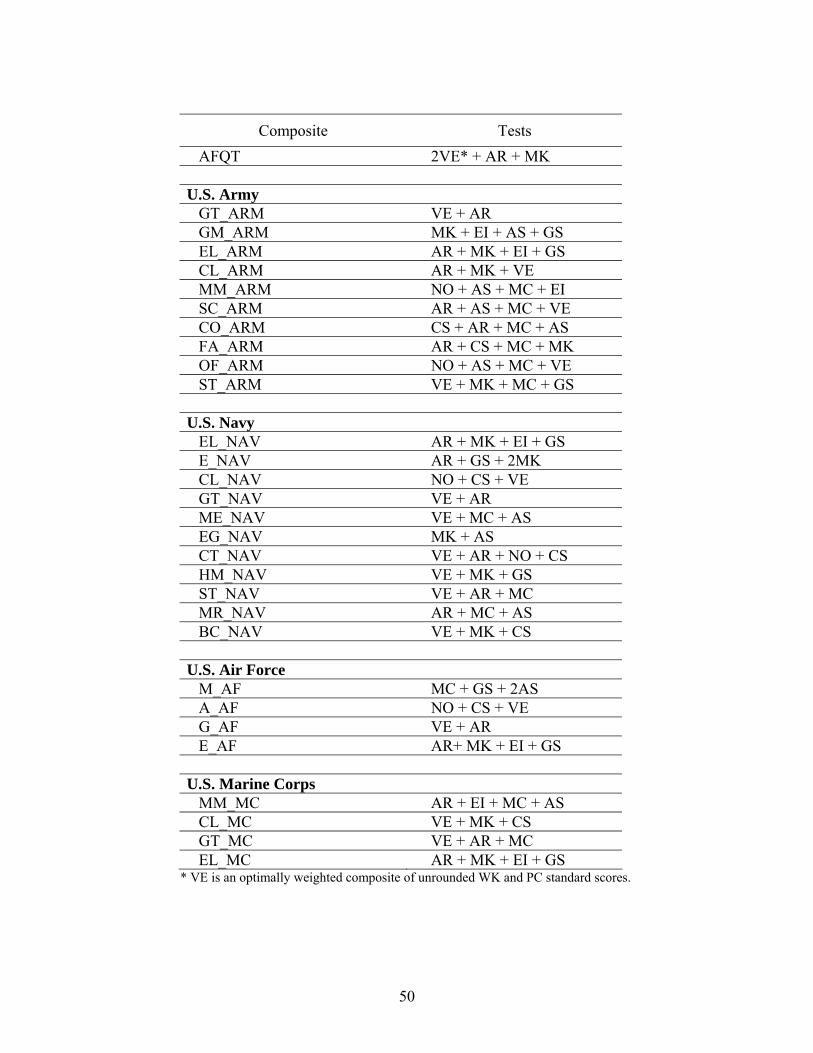
Composite Tests
AFQT 2VE* + AR + MK
U.S. Army GT_ARM VE + AR GM_ARM MK + EI + AS + GS EL_ARM AR + MK + EI + GS CL_ARM AR + MK + VE MM_ARM NO + AS + MC + EI SC_ARM AR + AS + MC + VE CO_ARM CS + AR + MC + AS FA_ARM AR + CS + MC + MK OF_ARM NO + AS + MC + VE ST_ARM VE + MK + MC + GS
U.S. Navy EL_NAV AR + MK + EI + GS E_NAV AR + GS + 2MK CL_NAV NO + CS + VE GT_NAV VE + AR ME_NAV VE + MC + AS EG_NAV MK + AS CT_NAV VE + AR + NO + CS HM_NAV VE + MK + GS ST_NAV VE + AR + MC MR_NAV AR + MC + AS BC_NAV VE + MK + CS
U.S. Air Force M_AF MC + GS + 2AS A_AF NO + CS + VE G_AF VE + AR E_AF AR+ MK + EI + GS
U.S. Marine Corps MM_MC AR + EI + MC + AS CL_MC VE + MK + CS GT_MC VE + AR + MC EL_MC AR + MK + EI + GS
* VE is an optimally weighted composite of unrounded WK and PC standard scores.
50

Appendix C
Scatter plots of Ability Estimates across Forms
51

Figure C.1. Scatter plot of ability estimates for AR across CAT Forms 3 and 4
AR CAT 3 vs CAT 4
-3
-2
-1
0
1
2
3
-4 -3 -2 -1 0 1 2 3
Theta 3
Th
eta
4
52
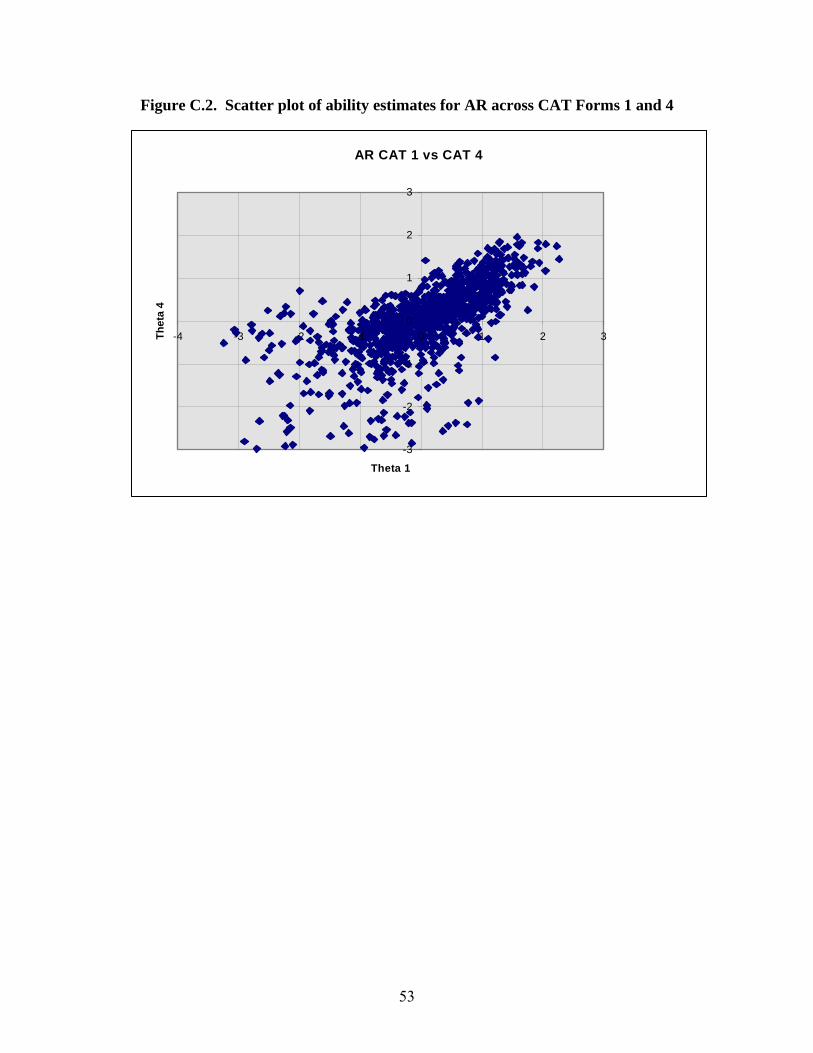
Figure C.2. Scatter plot of ability estimates for AR across CAT Forms 1 and 4
AR CAT 1 vs CAT 4
-3
-2
-1
0
1
2
3
-4 -3 -2 -1 0 1 2 3
Theta 1
Th
eta
4
53
Appendix D
Score Information Functions across Forms
54
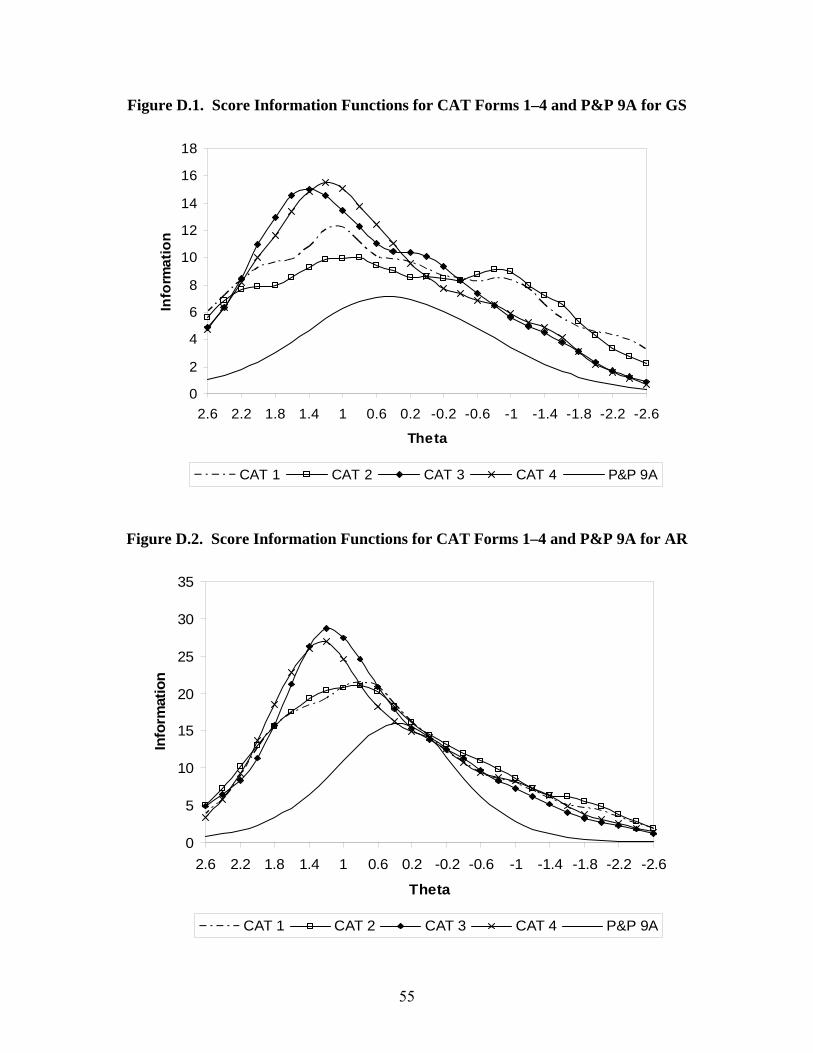
Figure D.1. Score Information Functions for CAT Forms 1–4 and P&P 9A for GS
0
2
4
6
8
10
12
14
16
18
-2.6-2.2-1.8-1.4-1-0.6-0.20.20.611.41.82.22.6
Theta
Info
rma
tio
n
CAT 1 CAT 2 CAT 3 CAT 4 P&P 9A
Figure D.2. Score Information Functions for CAT Forms 1–4 and P&P 9A for AR
0
5
10
15
20
25
30
35
-2.6-2.2-1.8-1.4-1-0.6-0.20.20.611.41.82.22.6
Theta
Info
rmat
ion
CAT 1 CAT 2 CAT 3 CAT 4 P&P 9A
55
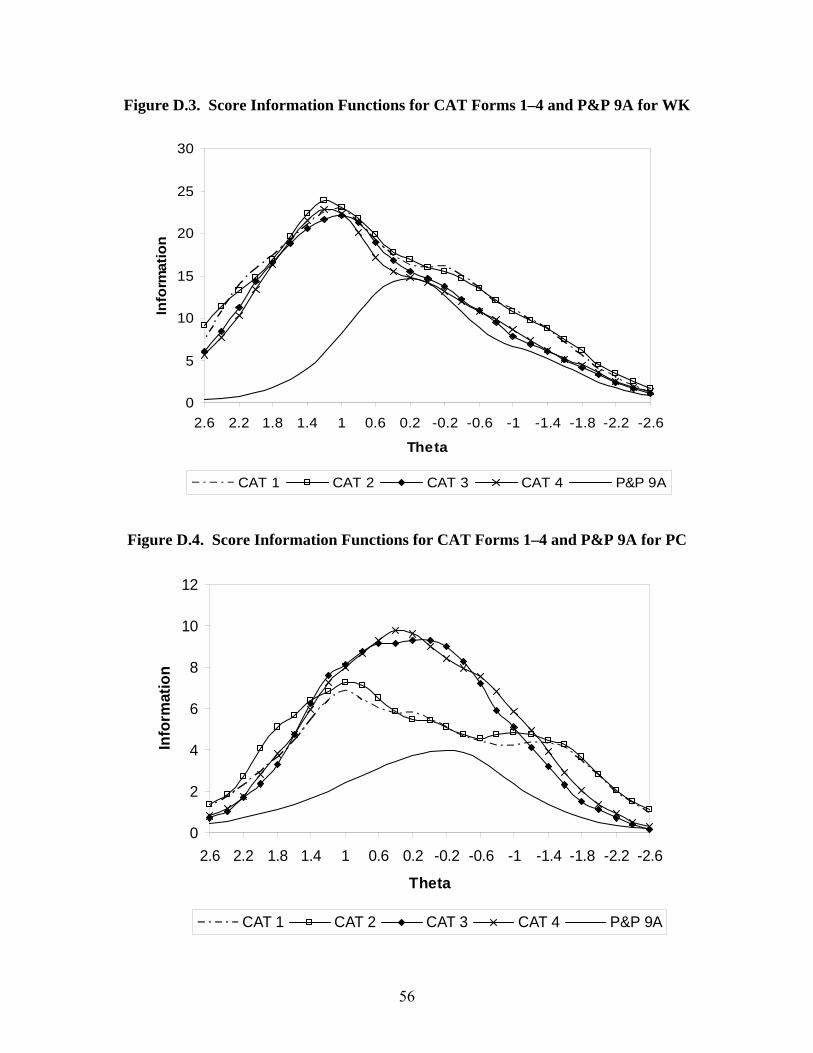
Figure D.3. Score Information Functions for CAT Forms 1–4 and P&P 9A for WK
0
5
10
15
20
25
30
-2.6-2.2-1.8-1.4-1-0.6-0.20.20.611.41.82.22.6
Theta
Info
rmati
on
CAT 1 CAT 2 CAT 3 CAT 4 P&P 9A
Figure D.4. Score Information Functions for CAT Forms 1–4 and P&P 9A for PC
0
2
4
6
8
10
12
-2.6-2.2-1.8-1.4-1-0.6-0.20.20.611.41.82.22.6
Theta
Info
rmat
ion
CAT 1 CAT 2 CAT 3 CAT 4 P&P 9A
56
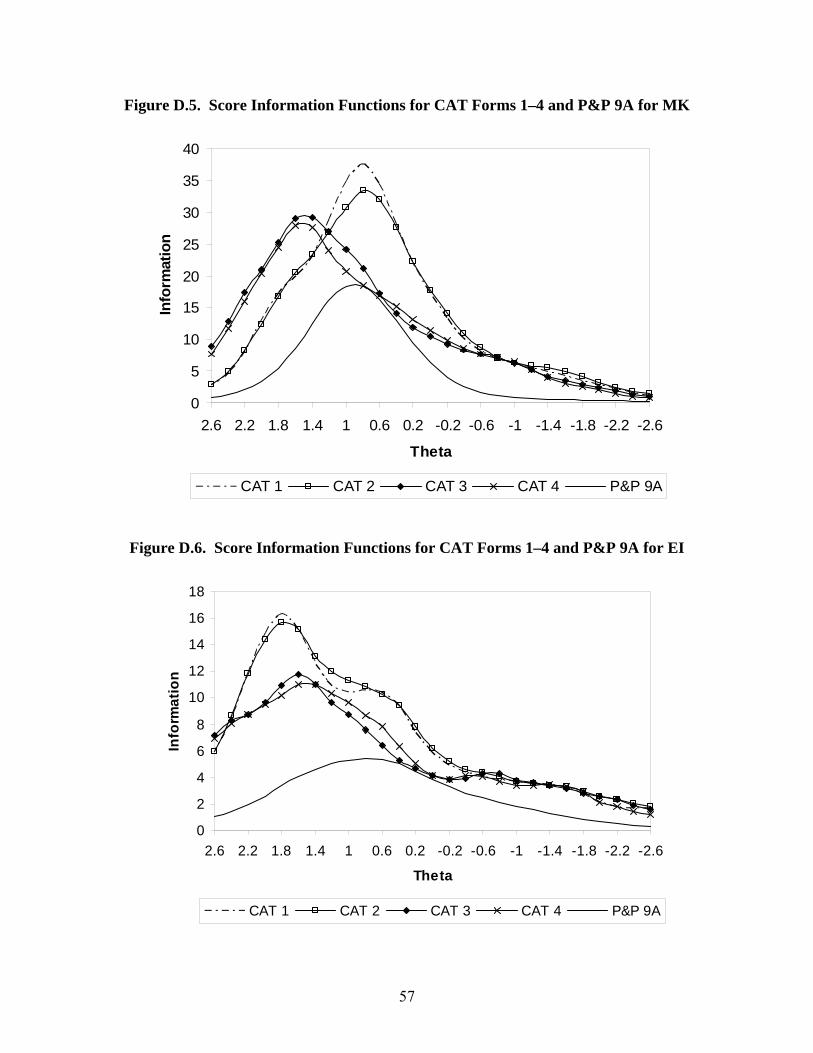
Figure D.5. Score Information Functions for CAT Forms 1–4 and P&P 9A for MK
0
5
10
15
20
25
30
35
40
-2.6-2.2-1.8-1.4-1-0.6-0.20.20.611.41.82.22.6
Theta
Info
rmat
ion
CAT 1 CAT 2 CAT 3 CAT 4 P&P 9A
Figure D.6. Score Information Functions for CAT Forms 1–4 and P&P 9A for EI
0
2
4
6
8
10
12
14
16
18
-2.6-2.2-1.8-1.4-1-0.6-0.20.20.611.41.82.22.6
Theta
Info
rma
tio
n
CAT 1 CAT 2 CAT 3 CAT 4 P&P 9A
57

Figure D.7. Score Information Functions for CAT Forms 1 – 4 and P&P 9A for AI
0
2
4
6
8
10
12
14
16
-2.6-2.2-1.8-1.4-1-0.6-0.20.20.611.41.82.22.6
Theta
Info
rma
tio
n
CAT 1 CAT 2 CAT 3 CAT 4 P&P 9A
Figure D.8. Score Information Functions for CAT Forms 1–4 and P&P 9A for SI
0
2
4
6
8
10
12
14
-2.6-2.2-1.8-1.4-1-0.6-0.20.20.611.41.82.22.6
Theta
Info
rma
tio
n
CAT 1 CAT 2 CAT 3 CAT 4 P&P 9A
58
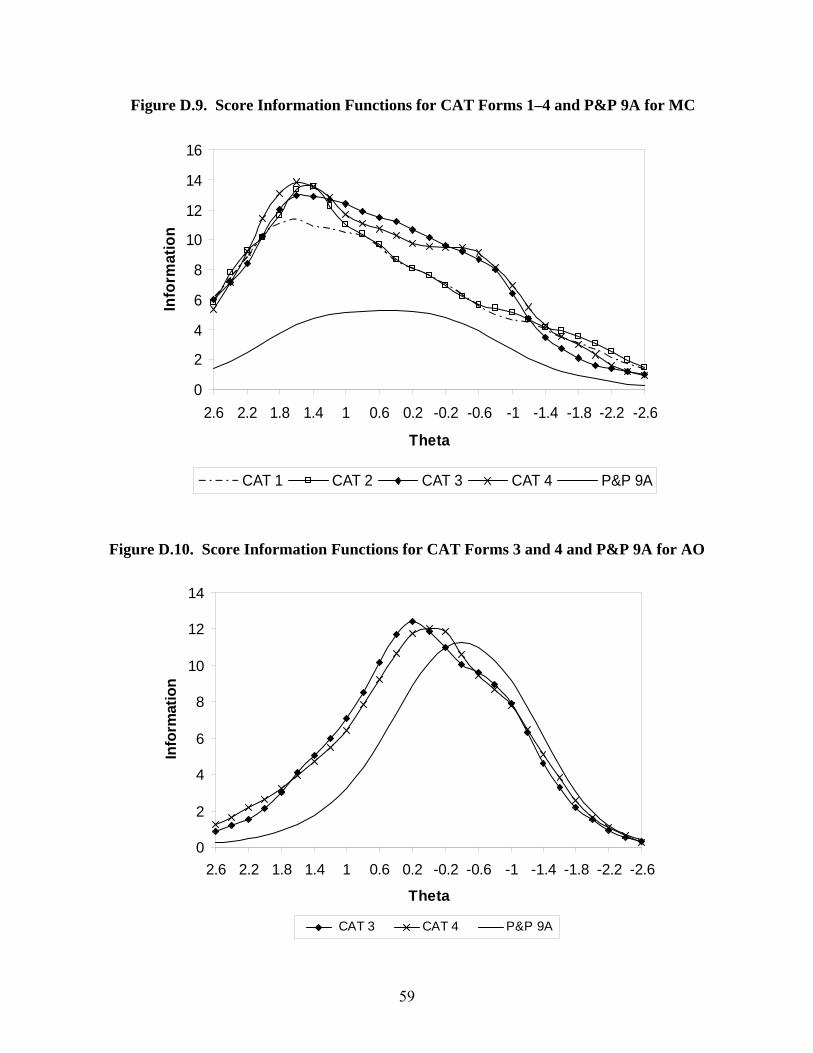
59
Figure D.9. Score Information Functions for CAT Forms 1–4 and P&P 9A for MC
0
2
4
6
8
10
12
14
16
-2.6-2.2-1.8-1.4-1-0.6-0.20.20.611.41.82.22.6
Theta
Info
rmat
ion
CAT 1 CAT 2 CAT 3 CAT 4 P&P 9A
Figure D.10. Score Information Functions for CAT Forms 3 and 4 and P&P 9A for AO
0
2
4
6
8
10
12
14
-2.6-2.2-1.8-1.4-1-0.6-0.20.20.611.41.82.22.6
Theta
Info
rmat
ion
CAT 3 CAT 4 P&P 9A


