Report ITU-R M.2283-0 (12/2013) Technical characteristics and spectrum requirements of Wireless Avionics Intra-Communications systems to support their safe operation M Series Mobile, radiodetermination, amateur and related satellite services
Transcript
Report ITU-R M.2283-0(12/2013)
Technical characteristics and spectrum requirements of Wireless Avionics
Intra-Communications systems to support their safe operation
M Series
Mobile, radiodetermination, amateurand related satellite services
ii Rep. ITU-R M.2283-0
Foreword
The role of the Radiocommunication Sector is to ensure the rational, equitable, efficient and economical use of the radio-frequency spectrum by all radiocommunication services, including satellite services, and carry out studies without limit of frequency range on the basis of which Recommendations are adopted.
The regulatory and policy functions of the Radiocommunication Sector are performed by World and Regional Radiocommunication Conferences and Radiocommunication Assemblies supported by Study Groups.
Policy on Intellectual Property Right (IPR)
ITU-R policy on IPR is described in the Common Patent Policy for ITU-T/ITU-R/ISO/IEC referenced in Annex 1 of Resolution ITU-R 1. Forms to be used for the submission of patent statements and licensing declarations by patent holders are available from http://www.itu.int/ITU-R/go/patents/en where the Guidelines for Implementation of the Common Patent Policy for ITU-T/ITU-R/ISO/IEC and the ITU-R patent information database can also be found.
Series of ITU-R Reports
(Also available online at http://www.itu.int/publ/R-REP/en)
Series Title
BO Satellite delivery
BR Recording for production, archival and play-out; film for television
BS Broadcasting service (sound)
BT Broadcasting service (television)
F Fixed service
M Mobile, radiodetermination, amateur and related satellite services
P Radiowave propagation
RA Radio astronomy
RS Remote sensing systems
S Fixed-satellite service
SA Space applications and meteorology
SF Frequency sharing and coordination between fixed-satellite and fixed service systems
SM Spectrum management
Note: This ITU-R Report was approved in English by the Study Group under the procedure detailed in Resolution ITU-R 1.
Electronic Publication Geneva, 2014
ITU 2014
All rights reserved. No part of this publication may be reproduced, by any means whatsoever, without written permission of ITU.
4.4 Wireless Avionics Intra-Communications radio interface characteristics .......... 23
4.5 Overall effective radiated power per aircraft and Wireless Avionics Intra-Communications application category ....................................................... 24
5 Spectrum requirements for Wireless Avionics Intra-Communications .......................... 26
5.1 Net average application data rate (Peff) ............................................................. 26
A-1.2 Overhead in IEEE 802.15.4 and 802.11a/g packed-oriented communications systems ................................................................................................................ 30
A-2.1 Aircraft-to-aircraft interference model ............................................................... 34
A-2.2 Aircraft model ..................................................................................................... 34
A-2.3 Distribution of Wireless Avionics Intra-Communications nodes outside the aircraft structure .................................................................................................. 35
A-3.7 Modelling aircraft fuselage attenuation in closed form ...................................... 55
Annex 4 – Overall emissions of an aircraft caused by Wireless Avionics Intra-Communications systems ............................................................................................... 57
A-4.2 Per-compartment emissions for low data rate inside Wireless Avionics Intra-Communications systems ................................................................................... 58
A-4.3 Per-area emissions for low data rate outside Wireless Avionics Intra-Communications systems ................................................................................... 63
Rep. ITU-R M.2283-0 3
Page
A-4.4 Per-compartment emissions for high data rate inside Wireless Avionics Intra-Communications systems ................................................................................... 66
A-4.5 Per-area emissions for high data rate outside Wireless Avionics Intra-Communications systems ................................................................................... 68
Annex 5 – List of acronyms ..................................................................................................... 70
4 Rep. ITU-R M.2283-0
Scope
This Report provides technical characteristics of and spectrum requirements for Wireless Avionics Intra-Communications (WAIC) systems in response to Resolution 423 (WRC-12).
It provides analysis of WAIC applications with respect to their data rate requirements and derives a methodology for estimating the consequential spectrum requirements for these applications. Furthermore, it provides an overall spectrum requirements estimate to fulfil all application requirements. The Annexes provide technical material containing information required to derive the overall spectrum requirements estimate and further information required to undertake sharing and compatibility studies.
1 Introduction
The Civil Aviation Industry is developing the future generation of aircraft. This future generation is being designed to enhance efficiency and reliability, while maintaining current required levels of safety. The use of wireless technologies in aircraft may reduce the overall weight of systems, reducing the amount of fuel required to fly and thus benefit the environment.
In addition to fuel reduction and subsequent environmental benefits, the use of Wireless Avionics Intra-Communications (WAIC) systems could reduce the complexity of aircraft design. This may improve an aircraft’s performance over its useful lifetime through more cost-effective flight operations, reduction in maintenance costs and enhancement of aircraft systems that maintain or increase the level of safety.
WAIC systems provide radiocommunication between two or more stations on a single aircraft and constitute exclusive closed on board networks required for the operation of an aircraft. WAIC systems do not provide air-to-ground, air-to-satellite or air-to-air communications and will only be used for safety-related aircraft applications.
This Report is structured as follows.
Section 2 discusses in more detail the motivation and expected benefits of WAIC enabled aircraft systems.
Section 3 introduces characteristics of WAIC applications. Given the number of possible WAIC applications, it is useful to group them according to their key characteristics (data rate and transmit antenna installation location). Hence, four application categories namely “low data rate inside (LI)”, “low data rate outside (LO)”, “high data rate inside (HI)” and “high data rate outside (HO)” are provided. These categories are referred to throughout the remainder of the Report.
Section 4 contains a description of the characteristics of WAIC systems. A reference WAIC system architecture is introduced and elements thereof are defined. Section 4.3 discusses the aspect of aircraft structural shielding characteristics and proposes shielding values per aircraft compartment. In § 4.4, WAIC system radio interface characteristics are introduced. Section 4.5 contains a methodology for calculating the overall amount of WAIC system emissions on an aircraft. These emission levels are expressed in e.i.r.p. and should be used for studies in finding appropriate frequency spectrum for WAIC systems.
Section 5 derives the spectrum requirements for WAIC applications identified in § 3 taking into account application data rate requirements, protocol overhead, channelization overhead, multiple-aircraft interference overhead as well as the efficiency of the anticipated modulation and coding scheme.
Section 6 concludes the Report and re-emphasizes the results derived.
Rep. ITU-R M.2283-0 5
2 Discussion
WAIC systems are envisioned to provide communications over short distances between aircraft stations installed on a single aircraft. WAIC systems will not provide communications, in any direction, between stations installed on one aircraft and those installed on another aircraft, terrestrial systems, or satellites. Providing sensor information wirelessly is an example of an application of WAIC systems. These sensors will be installed at various locations both within and outside the aircraft and will be used to monitor the health of the aircraft structure and its critical systems, and to communicate this information within the aircraft to a central onboard entity which can make the best use of such information. WAIC systems are also intended to support data, voice and safety related video surveillance applications such as taxiing cameras and may also include communications systems used by the crew for safe operation of the aircraft.
Points of communication will include avionics components with integrated wireless capabilities and dedicated components of the WAIC system. In all cases communication between two or more stations installed on a single aircraft is assumed to be part of an exclusive network required for the aircraft’s safe operation. WAIC systems are not intended to provide communications with consumer devices, such as radio local area network (RLAN) devices that are brought onboard the aircraft by passengers or for in-flight entertainment applications.
The scope of WAIC applications is limited to applications that relate to the safe, reliable and efficient operation of the aircraft as specified by the International Civil Aviation Organization (ICAO).
WAIC systems are envisioned to offer aircraft designers and operators many opportunities to improve flight safety and operational efficiency while reducing costs to the aviation industry and the flying public.
Some of the potential benefits of WAIC systems are described below.
2.1 Substitution of wiring
Cabling and wiring present a significant cost to the aircraft manufacturer, operator, and ultimately the flying public. Costs include the wiring harness designs, labour-intensive harness fabrication, maintenance and replacement costs of connectors, as well as the associated operating costs of flying copper and connectors that represent 2-5% of an aircraft’s weight.
Wiring harness design is one of the critical factors that determine the time required to design a new aircraft, requiring the designers to specify and determine the routes for miles of wire onboard the aircraft. This includes providing separate routing paths for redundant wiring, so that a single point failure does not affect redundant circuits, and enables safety-critical systems to be properly isolated from other system wiring. Wireless products offer solutions that can reduce the time and costs associated with wiring harness design, harness installation design, aircraft manufacturing time, and aircraft lifecycle costs. Wiring also constitutes over 50% of the instances of electromagnetic interference onboard aircraft. Wiring can act as antennas and collect unwanted energy that may impact interconnected system immunity. Wiring can also radiate energy with the risk of inducing electro-magnetic interference on surrounding systems.
As an airframe is utilized during its lifetime, it may be necessary to install new sensors to monitor portions of the aircraft structure or aircraft systems either as a result of incident or accident awareness or as a result of the availability of new types of sensing technology. On current aircraft, adding a new sensor is very expensive due to the requirements to install wiring, connections to the central processing system, and modifications to software. WAIC networks could allow new sensors to be mounted with much less difficulty and expense, and enable easier modification of systems and structural monitoring throughout the life of the aircraft, which typically exceeds 25 years.
6 Rep. ITU-R M.2283-0
2.2 Enhanced reliability
Wiring is a significant source of field failures and maintenance costs. It is extremely difficult to troubleshoot and repair such failures in aircraft system wiring which occur primarily at interface points where connectors, pins, and sockets come together. The large number of parts and the potential for human error also contribute to failure at these interface points. A wireless system may significantly reduce electrical interfaces and thus significantly increase system reliability.
Wireless technologies are intended to offer the means to implement systems that can enhance reliability. By having fewer wires on an aircraft, the need for wire maintenance to remediate chafing conditions, aging wiring and associated fire hazards is reduced, thereby improving the safety and reliability of the aircraft. Adding new sensors on an aircraft to monitor parameters such as equipment temperature around components to provide a more accurate status of equipment cooling has the potential to improve the reliability of aircraft systems. The introduction of these additional sensors has been limited due to wiring weight and cost impact, but they might be implemented using wireless technology. Aircraft data networks could also take advantage of redundant communication paths offered through mesh networks, which are not cost effective in hard-wired implementations.
Critical aircraft functions must be fault-tolerant, which leads aircraft designers to include redundant components and redundant wiring harnesses. However, the use of identical technology (in this case duplicate wiring harnesses) to provide fault tolerance can make a design susceptible to “common mode failures” such as fire or engine rotor burst. The use of a wireless link as a backup to a wiring harness introduces “redundancy through dissimilar means” that can in fact enhance reliability and safety in some critical situations, and can provide connectivity without the need for redundant wiring harnesses specific to a particular aircraft type.
2.3 Additional functions
Wireless technologies are also envisioned to provide new functionalities to aircraft manufacturers and operators. Manufacturers are provided additional installation options for previously wired systems, while operators are afforded more opportunities to monitor aircraft systems. Currently, there are few dedicated sensors for monitoring the health of aircraft systems and structure as the aircraft ages. Wireless technologies could provide additional opportunities to monitor more systems allowing for cost effective installation and operation without significantly increasing the aircraft’s weight.
Some additional functions that could be incorporated on an aircraft with wireless technology which cannot be performed with wires include engine rotor bearing monitoring. Reliably routing wiring harnesses to engine rotator bearings is impractical due to the rotation of parts. Utilizing a special sensor and transmitting this sensor information wirelessly could provide significant benefits by furnishing sensor data while the aircraft is in-flight. Another example includes onboard sensing of lightning or other environmental effects that could occur while the aircraft is in flight.
Another application field is wireless crew communications including voice, video and data crew communications. It is envisioned that flight deck crew voice and video services could provide enhanced aircraft safety by enabling the monitoring of cabin, luggage compartments and other areas in and around the aircraft. In addition, wireless technology could provide more adaptive cabin configurations and potentially more customized subsystems.
In discussing the requirements and performance of future wireless aircraft systems, it is useful to simplify the discussion by categorizing these systems according to two characteristics: data rate
Rep. ITU-R M.2283-0 7
(high and low) and installation location of the WAIC systems’ transmit antennas (inside and outside the fuselage).
FIGURE 1
Wireless Avionics Intra-Communications system categorization
3.1 Categorization process description
Each system characterized in this Report provides operational requirements for net data transmission rates per communication link, and installation locations of the associated transmit antennas (within or outside the aircraft fuselage). It is expected that most transmissions will be internal to the aircraft structure, but some applications will be operating outside at least for some of the time. Landing gear sensors, for example, will be external when the gear is extended and some structural health monitoring sensors may also be installed outside.
3.1.1 System data rate categorization
Potential wireless applications can be categorized into two broad categories corresponding to application data rate requirements. The following definitions are used for this purpose: low (L) data rate applications have data rates less than 10 kbit/s, and high (H) data rate applications have data rates above 10 kbit/s. These categorizations are signified by “L” and “H” respectively.
3.1.2 System location
Applications that are enclosed by the airplane structure (e.g. fuselage) are categorized as inside (I). Those applications that are not enclosed are categorized as outside (O).
3.1.3 Category definition
WAIC applications can be characterized by XY following the previous definitions. The parameter X represents the data rate (H, L), and the parameter Y represents the location (I, O). For example, a typical category is LI, representing an application with low data rate requirements, and located internal to the aircraft structure. Detailed descriptions of the applications in each category will be given in the following sections.
3.2 Detailed description of applications by category
In this section, each potential application is described under the category for that application.
WAIC system categorisation
Location Data rate
I (inside)
O (outside)
L (low)
H (high)
8 Rep. ITU-R M.2283-0
3.2.1 Category low data rate inside
The category of low data rate inside applications is characterized by the following main attributes:
– data rate: low (< 10 kbit/s per link);
– installation domain: inside metallic or conductive composite enclosures.
Estimates predict the number of installed LI links may be as high as 4 150 for a large passenger aircraft. However, this large number of links does not mean, that all transmissions occur simultaneously. In fact the number of simultaneously active transmitters in any given frequency range (i.e. channel) for all low data rate links is exactly one (see § 4.5 and Annex 4).
3.2.1.1 Low data rate inside category applications
The LI category includes low data rate wireless sensing and control signals, such as cabin pressure control, smoke sensors, door position sensors and monitoring of objects related to safety of passengers and crew that can be removed from the aircraft, like life vests and fire extinguishers.
Most applications of the LI category are related to monitoring or controlling slowly varying physical processes, such as cabin temperature, cabin pressure or fuel quantity. Therefore, the expected data rates are low, and transmission latency constraints are not considered an issue. The expected net average data rates range from 10 bps up to 800 bps per single data link. The net peak data rates may reach 1 kbit/s per single data link. Table 1 lists the anticipated applications of the LI category including further attributes associated with each individual application.
TABLE 1
Low data rate inside category applications
Application Type of benefit
Net peakdata rateper data-
link (kbit/s)
Net average
data rateper data-
link (kbit/s)
No. of nodes simultaneously
operational
Period of operation
New or existing
application
Cabin pressure Wire reduction 0.8 0.8 11
Park, taxi, takeoff, cruise, landing
Existing
Engine sensors Wire reduction,
maintenance enhancement
0.8 0.8 108
Park, taxi, takeoff, cruise, landing
Existing and new
Smoke sensors (unoccupied
areas)
Wire reduction, maintenance enhancement,
safety enhancement
0.1 0.1 30
Park, taxi, takeoff, cruise,
landing, taxi
Existing
Rep. ITU-R M.2283-0 9
TABLE 1 (continued)
Application Type of benefit
Net peakdata rateper data-
link (kbit/s)
Net average
data rateper data-
link (kbit/s)
No. of nodes simultaneously
operational
Period of operation
New or existing
application
Smoke sensors (occupied
areas)
Wire reduction, flexibility
enhancement safety
enhancement
0.1 0.1 30
Park, taxi, takeoff, cruise, landing
Existing
Fuel tank/line sensors
Wire reduction, safety
enhancement, flexibility
enhancement, maintenance enhancement
0.2 0.2 80
Park, taxi, takeoff, cruise,
landing, taxi
Existing
Proximity sensors,
passenger and cargo doors,
panels
Wire reduction, safety
enhancement, operational
enhancement
0.2 0.02 60
Park, taxi, takeoff, cruise,
landing, taxi
Existing
Sensors for valves and
other mechanical
moving parts
Wire reduction, operational
enhancement 0.2 0.2 100
Park, taxi, takeoff, cruise,
landing, taxi
Existing and new
ECS sensors Wire reduction,
operational enhancement
0.5 0.05 250
Park, taxi, takeoff, cruise, landing
Existing and new
EMI detection sensors
Safety enhancement
1.0 0.01 30 Park, taxi New
Emergency lighting control
Wire reduction, flexibility
enhancement 0.5 0.1 130
Park, taxi, takeoff, cruise, landing
Existing
Aircraft lighting control
Wire reduction, flexibility
enhancement 0.5 0.1 1 000
Park, taxi, takeoff, cruise, landing
Existing
Cabin removables inventory
Operational improvement
0.1 0.01 1 000 Park New
Cabin monitoring
Wire reduction, flexibility
enhancement 0.5 0.05 500
Park, taxi, takeoff, cruise, landing
Existing and new
10 Rep. ITU-R M.2283-0
TABLE 1 (end)
Application Type of benefit
Net peakdata rateper data-
link (kbit/s)
Net average
data rateper data-
link (kbit/s)
No. of nodes simultaneously
operational
Period of operation
New or existing
application
Structural sensors
Wire reduction, flexibility
enhancement, safety
enhancement
0.5 0.3 300
Park, taxi, takeoff, cruise, landing
New
Temperature/ humidity for
corrosion detection
Wire reduction, safety
enhancement, operational
enhancement
0.1 0.01 260
Park, taxi, takeoff, cruise, landing
Existing and new
Electrical power
distribution, control and monitoring
Wire reduction, operational
enhancement 0.1 0.01 250
Park, taxi, takeoff, cruise, landing
Existing and new
Totals: 1 420.2* 394.3* 4 139
* The total net peak and average per data-link data rates are the sum of all individual per data-link rates times the corresponding number of simultaneously operational nodes.
3.2.1.2 Installation environment within the aircraft structure
All applications of the LI category are anticipated to operate within the aircraft structure.
3.2.1.3 Additional category characteristics
The expected required communication range for LI applications will vary up to several tens of meters, depending on the installation locations of the RF-transceivers and network topology. Propagation conditions are expected to be dominated by non-line-of-sight (NLOS) paths, because most of the RF-transceivers are likely to be mounted in hidden locations.
Most of the LI RF-transceiver nodes will be operational during all flight phases and on the ground, including during taxiing. However, some of the applications, such as cabin removable inventory, may only be operational for a short period on the ground, while the aircraft is in park. Other applications such as structural sensors or cameras installed outside the fuselage are expected to have reduced data rate requirements while the aircraft is in park. These operational characteristics are later taken into account when deriving the overall spectrum requirements for WAIC systems (see § 5 and Annex 2).
Note that engine sensors are listed both in the LI category and in the LO category. Those sensors are considered “Inside” only when the nacelle is made of metallic material or some other material that provides EMI attenuation similar to metal.
3.2.2 Category low data rate outside
The low data rate outside category of applications is characterized by the following main attributes:
Estimates predict the number of installed LO links may be as high as 400 for a large passenger aircraft. However, this large number of links does not mean, that all transmissions occur simultaneously. In fact the number of simultaneously active transmitters in any given frequency range (i.e. channel) for all low data rate links is exactly one (see § 4.5 and Annex 4).
3.2.2.1 Low data rate outside category applications
The LO category includes applications from the domain of low data rate wireless sensors for monitoring parameters such as temperature, pressure, humidity, corrosion, structural stress, and proximity. Applications such as wheel speed sensing for anti-skid control, wheel position sensing for steering control, or engine parameter sensing for engine monitoring and control are included. The net average data rates are expected to range from 20 bps up to 8 kbit/s per single data link.
Table 2 lists the anticipated applications of the LO category including further attributes associated with each application.
TABLE 2
Low data rate outside category applications
Application Type of benefit
Net peakdata rateper data-
link (kbit/s)
Net average
data rateper data-
link (kbit/s)
No. of nodes simultaneously
operational
Period of operation
New or existing
application
Ice detection Operational and
safety enhancement
0.5 0.5 20
Park, taxi, takeoff, cruise, landing
Existing and new
Landing gear (proximity)
sensors
Wire reduction, flexibility
enhancement 0.2 0.2 30
Park, taxi, takeoff, cruise, landing
Existing
Landing gear sensors, tire pressure, tire
and brake temperature and
hard landing detection
Wire reduction, flexibility and
operational enhancement
1.0 1.0 100 Park, taxi,
takeoff, landing
Existing
Landing gear sensors, wheel speed for anti-
skid control and position
feedback for steering
Wire reduction, flexibility and
operational enhancement
5.5 5.5 40 Park, taxi,
takeoff, landing
Existing
12 Rep. ITU-R M.2283-0
TABLE 2 (end)
Application Type of benefit
Net peakdata rateper data-
link (kbit/s)
Net average
data rateper data-
link (kbit/s)
No. of nodes simultaneously
operational
Period of operation
New or existing
application
Flight control system sensors,
position feedback and
control parameters
Wire reduction, flexibility
enhancement 8.0 8.0 60
Park, taxi, takeoff, cruise, landing
Existing
Additional proximity
sensors, aircraft doors
Wiring reduction, flexibility
enhancement
0.2 0.02 50
Park, taxi, takeoff, cruise, landing
Existing
Engine sensors
Engine performance,
wire reduction, flexibility
enhancement
0.8 0.8 32
Park, taxi, takeoff, cruise, landing
Existing and new
Cargo compartment
data
Wire reduction, operational
enhancement 0.5 0.05 25
Park, taxi, takeoff, cruise,
landing, taxi
Existing
Structural sensors
Wire reduction, flexibility
enhancement, safety
enhancement
0.5 0.3 40
Ground, takeoff, cruise,
landing, taxi
New
Totals: 884.1* 855.9* 397
* The total net peak and average per data-link data rates are the sum of all individual per data-link rates times the corresponding number of simultaneously operational nodes.
3.2.2.2 Installation environment outside the aircraft structure
All applications of the LO category are assumed to operate outside the aircraft structure. Therefore, they do not, in most cases, benefit from fuselage attenuation (see § 4.3 and Annex 4). A significant number of transceiver nodes for LO category applications may be mounted on the landing gear and in the wheel wells which will be operating outside the aircraft when the landing gear is deployed.
Other LO applications may be mounted on exposed areas of the wing where data may be transmitted to and from flight control sensors and actuation devices. These types of devices are typically mounted near the leading and trailing edges of the wings and are exposed when the slats, flaps, spoilers or ailerons are moved.
Rep. ITU-R M.2283-0 13
3.2.2.3 Additional category characteristics
The transmissions range for LO applications will vary between several meters to several tens of meters, depending on the installation locations of the RF-transceivers and the network topology. It is envisioned that some applications will transmit while the aircraft is in close proximity to other aircraft that are also transmitting. Furthermore, propagation conditions for some applications will be dominated by NLOS paths.
Note that engine sensors are listed both in the LO and LI categories and are considered “Outside” when the nacelle is made of composite material or some other non-metallic material that does not provide EMI attenuation similar to metal.
3.2.3 Category High data rate Inside
The category of High data rate Inside (HI) applications is characterized by the following main attributes:
– data rate: high (> 10 kbit/s per link);
– installation domain: inside aircraft structure.
Estimates predict the number of installed HI links may be as high as 125 for a large passenger aircraft, of which around 80 links may be simultaneously operational. However, this does not mean, that all transmissions occur simultaneously. In fact the number of simultaneously active transmitters in any given frequency range (i.e. channel) for all high data rate links is exactly one (see § 4.5 and Annex 4).
3.2.3.1 High data rate Inside category applications
The HI category includes applications such as flight deck and cabin crew communications, still-frame and video imagery, high data rate engine sensors or avionics data bus communications throughout the aircraft. The expected net average data rates range from 12.5 kbit/s up to 1.6 Mbit/s per single data link. The net peak data rates may reach 4.8 Mbit/s per single data link. Many HI applications are expected to use adaptable data rates to better utilize the available spectrum resources.
Table 3 lists the anticipated applications of the HI category, including further attributes associated with each individual application.
14 Rep. ITU-R M.2283-0
TABLE 3
High data rate Inside category applications
Application Type of benefit
Net peak data rate per data-
link (kbit/s)
Net average
data rate per data-
link (kbit/s)
No. of nodes simultaneously
operational
Period of operation
New or existing
application
Avionics comm. bus
Wire reduction, flexibility
enhancement, safety
enhancement
500 500 15
Park, taxi, takeoff, cruise, landing
Existing
Air data sensors
Wire reduction,
maintenance enhancement
100 100 8
Park, taxi, takeoff, cruise, landing
Existing
FADEC aircraft
interface
Wire reduction,
maintenance enhancement
12.5 12.5 10
Park, taxi, takeoff, cruise, landing
Existing
Engine prognostic
sensors
Wire reduction, operational
enhancement
4 800 80 30
Park, taxi, takeoff, cruise, landing
New
Flight deck and cabin crew voice
Wire reduction, untethered operation, operational
enhancement
16 16 10
Park, taxi takeoff, cruise, landing
Existing and new
Flight deck and cabin crew still imagery
Wire reduction, flexibility
enhancement safety
enhancement
1 600 1 600 2*
Park, taxi, takeoff, cruise, landing
New
Flight deck and cabin
crew motion video
Wire reduction, flexibility
enhancement safety
enhancement
1 000 1 000 4**
Park, taxi, takeoff, cruise, landing
New
Rep. ITU-R M.2283-0 15
TABLE 3 (end)
Application Type of benefit
Net peak data rate per data-
link (kbit/s)
Net average
data rate per data-
link (kbit/s)
No. of nodes simultaneously
operational
Period of operation
New or existing
application
Flight-Operations
related digital data
Wire reduction, flexibility
enhancement
1 000 100 2
Park, taxi, takeoff, cruise, landing
New
Total figures: 161 785*** 18 385*** 81
* Up to 50 cameras may be present on the aircraft, but only two of those may be transmitting still images simultaneously at any given time.
** Up to 50 cameras may be present on the aircraft, but only four of those may be transmitting video information simultaneously at any given time.
*** The total net peak and average per data-link data rates are the sum of all individual per data-link rates times the corresponding number of simultaneously operational nodes.
3.2.3.2 Installation environment inside the aircraft structure
Environment within the aircraft structure HI category applications are assumed to operate within the aircraft structure. Transmitters within engine nacelles are considered as belonging to this category. Other fixed transmitter devices will be installed in different compartments, such as the flight deck, cabin, luggage bays, equipment bays, etc.
3.2.3.3 Additional category characteristics
The expected required communications range for HI applications will vary between around one meter and several tens of meters. Propagation conditions are expected to be dominated by line-of-sight (LOS) paths in the cabin environment, and NLOS paths for other areas of the aircraft.
3.2.4 Category High data rate Outside
The category of High data rate Outside (HO) applications is characterized by the following main attributes:
Estimates predict the number of installed HO links may be as high as 65 for a large passenger aircraft of which around 58 links may be simultaneously operational. However, this does not mean, that all transmissions occur simultaneously. In fact the number of simultaneously active transmitters in any given frequency range (i.e. channel) for all high data rate links is exactly one (see § 4.5 and Annex 4).
3.2.4.1 High data rate Outside category applications
The HO category includes applications from the domain of high data rate sensing and control signals, such as structural health monitoring sensors employing e.g. ultrasonic technology or accelerometers. Both of these sensor types usually require a high sampling rate and data resolution yielding a corresponding data rate demand. It also includes applications from the domain of voice and video data transfer for flight deck crew communications and for external imaging. The net average data rates are expected to range from 45 kbit/s up to 1 Mbit/s per single data link. Table 4
16 Rep. ITU-R M.2283-0
lists the anticipated applications of the HO category including attributes associated with each individual application.
TABLE 4
High data rate Outside category applications
Application Type of benefit
Net peak data rate per data-
link/ (kbit/s)
Net average
data rate per data-
link/ (kbit/s)
No. of nodes simultaneously
operational
Period of operation
New or existing
application
Avionics comm. bus
Wire reduction, flexibility
enhancement, safety
enhancement
500 500 15
Park, taxi, takeoff, cruise, landing
Existing
Structural sensors
Wire reduction, flexibility
enhancement, safety
enhancement
45 45 40
Park, taxi, takeoff, cruise, landing
New
External imaging sensors
(cameras, etc.)
Wire reduction, flexibility
enhancement, safety
enhancement
1 000 1 000 31
Park, taxi, takeoff, landing,
taxi
Existing
Total figures: 12 300* 12 300* 58
* The total net peak and average per data-link data rates are the sum of all individual per data-link rates times the corresponding number of simultaneously operational nodes.
3.2.4.2 Installation environment outside the aircraft structure
Applications of the HO category are assumed to operate outside the aircraft structure. Transceivers installed at different locations outside the aircraft could cause mutual interference.
3.2.4.3 Additional category characteristics
The expected required communications range for HO applications will vary between around one meter and several tens of meters. Propagation conditions are expected to be dominated by LOS paths.
1 Up to 10 cameras may be present on the aircraft, but only three of those may be transmitting video information simultaneously at any given time.
Rep. ITU-R M.2283-0 17
4 Wireless Avionics Intra-Communications system characteristics
4.1 Reference aircraft
A typical passenger aircraft is assumed as the reference for the considerations made in this Report. From the standpoint of a radio network aiming at providing coverage to all areas of the aircraft (inside and outside), the aircraft can be considered as an ensemble of different compartments, which are more or less mutually isolated from RF-signal perspective. Figure 2 depicts an exploded view of such an aircraft type including names for the various components and compartments. These definitions will be used hereafter.
A typical passenger aircraft is partitioned into the following major compartments:
– flight deck;
– cabin compartment;
– auxiliary power unit (APU) compartment;
– avionics compartment;
– forward cargo compartment;
– aft cargo compartment;
– bilge;
– nacelles;
– centre tank;
– wing fuel tanks;
– vertical and horizontal stabilizers;
– main landing gear wheel wells;
– nose landing gear wheel wells;
– slats and flaps stowage compartments.
18 Rep. ITU-R M.2283-0
FIGURE 2
Major components of a typical passenger aircraft and location of compartments
4.2 Reference Wireless Avionics Intra-Communications (WAIC) system architecture
4.2.1 Network components
The Wireless Avionics Intra-Communications (WAIC) system architecture as defined and described throughout the following comprises the following components:
− network node; a WAIC network entity capable of connecting and communicating to another WAIC network entity using a radio interface. In the given context a network node is always equipped with a transceiver utilizing radio spectrum, when operational. A network node may also provide one or several wired interface(s) allowing it to interface to entities outside the WAIC radio network;
− gateway node; a network node connecting the WAIC radio network (or parts thereof) to other generally wired onboard networks such as an avionics communications network onboard an aircraft;
− end node; a network node capable of providing a connection between the gateway node and a sensor, actuator or display using the WAIC radio interface. Physically the end node may contain the sensor, actuator or display or it may provide suitable electrical interfaces allowing them to be attached;
− transceiver node; this term is used interchangeably with the term network node, when it is necessary to stress the fact that a node is utilizing radio frequency spectrum, the term transceiver node is preferred over the term network node.
4.2.2 Generic network architecture for internal Wireless Avionics Intra-Communications applications (low and high data rate inside)
It is anticipated that radio coverage within the aircraft structure is provided via wireless sub-networks each consisting of a gateway node and one or more end nodes. Each of the compartments is equipped with at least one gateway node serving all end nodes within the coverage area of that gateway node. Propagation measurements (see Annex 3) in different areas of the aircraft have indicated that signal attenuation caused by bulkheads or even cabin furnishings such as galley
flight deck
cabin compartment
APU compartment
avionics compartment
fwd cargo compartment
aft cargo compartment
bilge
nacelles
center tank
wing fuel tanks
vertical stabilizer
main landing gear wheel wellsnose landing wheel well
slats & flaps stowage compartments
bulk cargo compartment
horizontal stabilizer
Rep. ITU-R M.2283-0 19
installations is usually too high to allow a gateway node to serve compartments other than the compartment where it is located. Small compartments, such as the flight deck or the avionics equipment bay may require only a single gateway node, whereas larger compartments, e.g. the passenger cabin may require several. Figure 3 depicts the generic network topology for serving the end nodes located within compartments inside the aircraft’s structure. This generic network topology is used as reference for assessing spectrum requirements for all WAIC applications which make use of transceiver nodes installed within the aircraft structure and which are shielded to the outside.
FIGURE 3
Generic network topology of a network of WAIC systems installed within compartments inside the aircraft structure
4.2.3 Generic network architecture for external Wireless Avionics Intra-Communications applications (low and high data rate outside)
For radio coverage outside of the aircraft structure, antennas are installed in appropriate locations from which an attached gateway node can reach all end nodes associated with it. There may for instance be a gateway node antenna installed on the top of the aircraft fuselage. From this position, locations at the extremities of the aircraft, the wing tips, the vertical and horizontal tail planes and the like are in sight. Likewise, gateway node antennas might be installed within the wheel wells to make connections to end nodes located on the landing gear. Figure 4 provides a generic network topology for this case. This generic network topology is used to assess WAIC spectrum requirements for those applications making use of transceiver nodes installed outside of the aircraft’s structure and which hence are not shielded to the outside. Figures 5 and 6 provide in addition possible installation scenarios for gateway nodes as well as end nodes.
Cen
tral
Ser
ver
20 Rep. ITU-R M.2283-0
FIGURE 4
Generic network topology of a network of WAIC systems installed outside of the aircraft structure
FIGURE 5
Example installation locations of WAIC transceivers outside the aircraft structure (aircraft top view)
Cen
tral
Serv
er
... ......
Rep. ITU-R M.2283-0 21
FIGURE 6
Example installation locations of WAIC transceivers outside the aircraft structure (aircraft bottom view/landing gear)
4.3 Aircraft shielding characteristics
Depending on the installation location of WAIC Gateway and End Node transmit antennas and the surrounding material, WAIC signals will experience different levels of attenuation when travelling through the aircraft fuselage and skin. For WAIC transmit antenna locations outside the aircraft structure, a certain aircraft shielding factor caused by shadowing through, for example the wings and engine nacelles can be applied. In this section, assumptions for this transmit antenna location-specific attenuation are provided.
4.3.1 Wireless Avionics Intra-Communications systems inside the aircraft structure
Aircraft fuselage attenuation values differ due to variations in the aircraft type and configuration, the measurement frequency range and the type of measurement e.g. near field or far field (referred to the aircraft’s size).
In general, fuselage attenuation of any given aircraft is not a constant but rather is a directional property of the aircraft. To reflect this fact, ECC Report 175 introduces different attenuation values for different viewing angles of the aircraft. This concept is also used in this Report and summarized in Table 5. Furthermore, all measurements consistently show that the attenuation in front and rear direction (nose-on and tail-on configuration), which statistically is the most common orientation between an aircraft in flight and a terrestrial station, is significantly higher than the average value over all viewing angles. The difference can easily exceed 30 dB.
The dominant leakage mechanism for WAIC signals originating from within the fuselage is through the cabin windows. Therefore, systems which are located within the passenger cabin areas experience less attenuation than systems which are located in enclosed compartments and ones located below the passenger cabin, such as the bulk cargo compartments, bilge, fuel tanks, etc. Thus two configurations are given for systems located within the fuselage, as shown in Table 5. Furthermore, the signals emanating from windows tend to experience significant directional attenuation with increasing attenuation as one moves away from broadside (see Fig. 5), so viewing
22 Rep. ITU-R M.2283-0
angle dependence is also introduced. Since it is possible for new aircraft to include shielding material in the windows, this case should also be considered.
Systems located outside the body of the aircraft may also be partially shielded by their placement on the aircraft in one or more directions. Shielding for exterior systems needs to be considered across the range of viewing angles on a case by case basis for each region of installed systems.
The attenuations given in Table 5 are derived using the measurements described in Annex 3 and are applicable to WAIC carrier frequencies above approximately 1 GHz.
The models for cabin-to-exterior and lower-lobe-to-exterior described in Annex 3 are similar to free space propagation plus bulk attenuation. Values for the bulk attenuation based on these models are shown in Table 5.
TABLE 5
Representative structural shielding properties for sharing and compatibility studies
Case Viewing Angle Configuration Attenuation
1
viewed from angel within range A1
(+/–60° relative to yaw axis)
viewed from angle within range B1
(+/–60° relative to yaw axis)
a) transmitters installed within cabin
25 dB
b) transmitters installed in lower lobe of aircraft fuselage
35 dB
c) transmitters installed in enclosed compartments or in aircraft fitted with shielded windows
35 dB
2
viewed from angle within range A2
(+/–30° relative to pitch axis)
viewed from angle within range C1
(+/–60° relative to pitch axis)
a) transmitters installed within cabin
10 dB
b) transmitters installed in lower lobe of aircraft fuselage
30 dB
c) transmitters installed in enclosed compartments or in aircraft fitted with shielded windows
35 dB
Rep. ITU-R M.2283-0 23
TABLE 5 (end)
Case Viewing Angle Configuration Attenuation
3
viewed from angle within range B2
(+/–30° relative to roll axis)
viewed from angle within range C2
(+/–30° relative to roll axis)
a) transmitters installed within cabin
45 dB
b) transmitters installed in lower lobe of aircraft fuselage
45 dB
c) transmitters installed in enclosed compartments or in aircraft fitted with shielded windows
45 dB
4 – –
a) transmitters installed in partly shielded external aircraft areas
5 dB
b) transmitters installed in unshielded external areas
0 dB
4.4 Wireless Avionics Intra-Communications radio interface characteristics
Table 6 summarizes the technical characteristics of WAIC systems. In general two types of systems are envisaged which are tailored to the requirements of (a) low data rate and often energy limited WAIC applications such as autonomous sensors and (b) high data rate applications with less restrictions regarding energy consumption. These system types are referred to as low data rate and high data rate systems, respectively.
TABLE 6
Technical characteristics for WAIC low and high data rate systems
Low data rate
systems High data rate
systems Reference to
section Units
Total net average data rate per aircraft
1.25 30.7 3 Mbit/s
Total net peak data rate per aircraft
2.3 174.1 3 Mbit/s
Overall spectrum requirements 511 941 5.6 MHz
Spectrum requirements per aircraft
352 532 5.6 MHz
number and location of simultaneously active transmitters per channel
1 1 4.5 –
Antenna gain (RX and TX)3 0 0 – dBi
24 Rep. ITU-R M.2283-0
TABLE 6 (end)
Low data rate
systems High data rate
systems Reference to
section Units
Max. transmission power4 10 50 – mW
3-dB emission bandwidth 2.6 16.6 – MHz
20-dB emission bandwidth 6 22 – MHz
40-dB emission bandwidth 12 60 – MHz
Receiver IF-bandwidth 2.6 20 – MHz
Thermal noise floor (kBT)5 –110 –101 – dBm
Receiver noise figure 10 10 – dB
Receiver noise floor5 –100 –91 – dBm
Required signal-to-noise ratio6 9 14 – dB
Receiver sensitivity –91 –77 – dBm
Protection criterion (I/S) –9 –14 – dB
Maximum distance between external WAIC transmitter and receiver4
15 15 meter
1 Values take into account protocol and security overhead as well as a certain overhead factor required to resolve interference situations in areas of high aircraft density such as airports.
2 Values reflect spectrum requirements assuming a single aircraft and no mutual interference with other WAIC system equipped aircraft.
3 Directive antennas with gains larger than 0 dBi in the mainbeam direction and consequential negative gains outside the main beam may be applied. In these cases, the antenna main beams are pointed towards the centre of the aircraft. This will enable the reduction of the overall emissions of the aircraft.
4 These values are technical upper limits. Lower values are generally possible at the cost of cell size and increased number of required cells to appropriately cover the aircraft.
5 Applicable for T = 293 Kelvin. 6 Value assumes using the 12 Mbit/s employing QPSK and code rate ½ forward error correction.
4.5 Overall effective radiated power per aircraft and Wireless Avionics Intra-Communications application category
An aircraft equipped with WAIC systems could contain the maximum number of low data rate transmitters as expressed in Tables 1 and 3. However, only a small fraction of these transmitters will be simultaneously transmitting. A general assumption is that the access to the transmission medium is centrally organized by a relatively small number of dedicated nodes, called “Gateway Nodes (GNs)”. These GNs are distributed throughout the aircraft to enable adequate radio coverage.
Any given frequency range occupied by one of the GNs will not be reused onboard the same aircraft. Therefore, onboard one aircraft, any frequency range (RF-channel) will be used only once per low data rate and high data rate category, respectively. To determine the worst-case e.i.r.p. emitted from the aircraft, for the purpose of sharing and/or compatibility studies, the characteristics of the incumbent service or application has to be considered, in particular its effective receiver bandwidth (IF-bandwidth). If for instance the incumbent system has a receiver bandwidth of same size as the transmission bandwidth of the WAIC system, only the emissions of that GN generating the highest e.i.r.p. into the direction relevant for the particular interference geometry under study have to be taken into account. If the receiver bandwidth of the incumbent system is larger than the
Rep. ITU-R M.2283-0 25
WAIC system’s transmission bandwidth then the emissions of multiple GNs may coincide into the incumbent system’s receive band. To consider the worst-case it should be assumed, that the emissions of those GNs having the strongest e.i.r.p. combine within the incumbent receiver’s bandwidth.
The effective aggregate power potentially having an influence on an incumbent system is determined according to the following procedure:
1) Determine aggregate net average data rate per compartment or aircraft area RC (sum average rate over all applications in compartment):
= ∑ ( ∙ ) (1)
with:
RL: net average data rate per data-link
NL: no. of simultaneously operational nodes (links) per compartment.
2) Determine number of required simultaneously active transmitters per compartment or aircraft area NTX: The assumption is that the GN controls the medium access and allows only exactly one End Node to transmit. This means, that the number of required GNs per compartment is equal to the number of simultaneously active transmitters per compartment.
= (2)
with:
Rchannel: net throughput achievable per RF-channel.
= ∙ (3)
with:
Wchannel: 3 dB emission bandwidth (see § 4.4)
α: protocol overhead factor in (see § 5.2)
η: modulation efficiency in bit/s/Hz (see § 5.5).
3) Determine the duty factor D of simultaneously active transmitters per compartment or aircraft area (percentage of time transmitters are active):
= ∙ (4)
4) Determine e.i.r.p. per channel and compartment or aircraft area PC_channel in dBm:
= 10log10( ∙ ) + − (5)
with:
PTX: transmission power of WAIC system transmitter in mW (see § 4.4)
GTX: maximum TX antenna gain in dB (see § 4.4)
Afuselage: fuselage shielding factor effective in the direction of the incumbent system in dB (see § 4.3).
5) Determine e.i.r.p. density per compartment or aircraft area SC in dBm/MHz:
= + 10log10 (6)
with:
Wchannel: 3 dB emission bandwidth in MHz (see § 4.4).
26 Rep. ITU-R M.2283-0
The effective e.i.r.p. levels generated per each compartment or aircraft area were calculated for all WAIC application categories according to the above procedure. They are provided in Annex 4 and should be used for any sharing and compatibility studies.
5 Spectrum requirements for Wireless Avionics Intra-Communications
This section provides calculations of the total spectrum required to support both low data rate and high data rate WAIC applications. The following parameters are considered in the calculation and are described in subsequent paragraphs:
− Net average application data rate (Peff);
− Protocol overhead factor (α);
− Channelization overhead factor (β);
− Multiple aircraft factor (m);
− Modulation Efficiency (η).
5.1 Net average application data rate (Peff)
Estimated data rates for WAIC applications are summarized in § 3.2 of this Report and repeated in Table 7 below. The values in the table below represent the sum of the average data rate for each application (Net average data rate per data link × number of nodes):
TABLE 7
Aggregate net average data rates per application category
Application Category Peff (kbit/s)
Low data rate/Inside (LI) 394
Low data rate/Outside (LO) 856
Low data rate TOTAL 1 250
High data rate/Inside (HI) 18 385
High data rate/Outside (HO) 12 300
High data rate TOTAL 30 685
5.2 Protocol overhead factor (α)
The protocol overhead factor is a figure that takes into account all protocol overhead including physical layer, medium access control layer and above. This can also be characterized as a ratio of gross data rate to application-layer data rate (or “goodput”). This factor accounts for overhead contribution e.g. from preamble sequences for synchronization, frame headers, cyclic redundancy checksums, error-correction codes, and security and authentication information (i.e. the message authentication code). This overhead is significant for low data rate WAIC systems, because data is transmitted in packets carrying often only a few information bytes along with all the above mentioned overhead. The message authentication code is one of the main contributors to the overall protocol overhead, which is also added to each data packet in order to allow the receiver to identify data packets which may be forged by an attacker. To prevent brute force attacks, the usual length of the message authentication code in state-of-the art information technology is 256 bits. Considering that the maximum packet transmission rate in aircraft wireless sensor networks limits the speed at which a brute force attack can successfully break the message authentication code and that the
Rep. ITU-R M.2283-0 27
maximum time of such an attack is limited to the maximum duration of a long-haul flight (below 18 hours), a 128-bit message authentication is assumed to provide sufficient protection. Annex 1 of this Report describes how the values in Table 8 below were selected.
TABLE 8
Protocol overhead factors for low and high data rate applications
Application category Protocol overhead factor
(α)
Low data rate 1.38
High data rate 1.05
5.3 Channelization overhead factor (β)
The channelization overhead factor accounts for additional spectrum required to achieve sufficient isolation between adjacent RF-channels, and can be expressed as a ratio of channel spacing to occupied channel bandwidth. Annex 1 of this Report describes how the values in Table 9 below were selected.
TABLE 9
Channelization overhead factors for low and high data rate applications
The multiple aircraft factor (m) accounts for multiple aircraft with WAIC systems installed operating in close proximity to one another, most likely in the airport environment. Annex 2 of this Report provides the derivation for the values in Table 10 below.
TABLE 10
Multiple Aircraft Factors for low data rate and high data rate applications
Application category Multiple aircraft factor
(m)
Low data rate Inside 1.0
Low data rate Outside 1.7
High data rate Inside 1.0
High data rate Outside 2.9
28 Rep. ITU-R M.2283-0
5.5 Modulation efficiency
Modulation efficiency (η) refers to the data rate that can be transmitted over a specific bandwidth. The estimated modulation efficiency values for WAIC systems are provided in Table 11 below. Annex 1 of this Report describes how the values in Table 11 below were selected.
TABLE 11
Modulation efficiency for low data rate and high data rate applications
Application category Modulation efficiency in
(bits/s/Hz) (η)
Low data rate 0.096
High data rate 0.723
5.6 Calculation of Wireless Avionics Intra-Communications spectrum requirements
Equation 7 below can be used to derive the frequency bandwidth (F) in MHz to support WAIC applications:
1000∗η
∗β∗α∗=
mPF eff
(7)
Table 12 below summarizes the parameters used in the calculation and identifies the required bandwidth per WAIC application category.
TABLE 12
Wireless Avionics Intra-Communications spectrum requirements for all application categories
WAIC application
category
Application data rate
in kbit/s (Peff)
Protocoloverhead
factor (α)
Channelizationoverhead
factor (β)
Multiple-aircraft factor
(m)
Modulation efficiency
in bps per Hz
(η)
WAIC Spectrum
requirementsMHz (F)
Low data rate Inside (LI)
394 1.38 1.92 1.0 0.096 11
Low data rate Outside (LO)
856 1.38 1.92 1.7 0.096 40
High data rate Inside (HI)
18385 1.04 1.20 1.0 0.723 32
High data rate Outside (HO)
12300 1.04 1.20 2.9 0.723 62
Rep. ITU-R M.2283-0 29
6 Summary
This Report provides characteristics of WAIC systems and an estimate of the spectrum requirements to support their operation on an aircraft while maintaining current required levels of safety. WAIC applications together with their key properties are presented. Different categories of applications are introduced based on their data rate requirements and whether their transmit antennas are located within or outside the aircraft structure. For determining spectrum requirements, all four WAIC application categories are considered as separate cases. As a result, “low data rate inside” WAIC systems will require a maximum of 11 MHz of spectrum. “Low data rate outside” WAIC systems require a maximum of 40 MHz of spectrum. “High data rate inside” WAIC systems will require a maximum of 32 MHz of spectrum. “High data rate outside” WAIC systems will require a maximum of 62 MHz of spectrum. The total spectrum required for all application categories is 145 MHz.
A set of WAIC radio interface characteristics is presented in Table 6 (§ 4.4). Based on these characteristics and the assumed applications requirements, the effective radiated power of all WAIC transmitters onboard an aircraft fully equipped with the identified WAIC applications are derived and presented per application category (§ 4.5). These overall emission values may be used as basis for sharing and compatibility studies in the course of finding appropriate frequency spectrum for future WAIC systems.
Annexes: 5
Annex 1
Protocol considerations
A-1.1 Introduction
The applications discussed and categorized in § 3 of this Report will likely be implemented as packet-oriented transmission schemes as opposed to link-oriented transmission schemes. Moreover, as multiple applications use the same communication channel, it is necessary to provide a medium access control (MAC) mechanism allowing different packet-based applications to share this channel. In the following the protocol overhead factor (α) which accounts for overhead contribution e.g. from preamble sequence for synchronization, frame header, cyclic redundancy checksum and security overhead (e.g. message authentication codes) is motivated in detail. Furthermore, the channelization overhead factor β is introduced which describes the amount of additional frequency spectrum required for spacing RF-channels far enough apart from each other to guarantee adequate mutual isolation. It hence describes the ratio between the channel spacing and the actual spectrum required for reliable communications. The modulation efficiency η describes the amount of data bits which can be transmitted in a given bandwidth. η accounts for the modulation order and redundancy induced by error-correction coding of the modulation and coding scheme.
For deriving α, β, and η, existing wireless transmission protocols that provide a suitable basis for coping with the requirements of the given application categories for WAIC are studied. Low and high data rate application categories were identified in § 3 of this Report.
30 Rep. ITU-R M.2283-0
A-1.2 Overhead in IEEE 802.15.4 and 802.11a/g packed-oriented communications systems
In packet-based communication systems it is first and foremost necessary to achieve bit-synchronization with every packet reception. Usually this is done by a preamble sequence and a start-of-frame delimiter (SFD). The synchronization header in case of IEEE 802.15.4 is 160 µs long for the IEEE 802.11a/g protocol the synchronization header is 20 µs in length.
Figure A-1.1 shows the data fields in an IEEE 802.15.4 MAC packet as an example. These or similar data fields are generally necessary for packetized communication. The frame payload (MAC Payload) is the only portion of the MAC frame usable by the application to carry its data. The other fields are to determine when to stop decoding the packet (Frame length), to control MAC functionalities (Frame Control Field), to differentiate original and repeatedly transmitted packets (Data Sequence Number), to differentiate the transmission source and destination by addresses (Address Information), and to check the packets for errors (Frame Check Sequence).
There is another aspect that needs to be taken into consideration: the time the transceiver needs to switch between the transmission and reception state (TX/RX-switching). This time depends mostly on the hardware implementation. In the IEEE 802.15.4 standard the maximum TX/RX switching time is defined as 192 µs. The IEEE 802.11a/g standard defines a maximum of 28 µs for this time.
FIGURE A-1.1
Example frame format defined in IEEE 802.15.4
While the IEEE 802.15.4 MAC frame is transmitted with only one constant data rate, it varies for IEEE 802.11a/g frames. In IEEE 802.11a/g packets the synchronization is achieved at a data rate of 1 Mbit/s, a physical header at a data rate of 2 Mbit/s and the following data fields with variable rate of 6 up to 54 Mbit/s. For reasons provided in § 5.5 of this Report, the modulation and coding scheme must be robust. Therefore, the 12 Mbit/s physical layer (PHY) mode as defined in the 802.11a/g standard is assumed as the reference for protocol overhead calculation (see also § A-1.6 below for a more detailed discussion of this choice).
Table A-1.1 below summarizes the time durations required for transmission of the various MAC protocol frame data fields. The totals represent the overhead transmission time required by the respective MAC protocol.
Rep. ITU-R M.2283-0 31
TABLE A-1.1
Protocol elements in IEEE 802.15.4 and 802.11 standards
Session Integrity Keys (SIK) are needed to ensures the data integrity of a communication session (a single flight leg) in an airplane. Each sensor negotiates an individual key with the server at the beginning of a session. The key is used to calculate a message authentication code to be appended to the actual message’s payload. This message authentication code is recalculated with the SIK and some other changing parameter, e.g. a frame counter resulting in a unique message authentication code for every single MAC frame. This is necessary to mitigate the risk of replay attacks. The additional overhead for the message authentication code needs to be taken into consideration. A message authentication code of length 128 bit (16 bytes) is deemed appropriate to mitigate the risk of attacks.
For the overall overhead calculation it means that the actual maximum packet size of the IEEE 802.15.4 MAC frame is reduced from 114 bytes to 98 bytes. The resulting transmission duration for the message authentication code is 512 µs. In IEEE 802.11a/g it reduces the usable maximum MAC frame size from 2312 byte to 2296 byte. In terms of transmission time that means that 11µs are used for the security related overhead at 12 Mbit/s.
A-1.4 Error correction overhead
To further improve the chance of proper data decoding at the receiver, the group of wireless IEEE 802.x protocols employ error detection and forward error correction (FEC). The error detection is handled by the cyclic redundancy check. The associated overhead for this is taken into account by the “frame check sequence”. Forward error correction is done by different coding schemes.
In IEEE 802.15.4 a spreading code is used to achieve a hamming distance between the different physical signals. This is done by coding each 4 bit of a packet with a chip sequence that represents
32 Rep. ITU-R M.2283-0
32 chips. In essence this inflates every packet by a factor of 8 and results in a modulation efficiency of 0.125 bits/Hz (see § A-1.6 below).
In IEEE 802.11a/g this is done by differently coded OFDM symbols. It results in coding rates that are either 1/2 or 3/4 depending on the physical layer transmission mode used. FEC coding alters the modulation efficiencies for these modes.
A-1.5 Calculation of protocol overhead factor α
The utilization factor U, i.e. the percentage of the available transmission volume in a MAC frame which is actually usable by the applications is expressed by equation (A-1.1).
U = usable
usable MAC_overhead security_overhead (A-1.1)
with:
tusable: time per MAC frame available for application data transmission
tMAC_overhead: time per MAC frame necessary for transmission of protocol overhead
tsecurity: time necessary for transmission of security-related overhead (message authentication code).
The protocol overhead factor α is calculated using the following equation (A-1.2):
For low data rate applications it is assumed that the IEEE 802.15.4 wireless sensor network standard provides a suitable basis. Assuming the RF-characteristics defined in this standard, such as its channel spacing of 5 MHz and its occupied bandwidth of 2.6 MHz (3 dB bandwidth), the channelization overhead factor is 5 MHz/2.6 MHz = β = 1.92.
For high data rate application the IEEE 802.11a/g standard provides a good baseline. The channel spacing and occupied bandwidth in this case is assumed as 20 MHz and 16.6 MHz (3 dB
Rep. ITU-R M.2283-0 33
bandwidth), respectively. Consequently for this standard the channelization overhead factor is 20 MHz/16.6 MHz = β = 1.20.
A-1.7 Modulation efficiency η
Modulation efficiency increases with higher-order modulation schemes. However, with higher-order modulation, higher Signal-to-Noise Ratios (SNR) are needed to achieve comparable link reliabilities. WAIC systems must be designed for low power and high link reliability.
For low data rate applications it again is assumed that the IEEE 802.15.4 wireless sensor network standard provides a suitable basis. Assuming data symbols similar to those in this standard the modulation efficiency of low data rate systems is 0.096 bits/Hz.
For high data rate application the IEEE 802.11a/g standard provides a good baseline. This standard provides a number of possible modulation and coding schemes also referred to as physical layer modes (PHY modes). As described in Table A-1.2 the overall spectrum requirements become a minimum for the IEEE 802.11a/g PHY mode 3 (12 Mbit/s) in a multi-aircraft environment (see also Annex 2). This is because the multiple aircraft factor increases rapidly with increasing minimum required SNR. For that reason the modulation efficiency is 0.723 bits/Hz.
TABLE A-1.2
Wireless Avionics Intra-Communications Signal-to-Noise Ratio requirements, multiple aircraft factors, and resulting spectrum requirements for high data rate WAIC
systems for various rates based on IEEE 802.11a
IEEE 802.11a/g
PHY mode
Data Rate,
(Mbit/s)
Modulation Efficiency bits/Hz (η)
Required SNR for WAIC (dB)
Protocol overhead factor (α)
Multiple Aircraft factor (m) for high data rate external applications (HO)
Effective High Data Rate (HI + HO) spectrum
required (MHz)
1 6 0.361 12 1.04 2.4 165
2 9 0.542 14 1.05 2.9 126
3 12 0.723 14 1.05 2.9 94
4 18 1.084 18 1.07 5.9 108
5 24 1.446 22 1.08 13 160
6* 36 2.167 24 1.12 18 149
7* 48 2.892 29 1.15 >30** >185**
8* 54 3.253 31 1.16 >30** >166**
* High SNR needed not compatible with low power design-insufficient link budget for practical WAIC application.
** Multiple aircraft analysis described in Annex 2 assumptions do not hold, but number of interfering aircraft would be sufficiently high to make these modes impractical.
34 Rep. ITU-R M.2283-0
Annex 2
Multiple aircraft considerations
A-2.1 Aircraft-to-aircraft interference model
In this Annex the situations when transmissions from WAIC systems onboard one aircraft may interfere with transmissions of WAIC systems onboard another aircraft is analysed. To assure reliable operation of WAIC systems on both aircraft, sufficient operational practices or technical requirements must be mandated. There are several technical methods being considered for WAIC systems in order to allow simultaneous usage of the same spectrum by WAIC systems installed on different aircraft. For example, time division, frequency division, or code division multiplexing, or a combination of such techniques could be used. Regardless of the specific coexistence techniques used, the amount of frequency spectrum required to operate WAIC systems onboard multiple aircraft in close proximity is larger when compared to the case where aircraft equipped with WAIC systems are widely spaced apart. It is anticipated that an aircraft will have to share spectrum resources with multiple other aircraft. This is most likely to occur at an airport, where many aircraft could be parked or taxiing in very close proximity.
To analyse this possibility, the first step is to define a geometric model to characterize the range at which WAIC systems on a single aircraft may interfere with WAIC systems on other aircraft.
A-2.2 Aircraft model
It is assumed that the worst-case scenario for potential interference between WAIC systems occurs when typical commercial aircraft are parked in close mutual proximity. For the analysis given a large typical commercial passenger aircraft is used as reference case. The considered large commercial aircraft has a wingspan of approx. 80 m and an overall length of approximately 73 m. For the purpose of analyzing interference radius, the WAIC systems on the aircraft are expected to operate within five notional cells (see Fig. A-2.1), with nodes in each cell designed so that they are able to communicate with other nodes within the same cell, but not necessarily with nodes in adjacent or other cells. It is assumed that transmit power control techniques will be used to conserve energy and to limit possible interference. Directional antennas are also implied, as the radius of the cells is such as only to cover the cell. Likewise, nodes located in a particular cell will use transmit signals that are just strong enough to be received by other nodes in the same cell.
Rep. ITU-R M.2283-0 35
FIGURE A-2.1
Idealized model of five WAIC cells with their corresponding coverage areas
To simplify the foregoing analysis, the coverage areas of the five cells are approximated by circles, as shown in Fig. A-2.1. It is anticipated that WAIC systems will utilize antennas with some directionality and implement transmit power control in order to minimize transmissions outside the aircraft. Therefore, the configuration shown in Fig. A-2.1 is considered the worst-case scenario.
A-2.3 Distribution of Wireless Avionics Intra-Communications nodes outside the aircraft structure
It is assumed that only WAIC nodes that are exterior to the aircraft structure are impacted by interference from neighbouring aircraft. Internal applications should receive sufficient protection from the aircraft body to make additional spectrum for multiple aircraft unnecessary. Considering only exterior applications, WAIC nodes on a single aircraft will also not be distributed uniformly across the five cells. Rather, some cells may include a larger fraction of all WAIC nodes, while other cells may include a smaller fraction. Moreover, each node varies in data rate and thus the spectrum requirements also depend on the types of nodes in a cell. The tables below describe the approximate mapping of WAIC nodes to the cells defined above per region of the aircraft and application as defined in § 3 of this Report. The tables below also specify what fractions of the total spectrum required by a single aircraft are utilized by WAIC systems in different aircraft cells.
It is understood that while in park many systems may not be fully active. These systems, however, must still maintain contact to ensure that the aircraft is ready upon transition to taxi, or provide service at a reduced duty cycle. To capture the effect of lowered capacity, some systems in the tables below operate at a reduced data rate during parking operation. The fractions of aggregated
36 Rep. ITU-R M.2283-0
data rate across the cell, both in full operation, as well as in parking operation, are then used to derive the multiplicative factor for determination of the spectrum requirements.
TABLE A-2.1
Fraction of total per-aircraft data rate of the LO category used in left wing cell
Region Associated
applications
Total no. of nodes
per application
No. ofnodes in cell
Net average
data rate
(kbit/s)*
Net average
data rate in Park (kbit/s)*
Fraction of required total net average
data rate for LO per
aircraft (%)**
Fraction of required
total net average
data rate for LO per aircraft in
park (%)**
Wings
Ice detection 20 2 1 0.20 0.12 0.02
Flight control system sensors,
position feedback and control parameters
60 15 120 24.00 14.02 2.80
Structural sensors 40 8 2.4 0.50 0.28 0.06
Totals: 123.4 24.70 14.42 2.89
* The net average data rate is the no. of nodes in the cell times the net average data rate per data link taken form Table 2 in § 3.2.2.1.
** The required total net average data rate for all LO applications is 856 kbit/s (see Table 2 in § 3.2.2.1).
Rep. ITU-R M.2283-0 37
TABLE A-2.2
Fraction of total per-aircraft data rate of the HO category used in left wing cell
Region Associated
applications
Total no. of nodes
per application
No. ofnodes in cell
Net average
data rate (kbit/s)*
Net average
data rate in Park (kbit/s)*
Fraction of required total net average
data rate for HO per
aircraft (%)**
Fraction of required total net
average data rate for HO per aircraft
in park (%)**
Wings
Avionics communication
bus 15 1 500 250 4.07 2.03
Structural sensors
40 8 360 72 2.93 0.59
External imaging sensors
10 1*** 1 000 200 8.13 1.63
Totals: 1 860 522 15.12 4.24
* The net average data rate is the no. of nodes in the cell times the net average data rate per data link taken form Table 4 in § 3.2.4.1.
** The required total net average data rate for all HO applications is 12 300 kbit/s (see Table 4 in § 3).
*** There are two wing tip cameras; one pointing in forward and on pointing in aft direction, either one or the other is operational at any given point in time on the ground/in park.
38 Rep. ITU-R M.2283-0
TABLE A-2.3
Fraction of total per-aircraft data rate of the LO category used in right wing cell
Region Associated
applications
Total no. of nodes
per application
No. ofnodes in cell
Net average
data rate
(kbit/s)*
Net average
data rate in Park (kbit/s)*
Fraction of required total net average
data rate for LO per
aircraft (%)**
Fraction ofrequired total net average
data rate for LO per
aircraft in park (%)**
Wings
Ice detection 20 2 1 0.20 0.12 0.02
Flight control system sensors,
position feedback and
control parameters
60 15 120 24.00 14.02 2.80
Structural sensors
40 8 2.4 0.50 0.28 0.06
Totals: 123.4 24.70 14.42 2.90
* The net average data rate is the no. of nodes in the cell times the net average data rate per data link taken form Table 2 in § 3.2.2.1.
** The required total net average data rate for all LO applications is 856 kbit/s (see Table 2 in § 3.2.2.1).
Rep. ITU-R M.2283-0 39
TABLE A-2.4
Fraction of total per-aircraft data rate of the HO category used in right wing cell
Region Associated
applications
Total no. of nodes
per application
No. ofnodes in cell
Net average
data rate
(kbit/s)*
Net average
data rate in Park
(kbit/s)*
Fraction of required total net average
data rate for HO per
aircraft (%)**
Fraction of required
total net average data rate for HO per aircraft
in park (%)**
Wings
Avionics communication
bus 15 1 500 250 4.07 2.03
Structural sensors
40 8 360 72 2.93 0.59
External imaging sensors (cameras, etc.)
10 1*** 1 000 200 8.13 1.63
Totals: 1 860 552 15.12 4.24
* The net average data rate is the no. of nodes in the cell times the net average data rate per data link taken form Table 4 in § 3.2.4.1.
** The required total net average data rate for all HO applications is 12 300 kbit/s (see Table 4 in § 3.2.4.1).
*** There are two wing tip cameras; one pointing in forward and on pointing in aft direction, either one or the other is operational at any given point in time on the ground/in park.
40 Rep. ITU-R M.2283-0
TABLE A-2.5
Fraction of total per-aircraft data rate of the HO category used in centre cell
Region Associated
applications
Total no. of nodes
per application
No. ofnodes in cell
Net average
data rate
(kbit/s)*
Net average
data rate in Park
(kbit/s)*
Fraction of required
total net average
data rate for LO per
aircraft (%)**
Fraction ofrequired total net average
data rate for LO per aircraft in
park (%)**
Wings
Ice detection 20 6 3.00 0.60 0.35 0.070
Flight control system sensors,
position feedback and
control parameters
60 20 160.00 32.00 18.69 3.74
Structural sensors
40 16 4.80 0.96 0.56 0.11
Nacelles
Ice detection 20 4 2.00 0.40 0.23 0.05
Engine sensors 32 32 25.60 5.12 2.99 0.6
Wheel wells and landing
gear
Landing gear (proximity)
sensors 30 24 4.80 0.96 0.56 0.11
Landing gear sensors, tire pressure, tire
and brake temperature and
hard landing detection
100 80 80.00 80.00 9.35 9.35
Landing gear sensors, wheel speed for anti-
skid control and position
feedback for steering
40 32 176.00 35.20 20.56 4.11
Rep. ITU-R M.2283-0 41
TABLE A-2.5 (end)
Region Associated
applications
Total no. of nodes
per application
No. ofnodes in cell
Net average
data rate
(kbit/s)*
Net average
data rate in Park
(kbit/s)*
Fraction of required
total net average
data rate for LO per
aircraft (%)**
Fraction ofrequired total net average
data rate for LO per aircraft in
park (%)**
Passenger and cargo
doors
Additional proximity
sensors, aircraft doors
50 24 0.48 0.48 0.06 0.056
Cargo compartment
data 25 20 1.00 1.00 0.12 0.12
Totals: 457.68 156.72 53.47 18.31
* The net average data rate is the no. of nodes in the cell times the net average data rate per data link taken form Table 2 in § 3.2.2.1.
** The required total net average data rate for all LO applications is 856 kbit/s (see Table 2 in § 3.2.2.1).
TABLE A-2.6
Fraction of total per-aircraft data rate of the HO category used in centre cell
Region Associated
applications
Total no. of nodes
per application
No. ofnodes in cell
Net average
data rate
(kbit/s)*
Net average
data rate in Park
(kbit/s)*
Fraction of required
total net average
data rate for HO per
aircraft (%)**
Fraction of required
total net average
data rate for HO per aircraft in
park (%)**
Wings
Avionics communication
bus 15 2 1 000 500 8.13 4.07
Structural sensors
40 10 450 90 3.66 0.73
Fuselage
Avionics communication
bus 15 2 1 000 500 8.13 4.07
External imaging sensors (cameras, etc.)
10 0*** 0 0 0 0
42 Rep. ITU-R M.2283-0
TABLE A-2.6 (end)
Region Associated
applications
Total no. of nodes
per application
No. ofnodes in cell
Net average
data rate
(kbit/s)*
Net average
data rate in Park
(kbit/s)*
Fraction of required
total net average
data rate for HO per
aircraft (%)**
Fraction of required
total net average
data rate for HO per aircraft in
park (%)**
Wheel wells and landing
gear
Avionics communication
bus 15 3 1 500 750 12.20 6.10
Passenger and cargo
doors
Structural sensors
40 3 135 27 1.10 0.22
Nacelles
Avionics communication
bus 15 2 1 000 500 8.13 4.07
Structural sensors
40 4 180 36 1.46 0.29
Totals: 5 265 2 403 42.80 19.53
* The net average data rate is the no. of nodes in the cell times the net average data rate per data link taken form Table 4 in § 3.2.4.1.
** The required total net average data rate for all HO applications is 12 300 kbit/s (see Table 4 in § 3.2.4.1).
*** There are two cameras installed at the fuselage. These cameras are intended for surveillance of the engines while the aircraft is in flight.
Rep. ITU-R M.2283-0 43
TABLE A-2.7
Fraction of total per-aircraft data rate of the LO category used in nose cell
Region Associated
applications
Total no. of nodes
per application
No. ofnodes in cell
Net average
data rate
(kbit/s)*
Net average
data rate in Park
(kbit/s)*
Fraction of
required total net average
data rate for LO per
aircraft (%)**
Fraction of required
total net average
data rate for LO per aircraft in
park (%)**
Wheel wells and landing
gear
Landing gear (proximity)
sensors 30 6 1.20 0.24 0.14 0.03
Landing gear sensors, tire pressure, tire
and brake temperature and
hard landing detection
100 20 20.00 20.00 2.34 2.34
Landing gear sensors, wheel speed for anti-
skid control and position
feedback for steering
40 8 44.00 8.80 5.14 1.03
Passenger and cargo
doors
Additional proximity
sensors, aircraft doors
50 10 0.20 0.20 0.02 0.02
Totals: 65.40 29.24 7.64 3.42
* The net average data rate is the no. of nodes in the cell times the net average data rate per data link taken form Table 2 in § 3.2.2.1.
** The required total net average data rate for all LO applications is 856 kbit/s (see Table 2 in § 3.2.2.1).
44 Rep. ITU-R M.2283-0
TABLE A-2.8
Fraction of total per-aircraft data rate of the HO category used in nose cell
Region Associated
applications
Total no. of nodes
per application
No. ofnodes in cell
Net average
data rate
(kbit/s)*
Net average
data rate in Park
(kbit/s)*
Fraction of
required total net average
data rate for HO
per aircraft (%)**
Fraction of required
total net average
data rate for HO per aircraft in
park (%)**
Wheel wells and landing
gear
Avionics communication
bus 15 1 500 250 4.07 2.03
External imaging sensors (cameras, etc.)
10 1*** 1 000 200 8.13 1.63
Passenger and cargo
doors
Structural sensors
40 2 90 18 0.73 0.15
Totals: 1 590 468 12.93 3.80
* The net average data rate is the no. of nodes in the cell times the net average data rate per data link taken form Table 4 in § 3.2.4.1.
** The required total net average data rate for all HO applications is 12 300 kbit/s (see Table 4 in § 3.2.4.1).
*** There are two nose landing gear cameras, one pointing in forward and on pointing in aft direction; either one or the other is operational at any given point in time on the ground/in park.
TABLE A-2.9
Fraction of total per-aircraft data rate of the LO category used in tail cell
Region Associated
applications
Total no. of nodes
per application
No. ofnodes in cell
Net average
data rate
(kbit/s)*
Net average
data rate in Park
(kbit/s)*
Fraction of
required total net average
data rate for LO per
aircraft (%)**
Fraction of
required total net average
data rate for LO per aircraft in
park (%)**
Stabilizers
Ice detection 20 6 3.00 0.60 0.35 0.07
Flight control system sensors,
position feedback and
control parameters
60 10 80.00 16.00 9.35 1.87
Structural sensors
40 8 2.40 0.48 0.28 0.06
Rep. ITU-R M.2283-0 45
TABLE A-2.9 (end)
Region Associated
applications
Total no. of nodes
per application
No. ofnodes in cell
Net average
data rate
(kbit/s)*
Net average
data rate in Park
(kbit/s)*
Fraction of
required total net average
data rate for LO per
aircraft (%)**
Fraction of
required total net average
data rate for LO per aircraft in
park (%)**
Passenger and cargo
doors
Additional proximity
sensors, aircraft doors
50 16 0.32 0.32 0.04 0.04
Cargo compartment
data 25 5 0.25 0.25 0.03 0.03
Totals: 85.97 17.65 10.04 2.06
* The net average data rate is the no. of nodes in the cell times the net average data rate per data link taken form Table 2 in § 3.2.2.1.
** The required total net average data rate for all LO applications is 856 kbit/s (see Table 2 in § 3.2.2.1).
TABLE A-2.10
Fraction of total per-aircraft data rate of the HO category used in tail cell
Region Associated
applications
Total no. of nodes
per application
No. ofnodes in cell
Net average
data rate
(kbit/s)*
Net average
data rate in Park
(kbit/s)*
Fraction of
required total net average
data rate for HO
per aircraft (%)**
Fraction of
required total net average
data rate for HO per aircraft in
park (%)**
Stabilizers
Avionics communication
bus 15 3 1 500 750 12.20 6.10
Structural sensors
40 2 90 18 0.73 0.15
External imaging sensors (cameras, etc.)
10 0*** 0 0 0 0
46 Rep. ITU-R M.2283-0
TABLE A-2.10 (end)
Region Associated
applications
Total no. of nodes
per application
No. ofnodes in cell
Net average
data rate
(kbit/s)*
Net average
data rate in Park
(kbit/s)*
Fraction of
required total net average
data rate for HO
per aircraft (%)**
Fraction of
required total net average
data rate for HO per aircraft in
park (%)**
Passenger and cargo
doors
Structural sensors
40 3 135 27 1.10 0.22
Totals: 1 725 795 14.02 6.46
* The net average data rate is the no. of nodes in the cell times the net average data rate per data link taken form Table 4 in § 3.2.4.1.
** The required total net average data rate for all HO applications is 12 300 kbit/s (see Table 4 in § 3.2.4.1).
*** There are two vertical stabilizer cameras; one pointing in forward and on pointing in aft direction, none of these cameras is operational at any given point in time on the ground/in park.
A-2.4 Interference ranges
The main technical difficulty associated with the implementation of WAIC systems on aircraft is the potential for WAIC transmissions from one or more aircraft to interfere with WAIC transmission on another aircraft. WAIC transmission signals could cause interference at distances beyond their intended communications range. For example, when a transmitted signal gets too weak to be correctly received and decoded it may still be strong enough to interfere with the reception of signals from other, closer transceivers.
For WAIC systems, the technical parameter most useful to characterize co-channel interference is the receiver’s allowable carrier-to-interference ratio (CIR) necessary to assure correct reception. The particular multiple access technique, the modulation and coding scheme, and the fading environment all play a role in defining the appropriate CIR for WAIC systems on neighbouring aircraft. One way of deriving the necessary CIR is to derive CIR requirements from SNR requirements. Clearly, the CIR requirement cannot be less than the SNR requirement. For that reason the following equation is proposed:
= + 3dB (A-2.1)
Thus 12 dB and 17 dB CIR should be adequate for low data rate systems and high data rate systems respectively. These values are based on the minimum required SNR values as provided in Table 6.
Based on the assumed 12 dB and 17 dB CIR ratio necessary for reliable WAIC communications and line-of-sight conditions (path-loss exponent = 2), the range at which a WAIC transceiver can interfere with other WAIC systems is 7.1 times larger than its communications range for high data rate systems and 4.0 times larger for low data rate systems. In Fig. A-2.2 below, the small darker circles represent the same communication ranges as defined previously, while the larger, lighter circles represent the corresponding potential interference ranges of the five aircraft cells for high data rate systems. As can be seen, WAIC systems on one aircraft can potentially interfere with WAIC systems on other aircraft.
Rep. ITU-R M.2283-0 47
The interference ranges indicated in Fig. A-2.2 are valid only for the interference-limited regime of radio reception. As the signal level decreases, the additional impact of the noise will increase the effective interference range as the noise further degrades the signal. However this increase is considered minor and will be ignored for this analysis.
FIGURE A-2.2
Representative high data rate Wireless Avionics Intra-Communications systems interference ranges of a single aircraft
A-2.5 Aircraft configuration
An analysis of typical gate and taxiway configurations used on tarmacs worldwide leads to the conclusion that the worst-case WAIC interference scenario is when aircraft are placed in the “pier” configuration (see Fig. A-2.3). In this configuration, rows of aircraft are parked nose-to-nose, with only minimal clearance between the wingtips.
The separation between the two rows may be used as a walkway for passengers who may be boarding or disembarking the aircraft. In addition, two other aircraft are assumed to be taxiing on either side of the two rows. This configuration is shown in Fig. A-2.3 below.
48 Rep. ITU-R M.2283-0
FIGURE A-2.3
“'Pier” airport configuration
In this Report, the wingtip-to-wingtip separation is assumed to be 7.5 m as per ICAO Standards and Recommended Practices. For nose-to-nose separation, the distance used is 15 m. This is consistent with the minimal nose-to-wall clearance recommended by at least one Administration. The same 15 m of separation is assumed between taxiing and parked aircraft.
A-2.6 Estimated number of interfering aircraft
This section provides the worst-case estimate of the number of aircraft that may be seen as potential interferers by WAIC systems on a single aircraft. This number will be later used to derive the multiplying factors for total spectrum requirements. To simplify the analysis and for better visualization, interference from other aircraft is considered separately for different cells of the neighbouring aircraft. This is due to the fact that those cells will have different communication and interference ranges, and thus may interfere with different aircraft. Then, interference from the five types of aircraft zones will be combined into a single multiplier, representing the equivalent number of aircraft with which the WAIC systems on a single aircraft of interest must coexist.
A/C 1A/C 2 A/C 3 A/C 4 A/C 5
A/C 6 A/C 7 A/C 8 A/C 9 A/C 10
A/C 11
A/C 12
A/C 13 A/C 14 A/C 15
Meters
Met
ers
-200 -150 -100 -50 0 50 100 150 200-300
-200
-100
0
100
200
300
Rep. ITU-R M.2283-0 49
In Fig. A-2.4 below, the aircraft of interest is Aircraft 1 (A/C 1), located in the middle of the middle row. The remaining 14 aircraft are a source of possible interference to A/C 1. The total of aircraft pictured is fifteen. For the assumed configuration any additional aircraft will not affect A/C 1.
Figure A-2.4 below shows interference from WAIC nodes in “Centre cells” of neighbouring aircraft. The small darker blue circles represent the communication ranges of WAIC nodes in “Centre cells” of the neighbouring aircraft. The large lighter blue circles correspond to potential interference ranges of those nodes. It is seen that the “Centre cell” of A/C 1 is within the potential interference range of six other aircraft, i.e. A/C 3, 4, 7, 8, 9, and 11. The “Nose cell” of A/C 1 is within the potential interference range of seven other aircraft, i.e. A/C 3, 4, 7, 8, 9, 11 and 12. The “Tail cell” of A/C 1 is within the range of seven other aircraft, i.e. A/C 3, 4, 7, 8, 9, 11 and 14. The “Left Wing cell” of A/C 1 is within the potential interference range of seven other aircraft, i.e. A/C 2, 3, 4, 7, 8, 9 and 11. The “Right Wing cell” of A/C 1 is within the potential interference range of eight other aircraft, i.e. A/C 3, 4, 5, 7, 8, 9 and 11.
FIGURE A-2.4
Interference from nodes in “Centre cells” of other aircraft for high data rate systems
A similar analysis was performed with all other combinations of cells and for both low data rate interference ranges and high data rate interference ranges. Table A-2.11 below summarizes the analysis results. For each cell of A/C 1, the table gives the number of different cells of neighbouring aircraft for which their interference ranges overlap, fully or in part, with that particular cell of A/C 1.
50 Rep. ITU-R M.2283-0
TABLE A-2.11
No. of aircraft interfering with cells on aircraft 1 using interference ranges for high data rate systems
Number of neighbouring aircraft whose cells of given type may interfere
Cells of other aircraft Centre Nose Tail Left Wing Right Wing
Cells of Aircraft 1
Centre 6 1 4 4 5
Nose 7 1 6 3 4
Tail 7 0 3 3 3
Left Wing 7 0 4 3 3
Right Wing 7 0 4 3 4
TABLE A-2.12
No. of aircraft interfering with cells on aircraft 1 using interference ranges for low data rate systems
Number of neighbouring aircraft whose cells of given type may interfere
Cells of other aircraft Centre Nose Tail Left Wing Right Wing
Cells of Aircraft 1
Centre 4 0 0 1 2
Nose 3 1 0 0 0
Tail 3 0 1 1 2
Left Wing 3 0 1 0 2
Right Wing 3 0 1 1 1
A-2.7 Multiplicative factor for spectrum requirements
The number of neighbouring aircraft whose interference range includes the aircraft of interest determines the multiplicative factor for calculating the total spectrum overhead required to deal with inter WAIC system interference in the investigated scenario. Because the five aircraft cells may use different fractions of the total spectrum used by the aircraft, it is necessary to apply appropriate weighting factors to different cells. In this simplified analysis, it is assumed that all the neighbouring aircraft have similar WAIC systems, and, consequently, the fractions of spectrum use by different cells are the same for all the aircraft under consideration. Let pc, pn, pt, pl and pr denote the fraction of the total single-aircraft WAIC spectrum usage that is allocated to outside WAIC systems in the “Centre”, “Nose”, “Tail”, “Right Wing” and “Left Wing” cell, respectively. Let pc,park, pn,park, pt,park, pl,park and pr,park denote the fraction of the total single-aircraft WAIC spectrum usage that is allocated to outside WAIC systems during parking operation in the “Centre”, “Nose”, “Tail”, “Right Wing” and “Left Wing” cell, respectively. These fractions are defined earlier in § A-2.3 of this annex. The multiplicative factor for high data rate systems corresponding to mutual interference between multiple aircraft becomes:
Rep. ITU-R M.2283-0 51
( )( )( )( )( ) 143407
33407
33307
43617
5441,6
parkr,parkl,parkt,parkn,parkc,r
park,park,park,park,park,l
parkr,parkl,parkt,parkn,parkc,t
parkr,parkl,parkt,parkn,parkc,n
parkr,parkl,parkt,parkn,parkc,c
+++++++++++++++++++++++++=
pppppp
pppppp
pppppp
pppppp
ppppppm
rltnc
HO
(A-2.2)
The multiplicative factor for low data rate systems corresponding to mutual interference between multiple aircraft becomes:
( )( )( )( )( ) 111103
20103
21103
00013
2100,4
parkr,parkl,parkt,parkn,parkc,r
park,park,park,park,park,l
parkr,parkl,parkt,parkn,parkc,t
parkr,parkl,parkt,parkn,parkc,n
parkr,parkl,parkt,parkn,parkc,c
++++++++++
+++++++++++++++=
pppppp
pppppp
pppppp
pppppp
ppppppm
rltnc
LO
(A-2.3)
Using the corresponding values of pc, pn, pt, pl, pr, pc,park, pn,park, pt,park, pl,park and pr,park estimated earlier in § A-2.3, the resulting multiplicative factor for the category of outside low data rate systems (LO) is mLO = 1.7. The corresponding value for the category of outside high data rate systems (HO) is mHO = 2.9.
A-2.8 Conclusion on multiple aircraft overhead
Based on the worst-case airport configuration analysis, the multiplicative factor for WAIC system spectrum need is mLO = 1.7 for low data rate applications and mHO = 2.9 for high data rate applications. These factors assume that only the outside nodes of different aircraft in close mutual proximity may interfere with each other. For WAIC systems inside the aircraft structure, no interference is assumed between neighbouring aircraft due to the airframe attenuation.
Annex 3
Propagation considerations
A-3.1 Introduction
WAIC systems communicate by making use of radio waves propagating through the environment made up by the aircraft itself and its immediate surroundings. This propagation environment has not yet been extensively characterized. In 2010 a radio propagation measurement campaign was carried out by the international aerospace community with the aim of developing a set of representative propagation models for this environment. This Annex contains definitions for propagation models valid for locations in and around a commercial airplane derived from measurements in the frequency range from 962 MHz to 18 GHz. The measurements which led to the channel gain models described hereafter were taken onboard a DC-10. In the remainder of this annex only the resulting propagation models are described.
52 Rep. ITU-R M.2283-0
A-3.2 Definition of channel gain/loss models for various areas of the aircraft
After analysis of various sets of measurement data taken in different areas of the aircraft, the grouping summarized in Table A-3.1 below was defined. Each of the groups A to F contains measurements obtained at locations (test points) with similar propagation conditions, e.g. similar shadowing situation.
TABLE A-3.1
Combining datasets into groups with similar propagation characteristics
Group Group name Description
A Intra-Cabin &Intra-Flight Deck Includes test pairs where both points are in the same cabin area (e.g. business class), or both are in the flight deck.
B Inter-Cabin Includes test pairs where each point is in a different cabin area. Points are generally separated by cabin monuments (lavatories, galleys, etc.).
C Inter-Cabin-to-Lower Lobe & Inter-Cabin-to-Flight Deck
Includes test pairs where one point is in the cabin and one is in a lower-lobe area (Electronic Equipment Bay or Cargo area), separated by the main deck floor. Also includes test pairs where one point is in the cabin and one point is in the flight deck, separated by the forward cabin monuments and flight deck door/bulkhead.
D Inter-Cabin-to-Exterior (points on wing)
Includes test pairs where one point is in the cabin and one point is on the wing or engine, separated by the fuselage. Note there is some expected LOS or near-LOS component expected through the cabin windows.
E Inter-Cabin-to-Landing Gear & Inter-Lower-Lobe to Exterior
Includes test pairs where one point is in the cabin and one point is on the landing gear, or one point is in the lower-lobe and one point is outside the fuselage. In both cases the test points are separated by the fuselage with no expected LOS or NLOS through the cabin windows.
F Inter-Exterior Includes test pairs where both points are exterior of the aircraft fuselage.
A-3.3 General channel model
Following the traditional wireless channel model, the gain/loss between the transmitter and the receiver is of the form:
= ℎ( , ) × × (A-3.1)
or in logarithmic scale:
dB = ℎdB( , ) + dB + dB (A-3.2)
where:
L: measured channel gain/loss
h(f, d): predicted large-scale channel gain/loss
Y: model prediction error due to shadowing effects
Rep. ITU-R M.2283-0 53
X: small-scale channel gain/loss due to fading effects.
For the large-scale gain/loss prediction a model of the functional form
ℎ( , ) = (A-3.3)
is used, where n and k are the distance and frequency exponents and C1 is a constant offset. In the general model in equation (A-3.1) the parameter Y represents the error in the large scale model. Part of this error is due to shadowing (variations in the propagation environment even if the frequency and distance remained fixed). Also lumped into this parameter are any imperfections in the model itself (since the model parameters are themselves only estimates). Finally the parameter X represents the small scale variations in the channel gain/loss measurements. This is attributed to random channel fading and generally represents the largest variation in the channel gain/loss measurements.
For deriving large-scale channel parameters each of the sets of measurement data underwent an averaging process so that an average channel gain was calculated for frequencies spaced 1 GHz apart. After this averaging each of these samples represents an average of the measured channel gain samples over a 1 GHz wide window.
Let hi be the average channel gain for the ith data sample taken at frequency fi and distance di. The goal is to optimize the model parameters in the logarithmic (dB) domain. For this case the error between the measurement and the model is defined as:
the model in logarithmic scale becomes linear. The error then simplifies to
= ℎ ,dB − ,dB + 10 log ( i) + 10 log ( i) (A-3.7)
which is linear in the three parameters C1,dB, k and n. These parameters can be simultaneously optimized to minimize the sum of the squared errors
SSE = ∑ e (A-3.8)
The parameters C1,dB, k and n which are optimal in the sense of equation (A-3.8) are summarized in Table A-3.2 below per group.
54 Rep. ITU-R M.2283-0
TABLE A-3.2
Channel gain model parameters for each group of test points
Group Group name k
(freq exp) n
(dist exp) C1,dB
A Intra-Cabin & Intra-Flight Deck 2.45 2.00 189.8
B Inter-Cabin 2.09 3.46 167.5
C Inter-Cabin-to-Lower Lobe & Inter-Cabin-to-Flight Deck
1.86 2.49 124.5
D Inter-Cabin-to-Exterior (points on wing) 1.86 2.12 118.2
E Inter-Cabin-to-Landing Gear & Inter-Lower-Lobe to Exterior
1.59 1.51 77.9
F Inter-Exterior 1.95 2.31 142.5
A-3.5 Large-scale prediction error or modelling shadowing
To measure the statistics of the model prediction error, for each data set the predicted large scale behaviour from the model given above is compared with the measured large scale behaviour. For this case the measured large scale behaviour was taken to be the best fit curve that matched the measured channel gains for a particular data set. The best fit for each data was postulated to be a large scale variation of the functional form
( ) = (A-3.9)
The function with the constants C0 and k that best fit the particular data set represents the estimate for the large-scale variations in that data set. The mean and standard deviation of the model prediction error is summarized in Table A-3.3 below per group. For indication of the statistical relevance the size of the sample set is also provided.
TABLE A-3.3
Model error statistics by group
Group A B C D E F
No. of samples 540 225 153 24 47 669
Mean (dB) 0.00 –0.11 0.39 0.57 –0.11 –0.14
Std. Dev. (dB) 3.58 4.77 5.26 4.09 4.12 5.60
When considering the entirety of all data sets available from the measurement campaign, the mean and standard deviation over the entire set of samples was found to be μ = –0.03 dB and σ = 4.82 dB. It can also be shown, that the distribution of the modelling error fairly well follows the normal distribution. This error can be attributed to shadowing which occurred in the real measured propagation scenarios but which is not reflected by the large-scale propagation model described above. In the overall propagation model provided in equation (A-3.2), the parameter can hence be represented by a normally distributed random variable with zero mean and a standard deviation of around 4.8 dB.
Rep. ITU-R M.2283-0 55
A-3.6 Modelling small-scale fading statistics
After removal of the large scale component from the measured channel gains/losses by applying equation (A-3.3) the remaining channel component should describe the channel’s small-scale propagation characteristics, i.e. fading caused by multi-path signal propagation. Typically, in propagation environments where there is no line-of-sight or other dominant path present, the receive signal’s amplitude follows a Rayleigh distribution. If there is a line-of-sight or a dominant component, then a Rician distribution occurs.
If a random variable, X, follows a Rayleigh distribution, then X2 will follow an exponential distribution. By applying an appropriate statistical test for distribution goodness of fit, it can be tested whether the hypothesis that the small scale channel gain follows a Rayleigh distribution is correct. The exponential Lilliefors test on the magnitude squared of the measured channel gains is one such test. Since all statistical tests for goodness-of-fit assume that the samples are independent, it is necessary to space samples far enough apart in frequency, to assure this requirement. Here the correlation bandwidth of the measured channel gain is a good indicator. An analysis of the 50% correlation bandwidth over all measured data sets showed, that none of the sets had a 50% correlation bandwidth larger than 50 MHz. So a sample every 50 MHz was taken to form the input data set for the exponential Lilliefors test on the magnitude squared of the measured channel gains. Almost all of the measured data sets passed the Lilliefors goodness-of-fit test at a 99% confidence level. Hence, it can be assumed, that the small scale behaviour of the measured channels can be modelled by applying a Rayleigh distribution with unit variance.
A-3.7 Modelling aircraft fuselage attenuation in closed form
To facilitate the application of the body attenuations described in Table 5, and to better represent body attenuation, the following practical equations should be used for sharing studies. For transmitters installed within cabin the body attenuation is:
θ: being the angle from the direction of interest to the forward facing direction (nose) of the aircraft (degrees) as shown in Fig. A-3.1, varies from 0° (fore) to 180° (aft)
φ: being the angle from the direction of interest projected onto the roll plane of the aircraft to the upward facing direction (degrees) as shown in Fig. A-3.1, varies from –180° (downward through 0° (upward) to 180° (downward).
For transmitters installed in lower lobe of aircraft fuselage the body attenuation is:
Based on equations (A-3.10), (A-3.13) and (A-3.16), Table A-3.4 suggests area-specific attenuation equations for WAIC applications inside the aircraft structure.
Rep. ITU-R M.2283-0 57
TABLE A-3.4
RF-shielding for Wireless Avionics Intra-Communications applications inside the aircraft structure
WAIC transmit antenna location
Aircraft structural shielding
Installation Regime Equation Applied
Flight deck installed within cabin (A-3.10)
Cabin compartment
installed within cabin (A-3.10)
Avionics compartment
installed in enclosed compartments (A-3.16)
fwd and aft cargo compartment, centre tank, bilge
installed in lower lobe of aircraft fuselage (A-3.13)
Bulk cargo compartment
installed in lower lobe of aircraft fuselage (A-3.13)
Wing fuel tank installed in enclosed compartments (A-3.16)
Horizontal stabilizer
installed in enclosed compartments (A-3.16)
Nacelles installed in enclosed compartments (A-3.16)
Annex 4
Overall emissions of an aircraft caused by Wireless Avionics Intra-Communications systems
A-4.1 Introduction
The following Tables A-4.1 to A-4.4 summarize the RF-emissions generated by the entirety of all identified WAIC applications assuming that the WAIC transmitters, when active, are radiating with the maximum transmission power as defined in the technical characteristics for WAIC systems in Table 6. The procedure for the calculation of these emission values is described in § 4.5. Emissions are calculated either on per-compartment or per-aircraft-area level, for inside (yI) and outside (yO) applications, respectively. The e.i.r.p. density values in the last two columns of the following tables should be used for sharing and compatibility studies. How the emissions of WAIC systems on multiple RF-channels interact with the incumbent system’s receiver will depend on its receiver properties, in particular the receiver IF-bandwidth (see explanation in § 4.5). The compartments described in the tables show operation in a worst-case emissions environment. This differs from the typical as some systems, particularly the imaging sensors, may have a disproportionate number of the total operating nodes concentrated in a few compartments at a time. Thus it appears from the tables below that the aggregated data rate of all the compartments is greater than that described in § 3.2. In practice however, the combined data generated would not exceed that described in § 3.2. Namely, activity among nodes would move from compartment to compartment, maintaining the total active nodes at or below the number specified in § 3.2.
58 Rep. ITU-R M.2283-0
A-4.2 Per-compartment emissions for low data rate inside Wireless Avionics Intra-Communications systems
TABLE A-4.1
Effective radiated power per compartment generated by the entirety of all low data rate inside WAIC applications
Proximity sensors. passenger and cargo doors. panels
0.02 25 0.5
ECS sensors 0.05 170 8.5
EMI detection sensors 0.01 10 0.1
Emergency lighting control 0.1 130 13
Rep. ITU-R M.2283-0 59
TABLE A-4.1 (continued)
Compartment Name/ Application
Net average
data rate per
data-link (kbit/s)
No. of simultaneously
operational nodes per
compartment
Aggregate net
average data rate per
compartment (kbit/s)
No. of active
transmitters(Gateway Nodes and
End Nodes)
DutyFactor
(%)
Shielding Configuration(ref. Table 5)
Structural shielding (dB)
Case/Configuration(ref. Table 5)
e.i.r.p. density (dBm/MHz)
best-case
worst-case
best-case
worst-case
Aircraft lighting control 0.1 900 90
Cabin removables inventory
0.01 1 000 10
Cabin monitoring 0.05 500 25
Structural sensors 0.3 140 42
Temperature/ humidity for corrosion detection
0.01 80 0.8
avionics compartment 120 2.15
1.0 1.2 c 45.0 (3c)
35.0 (2c)
–58.4 –48.4
Smoke sensors (unoccupied areas)
0.1 10 1
Proximity sensors. passenger and cargo doors. panels
0.02 5 0.1
EMI detection sensors 0.01 5 0.05
Electrical power distribution. control and monitoring
0.01 100 1
fwd and aft cargo compartment. centre tank. bilge
611 58.3 1.0 32.1 b
45.0 (3b)
30.0 (2b)
–44.1 –29.1
Smoke sensors (unoccupied areas)
0.1 16 1.6
60 Rep. ITU-R M.2283-0
TABLE A-4.1 (continued)
Compartment Name/ Application
Net average
data rate per
data-link (kbit/s)
No. of simultaneously
operational nodes per
compartment
Aggregate net
average data rate per
compartment (kbit/s)
No. of active
transmitters(Gateway Nodes and
End Nodes)
DutyFactor
(%)
Shielding Configuration(ref. Table 5)
Structural shielding (dB)
Case/Configuration(ref. Table 5)
e.i.r.p. density (dBm/MHz)
best-case
worst-case
best-case
worst-case
Proximity sensors. passenger and cargo doors. panels
0.02 10 0.2
ECS sensors 0.05 60 3
EMI detection sensors 0.01 5 0.05
Aircraft lighting control 0.1 75 7.5
Sensors for valves and other mechanical moving parts
0.2 15 3
Fuel tank/line sensors 0.2 20 4
Structural sensors 0.3 120 36
Temperature/ humidity for corrosion detection
0.01 140 1.4
Electrical power distribution. control and monitoring
0.01 150 1.5
Rep. ITU-R M.2283-0 61
TABLE A-4.1 (continued)
Compartment Name/ Application
Net average
data rate per
data-link (kbit/s)
No. of simultaneously
operational nodes per
compartment
Aggregate net
average data rate per
compartment (kbit/s)
No. of active
transmitters(Gateway Nodes and
End Nodes)
DutyFactor
(%)
Shielding Configuration(ref. Table 5)
Structural shielding (dB)
Case/Configuration(ref. Table 5)
e.i.r.p. density (dBm/MHz)
best-case
worst-case
best-case
worst-case
bulk cargo compartment
144 15.5
1.0 8.5 b 45.0 (3b)
30.0 (2b)
–49.8 –34.8
Smoke sensors (unoccupied areas)
0.1 4 0.4
Proximity sensors. passenger and cargo doors. panels
0.02 5 0.1
ECS sensors 0.05 20 1
EMI detection sensors 0.01 5 0.05
Aircraft lighting control 0.1 25 2.5
Sensors for valves and other mechanical moving parts
0.2 15 3
Fuel tank/line sensors 0.2 10 2
Structural sensors 0.3 20 6
Temperature/ humidity for corrosion detection
0.01 40 0.4
62 Rep. ITU-R M.2283-0
TABLE A-4.1 (end)
Compartment Name/ Application
Net average
data rate per
data-link (kbit/s)
No. of simultaneously
operational nodes per
compartment
Aggregate net
average data rate per
compartment (kbit/s)
No. of active
transmitters(Gateway Nodes and
End Nodes)
DutyFactor
(%)
Shielding Configuration(ref. Table 5)
Structural shielding (dB)
Case/Configuration(ref. Table 5)
e.i.r.p. density (dBm/MHz)
best-case
worst-case
best-case
worst-case
wing fuel tank 110 22
1.0 12.1 c 45.0 (3c)
35.0 (2c)
–48.3 –38.3 Fuel tank/line sensors 0.2 40 8
Sensors for valves and other mechanical moving parts
0.2 70 14
horizontal stabilizer 10 2 1.0 1.1 c
45.0 (3c)
35.0 (2c)
–58.7 –48.7 Fuel tank/line sensors 0.2 10 2
nacelles 128 92.4
1.0 50.9 c 45.0 (3c)
35.0 (2c)
–42.1 –32.1 Engine sensors 0.8 108 86.4
Structural sensors 0.3 20 6
Rep. ITU-R M.2283-0 63
A-4.3 Per-area emissions for low data rate outside Wireless Avionics Intra-Communications systems
TABLE A-4.2
Effectively radiated power per aircraft area generated by the entirety of all low data rate outside Wireless Avionics Intra-Communications applications
Compartment Name/ Application
Net average
data rate per
data-link (kbit/s)
No. of simultaneously
operational nodes per
compartment
Aggregate net average
data rate per
compartment (kbit/s)
No. of active
transmitters(Gateway Nodes and
End Nodes)
DutyFactor
(%)
Structural shielding (dB)
Case/Configuration (ref. Table 5)
e.i.r.p. density (dBm/MHz)
Case 4 a) Case 4 b) Case 4 a) Case 4 b)
nose (lower shell only) 44 65.4
1.0 36.0 5.0 0.0 –3.6 1.4
Landing gear (proximity) sensors 0.2 6 1.2
Landing gear sensors, tire pressure, tire and brake temperature and hard landing detection
1 20 20
Landing gear sensors, wheel speed for anti-skid control and position feedback for steering
A-4.5 Per-area emissions for high data rate outside Wireless Avionics Intra-Communications systems
TABLE A-4.4
Effectively radiated power per aircraft area generated by the entirety of all high data rate outside Wireless Avionics Intra-Communications applications
Compartment Name/ Application
Net averagedata rate
per data-link (kbit/s)
No. of simultaneously
operational nodes per
compartment
Aggregate net average
data rate percompartment
(kbit/s)
No. of active transmitters
(Gateway Nodes and
End Nodes)
DutyFactor
(%)
Structural shielding (dB)
Case/Configuration (ref. Table 5)
e.i.r.p. density (dBm/MHz)
Case 4 a) Case 4 b) Case 4 a) Case 4 b)
nose (lower shell only) 5 2 590
1.0 22.7 5.0 0.0 –6.6 –1.6
Avionics communication bus 500 1 500
Structural sensors 45 2 90
External imaging sensors (cameras, etc.)
1 000 2 2 000
centre (upper shell) 16 4 450
1.0 38.9 5.0 0.0 –4.3 0.7
Avionics communication bus 500 4 2 000
Structural sensors 45 10 450
External imaging sensors (cameras, etc.)
1 000 2 2 000
centre (lower shell) 12 2 815
1.0 24.6 5.0 0.0 –6.3 –1.3 Avionics communication bus 500 5 2 500
Structural sensors 45 7 315
Rep. ITU-R M.2283-0 69
TABLE A-4.4 (end)
Compartment Name/ Application
Net averagedata rate
per data-link (kbit/s)
No. of simultaneously
operational nodes per
compartment
Aggregate net average
data rate percompartment
(kbit/s)
No. of active transmitters
(Gateway Nodes and
End Nodes)
DutyFactor
(%)
Structural shielding (dB)
Case/Configuration (ref. Table 5)
e.i.r.p. density (dBm/MHz)
Case 4 a) Case 4 b) Case 4 a) Case 4 b)
tail (upper shell only) 10 3 725
1.0 32.6 5.0 0.0 –5.1 –0.1
Avionics communication bus 500 3 1 500
Structural sensors 45 5 225
External imaging sensors (cameras, etc.)
1 000 2 2 000
left wing (upper shell only)
11 2 860
1.0 25.0 5.0 0.0 –6.2 –1.2
Avionics communication bus 500 1 500
Structural sensors 45 8 360
External imaging sensors (cameras, etc.)
1 000 2 2 000
right wing (upper shell only)
11 2 860
1.0 25.0 5.0 0.0 –6.2 –1.2
Avionics communication bus 500 1 500
Structural sensors 45 8 360
External imaging sensors (cameras, etc.)
1 000 2 2 000
70 Rep. ITU-R M.2283-0
Annex 5
List of acronyms
APU Auxiliary Power Unit
bps bits per second
CITEL Comisión Interamericana de Telecomunicaciones (Inter-American Telecommunication Commission)
DFS Dynamic frequency selection
ECC Electronic Communications Committee
ECS Environmental control system
EFB Electronic flight bag
EIRP Equivalent isotropically radiated power
EMI Electro magnetic interference
FAA Federal Aviation Administration
FADEC Full Authority Digital Engine Control
FSK Frequency shift keying
FWD Forward
GN Gateway Node
HI High data rate Inside
HIRF High-Intensity Radiated Fields
HO High data rate Outside
IEEE Institute of Electrical and Electronics Engineers

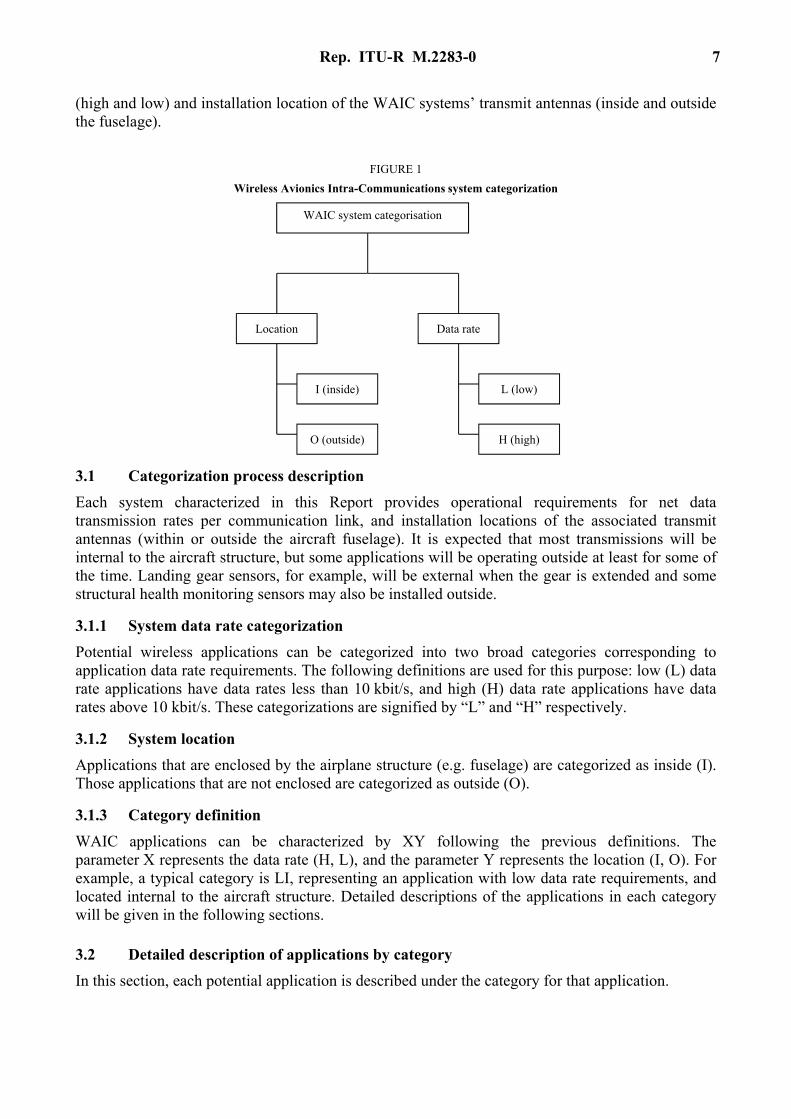
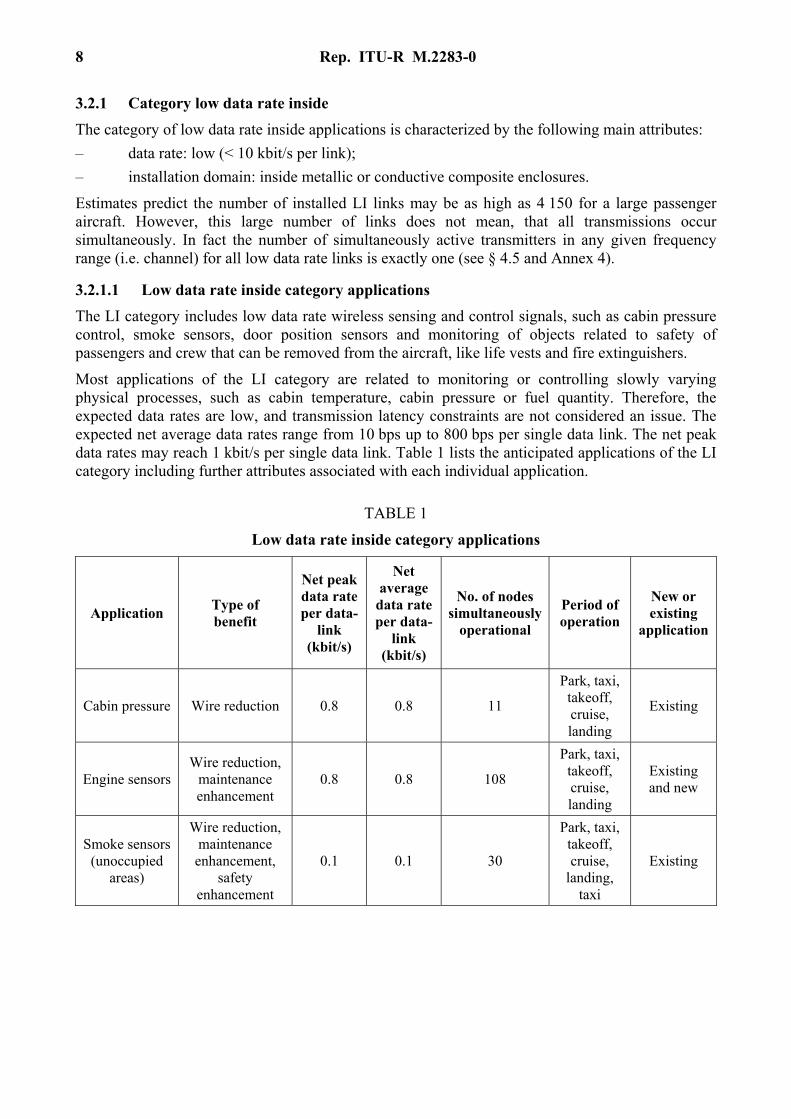
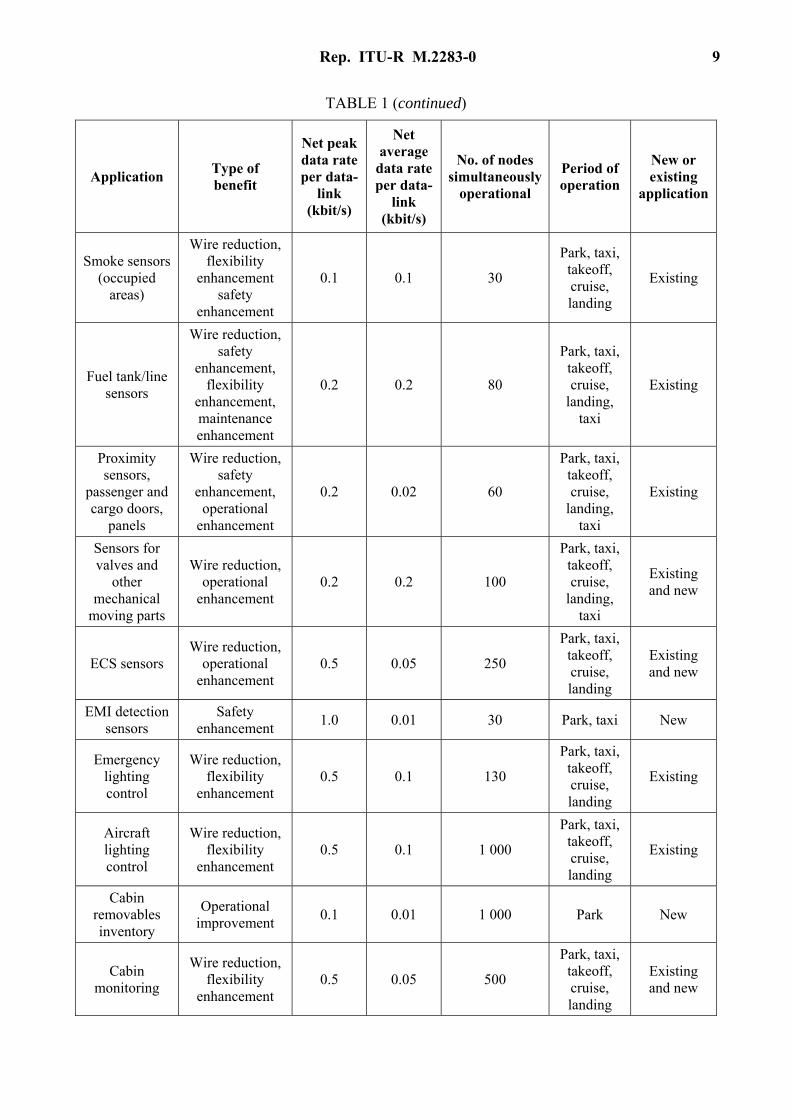
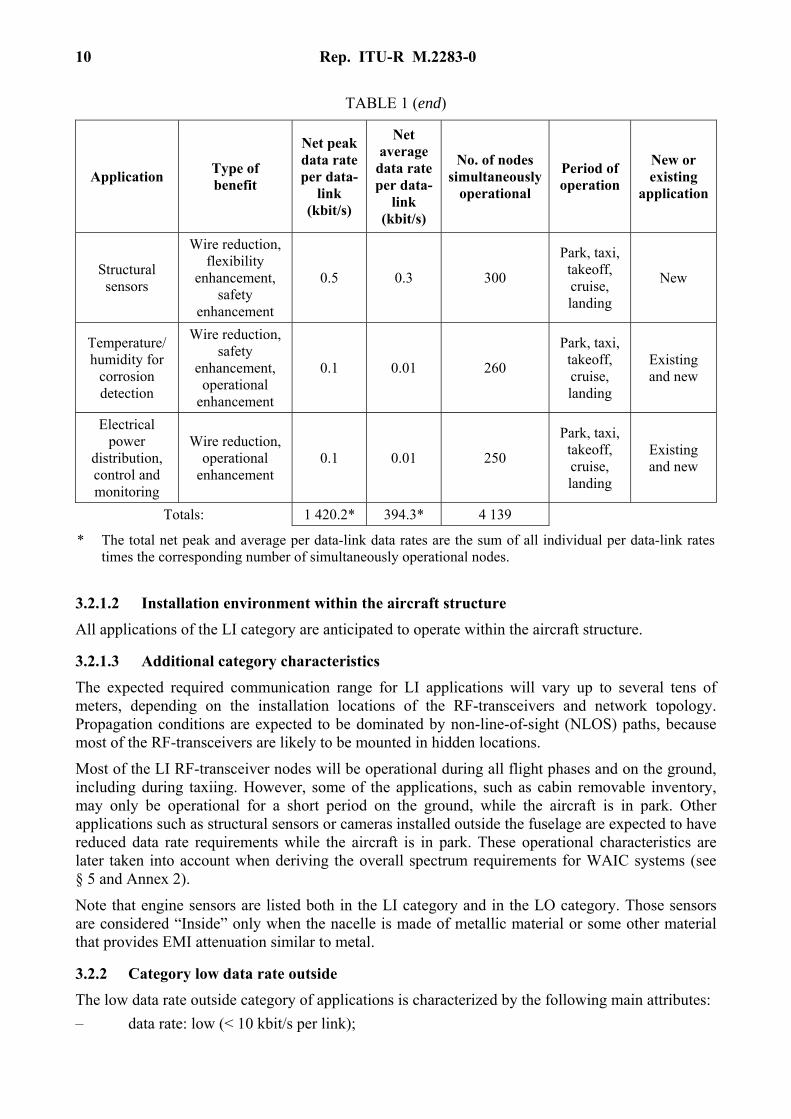
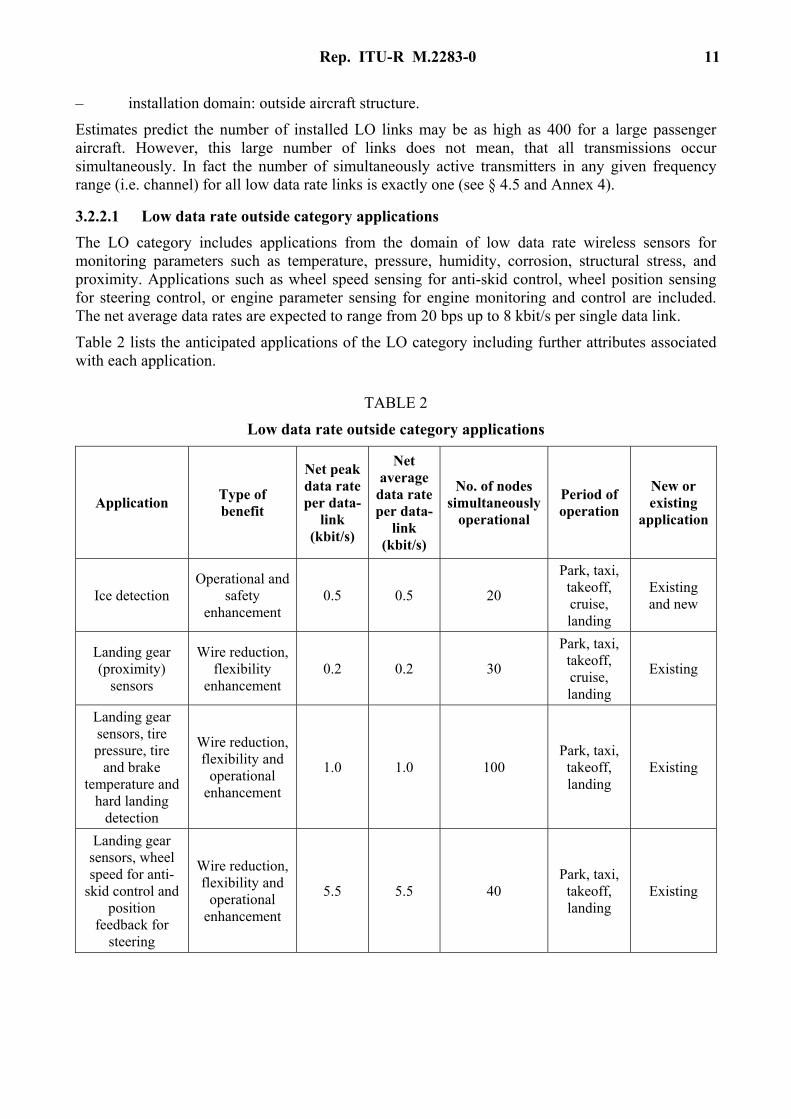
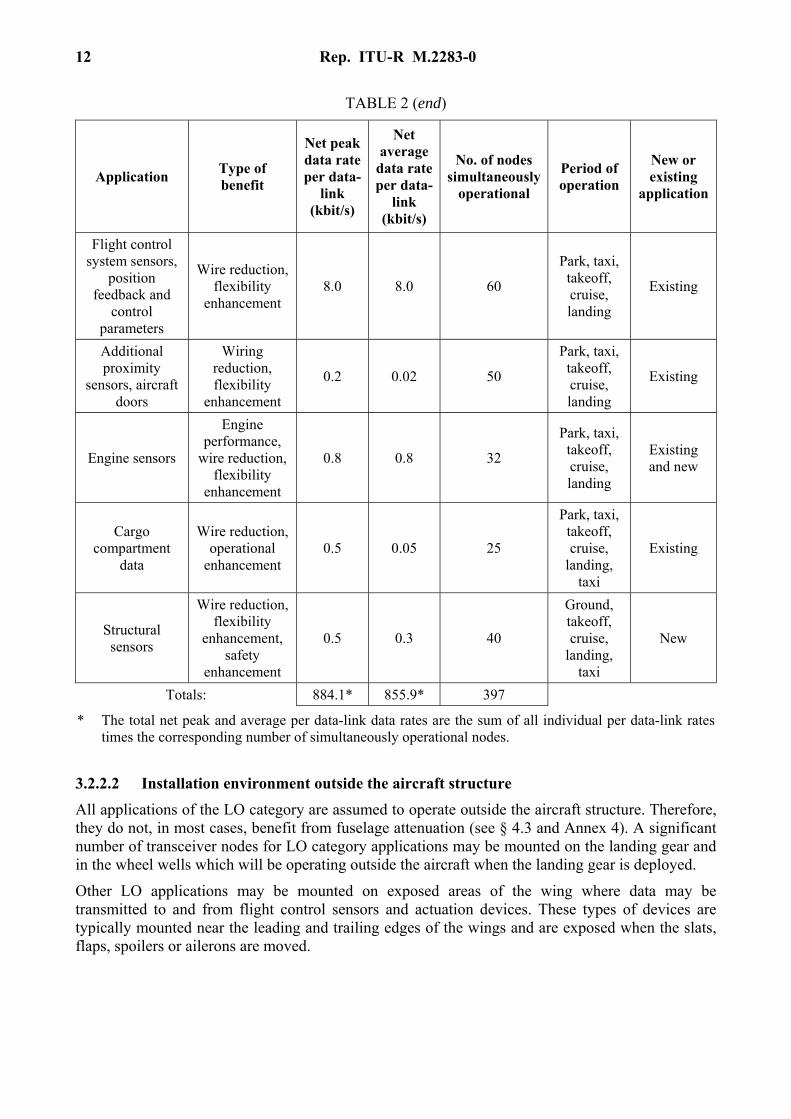

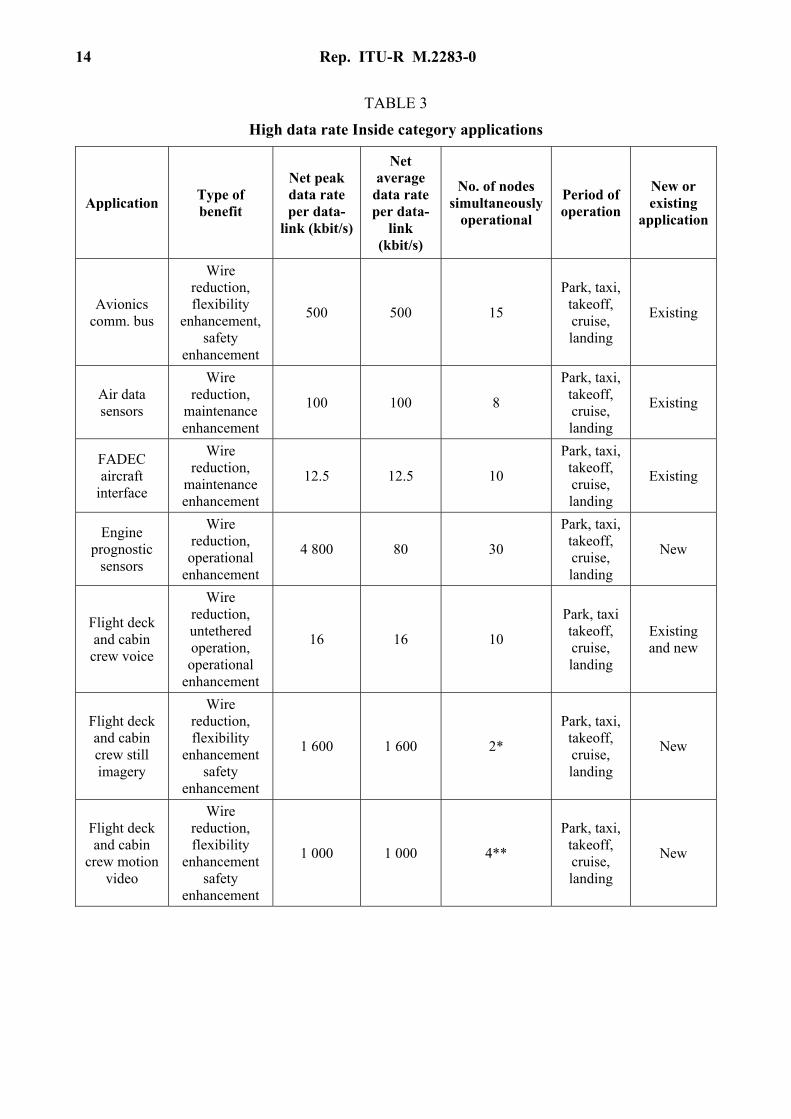
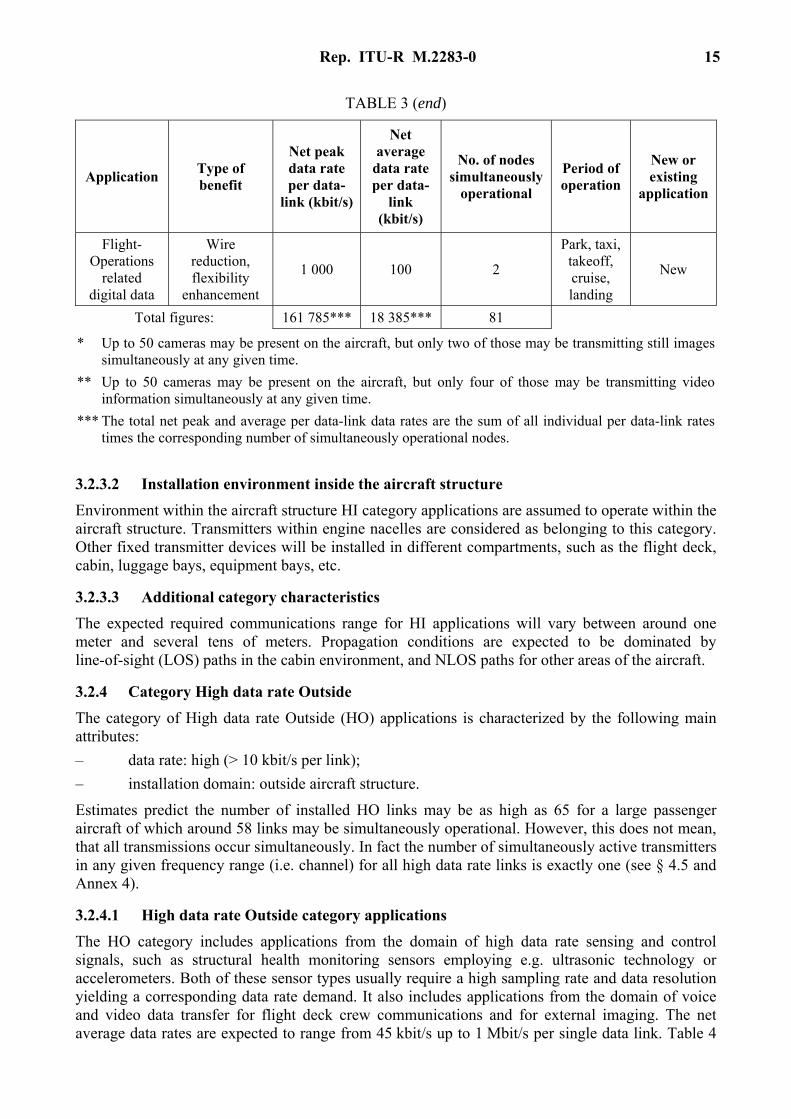
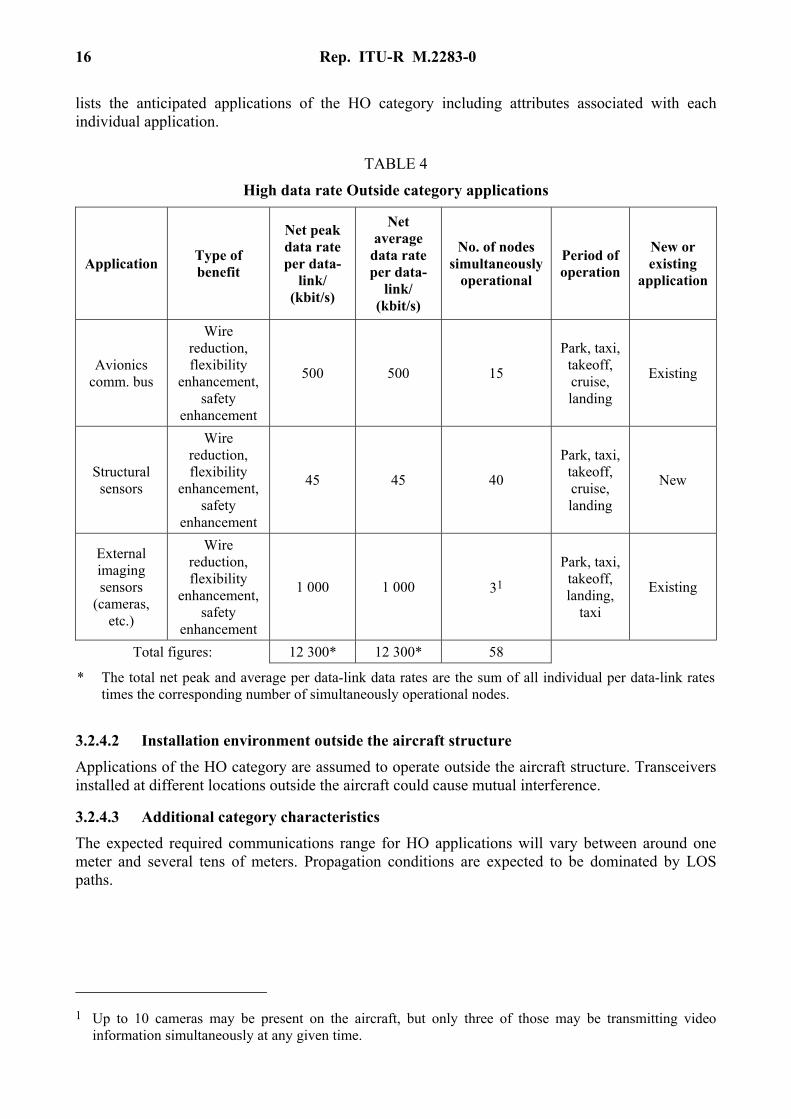
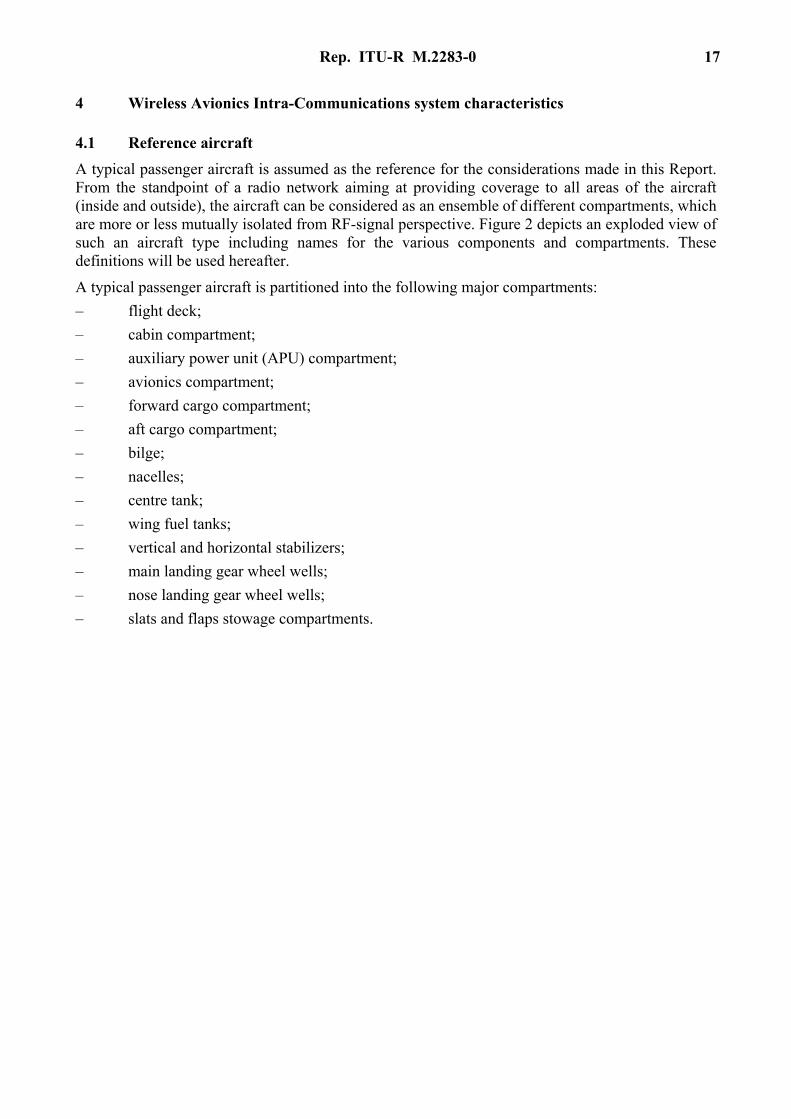
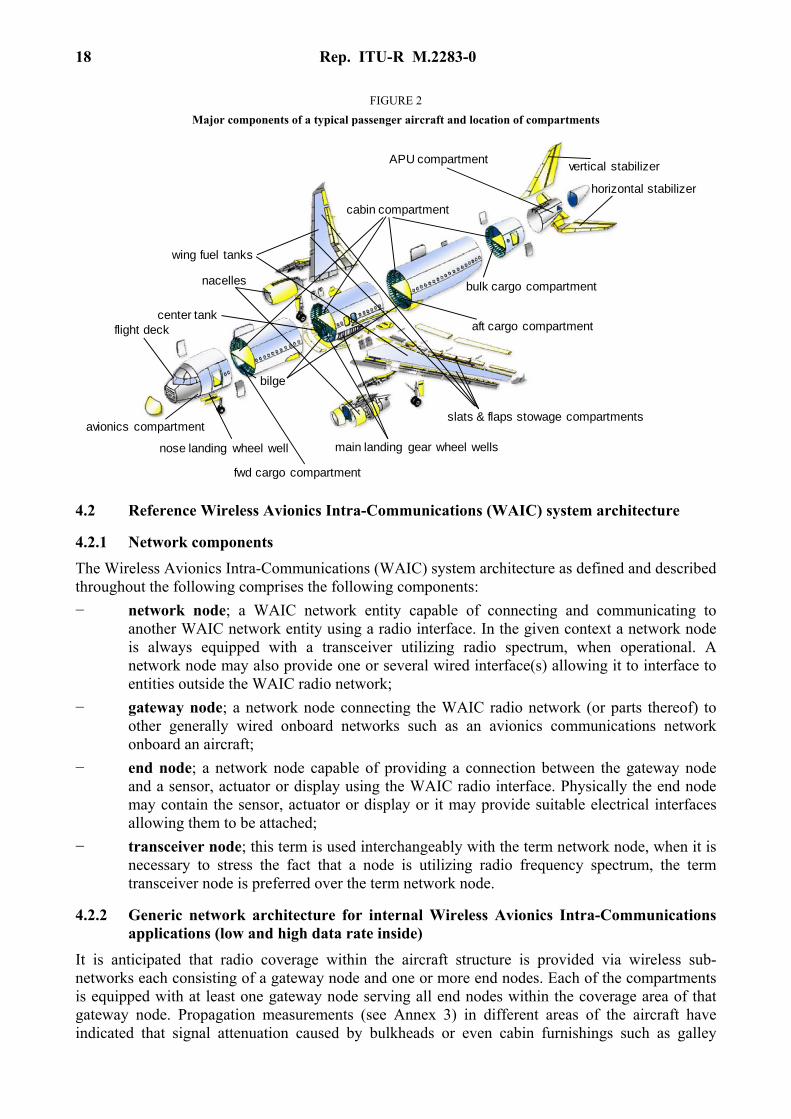
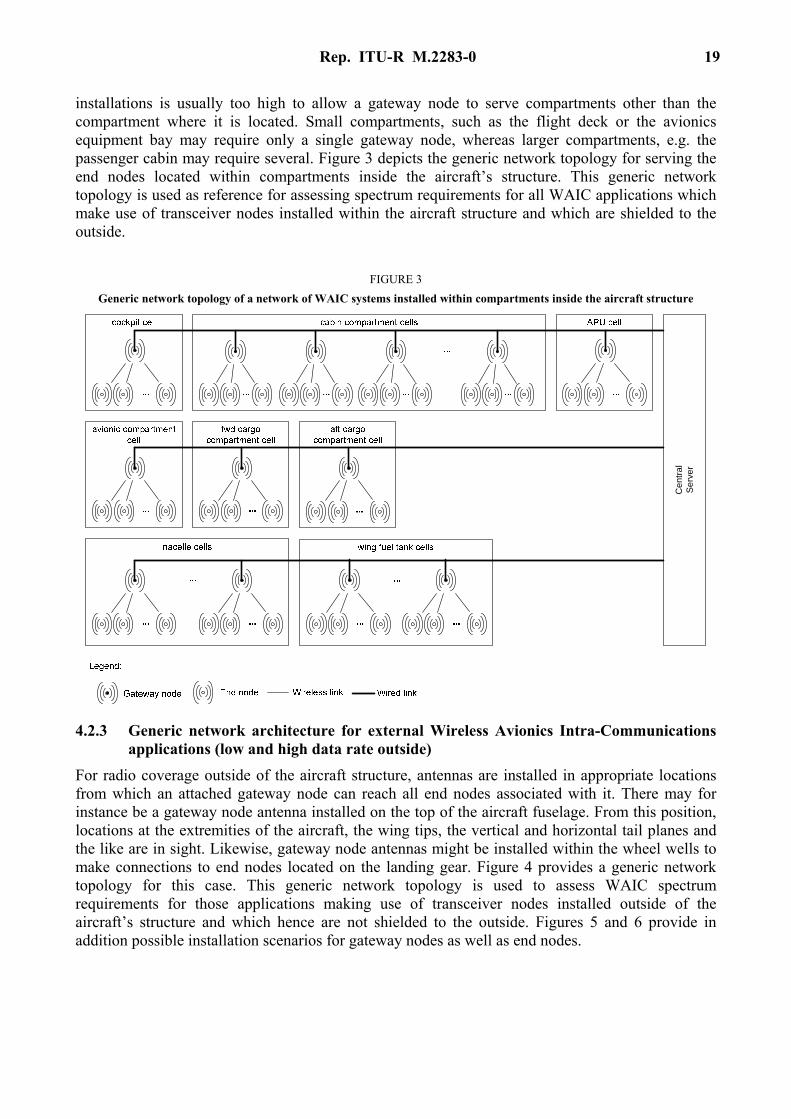
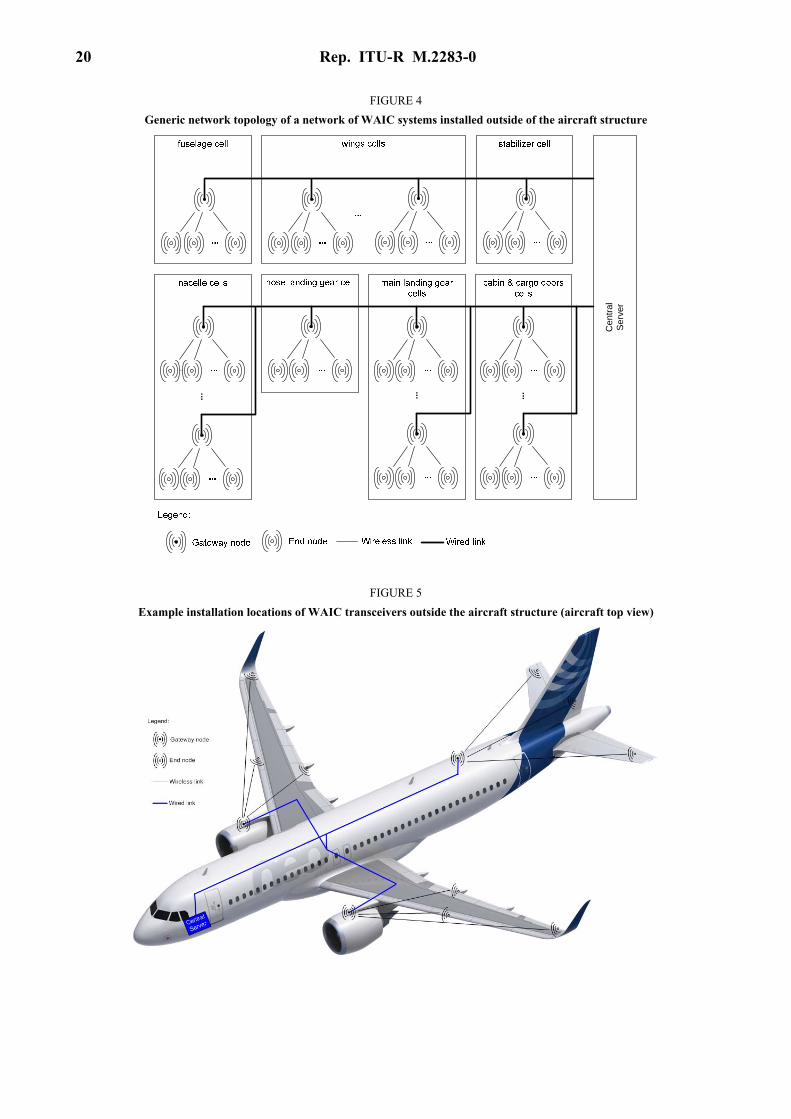
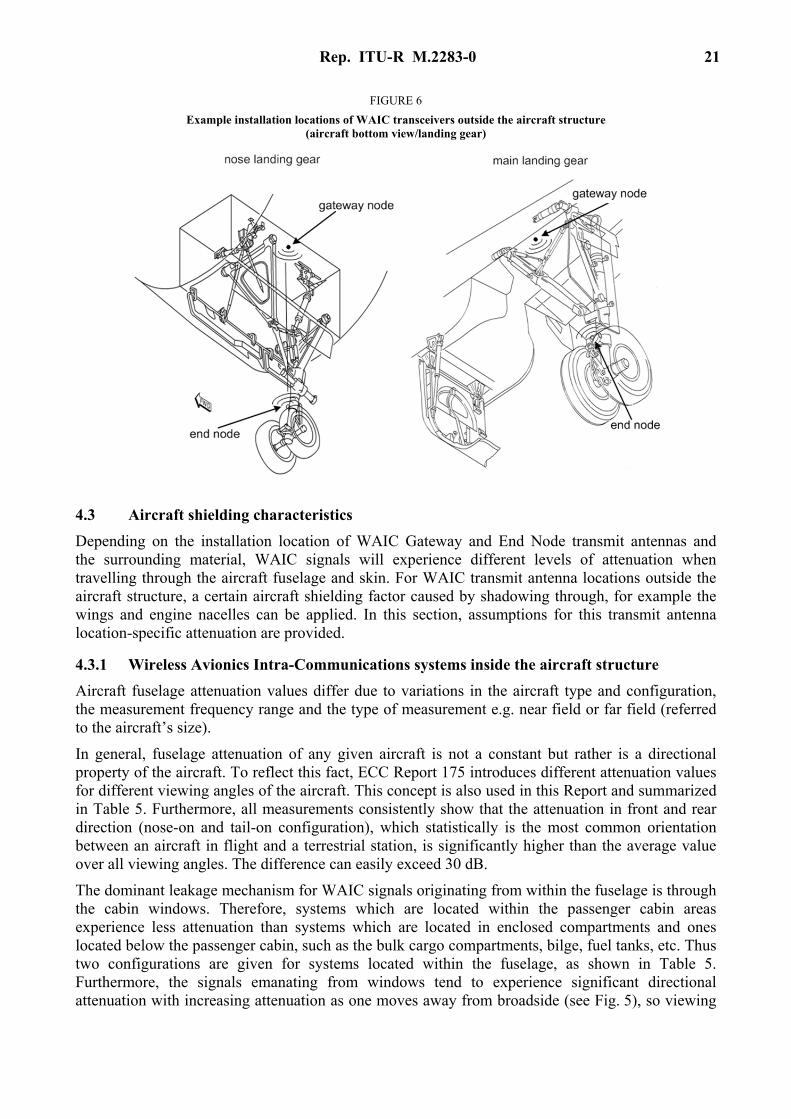
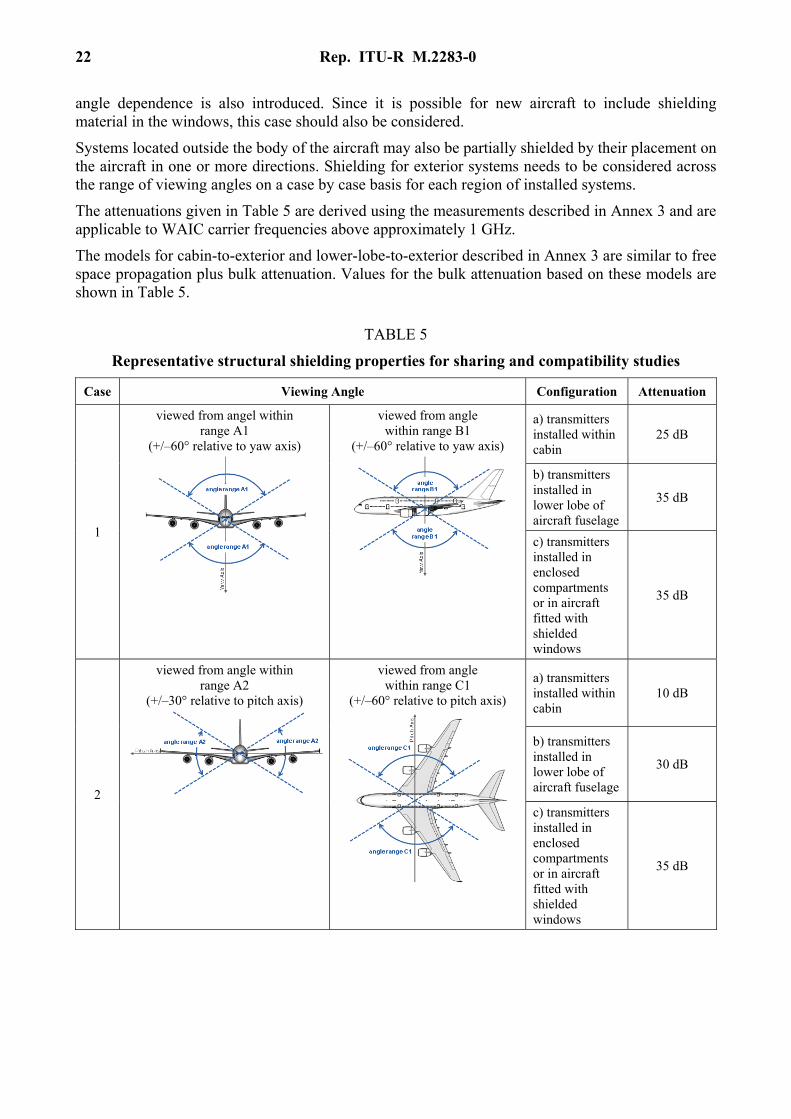
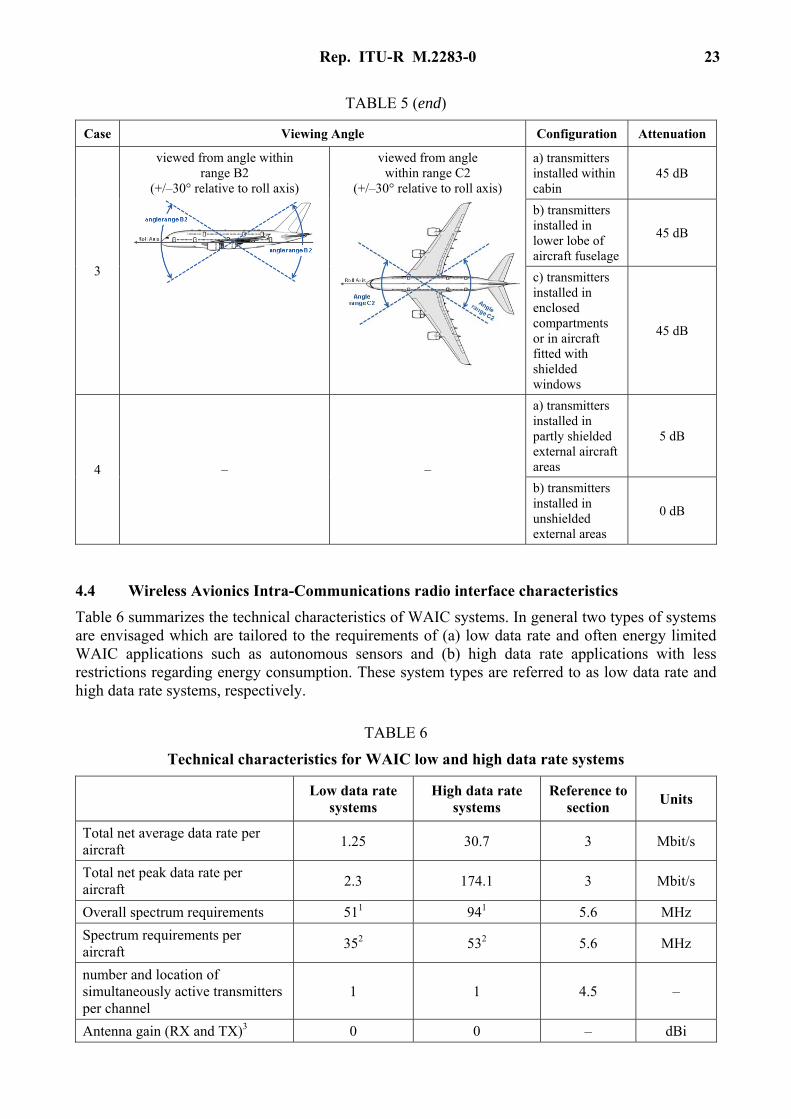
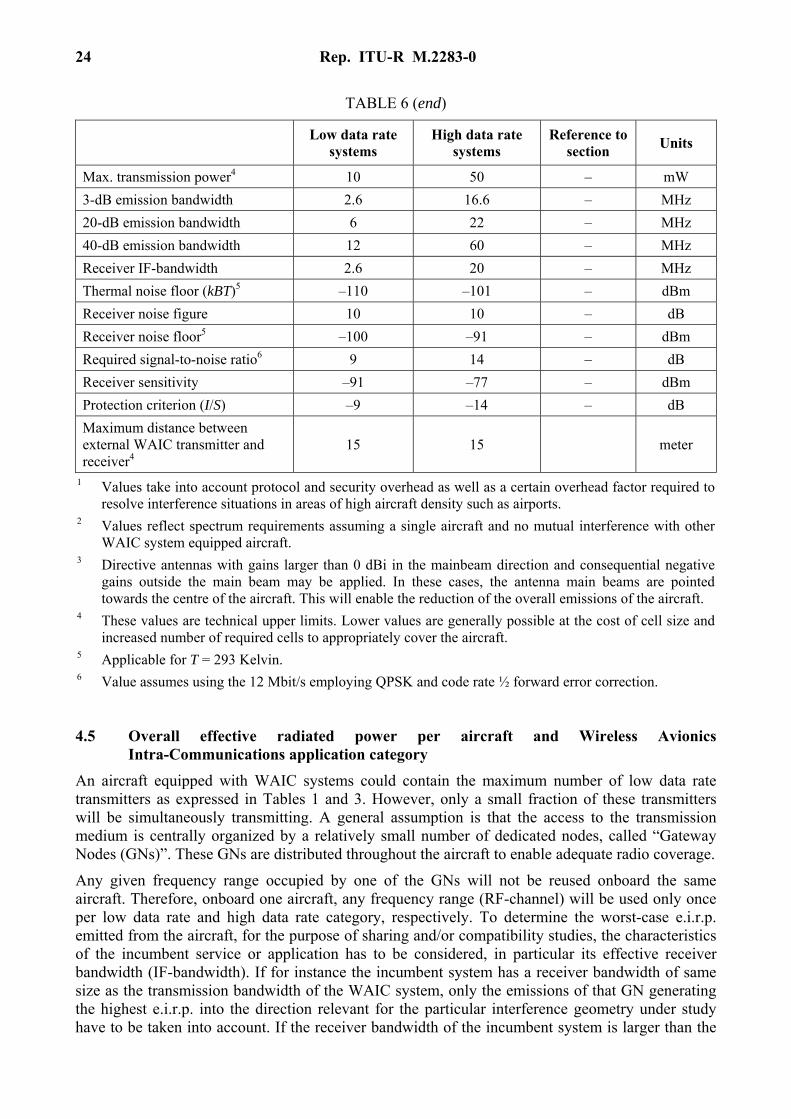
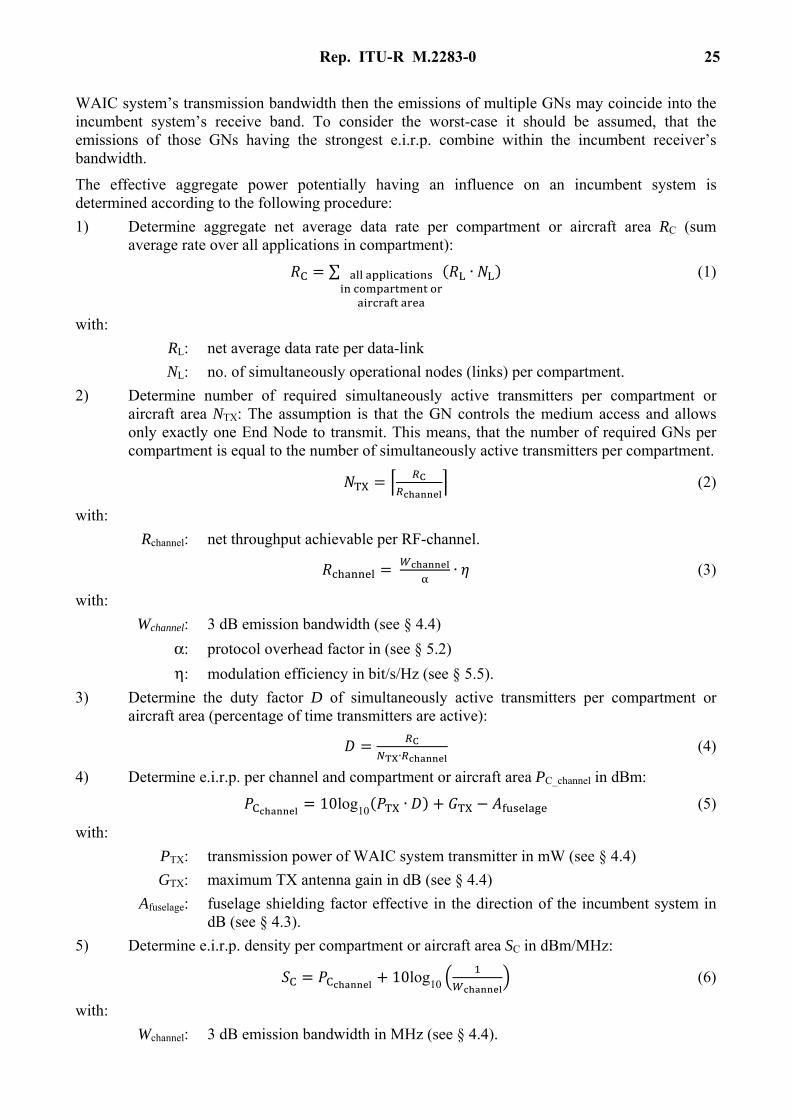
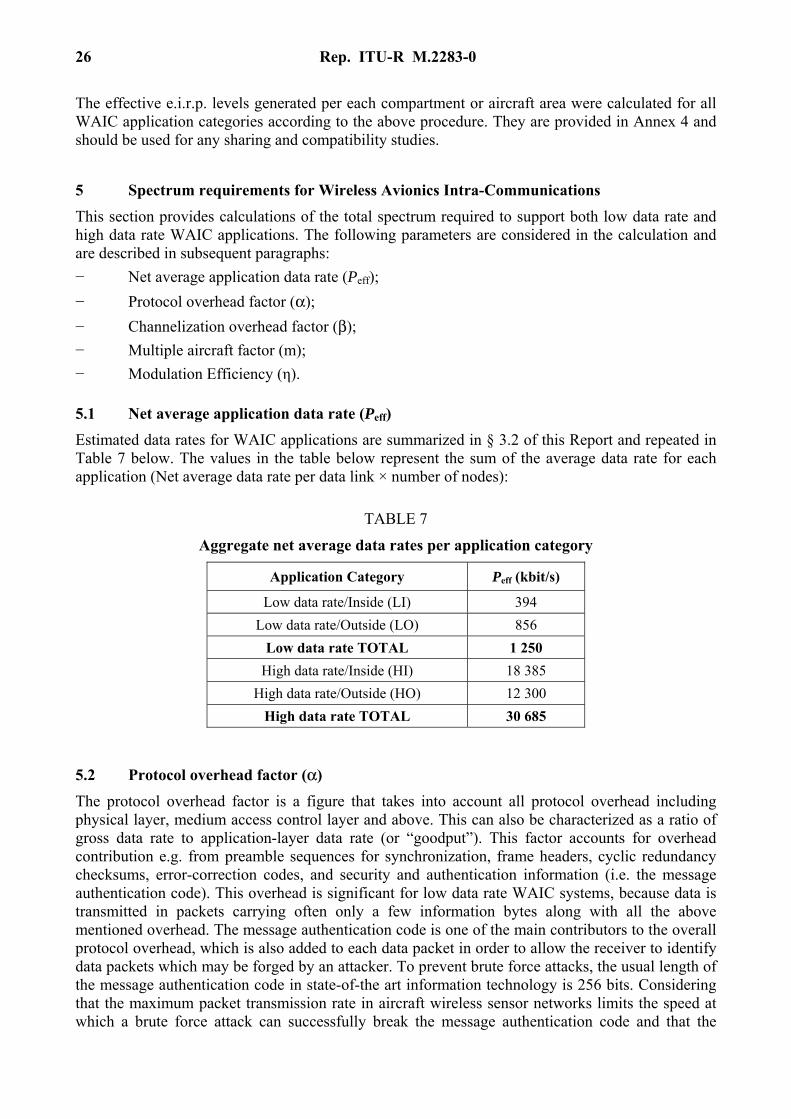
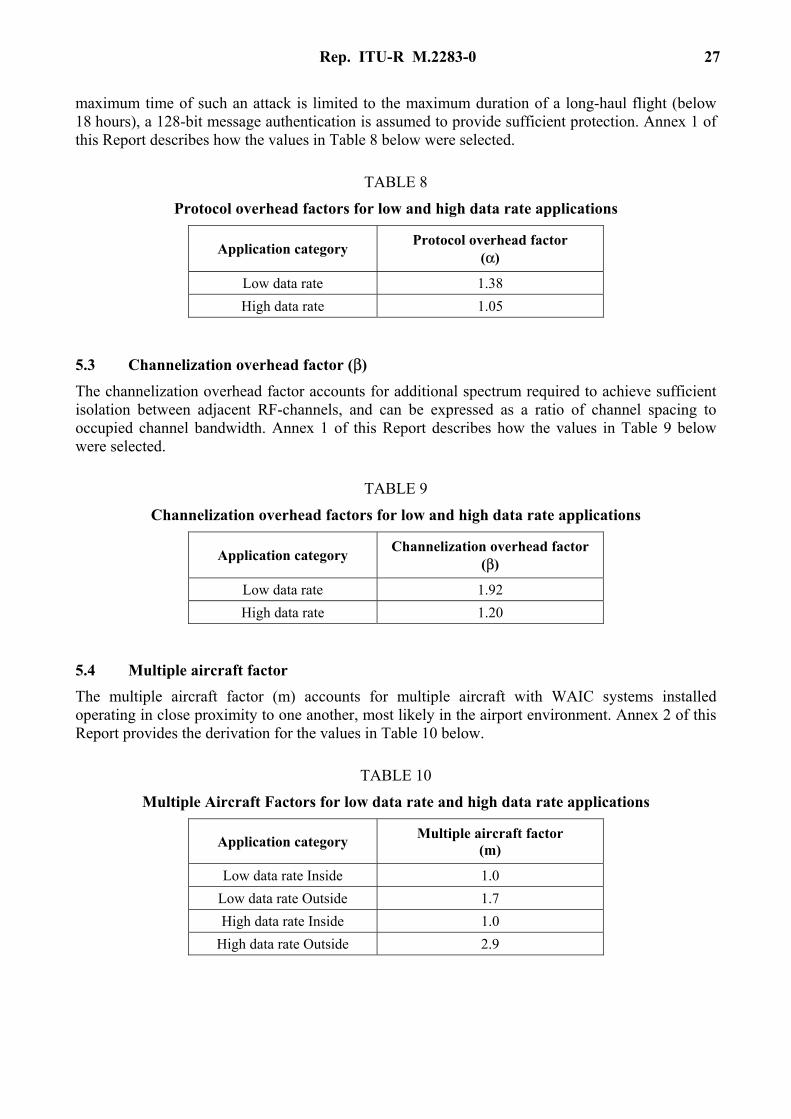
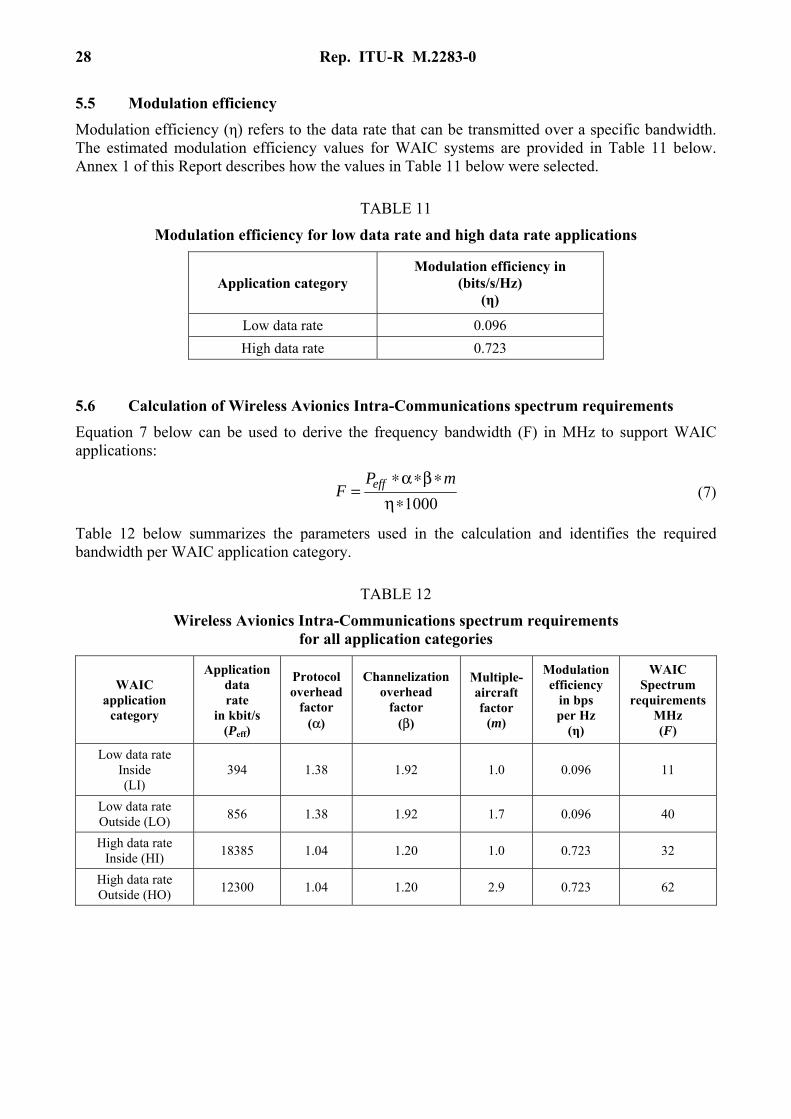
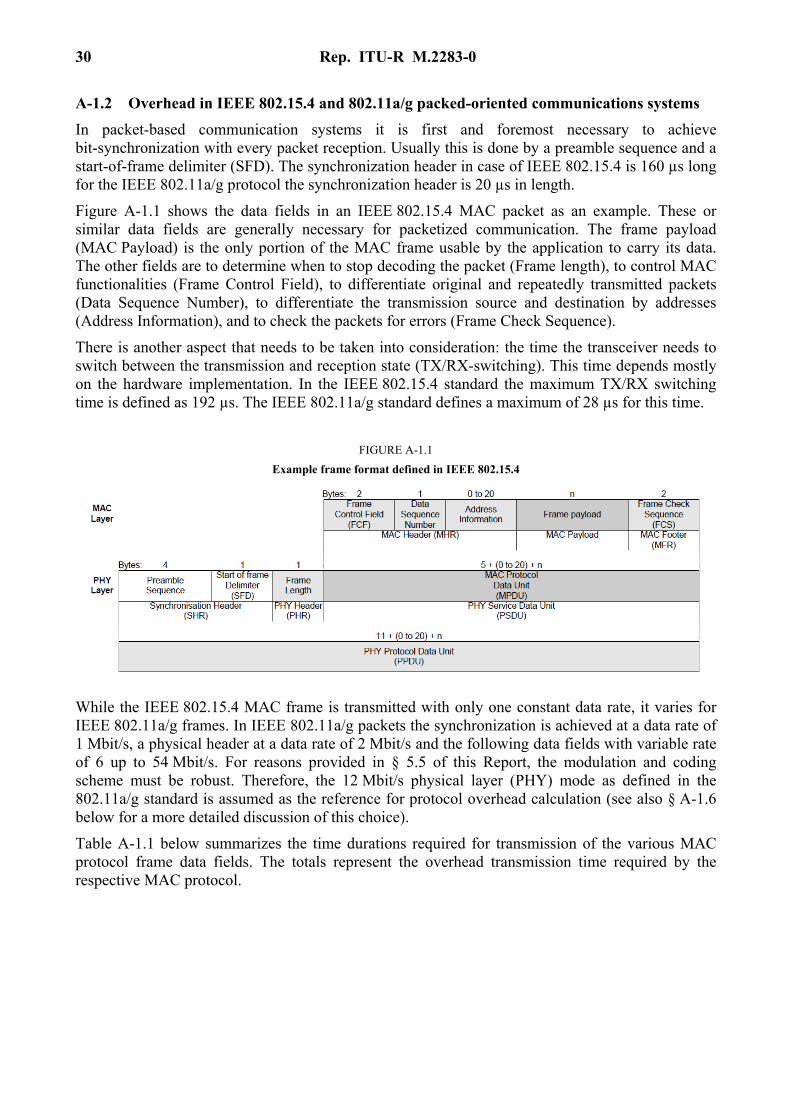
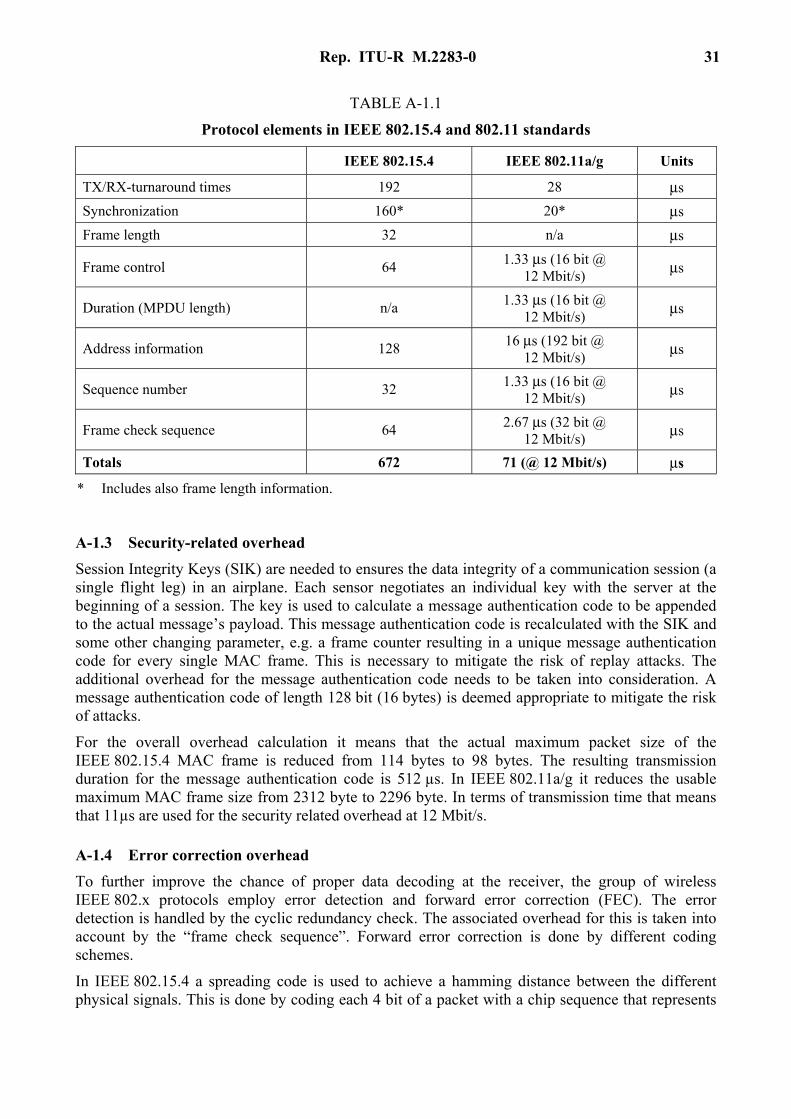
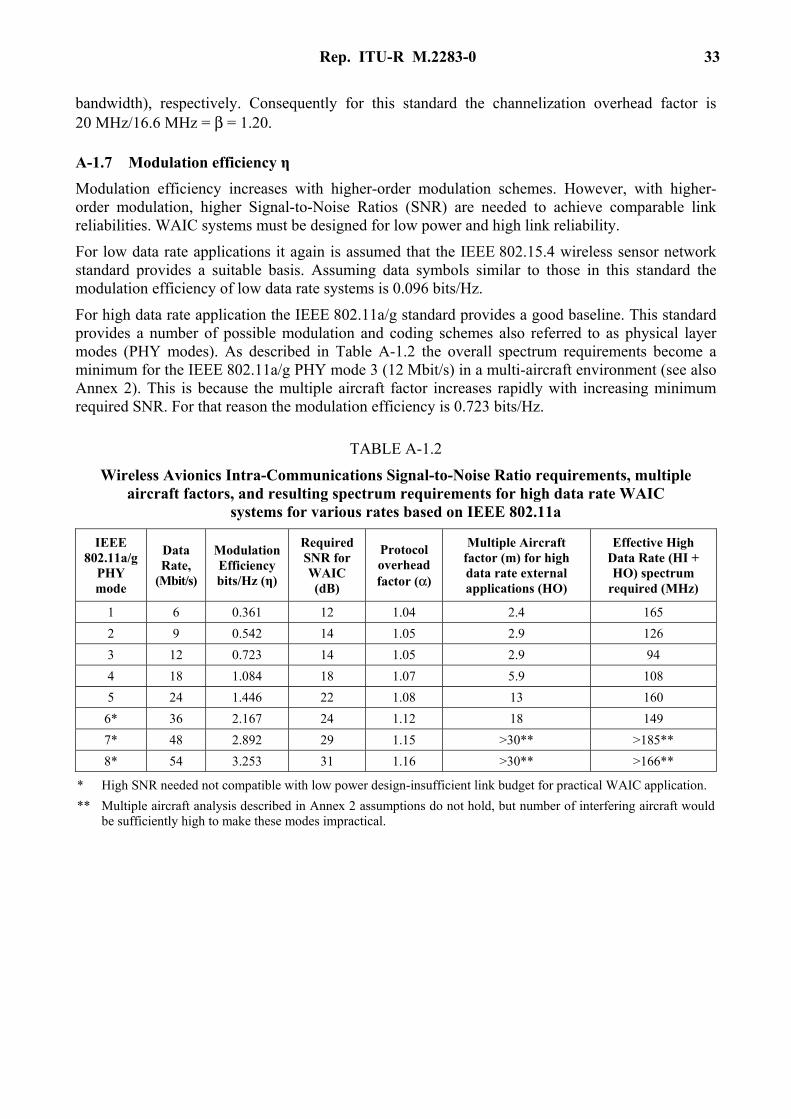
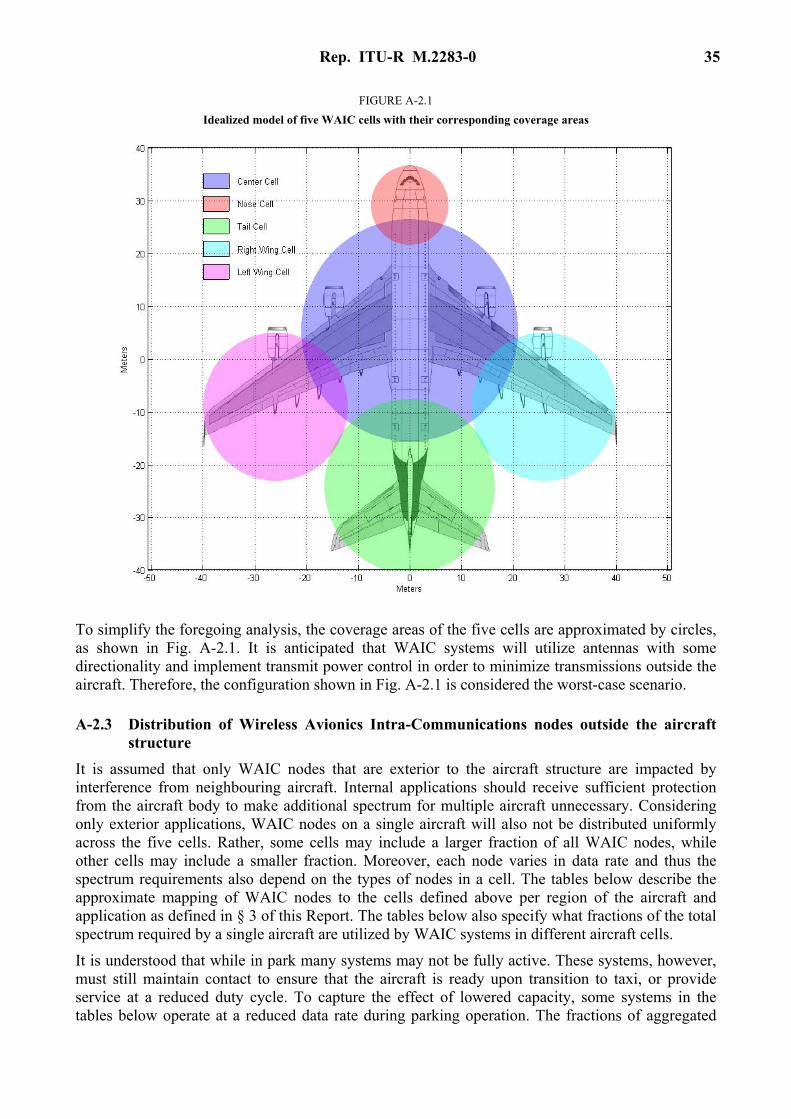
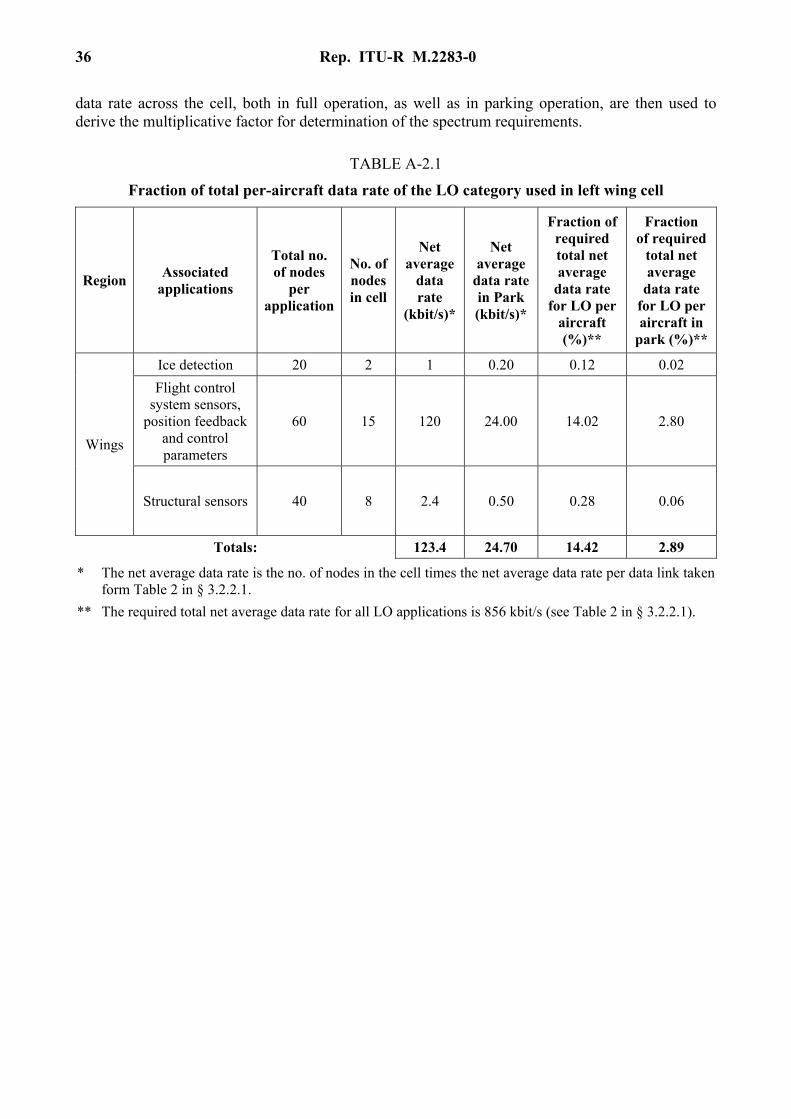
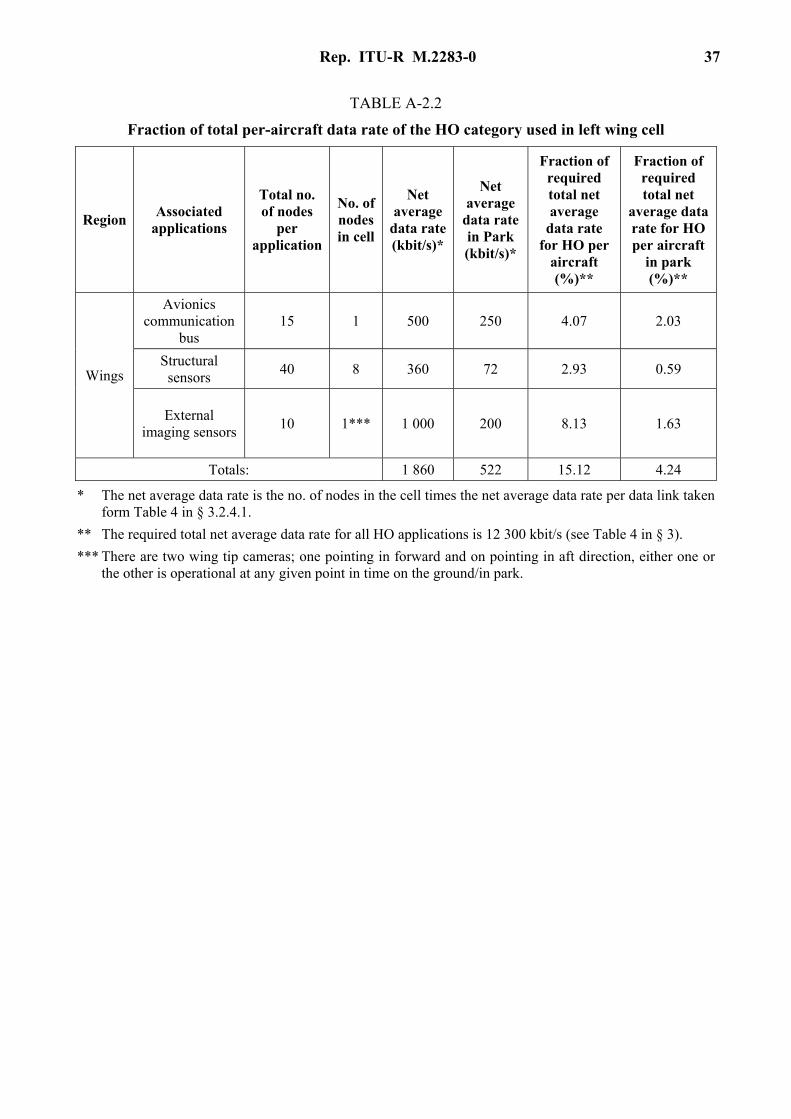
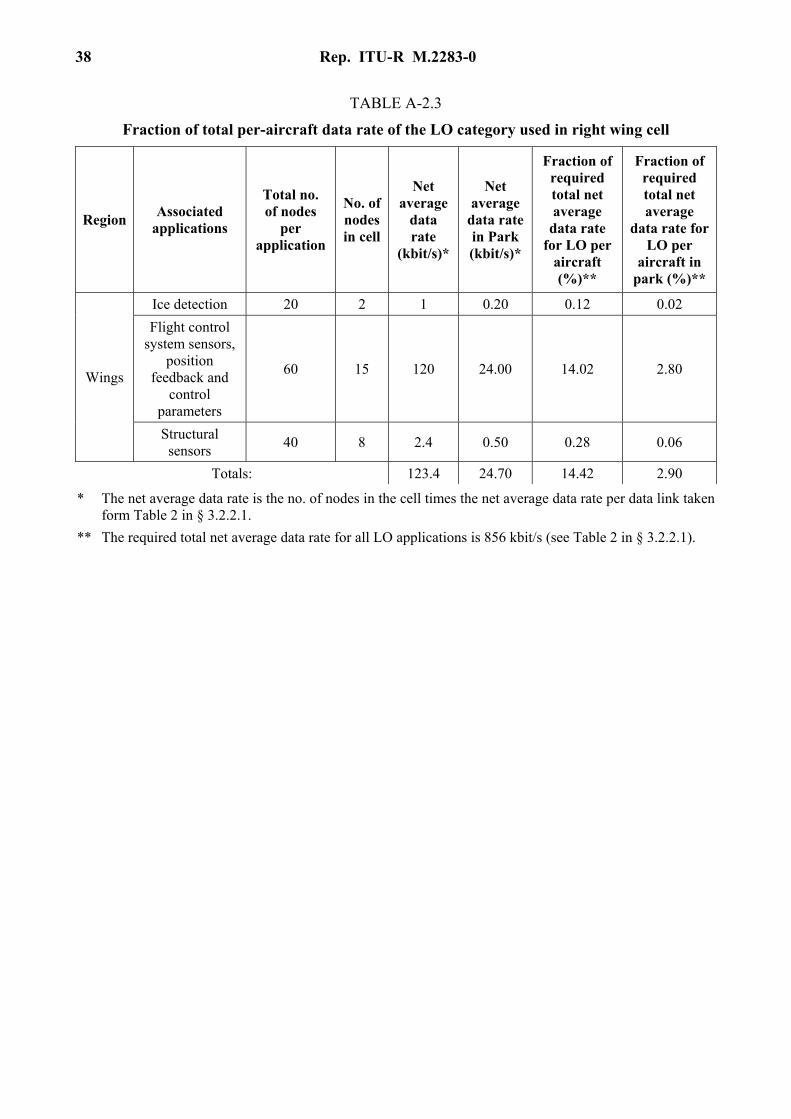
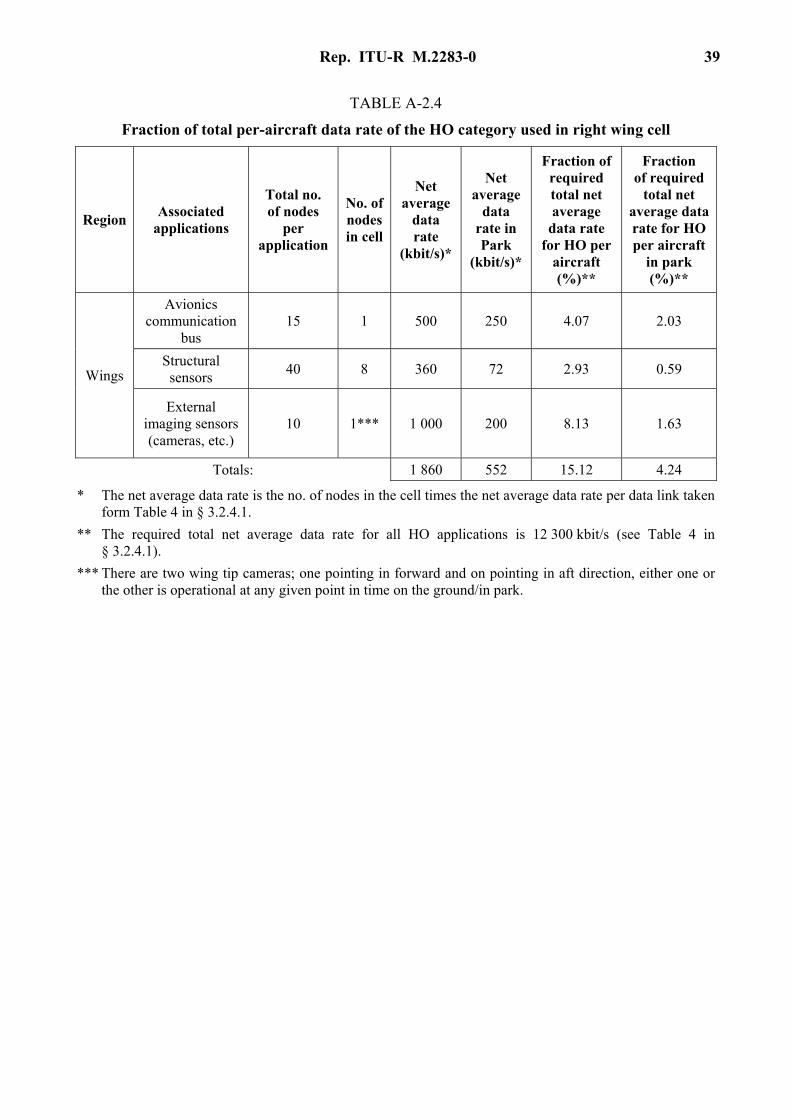
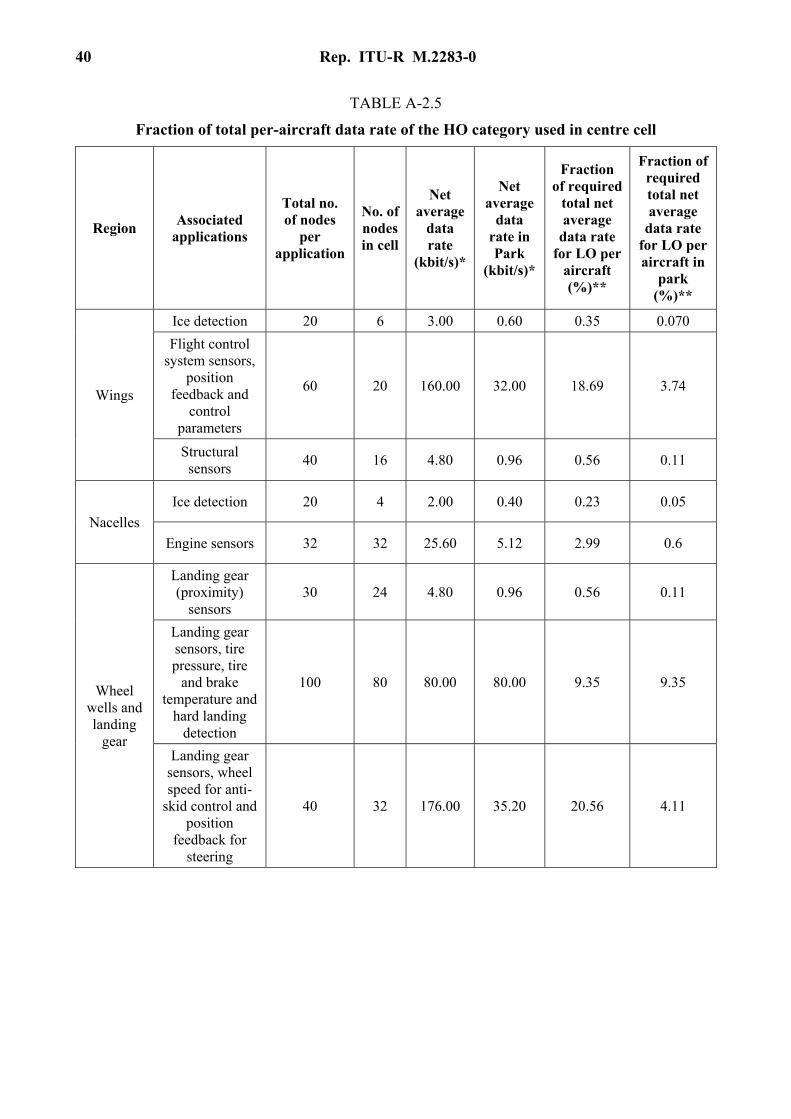
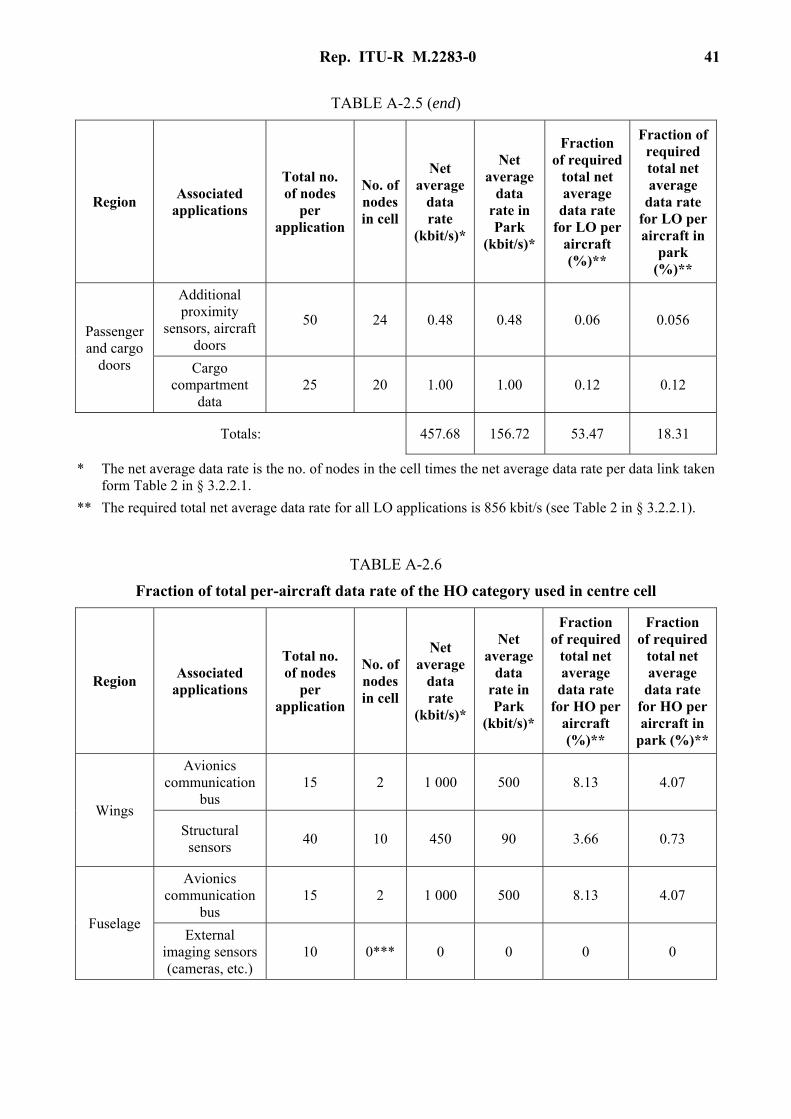
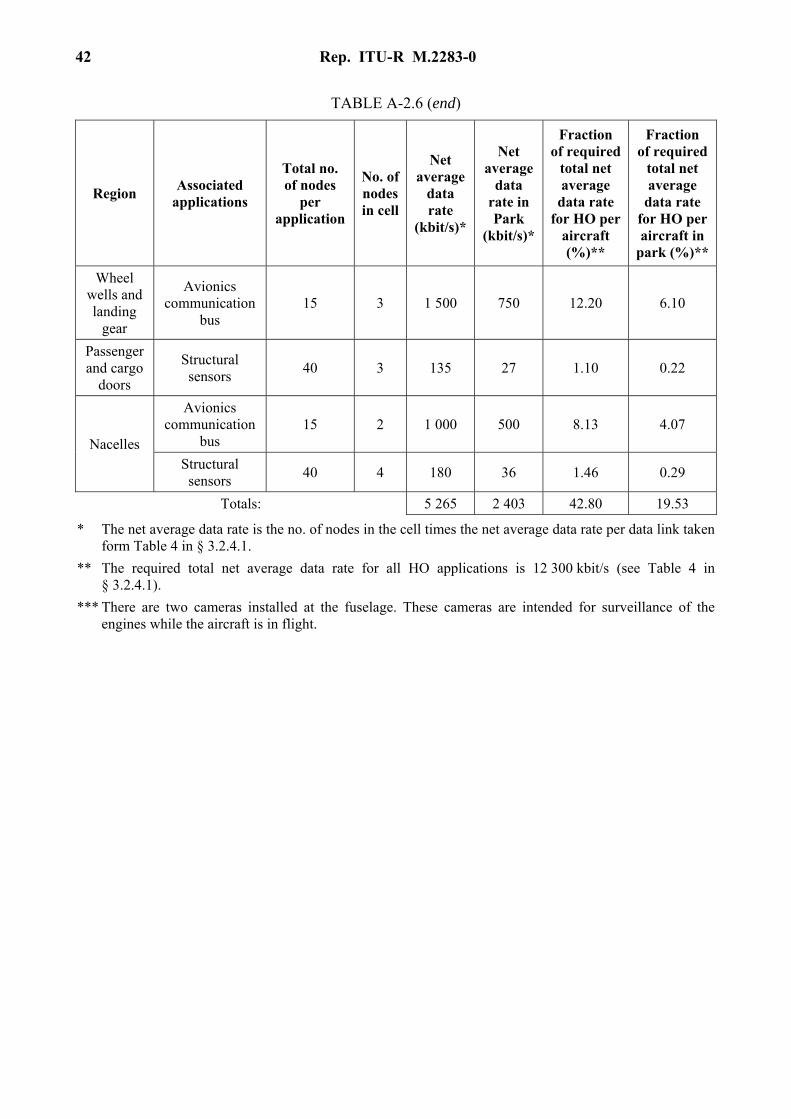
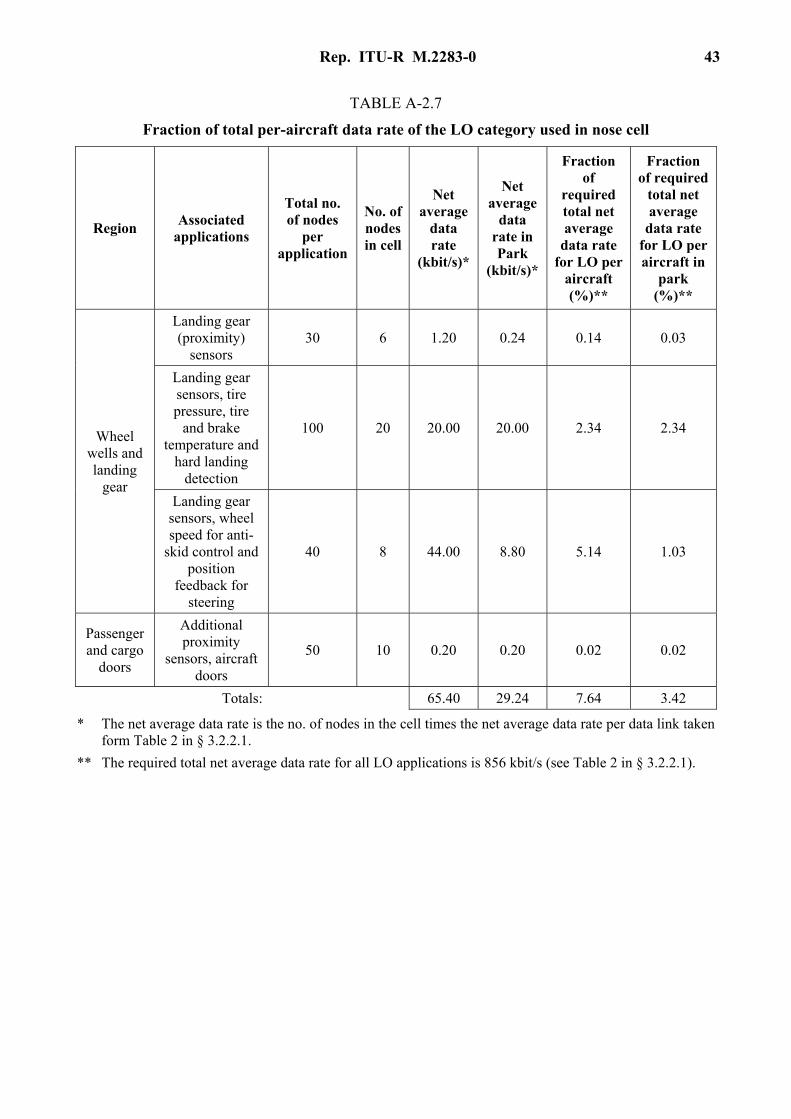
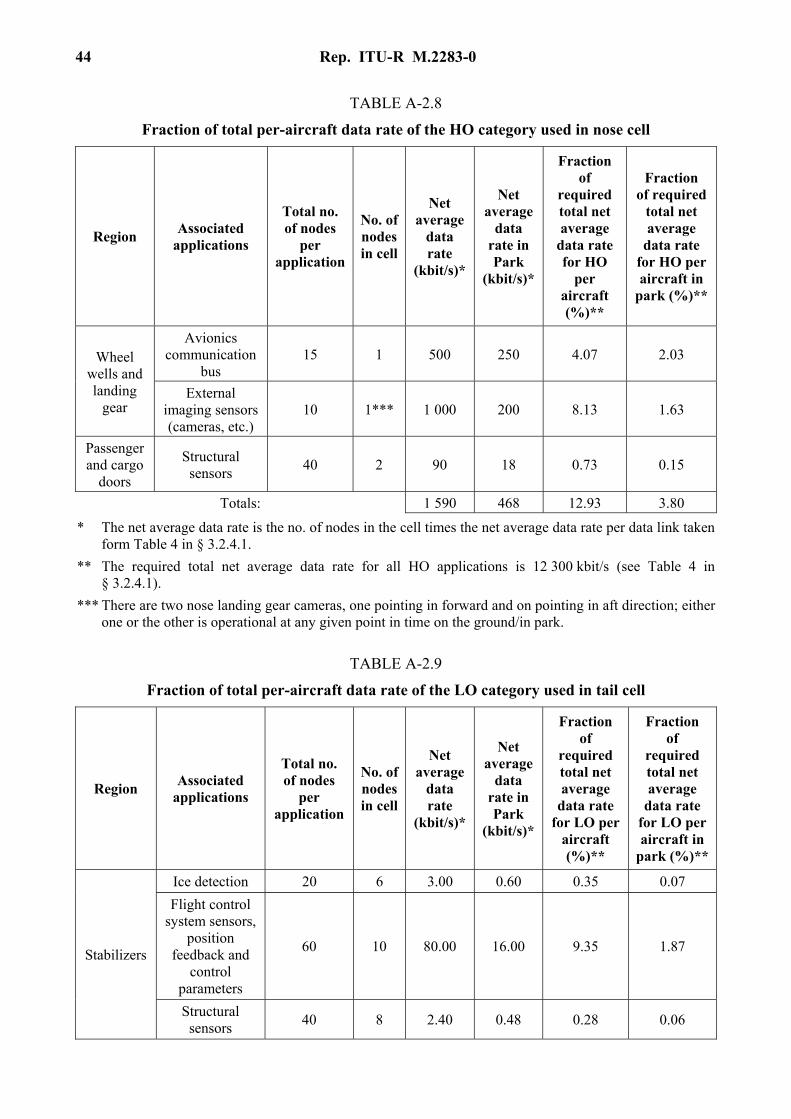
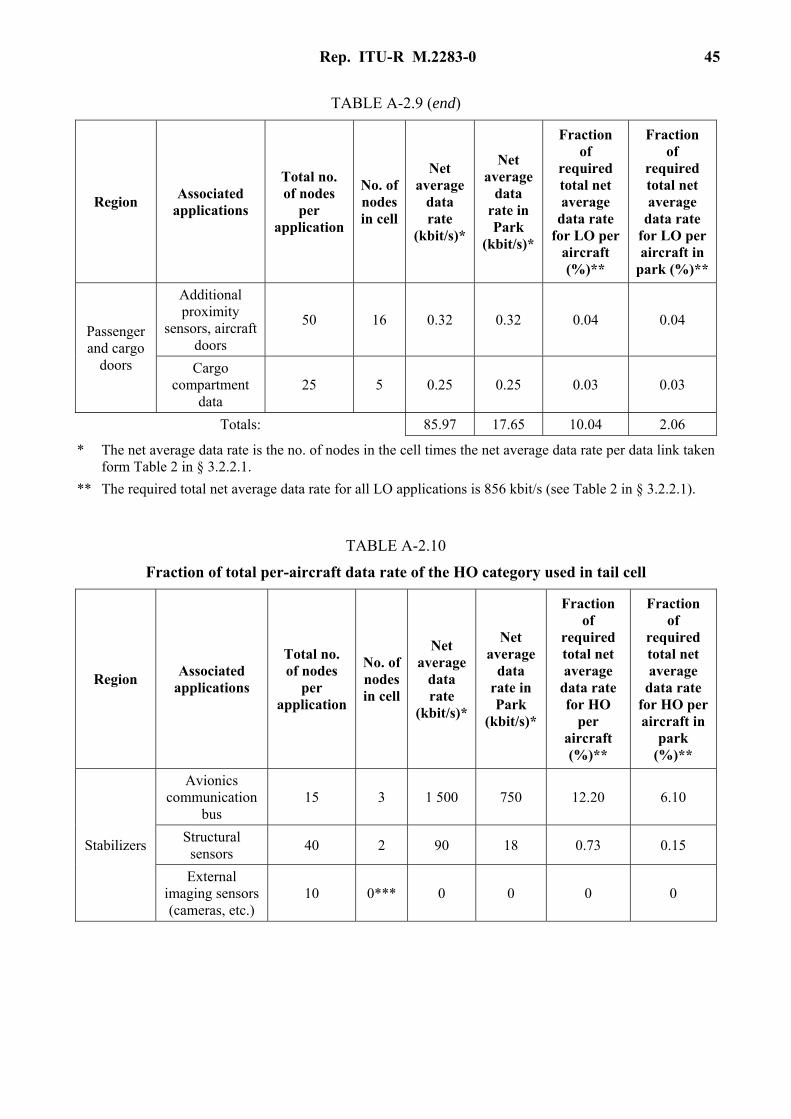
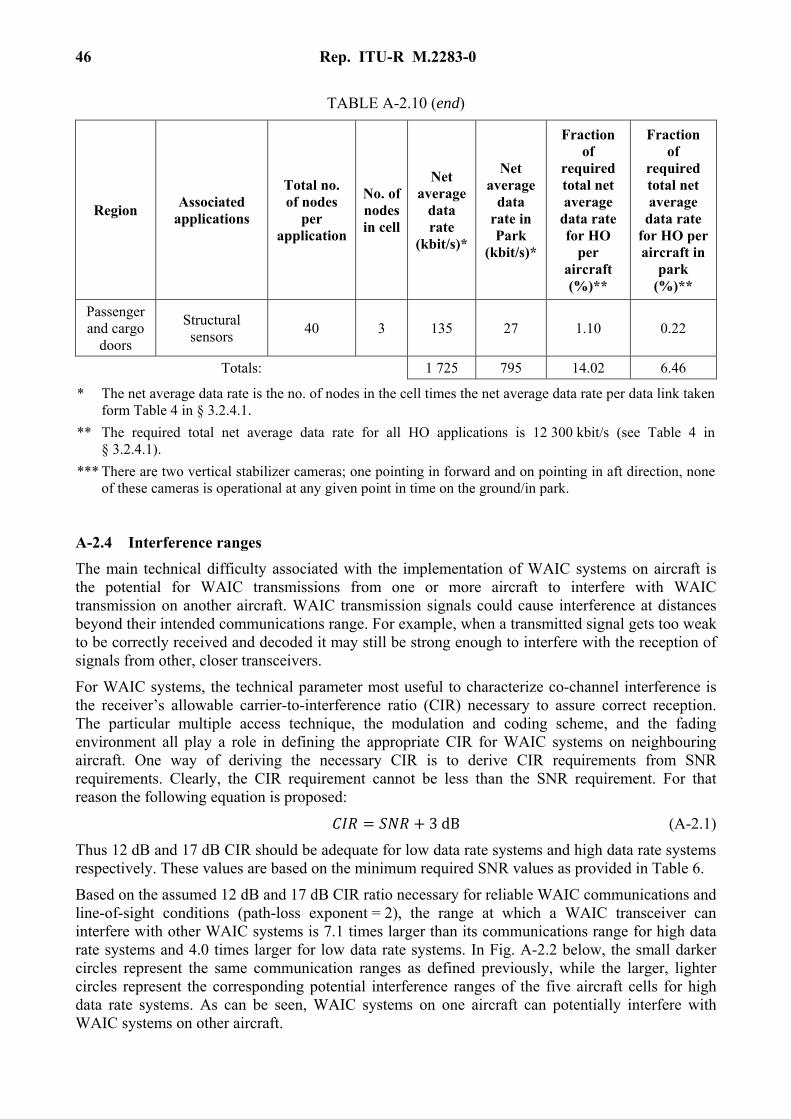
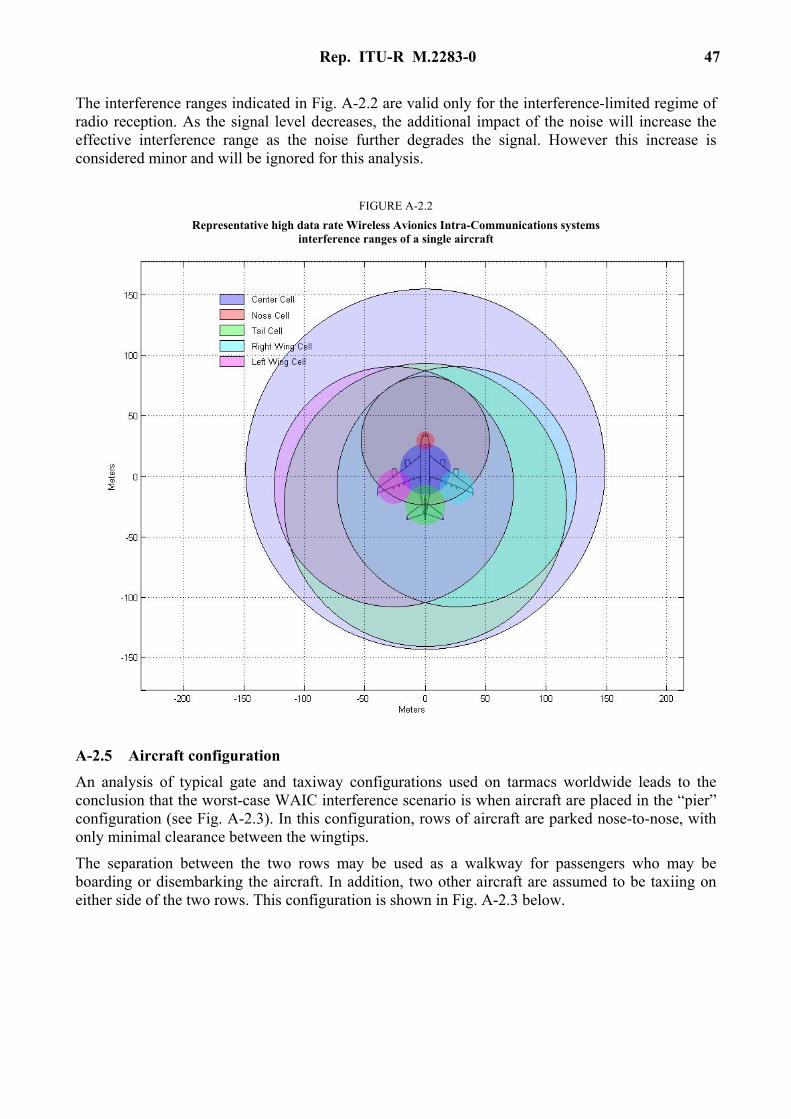
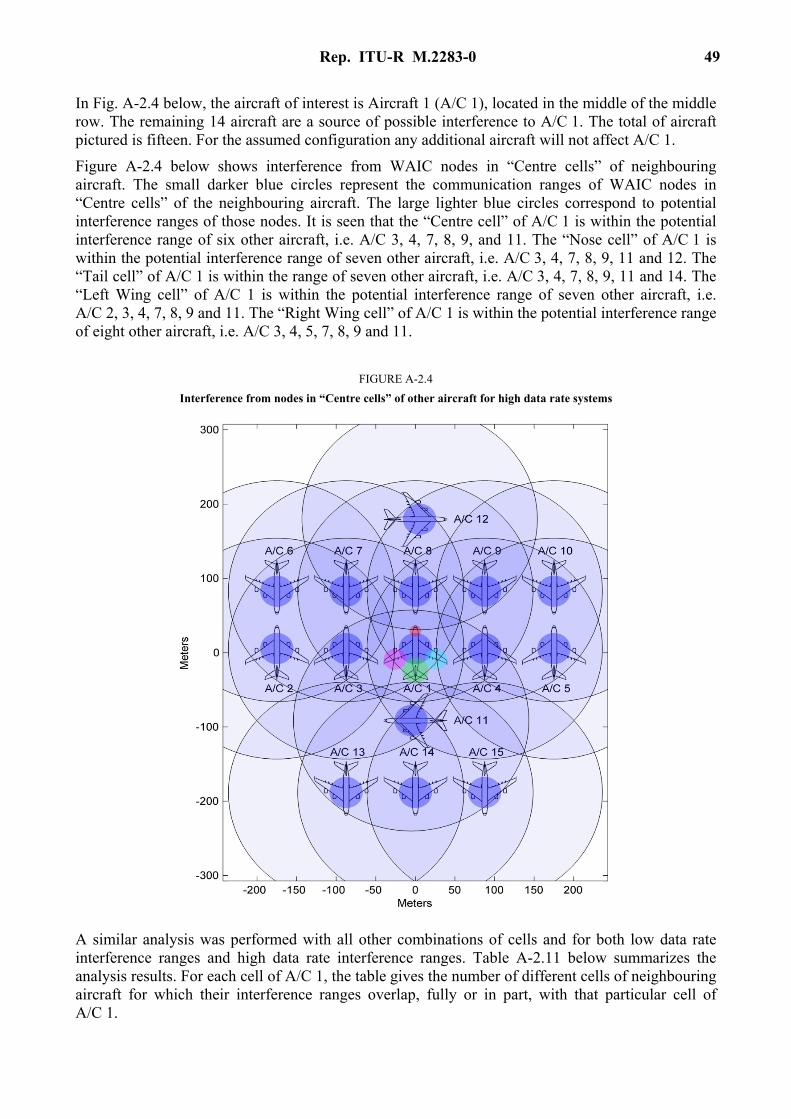
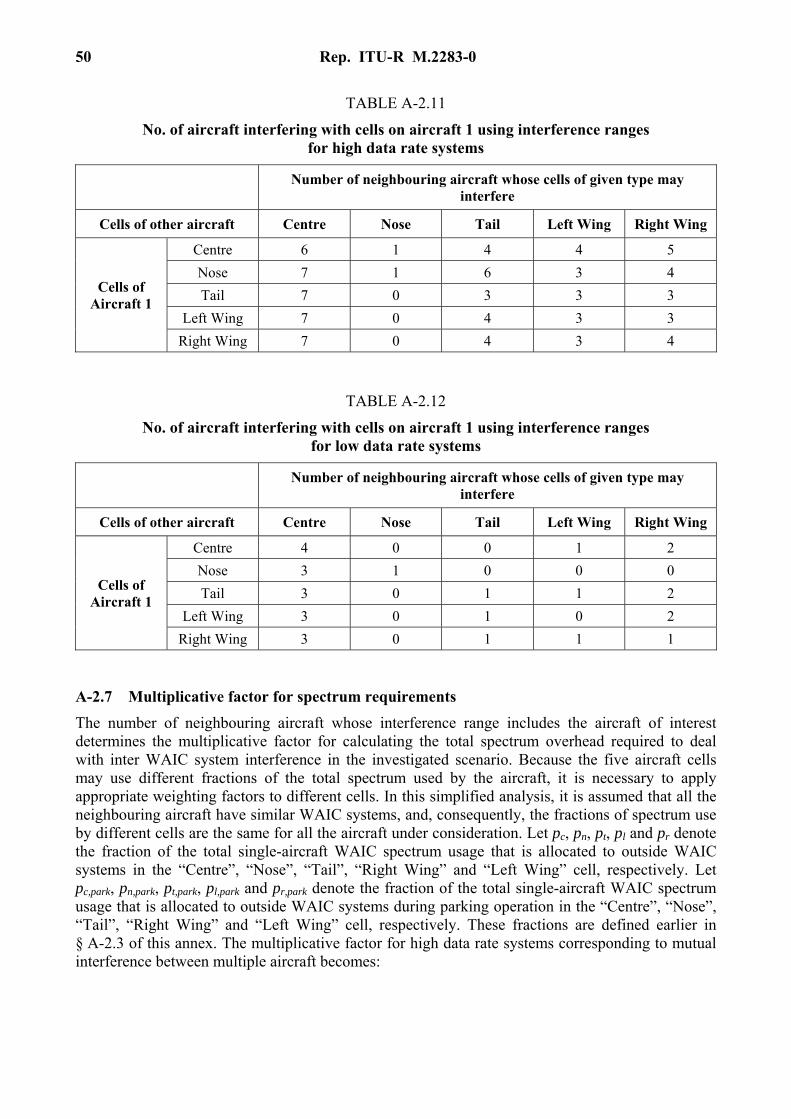
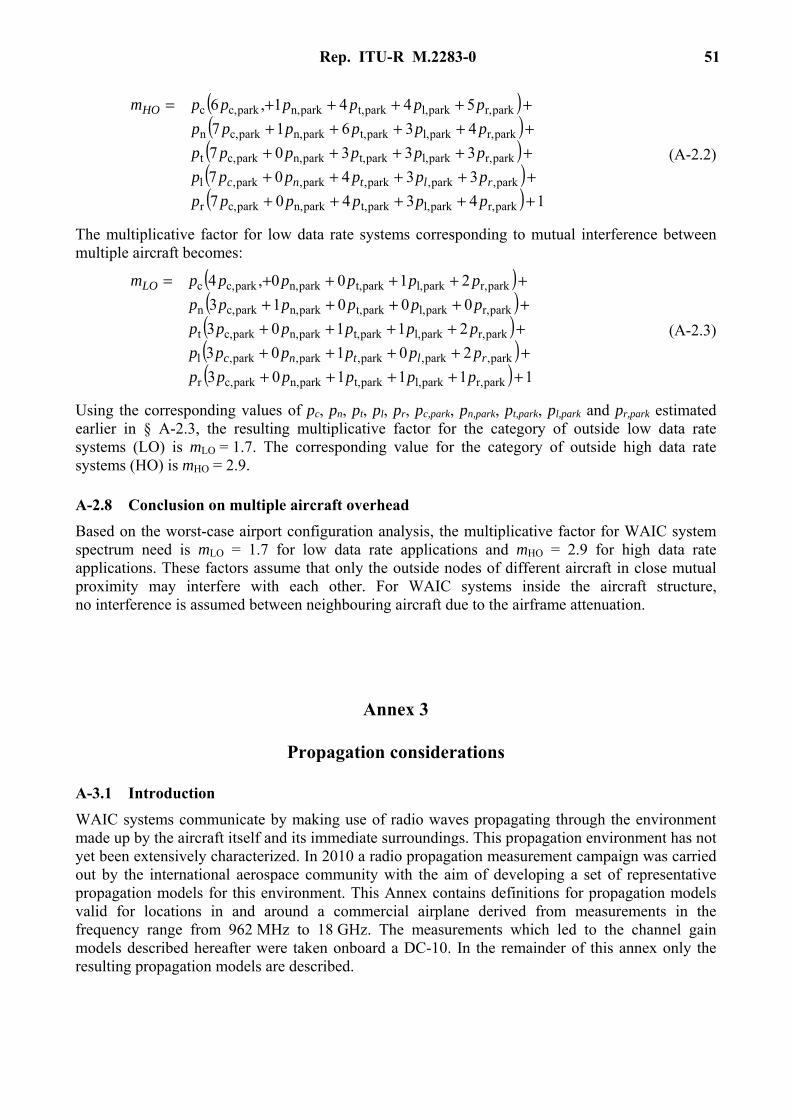
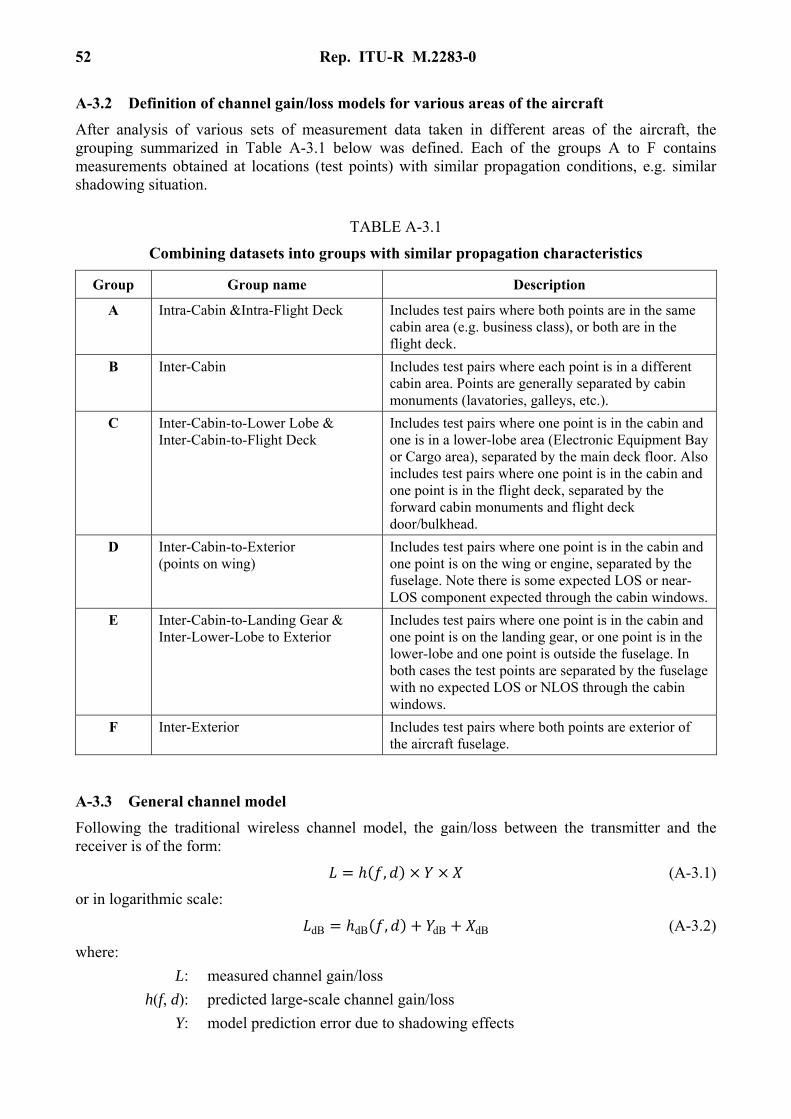
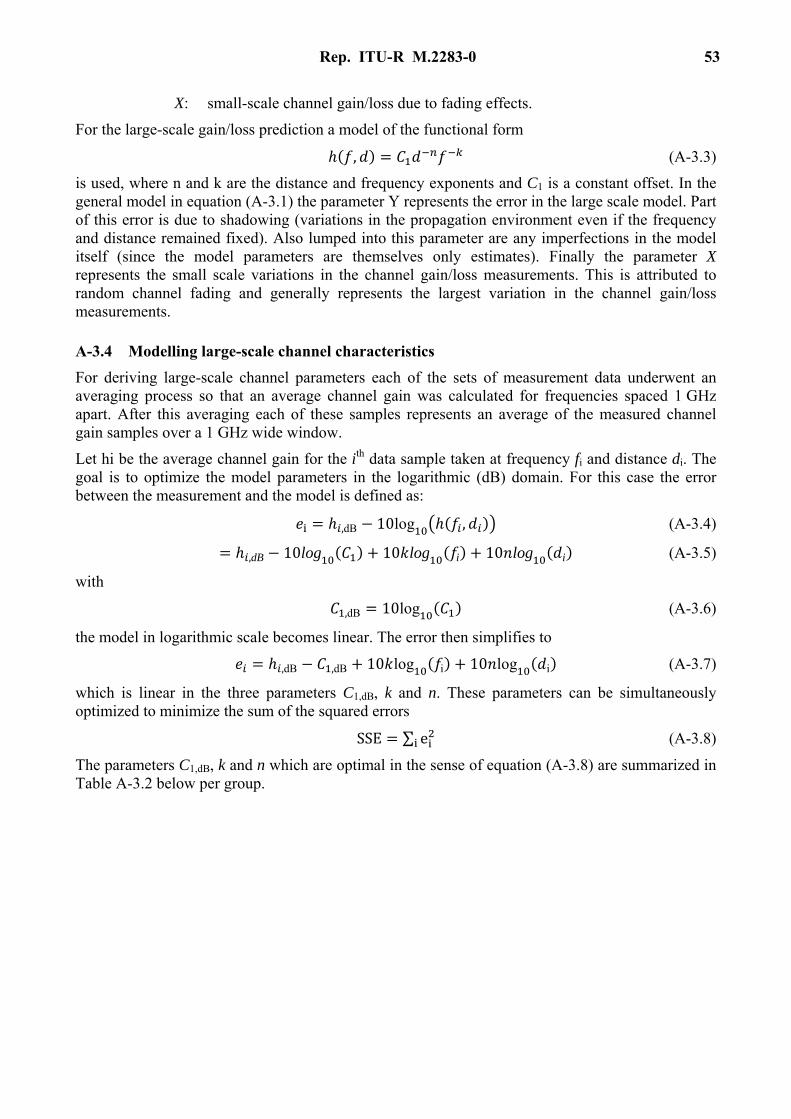
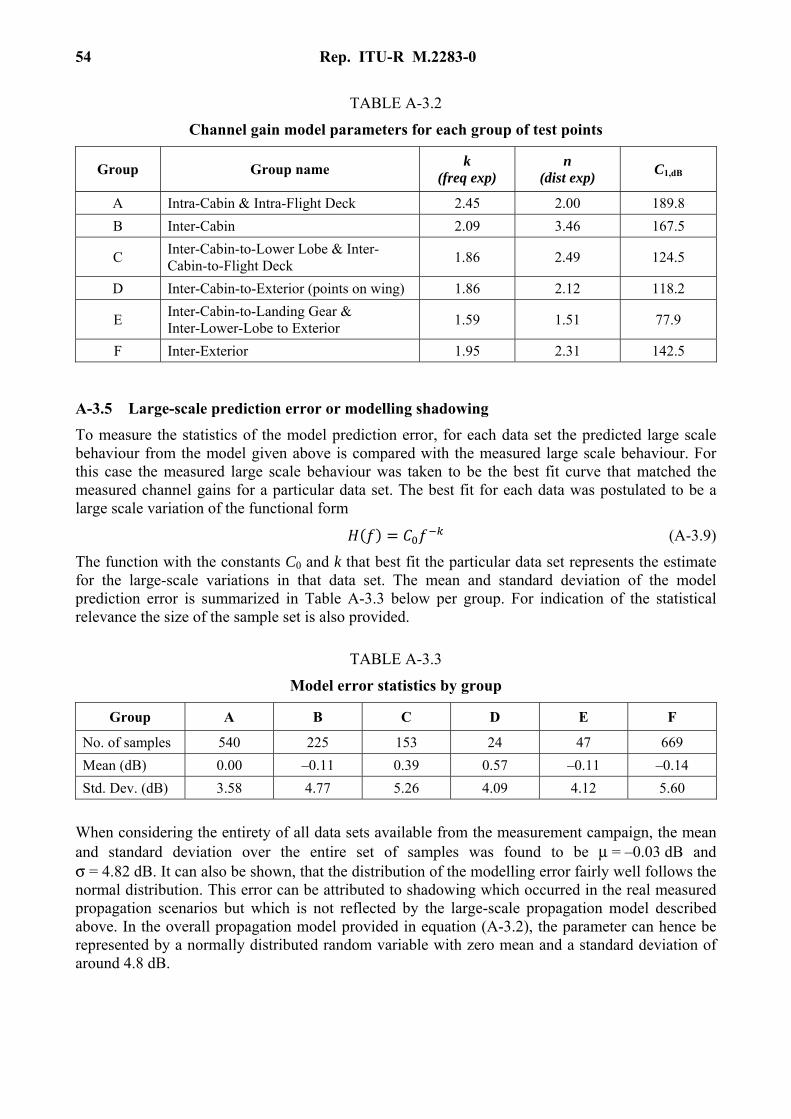
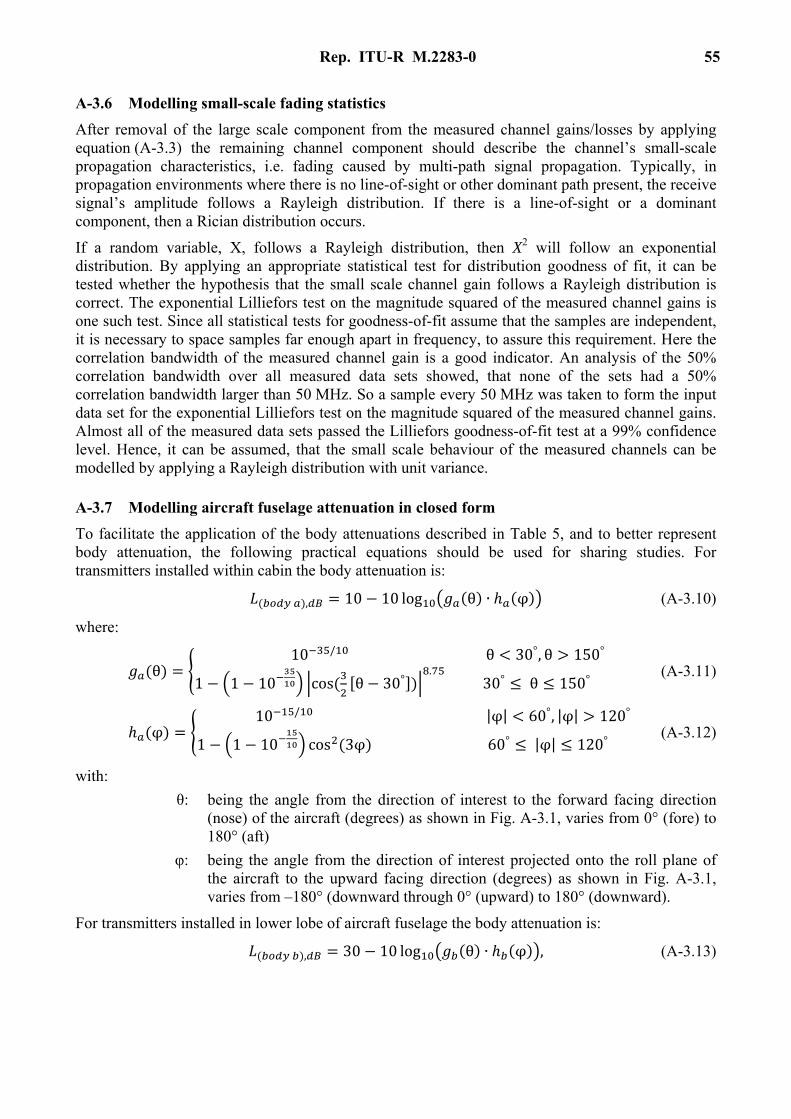
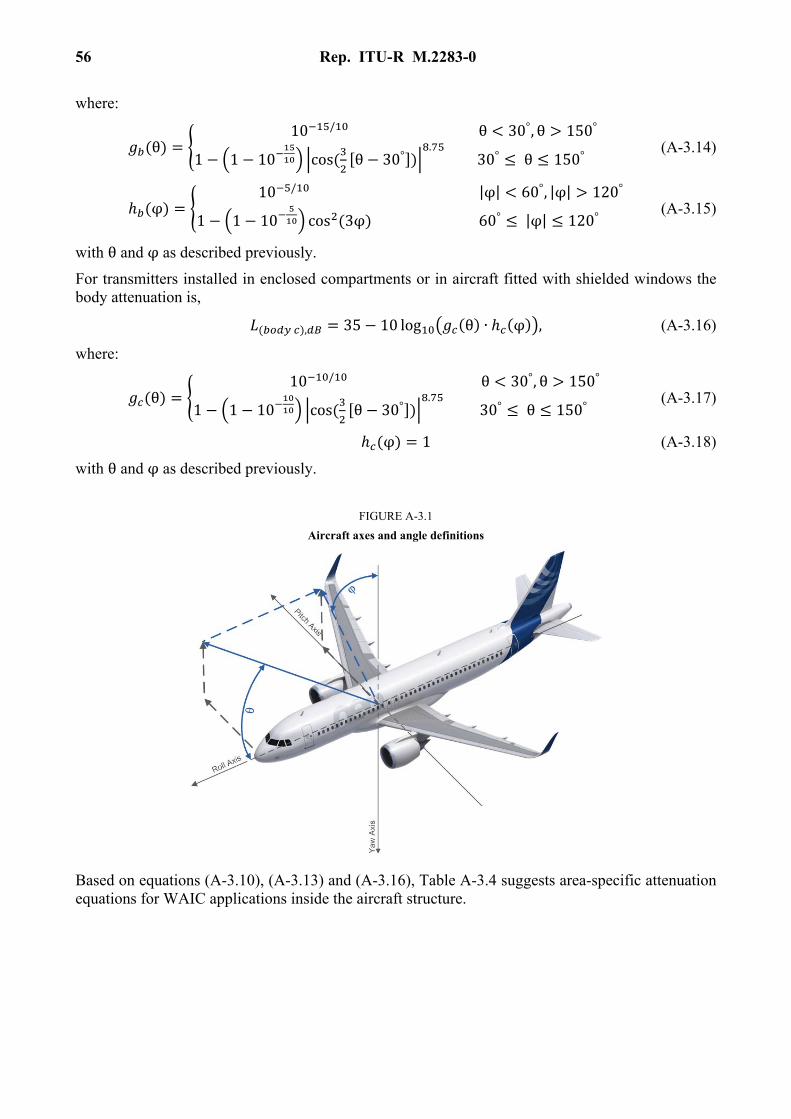
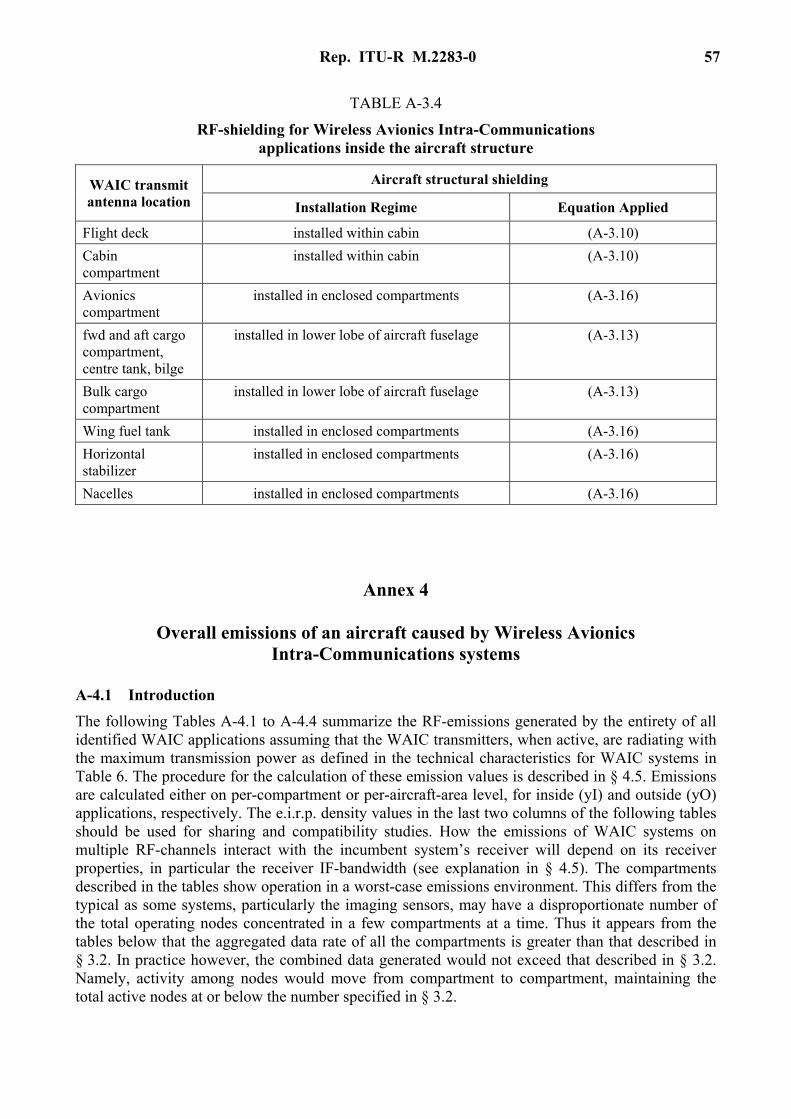
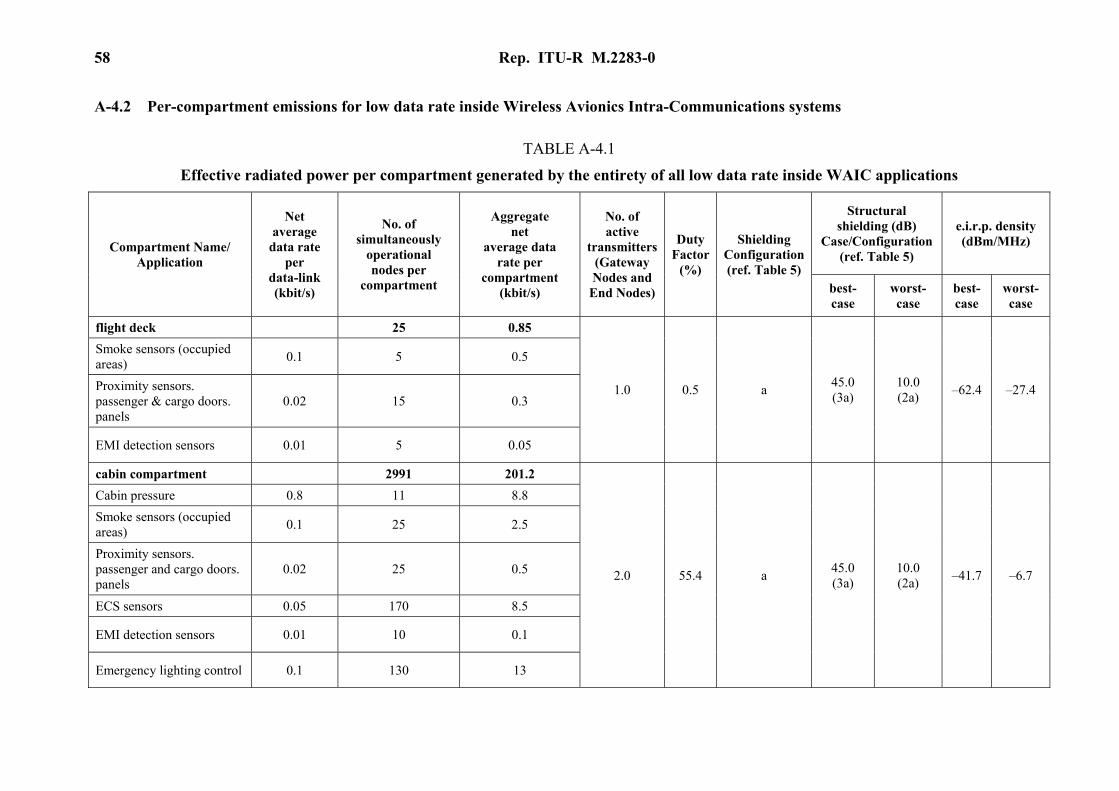
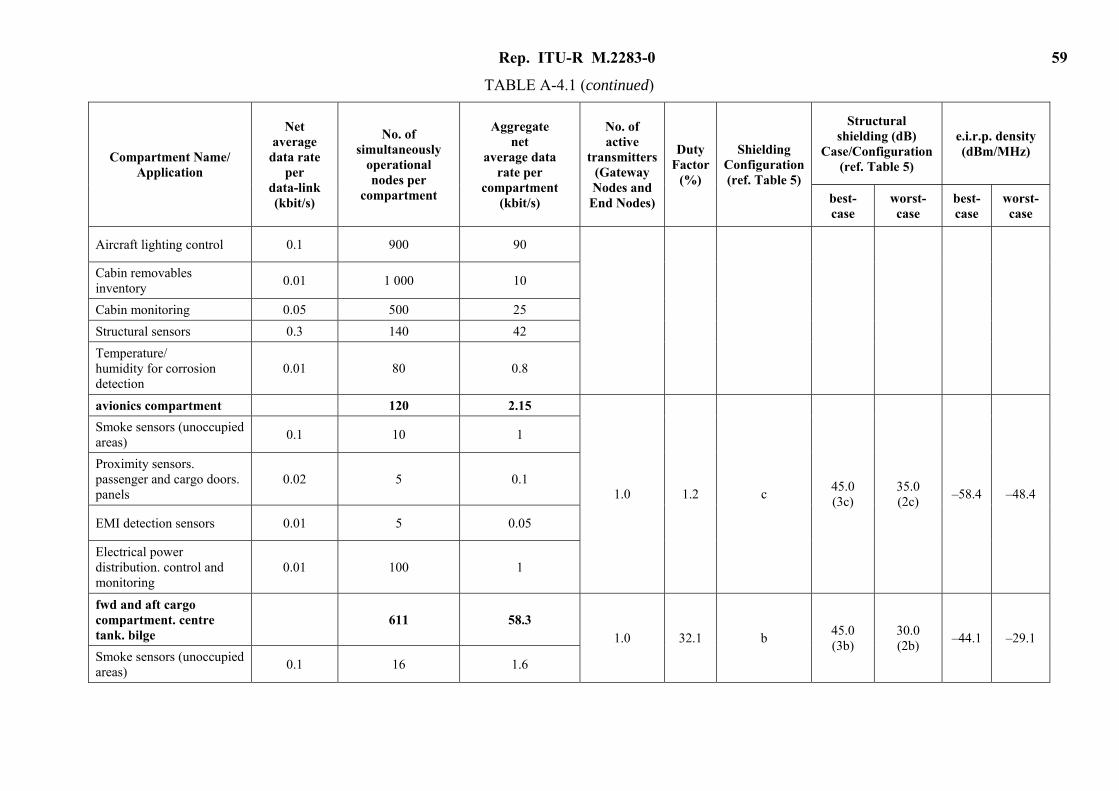
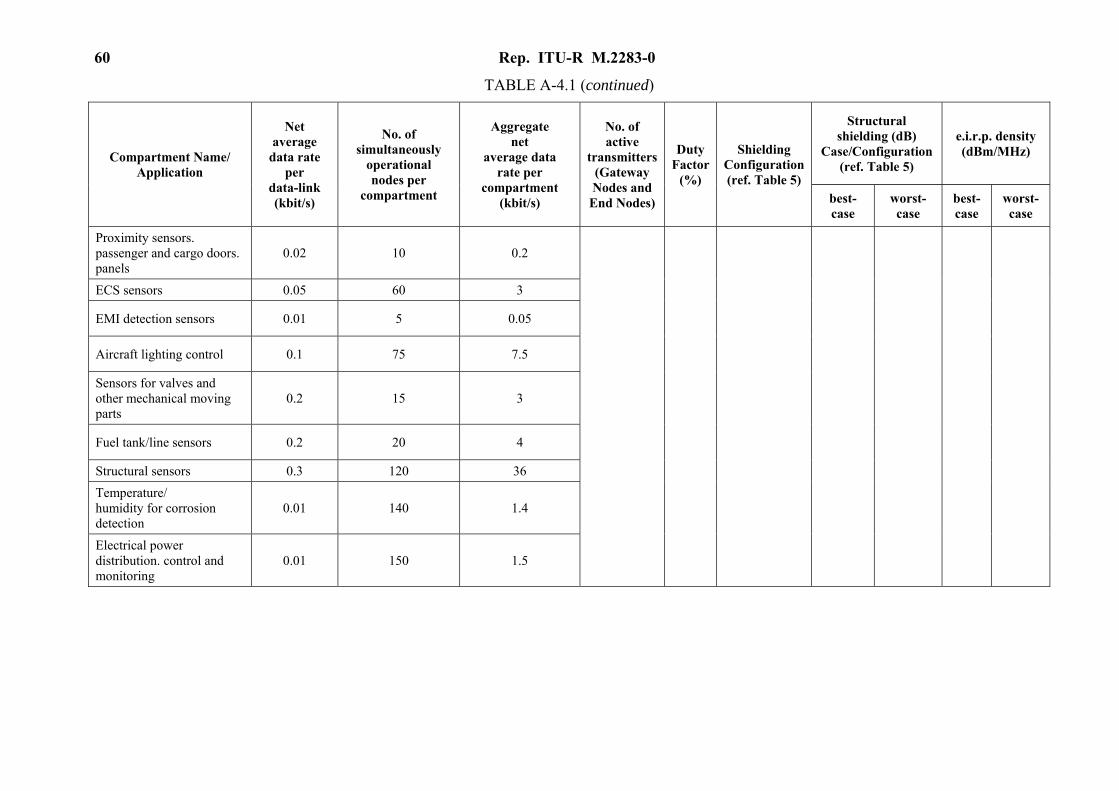
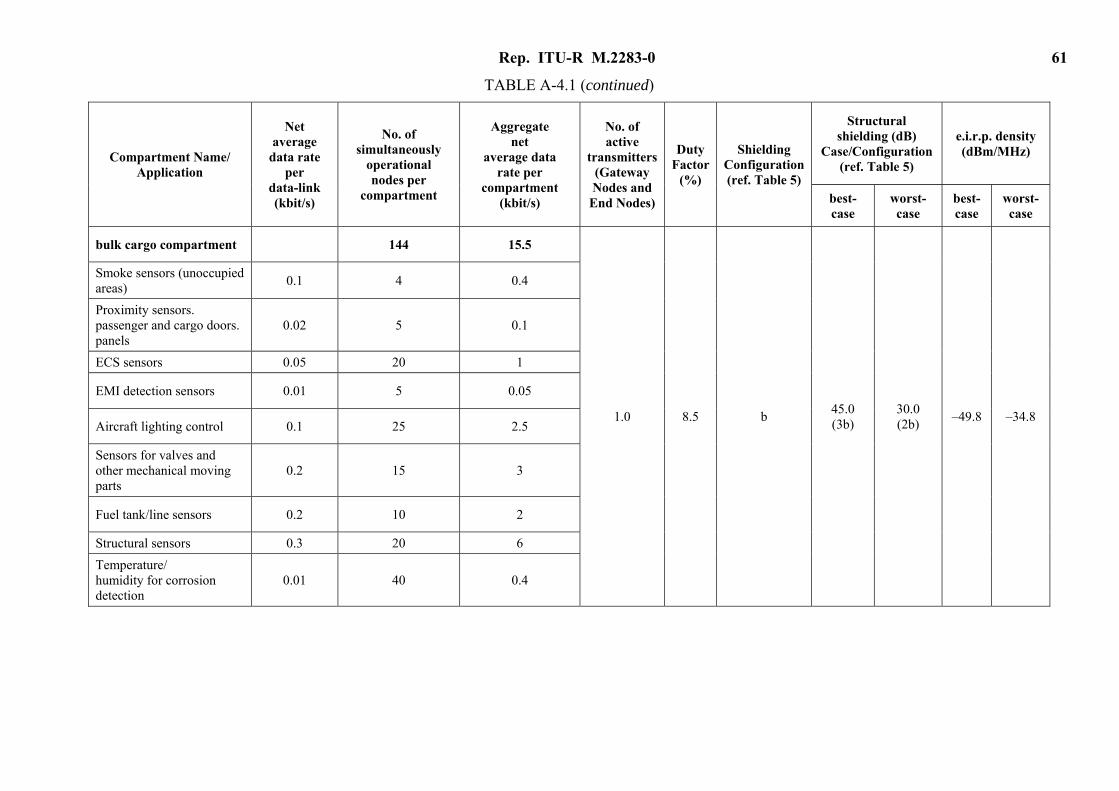
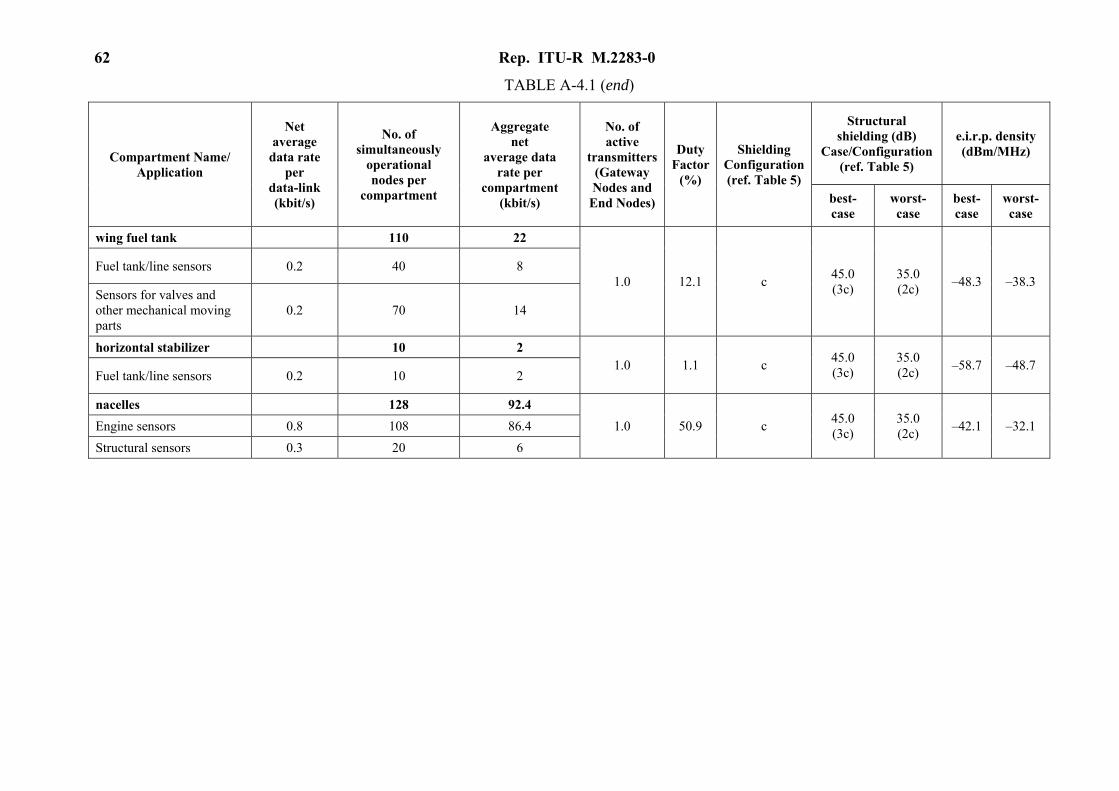
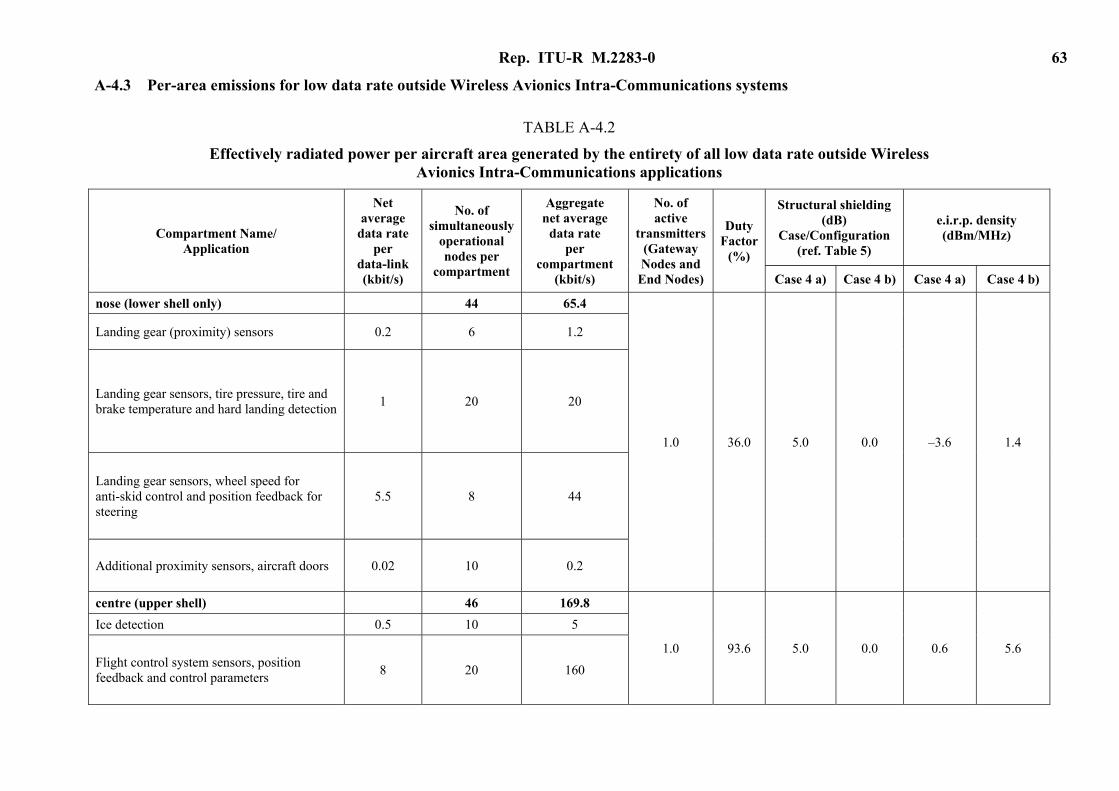
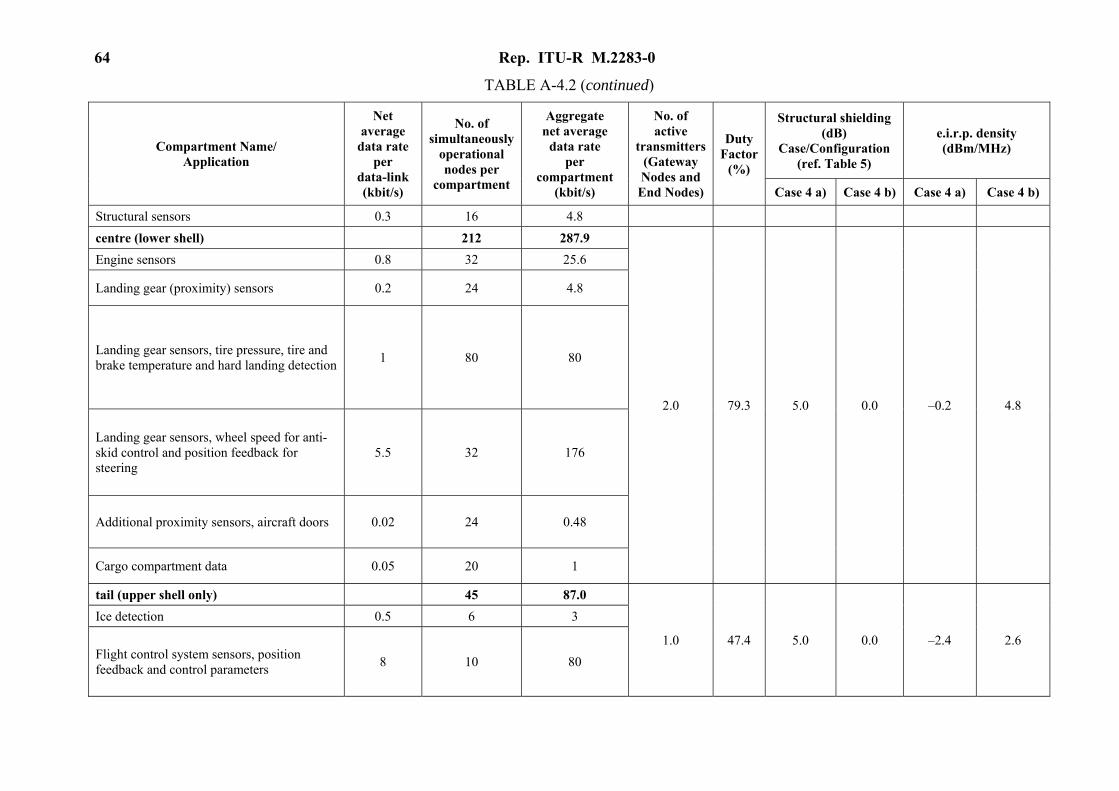
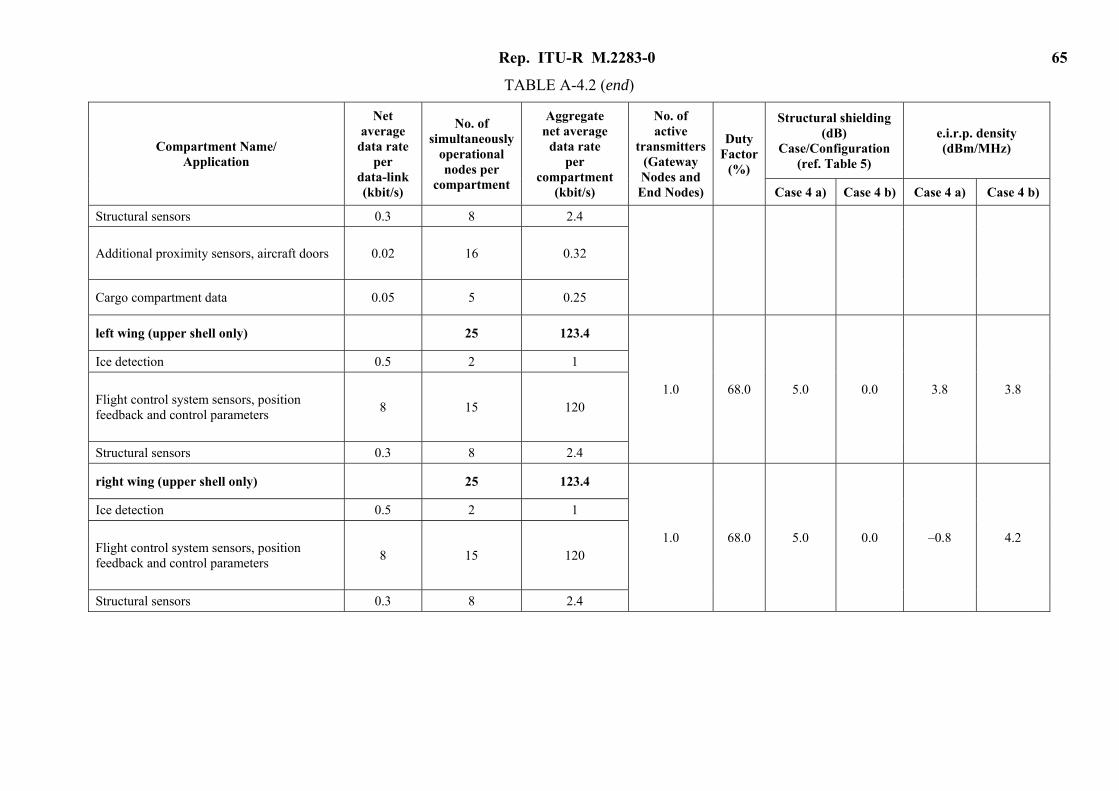
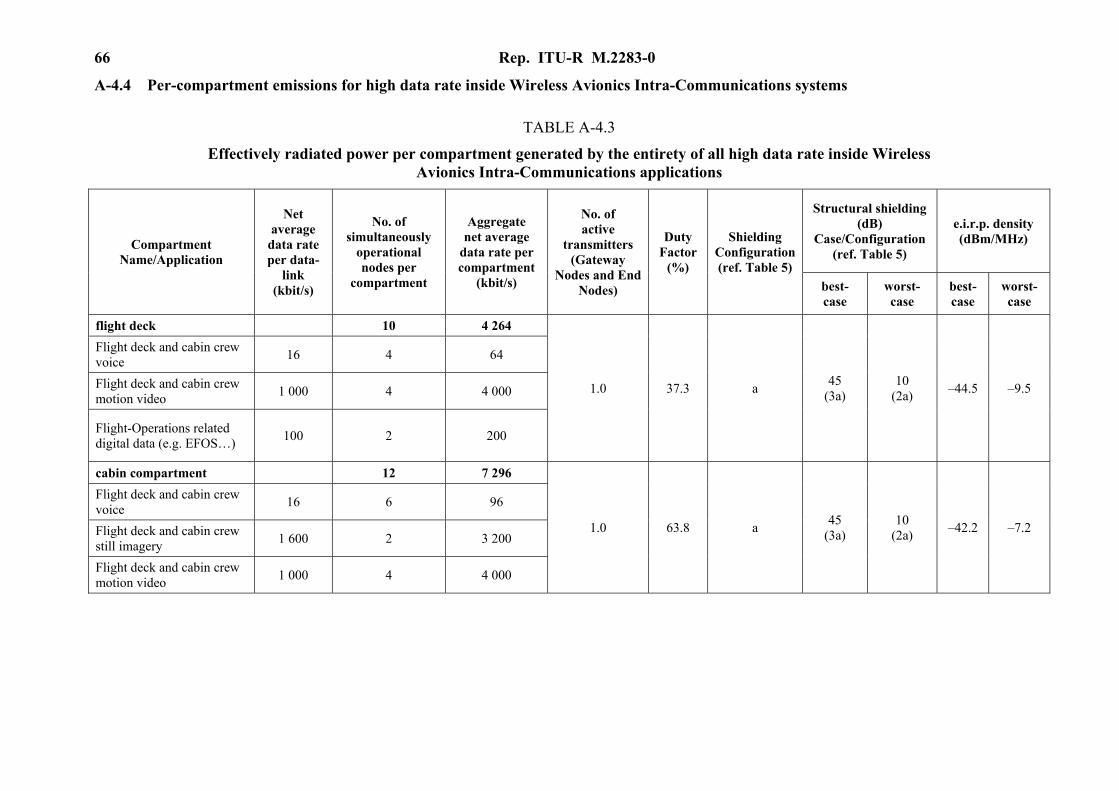
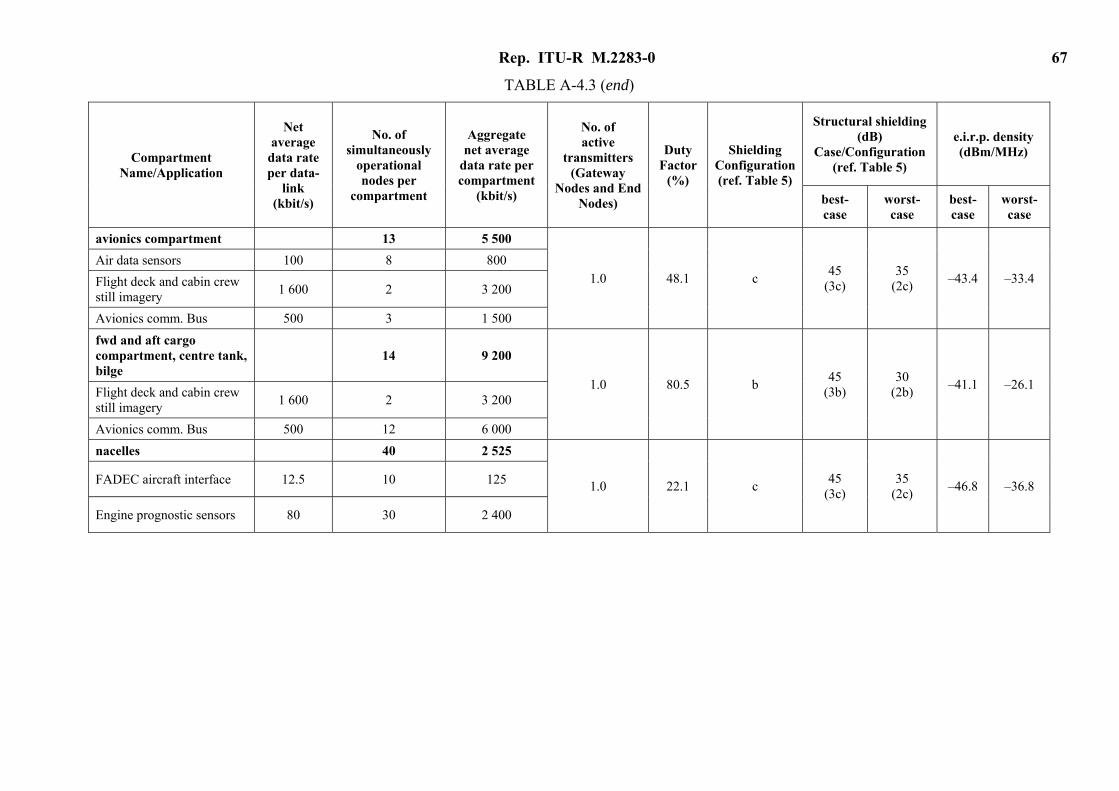
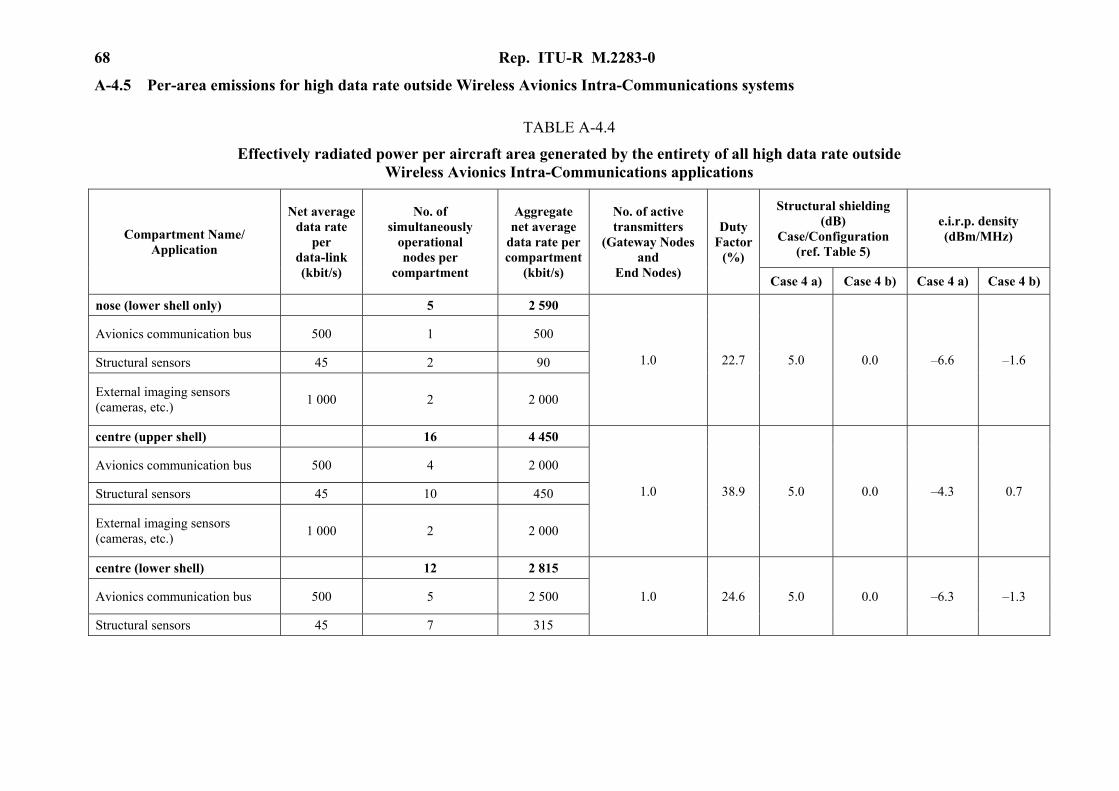
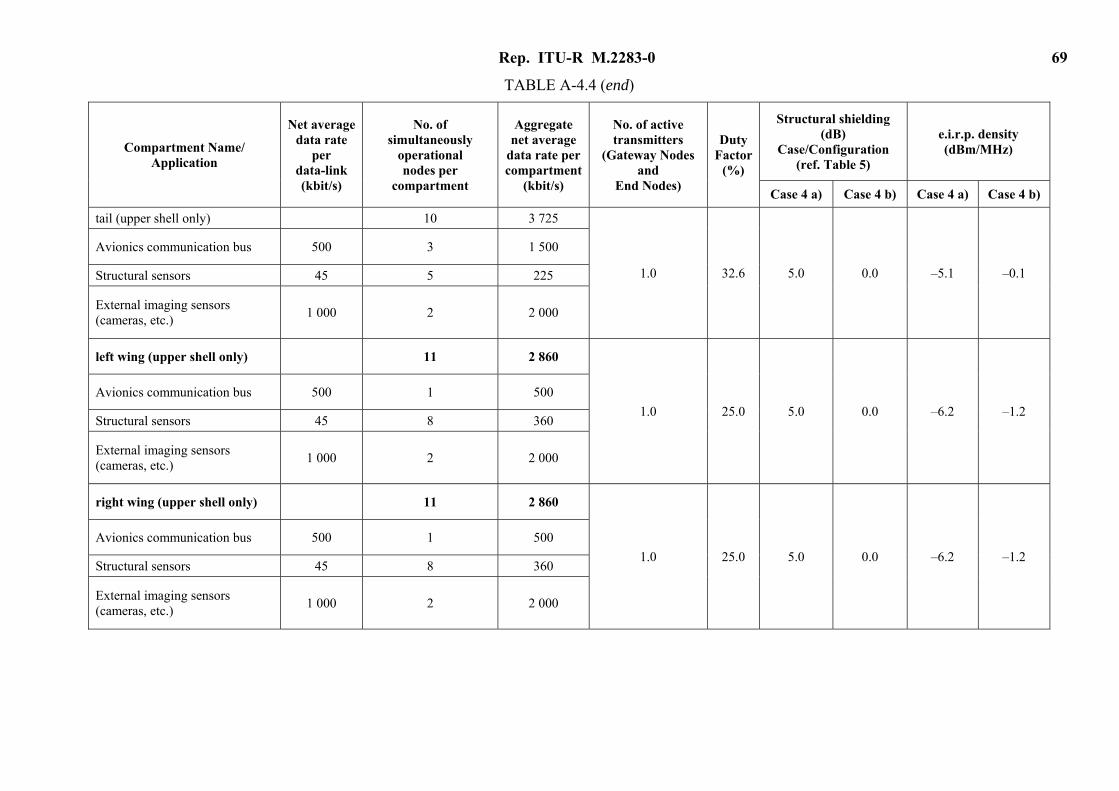


![700MHz Spectrum Requirements for Canadian Public · PDF filePublic Safety Interoperable Mobile Broadband Data Communications ... [Jack Pagotto] ... 700MHz spectrum requirements for](https://static.documents.pub/doc/80x56/5aa8f8227f8b9a7c188c3952/700mhz-spectrum-requirements-for-canadian-public-safety-interoperable-mobile.jpg)


