The Bioenergy and Food Security Project Food and Agriculture Organization of the United Nations 36 ENVIRONMENT CLIMATE CHANGE BIOENERGY MONITORING AND ASSESSMENT ENVIRONMENT AND NATURAL RESOURCES MANAGEMENT WORKING PAPER [ ] Technical Compendium: Description of Agricultural Trade Policies in Peru, Tanzania and Thailand
Transcript
The Bioenergy and Food Security ProjectFood and Agriculture Organization of the United Nations
36
EN
VI
RO
NM
EN
T
CL
IM
AT
E
CH
AN
GE
B
IO
EN
ER
GY
M
ON
IT
OR
IN
G
AN
D
AS
SE
SS
ME
NT
eN
vi
rO
Nm
eN
T A
Nd
NA
TU
rA
l r
eS
OU
rc
eS
mA
NA
ge
me
NT
wO
rk
iN
g P
AP
er
[]
Technical compendium:description of Agricultural Trade Policies in Peru, Tanzania and Thailand
]B
io
en
er
gy
a
nd
F
oo
d
Se
cu
ri
ty
[
IV
The designations employed and the presentation of material in this information product do not imply the expression of any opinion whatsoever on the part of the Food and Agriculture Organization of the United Nations (FAO) concerning the legal or development status of any country, territory, city or area or of its authorities, or concerning the delimitation of its frontiers or boundaries. The mention of specific companies or products of manufacturers, whether or not these have been patented, does not imply that these have been endorsed or recommended by FAO in preference to others of a similar nature that are not mentioned.
E-ISBN: 978-92-5-106655-3
All rights reserved. FAO encourages reproduction and dissemination of material in this information product. Non-commercial uses will be authorized free of charge upon request. Reproduction for resale or other commercial purposes, including educational purposes, may incur fees. Applications for permission to reproduce or disseminate FAO copyright materials and all other queries on rights and licences, should be addressed by e-mail to [email protected] or to the Chief, Publishing Policy and Support Branch, Office of Knowledge Exchange, Research and Extension, FAO, Viale delle Terme di Caracalla, 00153 Rome, Italy.
This document compiles together three technical reviews on Agriculture Trade policies in Peru, Tanzania and Thailand, the three countries that the Bioenergy and Food Security (BEFS) project is currently working in. The technical compendium provides technical details of agriculture trade policies for specific selected crops in the three BEFS countries and can be a useful source when seeking information relating to technical details on agriculture trade policies.
Technical Compendium: Description of Agricultural Trade Policies in Peru, Tanzania and Thailandfor the Bioenergy and Food Security Project
Key words:Agricultural trade policies, Tanzania, Peru, Thailand, HS Codes
Environment and Natural Resources Management Working Paper No. 36, FAO, Rome 2010
This series replaces the following:Environment and Energy SeriesRemote Sensing Centre SeriesAgrometeorology Working Paper
A list of documents published in the above series and other information can be found at the web site: www.fao.org/climatechange/61878
]B
IO
EN
ER
Gy
A
ND
F
OO
D
SE
Cu
RI
Ty
[
vi
AckNOwledgemeNTS
This supporting technical compendium used within the BEFS analytical work was developed within the framework of the Bioenergy and Food Security project (GCP/INT/020/GER) with funding from the German Federal Ministry of Food, Agriculture and Consumer Protection (BMELV).
The BEFS team would like to thank all staff and all supporting staff involved in the preparation of this technical compendium.
vii
This document compiles together three technical documents on the Agriculture Trade policies in Peru, Tanzania and Thailand, the three countries that the Bioenergy and Food Security (BEFS) project is currently working in. The technical documents are to provide technical details of agriculture trade policies in the context of these three countries and can be a useful source when seeking information relating to technical details on agriculture trade policies.
Bioenergy developments are high on many countries’ agendas today in an effort to improve energy access, energy security and in the context of the world’s strive towards lowering global green house gas emissions. With time, though, serious concerns on the environmental and social feasibility and sustainability of bioenergy have arisen, especially when discussing first generation bioenergy as is the case here. In this context, BEFS is working on the food security implications of bioenergy developments.
The primary objective of FAO’s three-year Bioenergy and Food Security (BEFS) project is to mainstream food security concerns into national assessments of bioenergy. During the initial term of the project, BEFS developed an Analytical Framework (AF) for the analysis of the food security and bioenergy nexus. In the current phase, BEFS is implementing the AF in the field, building on real country data and expertise.
The outcome of these activities will provide the basis to support policy-makers in making informed decisions. Project activities are to be accomplished through targeted analysis and field activities and are to support rural development in participating countries.
The BEFS Analytical Framework (AF) provides a basis for an examination of the costs and benefits that arise from bioenergy development. The BEFS framework is comprised of four ‘building blocks’ with a number of subcomponents. Each of these building blocks comprises analytical tools and methods that have been developed by FAO and other organizations. The four main building blocks are the Agriculture Market Outlook, the Natural Resources component, the Technoeconomic and Environment Analysis component and the Socioeconomic analysis component.
In order to support the technical work being carried out within the BEFS analytical components, BEFS commissioned a technical report on Agriculture Trade Policies in
INTRODUCTION
]B
IO
EN
ER
Gy
A
ND
F
OO
D
SE
Cu
RI
Ty
[
viii
each of the three BEFS countries. Based on a specific commodity list, each country report provides a list of trade policies for the relevant commodities. Trade policies considered are to be all encompassing of tariffs, non-tariff barriers (for example licensing requirements, quotas, and minimum access volumes; however, all non-tariff barriers that could apply), other import taxes and surcharges, and any other trade policies that affect the import of agricultural commodities in processed or unprocessed form. If in place in the country, the report also includes information on trade policies for all biofuels, e.g. bioethanol and biodiesel.
Furthermore, since regulations often differ on the import and export side, the documents were required to describe all policies on both sides, including variations based on the trading partner if applicable. Reasons for this type of variation may be due, for example, to the country’s participation in regional or bilateral free trade areas.
Whenever possible, the trade policies are described with reference to the Harmonized System (HS) classification, or whatever classification is in use in the country.
If possible the reports will make reference to any studies that have been undertaken specifically on agriculture trade and its effects on poverty and food security within the country.
The report for Peru Survey of Agricultural Trade Policies – Peru was carried out by Jorge Chinen Higa. The list of crops covered included rice, oatmeal, sugar, barley, beans, corn, sunflower, palm oil, soybean, wheat and cotton.
In the case of Tanzania the report Survey of Trade Policies on Selected Commodities in Tanzania was carried out by the Economic and Social Research Foundation (ESRF) and covers maize, sorghum, cassava, beans, sweet potatoes, rice, cotton, coconuts, plantains, millet, groundnuts, coffee, wheat, sugar and oil palm.
The report Survey of Agricultural Trade Policies – Thailand was carried out by Dr. Ruangrai Tokrisna, Department of Agricultural and Resource Economics, Faculty of Economics, Kasetsart University, Bangkok, Thailand. The list of crops covered included rice, sugar, maize, cassava, coconut, oil palm, beans, wheat and soybean.
1111111;
% Ilk 1
111041%
SAP
411011101+
100A
kkkA4
SWA
S4111%44%
§kketa:1s§§*
lbAO*0SO
in k4a
414%
NN
\D
IP §%A
we %
0-4 §%Il k%al 4A
04.1
40e
MO
.44440
fri1%
lil"K
OS
s°O
krb,
$101$14?
1110110#1110110)(
411111111.
v IX
1 Survey 1: AgricolturAl trAde policieS - peru
2 ACRONYMS AND ABBREVIATIONS
3 1. LIST OF TRADE POLICIES ON SELECTED COMMODITIES 3 1.1 RICE
4 1.2 OATMEAL
4 1.3 SUGAR
5 1.4 BARLEY
6 1.5 BEANS
6 1.6 CORN (MAIZE)
7 1.7 SUNFLOWER
8 1.8 PALM OIL
9 1.9 SOYBEAN
10 1.10 WHEAT
11 1.11 COTTON
12 ANNEX 1 12 Table 1. Peru: national tariffs and preferential rates 14 Table 2. Peru: non-tariff measures for selected agricultural products 16 Table 3. Peru: world imports for selected agricultural products
19 ANNEX 2 LIST OF STUDIES ON EFFECTS OF AGRICULTURAL TRADE POLICIES ON POVERTY AND FOOD SECURITY IN THE CONTEXT OF PERU
21 SURvEY 2: AGRICOlTURAl TRADE pOlICIES - TANZANIA
23 1. iNTrOdUcTiON
23 1.1 BAckgrOUNd TO THe STUdY
23 1.2 THe STUdY cONTeXT
24 1.3 OBjecTiveS ANd meTHOdOlOgY
25 2. POlicY FrAmewOrk iN TANZANiA
25 2.1 AgricUlTUrAl POlicY
25 2.2 AgricUlTUrAl mArkeTiNg POlicY
26 2.3 TrAde POlicY
27 3. mArkeTiNg ANd TrAde POlicY OF AgricUlTUrAl crOPS
27 3.1 milleT ANd SOrgHUm
27 3.2 wHeAT
28 3.3 mAiZe
29 3.4 cOFFee
30 3.5 cASHew - NUTS
31 3.6 SUgAr
32 3.7 SeSAme
33 3.8 cASSAvA
34 3.9 cOTTON
35 3.10 rice
36 3.11 NON-TAriFF BArrierS FOr OTHer cOmmOdiTieS
1111111;
% Ilk 1
111041%
SAP
411011101+
100A
kkkA4
SWA
S4111%44%
§kketa:1s§§*
lbAO*0SO
in k4a
414%
NN
\D
IP §%A
we %
0-4 §%Il k%al 4A
04.1
40e
MO
.44440
fri1%
lil"K
OS
s°O
krb,
$101$14?
1110110#1110110)(
411111111.
v XI
38 ANNEX 1 38 Table 1. Harmonized System Code for Wheat in Tanzania 38 Table 2. Harmonized System Code for Maize in Tanzania 39 Table 3. Harmonized System Code for Coffee in Tanzania 40 Table 4. Harmonized System Code for Sugar in Tanzania 40 Table 5. Cassava exports 1979-2003 in 1000 tonnes 40 Table 6. Composition of Taxes on Cotton, 1997/98 and 1998/99 41 Table 7. Harmonized system code for Rice in Tanzania
Agricultural Trade PoliciesPeruAuthor: jorge chinen Higa, lima, Peru
1
2
]B
IO
EN
ER
Gy
A
ND
F
OO
D
SE
Cu
RI
Ty
[]
BI
OE
NE
RG
y
AN
D
FO
OD
S
EC
uR
IT
y[
AcrONYmS ANd ABBreviATiONS
ARP Pest Risk Analysis of the Andean Community
CAN Andean Community of Nations (former Andean Pact)comprised by Bolivia, Colombia, Ecuador, Peru, and Venezuela
HS Harmonized System
MERCOSUR Southern Cone Common Market comprised by Argentina, Brazil, Paraguay, and Uruguay
MT Metric Tons
TPA Free Trade Area between Peru and the United States. It is formally called the United States-Peru Trade Promotion Agreement between Peru and the United States. It was signed on April 12, 2006 in Washington, D.C. On June 25, 2007, a Protocol of Amendment revising the Agreement to reflect the bipartisan consensus on trade was signed on May 10, 2007. This trade agreement will eliminate tariffs and other barriers to goods and services.
SOSA Sanitary Agricultural Official Service
WTO World Trade Organization
0
3
1.1 RICE Tariff rates
Rice (HS 1006) can be grouped into to 5 main categories: rice in husk or paddy (HS 1006.10.10), other rice in husk or paddy (HS 1006.10.90), husked or brown rice (HS 100620), semi-milled or wholly milled rice (HS1006.30), and broken rice (HS1006.40). A 9% ad valorem (CIF) duty is imposed on rice imports under sub-items 1006.10.90 and 1006.40.00. The remaining rice sub-items 1006.10.10, 1006.20.00, and 1006.30.00 are tariff exempted.
For World Trade Organization (WTO) members, an ad valorem duty of 30% is applied for the rice in husk or paddy (1006.10.10), and a 68% rate for the rest of sub-items.
A 0% rate is applied for Andean Community country members.
There is no preferential tariff treatment for countries of the Southern Cone Common Market (MERCOSUR), except for the single 100 percent preferential rate applied to the rice (Oriza Sativa variety) in husk or paddy (HS 1006.10.10).
Four of the five sub-items belong to the Peruvian price band system, except for the rice in husk or paddy sub item (1006.10.10). This system increases the import price when it is below the band’s floor price and decreases the import price when it is higher than band’s ceiling price.
Under the Free Trade Area with the United States, formally called Trade Promotion Agreement (TPA), only sub item 1006.10.10 will become duty-free immediately; with remaining four tariffs to be started at a base rate of 52 percent and phased out over 17 years, effective January 1 of the fifth year. Aggregate quantity of rice entered under this TPA shall not exceed 55,500 metric tons during the first year, 78,440 the second year, and subsequent years growing at a 6 percent annual rate.
Non-tariff measures Peru eliminated all non-tariff restrictions on imports (prohibitions, licensing, and State
monopolies) at the beginning of the 90s and did not “tariff” these measures under the WTO.
c H A P T e r 1 lIST OF TRADE pOlICIES ON SElECTED COMMODITIES
4
]B
IO
EN
ER
Gy
A
ND
F
OO
D
SE
Cu
RI
Ty
[
Under the Andean Community (CAN) framework, sanitary and phytosanitary measures for third parties (countries) are regulated by CAN’s Resolution 1010 (Annex 1), that administers phytosanitary permits, certificates from the country of origin, inspection, and treatment if necessary, depending upon the product and risk category. Under the TPA with the United States, aggregate quantity of rice entered shall not exceed 55,500 metric tons during the first year, 78,440 the second year, and subsequent years growing at a 6 percent annual rate. An agricultural safeguard measure may be applied during the transition period when annual imports exceed thirty percent of the established annual in-quota. An agricultural safeguard measure may be applied during the transition period when imports volume exceeds the thirty percent of the established annual in-quota.
1.2 OATmeAl
Tariff ratesOatmeal imports, except for cropping (HS 1004.00.90), are levied with an ad valorem
tariff of 17 percent, and with thirty percent under the WTO tariff consolidation. No tariffs are imposed to these imports for CAN intra-trade.
Under MERCOSUR, Argentina and Brazil both have a preferential tariff discount of 70 percent, while Paraguay and Uruguay 100 percent.
Under the TPA with the United States, oatmeal tariffs will phase out over 5 years, starting at a base rate of 25 percent.
Non-tariff measurePeru dismantled all non-tariff restrictions on imports (prohibitions, licensing, and
State monopolies) at the beginning of the 90s and did not “tariff” these measures under the WTO.
For CAN intra-trade, oatmeal imports are regulated by CAN’s Resolution 1008 (Annex 2), which has classified this product in the category of risk 3, which requires phytosanitary permit or document to enter the country.
1.3 SUgAr
Tariff rates This commodity includes the following sub items: Brown or clayed sugar (HS
1701.11.10); Cane sugar, raw, w/o flavoring or coloring, not brown or clayed sugar (HS 1701.11.90); Beet sugar, raw, w/o flavoring or coloring, solid (HS 1701.12.00); Cane or beet sugar, refined, sucrose chemically pure, solid, flavored or colored (HS 1701.91.00); Cane or beet sugar, refined, sucrose chemically pure, solid, not flavored or colored(HS 1701.99.00); Molasses of sugar cane (HS 1703.10.00); and Molasses from extraction or refining of sugar, except sugar cane (HS 1703.90.00).
Sub item 1701.11.10 is currently levied with a 0 percent ad valorem national tariff; sub items 1701.11.90 and 1701.12.00 both have both a 9 percent ad valorem duty, 0 percent preferential rate for MERCOSUR members and 100 percent preferential rate for
5
LIST OF TRADE POLICIES ON SELECTED COMMODITIES
CAN members, and they both belong to the Peruvian price band; sub item 1701.91.00 has 9 percent ad valorem tariff, 10 percent preferential rate to Uruguay, but 0 percent preferential rate to remaining MERCOSUR country members such as Argentina, Brazil, and Paraguay; sub item 1701.99.00 as part of the Peruvian Integrated Tariff in turn is split into sub item 1701.99.10.00 “Pure Sucrose” with 9 percent ad valorem duty and into sub item 1701.99.90.00 “Other cane or beet sugar, refined, solid” with a 0 percent ad valorem tariff and within the Peruvian price band system.
Sub items 1703.10.00 and 1703.90.00 both have a 9 percent ad valorem duty, and with preferential rates of 100 percent for CAN members, 10 percent for Uruguay, and 0 for Argentina, Brazil and Paraguay, respectively.
Sub items 1701.11.90 and 1701.99.00 are the ones with the highest commercial flows.
Consolidated tariffs under WTO have two levels: 30 percent for sub items 1701.11.10, 1701.91.00, 1703.10.00, and 1703.90.00, and 68 percent for sub items 1701.11.90, 1701.12.00, and 1701.99.00.
Under TPA with the USA, tariffs elimination will start immediately or in 5 to 10 years, while sub items under the price band system will begin at a higher tariff than the average. For instance sub items 17011190 and 17019900 will start at a base rate of 58 percent, while sub item 17019100 will do it at a 12 percent. Non-tariff measures
Peru eliminated all non-tariff restrictions on imports (prohibitions, licensing, and State monopolies) at the beginning of the 90s and did not “tariff” these measures under the WTO.
For CAN intra-trade, oatmeal imports are regulated by CAN’s Resolution 1008 (Annex 2), which has classified this product in the category of risk 1, which requires phytosanitary inspection to enter the country. Even though an import permit or document is required to enter the country, it must fulfill CAN’s specific phytosanitary requirements.
1.4 BArleY
Tariff rates Barley for malting purposes (HS 1003.00.90), Malt not roasted (HS 1107.10.00), and
Malt roasted (HS 1107.20.00) all have a national ad valorem tariff of 9 percent, 30 percent for WTO members, and 0 percent for CAN members.
Preferential rates for MERCOSUR members are varied. Barley (HS 1003.00.90) is levied with a preferential rate of 40 percent for Argentina and Brazil markets, 52 percent for Paraguay, and 10 percent for Uruguay. Also, Argentina is favored with a 64 percent preferential rate for the Barley grain malted and 40 percent for Barley grain not malted,
6
]B
IO
EN
ER
Gy
A
ND
F
OO
D
SE
Cu
RI
Ty
[
Brazil with 70 percent for barley malt and 40 percent for Non-Barley Malt, Paraguay with 52 percent and Uruguay with 57 percent for Malt roasted and not roasted, respectively.
Under the TPA with the United States, tariffs will be eliminated once this agreement becomes effective.
Non-tariff measures Peru dismantled all non-tariff restrictions on imports (prohibitions, licensing, and
State monopolies) at the beginning of the 90s and did not “tariff” these measures under the WTO.
For CAN intra-trade, barley imports (HS 1003.00.90) require a phytosanitary permit or document, a phytosanitary certificate of origin, and phytosanitary inspection, according to CAN’s Resolution 451 (Annex 3), while Malt not roasted (HA 1107.10.00 and HS1107.20.00) has been classified as risk 1 category by CAN’s Resolution 1008, which requires phytosanitary inspection to enter the country.
1.5 BeANS
Tariff rates Among the main beans imports are two sub items: Dried, shelled peas “Pisum sativum”,
whether or not skinned or split, not for sowing (HS 0713.10.90); and Dried, shelled lentils, whether or not skinned or split, not for sowing (HS 0713.40.90). Both are levied with a nominal tariff of 9 percent. Consolidated tariff for both imports from WTO members is 30 percent. These sub items are tariff exempted for imports from the Andean Community members. Imports from MERCOSUR countries such as Argentina are favored with 58 percent preference for both products, Brazil with 40 percent and 58 percent, respectively, and Paraguay and Uruguay with 57 percent and 85 percent for both subheadings.
Under the TPA with the United States, these sub items will be duty-free immediately upon entry into force of the agreement.
Non-tariff measures For imports from Andean Community member countries and from third countries
into this common market, these products require a phytosanitary permit or document, a phytosanitary certificate of origin, and a sanitary inspection to entry the country, in compliance with Andean Community Decisions 1008 and 451, respectively.
1.6 cOrN (mAiZe)
Tariff rates Corn (maize) group (HS 1005) includes the following subheadings: Seed corn (maize)
(HS 1005.10.00); Other durum corn, yellow, not for sowing (HS 1005.90.11); Other durum corn, white, not for sowing (HS 1005.90.12); Yellow dent corn (HS 1005.90.20); and Other than seed and yellow dent corn (HS 1005.90.90).
7
LIST OF TRADE POLICIES ON SELECTED COMMODITIES
Subheading seed corn (maize) (HS 105.10.00) has 0 percent ad valorem tariff, while the remaining corn subheadings 9 percent.
For WTO member countries, a consolidated 30 percent tariff is levied to subheadings 1005.10.00, 1005.20.00, and 1005.90.20, and 68% to subheadings 1005.90.11 and 1005.90.90.
All corn subheadings have a 0 percent tariff for CAN member countries. For MERCOSUR country members: sub item corn for sowing has a 100 percent preference; subheading 1005.90.11 has a 0 percent preference for Argentina and Brazil; Paraguay is favored with a 93.3 percent preference for a quota of 60000 MT from January 1, 2008 to September 9, 2008; subheadings 1005.90.12, 1005.90.20 and 105.90.90 have no preference granted to MERCOSUR.
Subheadings 1005.90.11, 105.90.12, and 10.05.90.90 belong to the Peruvian price band system.
Under the TPA with the United States, sub item durum yellow corn is duty-free on an import quota of 500 thousand MT per year, which will increase 6 percent annually phasing out in 12 years, and starting at a tariff base of 25 percent, higher than the applied current tariff. Tariffs on the remaining corn items (white and others) will phase out in 10 years starting at the same tariff base of 25 percent. Non-tariff measures
Peru eliminated all non-tariff restrictions on imports (prohibitions, licensing, and State monopolies) at the beginning of the 90s and did not “tariff” these measures under the WTO.
Phytosanitary measures for these maize subheadings are governed by the Andean Community’s Resolution 451, which usually requires phytosanitary import permits or documents, export phytosanitary certificates, phytosanitary inspection as well as certain specific requirements and phytosanitary treatment if necessary.
1.7 SUNFlOwer
Tariff rates Within the sunflower group, the following subheadings are included: Sunflower seeds,
whether or not broken (HS 1206.00.10); Other sunflower seeds, whether or not broken (HS 1206.00.90); Sunflower-seed or safflower oil, crude (HS 1512.11.00); Sunflower seed or safflower oil, other than crude, and their fractions, whether or not refined, but not chemically modified (HS 1512.19.00); and Oilcake and other solid residues, resulting from the extraction of vegetable fats or oils, of sunflower seeds (HS 2306.30.00).
Subheadings 1206.00.10, 1512.11.00, and 2306.30.00 are levied with 0 percent tariff, while remaining subheadings 1206.00.90 and 1512.19.00 with 9 percent.
8
]B
IO
EN
ER
Gy
A
ND
F
OO
D
SE
Cu
RI
Ty
[
A 30 percent consolidated tariff is imposed for imports from WTO members. Marketing within CAN country members is duty-free.
MERCOSUR country members are all favored with a 100 percent preference on the seeds for sowing (HS 1206.00.10). On the sunflower seeds except for sowing (HS 1206.00.90), Argentina has a 46 percent preference, Brazil 40 percent, Paraguay 52 percent, and Uruguay 100 percent. On the crude oil (HS 1512.11.10) preferences before recent tariff reduction were as follows: 58 percent for Argentina and Brazil, 90 percent for Paraguay, and 100 percent for Uruguay; however, given the national tariff reduction to 0 percent, this would mean a 100 percent preference rate for this sub item. On the refined oil (HS 1512.19.10) only Uruguay has a preference of 10 percent. On the oilcakes (HS 2306.30.00) preference rate for Argentina and Brazil is 46 percent, Paraguay 52 percent, and Uruguay 100 percent, but as national tariff has been reduced to 0 percent, preference rate is 100 percent now.
In the TPA negotiations with the United States, sunflower seeds (whether or not for sowing) and the crude oil will both immediately be duty-free, while refined oil will start at a tariff base of 12 percent and phase out in 10 years, and sunflower oilcake will do it in 5 years.
Non-tariff measures Peru eliminated all non-tariff restrictions on imports (prohibitions, licensing, and State
monopolies) at the beginning of the 90s and did not “tariff” these measures under the WTO.
For CAN intra-trade and third countries, sunflower seeds for sowing have classified in the category of risk 4, seeds except for sowing in the category of risk 3, sunflower crude and refined oil in the category of risk 0, and sunflower oilcake in the category of risk 0, according to CAN’s Resolution 1008.
All sunflower seeds require a phytosanitary import permit or document, a phytosanitary inspection to enter the country, and a phytosanitary export certificate. Sunflower oil does not require a phytosanitary import permit or document, or an inspection to enter the country, while sunflower oilcake has to go through an inspection to enter the country regardless of whether they are exempted from the compliance of the phytosanitary requirements established in the Andean Community or in national legislations.
1.8 PAlm Oil
Tariff rates Within the palm oil group, the following two subheadings are included: Palm oil, crude
(HS 1511.10.00); and Palm oil and its fractions, refined, but not chemically modified (HS 1511.90.00)
Crude palm oil is levied with a 9 percent tariff, while the refined oil with 0 percent. A 30 percent consolidated tariff of 30 percent is imposed on imports from WTO members.
9
LIST OF TRADE POLICIES ON SELECTED COMMODITIES
For CAN intra-trade, imports are levied with 0 percent tariff. For MERCOSUR member countries, in the case of crude oil, Argentina and Brazil were favored with 20 percent preference, Uruguay with 10 percent, and Paraguay with 0 percent. In the refined oil, Argentina received a 20 percent preference, Brazil 15% in the palm butter and 0 percent in non-palm butter, Paraguay 0 percent, and Uruguay 10 percent. Given that national tariff has been reduced to 0 percent for refined palm oil (HS 15119000), preference for MERCOSUR member countries would increase to 100 percent.
Under the TPA with the United States, both products will start at a tariff base of 12 percent and phase out in 12 years.
Non-tariff measures Peru eliminated all non-tariff restrictions on imports (prohibitions, licensing, and State
monopolies) at the beginning of the 90s and did not “tariff” these measures under the WTO. For CAN’s intra-trade and with third countries, crude and refined palm oil have been
classified in the category of risk 0 according to CAN’s Resolution 1008, which means that crude oil does not require a phytosanitary import permit or document nor a phytosanitary inspection to enter the country, whether or not they are exempted from the compliance of phytosanitary requirements established at the Andean Region or national levels, respectively.
1.9 SOYBeAN
Tariff rates In the soybean group, the following subheadings are included: Soybeans, whether or
not broken (HS 1201.00.90); Flour and meals of soybeans (HS 1208.10 .00); Crude soybean oil, whether or not degummed (HS 1507.10.00); Soybean oil and its fractions, refined, not chemically modified (HS 1507.90.00); Oilcake and other solid residues, resulting from the extraction of soybean oil (HS 2304.00.00) and Mixed feed or mixed feed ingredients used in animal feeding (HS 2309.90.20).
Of all these products, subheading Flour and meals of soybeans (HS 1208.10.00) is levied with a 9 percent ad valorem tariff, the remaining subheadings are with 0 percent. For WTO members, all subheadings are levied with 30 percent consolidated tariff.
Intra-trade is duty-free for CAN member countries. Due to recent tariff reductions to cero percent given by the Peruvian government, MERCOSUR member countries face a similar tariff exemption, except for subheading 1208.10.00 which grants 40 percent preference to Argentina and Brazil, 52 percent to Paraguay and 100 percent to Uruguay.
As a result of negotiations with the United States under TPA, all subheadings will immediately have cero tariff once this agreement becomes effective. On the other hand, subheading Soybean oil and its fractions, refined, not chemically modified (HS 1507.90.00)
10
]B
IO
EN
ER
Gy
A
ND
F
OO
D
SE
Cu
RI
Ty
[
will start at a 12 percent tariff base phasing out in 10 years, and with a quota of 7000 MT, gradually increasing at a 5 percent rate annually.
Non-tariff measures Peru eliminated all non-tariff restrictions on imports (prohibitions, licensing, and State
monopolies) at the beginning of the 90s and did not “tariff” these measures under the WTO.
For CAN intra-trade and with third countries, CAN’s Resolution 1008 subheading….except soybean seeds for planting has been classified under the category of risk 3, while the remaining subheadings under categories of risk 0 and 1. Subheadings in category of risk 3 require a phytosanitary import permit or document, a phytosanitary inspection to enter the country, and phytosanitary export certificate. Those under category have to be inspected to enter the country, whether or not have been exempted from fulfilling CAN phtytosanitary regulations or national regulations not specified in the Andean Community legislation.
1.10 wHeAT
Tariff rates In the wheat group, the following subheadings have are considered: Durum wheat
for sowing (HS 1001.10.10); Other durum wheat, not for sowing (HS 1001.10.90); Seed of wheat and meslin (HS 1001.90.10); Wheat and meslin other than durum or seed wheat (HS 1001.90.20); Durum wheat with rye (HS 1001.90.30) and Wheat or meslin flour (HS 1101.00.00).
All subheadings have a 0 percent tariff, except subheading Durum wheat with rye (HS 1001.90.30) which has 9 percent tariff. Under the WTO, sub items 1001.10.10, 1001.90.10 and 1001.90.30 have a 30 percent tariff, while sub items 1001.10.90, 1001.90.20 and 1101.00.00 have a 68 percent tariff.
No duties are levied to imports from CAN member countries. Since Peruvian government has reduced all national tariffs to 0 percent, except subheading 1001.90.30 which has a 9 percent tariff, all Mercosur member countries now are favored with 100 percent preference in almost all subheadings. On the exception item, Argentina has a 15 percent tariff preference and Uruguay 10 percent.
Under the TPA with the United States, these sub items will be duty-free immediately upon entry into force of this agreement.
Non-tariff measures Peru eliminated all non-tariff restrictions on imports (prohibitions, licensing, and
State monopolies) at the beginning of the 90s and did not “tariff” these measures under the WTO.
11
LIST OF TRADE POLICIES ON SELECTED COMMODITIES
Wheat imports from CAN intra-trade and from third countries all require a phytosanitary import permit or document, a phytosanitary certificate of origin, and a phytosanitary inspection at the port of entry, if they are classified under the categories of risk 3 and 4 by Resolution 1008. In the case of wheat flour, classified by Resolution 451 under category of risk 1, it only requires a phytosanitary inspection to enter the country.
1.11 cOTTON
Tariff rates Cotton not carded or combed (HS 5201.00.00) has a national ad valorem CIF tariff of 9
percent and a consolidated tariff of 30 percent for imports from WTO members. Tariffs are exempted under the Andean Community intra-trade. Preferential rates treatment grants a 30 percent preference to Argentina and Brazil, 0 percent to Paraguay, and 10 percent to Uruguay, under the Agreement of Economic Complementation No. 58.
Under the TPA with the United States, this product will be duty-free immediately upon entry into force of the agreement.
Non-tariff measures Peru eliminated all non-tariff restrictions on imports (prohibitions, licensing, and State
monopolies) at the beginning of the 90s and did not “tariff” these measures under the WTO. Cotton, processed for industrial use, that is imported from a CAN member country or
from third countries must comply with both general and specific requirements of the CAN’s Resolution 1071 (Annex 4). Among these above general requirements are the following:
Hold a phytosanitary import permit or document issued by the Sanitary Agricultural Official Service (SOSA) from the importer member country, which specifies the phytosanitary requirements for imports from a member country. Imports from third countries will pass a test on Pest Risk Analysis (ARP), following the procedures laid down in the Andean Community legislation in force.
Come from production sites under official control and duly authorized by the SOSA of the exporter member country. For imports from third countries, production sites may be recognized by the SOSA of importer member country in accordance with ARP’s outcome.
Hold a phytosanitary certificate or document issued by the SOSA of the exporter
country, showing that the requirements, set out in the import phytosanitary permit or document, have been met.
The product will be submitted to phytosanitary inspection at the point of entry. All
imports of the product must come free of soil, organic matter, and of strange materials. The product must come packed in new and clean cotton canvas or rough cloths,
fastened with metal straps and properly labeled.
rer e_anserarerarearrile7erarearearartardireSaCrear e -et* ee-Tifttife:
etaior Seal
12
A N N e X 1]B
IO
EN
ER
Gy
A
ND
F
OO
D
SE
Cu
RI
Ty
[
T A B L E 1
Peru: national tariffs and preferential rates
Hs code HS description National tariff
Tariff for wto
Tariff redu-ction with usa d/
Preferential rates (percentage of reduction)*
cAN Ar Br PA Ur
07131090
Dried, shelled peas “Pisum sativum”, whether or not skinned or split, not for sowing
9% a/ 30% IMM 100% 58% 40% 85% 57%
07134090Dried, shelled lentils, whether or not skinned or split, not for sowing
9% a/ 30% IMM 100% 58% 58% 85% 57%
10011010 Durum wheat, for sowing 0% 30% IMM 100% 0% 0% 0% 10%
10011090 Other durum wheat, not for sowing 0% 68% IMM 100% 0% 0% 0% 10%
10019010 Seed of wheat and meslin 0% 30% IMM 100% 0% 0% 0% 10%
10019020 Wheat & meslin other than durum or seed wheat
0% a1/ 68% IMM 100% 0% 0% 0% 10%
10019030 Durum wheat with rye 9% 30% IMM 100% 15% 0% 0% 10%
11071000 Malt, not roasted 9% 30% IMM 100% 40% 64%
40%70% 52% 57%
11072000 Malt, roasted 9% 30% IMM 100% 40% 64%
40%70% 52% 57%
13
ANNEX 1
Hs code HS description National tariff
Tariff for wto
Tariff redu-ction with usa d/
Preferential rates (percentage of reduction)*
cAN Ar Br PA Ur
12010090 Soybeans, whether or not broken
0%a1/ 30% IMM 100% 64% 64% 70% 100%
12060010 Sunflower seeds, whether or not broken 0% 30% IMM 100% 100% 100% 100% 100%
12060090 Other sunflower seeds, whether or not broken 9% 30% IMM 100% 46% 40% 52% 100%
12081000 Flour and meals of soybeans 9% 30% IMM 100% 40% 40% 52% 100%
15071000 Crude soybean oil, whether or not degummed
0%a1/ 30% BT=4%
IMM 100% 100% 58% 95% 100%
15079000 Soybean oil and its fractions, refined, not chemically modified
0%a/ a1/ 30% BT=12% GR
in 10 years g/ 100% 80% 0% 0% 10%
15111000 Palm oil, crude 9%a/ 30% BT=12% GR
in 10 years 100% 20% 20% 0% 10%
15119000Palm oil and its fractions, refined, not chemically modified
0%a1/ 30% BT=12% GR
in 10 years 100% 20% 15% 0% 10%
15121100 Sunflower-seed or safflower oil, crude
0%a1/ 30% BT=4%
IMM 100% 58% 58% 90% 100%
15121900
Sunflower seed or safflower oil, other than crude, and their fractions, whether or not refined, but not chemically modified
9% 30% BT=12% GR in 10 years 100% 0% 0% 0% 10%
17011190 c/
Sugar cane, raw, w/o flavoring or coloring, excluding brown or clayed sugar
9% 68% BT=58% GR in 5 years 100% 0% 0% 0% 0%
17019100
Cane or beet sugar, refined, sucrose chemically pure, solid, flavored or colored
9% 30% BT=12% GR in 5 years 100% 0% 0% 0% 10%
17019900 Cane or beet sugar, refined, sucrose chemically pure, solid, not flavored or colored
0%a/ 68% BT=58% GR
in 5 years 100% 0% 0% 0% 0%
23040000Oilcake and other solid residues, resulting from the extraction of soybean oil
0%a1/ 30% IMM 100% 58% 40% 52%
85% 100%
23063000
Oilcake and other solid residues, resulting from the extraction of vegetable fats or oils, of sunflower seeds
0% 30% GR in 5 years 100% 46% 46% 52% 100%
23099020Mixed feed or mixed feed ingredients used in animal feeding
0% 30% IMM 100% 40% 40% 52% 57%
52010000 Cotton, not carded or combed 9% 30% IMM 100% 0%
30% 30% 0% 10%
* Preferential tariffs granted to MERCOSUR as of January 1, 2008.a/ Ad valorem tariffs for selected national items modified by DS 038-2008-EF issued on March 7, 2008 a1/ Tariff reductions of 0 percent are equivalent to preferential rates of 100 percent.b/ Preferential rate of 95 percent for a quota of 60,000 MT of hard yellow corn.c/ Products under the Peruvian price band system. d/ Trade Promotion Agreement with the USA, still pending to be effective.Abbreviations refer to periods of tariff reductions. IMM = Immediate reduction BT= Base tariff before starting the gradual reduction GR= Gradual reduction of tariffe/ Quota of 500,000 MT of hard yellow corn that will grow 6 percent annually. f/ Quota of 74,000 MT of rice that will grow 6 percent annually.g/ Quota of 7,000 MT of soybean oil that will grow percent annually.
14
]B
IO
EN
ER
Gy
A
ND
F
OO
D
SE
Cu
RI
Ty
[
T A B L E 2
Peru: non-tariff measures for selected agricultural products
Cane or beet sugar, refined, sucrose chemically pure, solid, flavored or colored
570 9 0 0 0 5 9 593
15132910
Palm kernel oil or babassu oil, other than crude, and their fractions, whether or not refined, but not chemically modified
3 42 83 8 7 658 316 1,117
Total of selected agricultural imports 616,870 697,093 723,102 775,613 969,055 1,036,863 1,135,497 5,954,093
Total of agricultural imports 940,406 1,064,877 1,099,611 1,168,284 1,408,258 1,566,419 1,687,952 12,635,509
rer e_anserarerarearrile7erarearearartardireSaCrear e -et* ee-Tifttife:
etaior Seal
19
A N N E X 2 LIST OF STUDIES ON EFFECTS OF AGRICULTURAL TRADE POLICIES ON POVERTY AND FOOD SECURITY IN THE CONTEXT OF PERU
1 LOS PRODUCTOS AGROPECUARIOS SENSIBLES ANTE LA APERTURA COMERCIAL EN EL PERU
Aspectos principales aportados por los estudios realizados para el MINAG y el CENI. Dic 2004
Informe preparado para el IICA por el Dr. Carlos Pomareda
2 LA POLITICA AGRARIA DEL GOBIERNO: BALANCE Y PERSPECTIVAS Por: Eduardo Zegarra / Julio 2004 / Perú Económico
3 APERTURA COMERCIAL: OPORTUNIDADES Y DESAFIOS PARA LA AGRICULTURA PERUANA – JULIO 2005
Instituto Interamericano de Cooperación para la Agricultura IICA – Octubre 2005
4 POSIBLES EFECTOS DE LA LIBERALIZACION COMERCIAL EN LA AGRICULTURA DE LAS REGIONES DEL PERU – ENERO 2005
Elaborado para el IICA por el Ing. Gustavo González Prieto y la Lic. Pamela Domínguez
5 RESULTADOS DEL ACUERDO DE PROMOCION COMERCIAL PERU – ESTADOS UNIDOS DE NORTEAMERICA – SECTOR AGRICULTURA
Estudio sobre los posibles impactos del TLC a nivel de productos sensibles Unidad de Negociaciones Comerciales y Oficina de Estadística y Políticas. MINAG –
Junio 2006
6 LA PEQUEÑA AGRICULTURA COMERCIAL: LIMITES Y POSIBILIDADES PARA SU DESARROLLO.
Por: Javier Escobal, Carolina Trivelli, Bruno Revezs GRADE. IEP 2006. Dcto. De trBTajo 50, serie Economía. 45
7 PEQUEÑA AGRICULTURA COMERCIAL: DINAMICA Y RETOS EN EL PERU
CIES; CIPCA, GRADE, IEP, 2006 Diagnostico y propuesta Por: Javier Escobal, Carolina Trivelli, Bruno Revezs
rer e_anserarerarearrile7erarearearartardireSaCrear e -et* ee-Tifttife:
etaior Seal
20
]B
io
en
er
gy
a
nd
F
oo
d
Se
cu
ri
ty
[
8 LIBERALIZACION COMERCIAL, TRATADO DE LIBRE COMERCIO Y POBREZA RURAL
Investigación, Políticas y Desarrollo en el Perú. Lima GRADE 2007 Por: Javier Escobal y Carmen Ponce 9 SEGURIDAD ALIMENTARIA Y PRODUCCION AGRICOLA EN EL PERU Por : Juan Sánchez Barba Presidente CIED www.ciedperu.org/artículos/jsdebate.htm
10 COMPROMISO Y EXPERIENCIAS DEL PERU EN EL MARCO DEL ACUERDO SOBRE AGRICULTURA DE LA OMC
Eco. Jessica Luna Dirección Nacional de Asuntos Multilaterales y Negociaciones Comerciales
Internacionales. Ministerio de Industria, Comercio e Integración www.ciedperu.org/articulos/rcdebate.htm
11 PERU: HACIA UNA ESTRATEGIA DE SEGURIDAD ALIMENTARIA PARA EL NUEVO MILENIO
Biodiversidad: Una estrategia campesina para la seguridad alimentaría y el mercado. Por: Ricardo Claverias Huerse Coordinador del Proyecto: Conservación y uso de Recusos genéticos de Cultivos
Agricultural Trade PoliciesTanzaniaAuthor: Economic and Social Research Foundation,
Dar Es Salaam, Tanzania
21
0
23
1.1 BACKGROUND TO THE STUDYTanzania has resolved to continue with macro-economic and sector-specific policy reforms as a long term strategy for agricultural growth. These reforms are aimed at creating a conducive environment for private investment by individual producers, intermediaries and agro-processors, among other objectives. In a country where rural areas are home to approximately 80 percent of the population, who depend mainly on farming activities for their livelihood, there is now a consensus that such reforms are a matter of priority if the country’s initiatives to reduce rural poverty are to be realized.
Agriculture has four important roles to play: provider of food security; earner of foreign exchange; major GDP contributor; and the vehicle for inter-sectoral backward and forward linkages. To enable farmers to access these opportunities, agriculture needs well-functioning markets with a coherent marketing policy environment. In Tanzania, agricultural marketing is one of the major impediments to agricultural growth and overall prosperity of the farming communities around the country, as has been particularly evident during the post- trade liberalization regime1.
The current agricultural marketing systems in Tanzania can be better understood by reviewing the evolution of government policy that has affected marketing of agricultural output over the past 5 decades. Since Independence, Tanzania has experimented with different policy regimes, starting from unregulated markets, to cooperative based marketing, to centralized crop authorities and back to unregulated markets (Amani et al 1983; ERB 2001). Agricultural marketing in the country has evolved through three major regimes, namely: the pre-Arusha Declaration unregulated marketing system (1961 to 1967), the post-Arusha Declaration centrally controlled marketing system (1967 to 1980) and the current liberalized marketing structure2.
1.2 THE STUDY CONTEXTAs pointed out earlier, agricultural marketing is one of the major impediments to agricultural growth and overall livelihoods of the farming communities in Tanzania. FAO, which is implementing the Bio-energy and Food Security Project in three countries (Tanzania, Peru
1 See for example Kherallah et al (2002) and URT (2005). A detailed discussion on weaknesses and threats against the agricultural sector is provided in the ASDS (URT 2001).2 See also ESRF (2004) and Mashindano and Wanga (2006).
C H A P T E R 1 INTRODUCTION
24
]B
io
en
er
gy
a
nd
F
oo
d
Se
cu
ri
ty
[
and Thailand), commissioned the Economic and Social Research Foundation (ESRF) to carry out a review of agricultural trade policies on selected commodities in the country.
1.3 OBJECTIVES AND METHODOLOGYMore specifically, the study aims at:
a) Compiling a list of trade policies for the following categories of commodities:
n Cereals: Maize, Rice, Millet, Sorghum, and Wheat
n Tubers: Cassava
n Cash Crops: Coffee, Sugar, Cashew nut, Sesame and Cotton
b) Compiling a list of trade policies (if any) for all biofuels, e.g. bio-ethanol and bio-diesel.
Such as tariffs, non-tariff barriers (for example licensing requirements, quotas, and minimum access volumes); however, all non-tariff barriers that apply have been listed. Other import taxes and surcharges, and any other trade policies that affect the import of agricultural commodities in processed or unprocessed form have also been considered. All of these trade policies pertaining to the first two categories of commodities have also been described for both import and export, because the regulations often differ.
A description has also been provided of how these trade policies vary according to the country’s membership in trading blocs (regional or bilateral free trade areas). There are cases where trade policies have been described with reference to the Harmonized System (HS) classification, or whatever classification is in use in the country.
c) Compiling a list of studies on the effects of agricultural trade policies on poverty and food security in the context of Tanzania. Thus, in terms of the study approach and methodology, these findings are mainly based on desk and library reviews although a limited number of interviews and consultations were also carried out.
25
C H A P T E R 2 POLICY FRAMEWORK IN TANZANIA
2.1 AGRICULTURAL POLICY Agriculture plays a central role in Tanzania’s economy. In order to enable this sector to take full advantage of the opportunities created by any new environment, certain modifications and realignment of strategies are required. In this context, the government intended to: merge the agricultural and livestock policies; ensure synchrony between changes in the country’s economic climate and the new national land policy; and put in place a proper management and protection system for the agricultural environment. The existing Agricultural (and Livestock) Policy was established with the goal of improving the well being of the people whose principal occupation and way of life were based on agriculture, that is commercializing agriculture so as to increase income levels.
This goal is made possible thanks to: assuring basic food security for the nation and improving national standards of nutrition by increasing output; improved standards of living in the rural areas through increased income generation from agricultural and livestock production, processing and marketing; increasing foreign exchange earnings for the nation by encouraging the production and increased exportation of cash crops, livestock products, food crops, by-products and residues; producing and supplying raw materials including industrial crops, livestock by-products and residues for local industries; developing and introducing new technologies which increase the productivity of labour and land; promoting integrated and sustainable use and management of natural resources in order to conserve the environment; developing human resources within the sector so as to increase the productivity of labour and improve their awareness and morale; providing support services to the agricultural sector which cannot be provided by the private sector and promoting the access of women and youth to land, credit, education and information.
2.2 AGRICULTURAL MARKETING POLICYFor decades, the agricultural sector in Tanzania experienced uneven growth of national food crop markets, large falls in production of traditional export crops and an increase in subsistence and rural poverty. These severe economic crises pointed to an urgent need for a policy shift. Although liberalization of the agricultural sector was undertaken as a corrective measure, low levels of grain processing remains a problem. The market infrastructure is relatively poorly developed in the areas of transport, storage and market services. Hence, there was little transformation of grains, and the marketing chains for
26
]B
io
en
er
gy
a
nd
F
oo
d
Se
cu
ri
ty
[
main crops such as maize and rice and even minor grains such as sorghum and millet have remained relatively short. The market share for various exports has been adversely affected by the inability to cope with the liberalization arrangements.
Agricultural marketing in Tanzania has been constrained by such problems as: inadequate access to markets, insufficient market information, limited access to finance, lack of capacity of agricultural marketing institutions, lack of entrepreneurial skills, non-existence of product standards, high transaction costs, poor coordination and integration of marketing channels and policy uncertainties.
Thus, the costs of agricultural marketing within the country are necessarily high, and, in no small measure, due to the underdeveloped transport and communication infrastructure. This called for a reform of policies in order to reverse the terms of trade in favor of the agricultural sector; hence the Agricultural Marketing Policy sought to make sure that the agricultural marketing system was efficient, effective and equitable by facilitating and promoting the performance and active participation of marketing actors, including the government, private sector and civil society organizations, in exploiting marketing opportunities.
2.3 TRADE POLICYTrade expansion and rapid economic growth have been set as some of the goals for eradicating poverty in Tanzania by the year 2025. The Trade Policy in Tanzania aims at identifying ways and means of ensuring a viable and steady path towards competitive export-led growth which will fulfill the goal of poverty eradication. The Trade Policy provides space for the government to intervene in directing trade related matters. Trade liberalization enhances domestic productivity, efficiency, improves the quality of products, lowers prices and ultimately leads to improved consumer welfare. So far, Tanzania has not been able to derive significant benefits from trade liberalization as well as globalization as a whole, due to inadequate supply and delivery capacity with low technology levels, insufficient physical and human capital and underdeveloped infrastructure.
27
C H A P T E R 3
3.1 MILLET AND SORGHUMProduction:
Production is rather small-scale (Rohrbach 2007, p.10).
Marketing Channels:Both Sorghum and Millet producers in Tanzania suffer from the lack of a commercialized
market (Rohrbach 2007, p.6). More than 95% of Sorghum and Millet harvested is consumed on the producing farms (Rohrbach 2007, p.6) and trade occurs rather between neighboring households (Ibid.) and not in the form of long-distance trade.
The actual quantity of Sorghum entering the National Markets in Dar es Salaam, Mwanza and Arusha is negligible. The amount of Sorghum entering wholesale markets is sold at higher prices on up-country markets than on the Dar es Salaam market which is said to reflect the common practice of acquiring grain directly from the producer, there is little evidence that Sorghum is moved between different wholesale markets (Ibid, p.15).
The margins between wholesale and retail prices are relatively high; these high margins are a sign of the small quantities of Sorghum traded on both markets (Ibid., p.15). Due to the absence of a grain trading monopoly direct trade between farmers and processing industries of an uncertain amount might have arisin , quantities of which are not predictable but assumed to be rather small.
The majority of Sorghum being traded is destined to small-scale beer breweries of opaque beer. Production of opaque beer occurs on small farms serving the demands of local markets.
The markets for sorghum and millet are highly seasonal and operate only in the period two to three months after the harvesting season (GOT 2005, p.2). In addition, the markets for sorghum and millet are very thin and volatile as prices are dependent upon the harvest (Rohrbach 2007, p.14).
3.2 WHEATProduction:
Wheat is mainly produced in the northern highlands (Arusha and Kilimanjaro regions) on large-scale farms and in the southern highlands (Iringa, Mbeya, and Rukwa regions) on small-scale farms (Kilima 2006, p.11).
MARKETING AND TRADE POLICY OF AGRICULTURAL CROPS
28
]B
io
en
er
gy
a
nd
F
oo
d
Se
cu
ri
ty
[
Marketing Channels:Wheat for export is sold on major regional markets (Ibid.) Most of the wheat consumed
is imported, Tanzania is highly dependent on wheat imports, mostly from Australia and Pakistan (Kilima 2006,pp.13-14).
3.3 MAIZEMaize is a key staple food for the majority of Tanzanian households. Production of maize is carried out in almost all regions in Tanzania, though levels of production differ. Maize is largely farmed under rainfed conditions by smallholders. The existence of supply constraints causes surplus and deficits of supply in different seasons and can negatively affect national food security.
Domestic Marketing Arrangement Maize marketing involves traders who purchase directly from the farmers during the
harvest season. Transactions takes place either at the household level or within the village market. Returns for the small producers are meager owing to high transaction costs (RATES 2003) and lack of barganing power. In fact, along the marketing chain, there is lack of information and transparency and use of unstandardized measuring facilities. .
Generally traders normally have two options, either to sell to neighbouring countries or to transport the product to major urban markets such as Dar es Salaam or any other region which is experiencing a deficit. Nevertheless, trading maize within the domestic market is less attractive since it does not guarantee attractive prices as the cross border trade.
Import of MaizeIn Tanzania mainland , the Strategic Grain Reserve (SGR), which is a department
within the Ministry of Agriculture and Food Security, is the authority having the mandate to issue import permits for maize.
In order to protect and promote local production of maize, import permits are issued only when domestic maize supply is lagging behind the actual demand, whereby import is allowed as a corrective measure of food insecurity. This is particularly the period when the country has expericenced counterproductive climatic phases. If the weather condition of the previous harvest season was adverse often the goverment is forced to distribute maize free of charge or at a subsidized price to specific rural households which seem to be severely affected by food insecurity.
To obtain the required import permits, traders must submit an application in a simple letter showing the quality, quantity, delivery time and source of their product. Conditions required for one to be granted a licence include: a trading licence, be registered with the Tanzania Revenue Authority (TRA), evidence is a TIN number. Import permit for a single shipment is valid for up to six months and can be extended (EAC report 2005/06).
29
MarKeting and trade PoLicy oF agricuLturaL croPS
Import regulations (Tax) applicable within the East African Custom Unions and SADC region is as per the summarized information in table number 2 below on hamornized system code for maize in Tanzania. Entry of maize within the domestic market is upon compliance with the minimum food standards as per Tanzania Bureau of Standard and Tanzania food and National Food and Drug Authority requirements.
Export Related PolicyExport of maize in Tanzania is considered to be a sensitive issue, which is therefore dealt
with carefully in order to ensure maintanance of food security. During the harvest season normally the goverment will discourage farmers from selling their produce as the future season is unpredictable. This situation poses disincentives to local producers and denial of luctrative market opportunities which may be available in neighbouring countries.
Despite the situation, a parallel market has been operating using unofficial routes. This is through the Malawi, Zambia and Kenya boarder, particularly when there is a food shortage in one of these countries. However, the goverment does not favour this and thus has been responding with an ad hoc ban. Failure to facilitate expansion of national and regional trade in food staples risks stalling growth and private investment in agriculture (MSU 2008). Contributing factors to cross border trade in this respect include exchange rate and food shortage in importing countries.
3.4 COFFEECoffee is Tanzania`s largest export crop, the export earnings in 2003 amounted to US$63m (DTIS Volume 2 2005, p.10), which accounts for approximately 6% of total merchandise export earnings (Ibid.).
Production:Around 10% of coffee is grown in estates, whereas 90% is grown on small-scale farms
sizing 1-2 hectares. In total, 800,000 60 kilogram bags are produced. Types of coffee grown are “Arabica” (about two thirds) in the Arusha and Kilimanjaro regions as well as the Mbeya and Ruvuma regions and “Robusta” in the lake zone (DTIS Volume 2 2005, p.10).
Marketing channels:
All market auctions are carried out through the Coffee Board which manages the selling and buying process at the Moshi Coffee Auction (see GOT 2003 Part VIII 49(1)).
Buyers are mainly private traders and few estates and non-private buyers (DTIS Volume 2 2005, p.11). The majority of private buyers process and export coffee in own factories (Ibid.).
The Coffee Board can be described as very powerful. It issues the start date of Coffee buying (DTIS 2005, p.13) and controls standard and quality (GOT 2003, Part IV, 23). Recipients of coffee grown in Tanzania are mainly OECD countries (DTIS 2005, p.10).
30
]B
io
en
er
gy
a
nd
F
oo
d
Se
cu
ri
ty
[
Taxation:Taxes are relatively high, in 1998/99 taxes as a share of producer prices were 21% for Arabica
and 28% for Robusta coffee (DTIS 2005, p.12). Several taxes take the form of flat fees (Ibid.).
The Tanzania Revenue Authority collects value-added tax at the time of the transaction. Although traders and exporters are eligible for refunds of the value-added tax, this possibility is rarely used due to long processes and bureaucracy (Baffes 2003, p.11). Taxes are applied on export or auction prices (DTIS 2005, p.12).
Subsidies:Import subsidies have been removed after Liberalization (DTIS 2005 Part 2, p.11).
Licensing:According to the Coffee Industry Regulation of 2003, all people involved in the marketing
chain must register at the Coffee Board (Part V, 27(9)) and acquire a license (Part V, 28(1)). In 2002/03 the Coffee Board issued the “one license regulation” which limited private buyers, processors and exporters to just one license (DTIS 2005, p.12). The Coffee Board announced a moratorium on new licenses for the construction of coffee curing factories which prevents the private sector from further expanding capacities (Ponte 2001, p.34).
Rules:Furthermore, the Coffee Board insists that all primary processing must be done in
farms (DTIS 2005, p.13). Also, a prohibition exists against buying coffee in cherry form (Baffes 2003, p.13).
3.5 CASHEW - NUTSIn 2002, Tanzania was the 4th biggest producer of cashew nuts worldwide, 92,000 tons of raw Cashews were produced (DTIS 2 2005, p.3).
Production:98% of the production takes place on small-scale farms (DTIS Volume 2 2005, p.4).
Marketing Channels:Producers sell to primary cooperatives (rather mere collection centres), which collect
the nuts from their members on behalf of the buyer and administer a levy issued by the district council. Often agents are used to negotiate the final price and transport. Main exporters claim and transport goods to customers. Export is dominated by a small number of large-scale actors (Eskola 2005, p.21). Cashew nuts are sold unprocessed and virtually all trade goes to India (Ibid.).
The Cashew Board sets indicative prices (DTIS 1 2005, p.146). The price negotiations are based on the current price at the kernel market and the price of raw cashews in other
31
MarKeting and trade PoLicy oF agricuLturaL croPS
producing countries (Eskola 2005, p.20). It also collects a 3 percent levy on the fob value of exports (Mitchell 2004, p.8).
Standards:Currently there exists no grading of cashews (DTIS 2 2005, p.6). This has led to a
decline in quality.The Cashew nut Marketing Regulations of 1998, Part V, 16(1) regulates the packing in
sealed tins with carbon dioxin gas infused of 11.34kg net weight.
Taxes:Tanzania applies an export tax on raw cashew nuts (WTO 2007, p.173).
Taxes are collected on gross sales (DTIS 2 2005, p.7). They vary from district to district (Ibid.) In March 2005 the “MOB” (Memorandum of Understanding) was signed to reduce taxes (Ibid.)
Additionally, several local council levies are still collected on cashew nut sales. These levies are collected for various development funds (Eskola 2005, p.21).
3.6 SUGARFollowing the adoption of the structural adjustment programs which emphasized the need for the government to withdraw from production and marketing, industries are presently owned and operated by the private sector. The government’s role within the industry is solely to provide a conducive environment in order to enhance growth of the sub sector. Since the private sector assumed their new role, some progress has been achieved in terms of increased production. Despite these achievements however, the supply of sugar is still lagging behind the actual national demand, causing Tanzania to rely on imported sugar.
An Interview with officials of the Tanzania Sugar Board suggests that Tanzania normally exports sugar to the European Union as a way of utilizing its prefential quota allocated through initiatives such as African Caribean Pacific (ACP Sugar Protocol) and Everything But Arms (EBA).
Export requirements include specification on quality (purity rate is 96 percent) and other general safety measures. Given that each particular initiative ACP as well as EBA provides a specific supply quota, the Tanzania Sugar Board has appointed a broker based in Great Britan to be in charge of market surveillance in order to ensure that consignments for both initiatives are combained and delivered together in order to reduce transaction costs associated with the logistic arrangement.
Export facilitation is currently undertaken by the Sugar Board, however there are current efforts to shift this activity to the private sector. In that account, this activity will
32
]B
io
en
er
gy
a
nd
F
oo
d
Se
cu
ri
ty
[
most likely be undertaken by the Association of Sugar Producers or another private agent appointed by them. Export of sugar is not taxed, nevertheless part of the export proceeds are allocated to promote and develop the sugar sub sector throught the Sugar Development Fund.
Import of sugar Import of sugar is monitored by the Tanzania Sugar Board (mainland) which was
mandated to carry out this activity by the Sugar Regulations Act. The Act requires the Board to establish a technical advisory commitee to monitor and regulate importation of sugar into the Tanzanian mainland.
In determining the quantity of sugar to be imported for each season, the Board takes into account the difference between the anticipated local sugar production and local annual consumption. A two months buffer stock is added to this difference which makes the quantity of sugar to be imported to offset local sugar production shortfall. Any person who wishes to import sugar must provide adequate information to the Board before an import licence is granted.
Some of the requirements for aquiring an import licence include details of the company such as address, location, VATor TIN registration, trading license, business turnover, performance of previous year on sugar importation, sales distribution network in Tanzania mainland, quantity of sugar to be imported, and the number of importation lots. Granted licenses provide information of category of sugar (for domestic consumption), quantity to be imported, validity period, port of entry and fees payable. The import license is granted upon the payment of a performance bond of US$ 10 per metric ton.
Other conditions include the payment of a license fee, confirmation of purchase agreement i.e evidence of sugar supply agreement, and lastly a letter of comfort from the bank indicating that a particular trader is known, has an account with the bank and is financially capable. Import tariffs applicable in this respect are per East Africa Custom Union protocol whereby sugar imports are subject to 25 percent import tariff and Value Added Tax which is 20 percent in the case of Tanzania.
Imported sugar normally undergoes tests to examine if it complies with the minimum food standards before it is allowed to enter the local market.
3.7 SESAMESesame is a non-traditional export crop which is predominantly produced by small holder farmers. There is no marketing board which has the responsibility of regulating the sub sector. According to Mashindano et. al., (2007) marketing of sesame is regulated by the local government for the purpose of collecting the due levy from the traders (5 percent of the farm gate price).
33
MarKeting and trade PoLicy oF agricuLturaL croPS
The marketing system is characterized by lack of important marketing information particularly to farmers and rather high transport barriers like road blocks at every exit point of each district as a means of enforcing compliance to pay the levy. The levy should be paid to the local goverment authority. Sesame is largely for export purpose. The main importing countries of sesame are Japan, China, Korea, Egypt , the European Union and Israel.
There is no evidence that Tanzania is importing raw sesame, perhaps sesame oil may be traded though not in large quantity. Import tariffs for sesame oil is subject to the East African Custom Union whereby sesame oil is classified as a processed food and is subject to 25 percent import duty charged at ad valorem. Non Tariff Barriers (NTBs) in this context vary widely, sesame oil is a food commodity which is supposed to comply with the food standards. Other forms of NTBs include import licensing, custom valuation and documentations.
Tanzania is a member of World Trade Organisation (WTO) and as such, is in the process of converting the NTBs into tariffs as a way of protecting the local market.
Requirements for sesame export include:
n Export license which is granted upon business registration;
n Phyto-sanitary inspection to ensure quality compliance before export;
n no export tax which is charged on sesame.
In addition, Tanzania`s exports are subjected to other requirements of the importing country such as food standards, purity specification and others even with the framework of the Most Favoured Nation (MFN).
3.8 CASSAVAIn Tanzania, Cassava is a an important subsistence food crop especially when maize supply fails. The government has been emphasizing to rural households the need of cultivating cassava (Laswai 2006).
Consumption behaviour of the people affects the growth of the cassava sub sector. There are ongoing initiatives to commercialize the crop, particularly through the development of value addition.
Commercialization of the crop has begun in the form of processing cassava into flour, chips and other products which are widely marketed particularly in urban areas. In rural areas cassava is processed into flour or sometimes boiled as a whole.
Tanzania has been exporting cassava form early 1980s up to 1990s when the volume of export reached 108.7 metric tones. However the volume of export declined up to 3.4 metric tones between 1999 and 2001.
34
]B
io
en
er
gy
a
nd
F
oo
d
Se
cu
ri
ty
[
3.9 COTTONProduction:
Cotton is Tanzania`s second largest export crop. It is mainly produced in the Western Growing Area (see Kilima 2006, p.9) by smallholders on farms of an average size of 1.5 hectares (Baffes 2002, p. 1).
Marketing Channels:After liberalization, the private sector became increasingly engaged in the marketing
process. In the Cotton sector four major marketing channels exist. The producer has the possibility
to sell either to cooperative unions, private salesmen, private ginneries or to the Tanzania Cotton Lint and Seed Board (Kilima 2006., pp.9-10). The role of cooperative unions is steadily declining, 90% of marketing and trading is done by the private sector (Ibid.).
After ginning, cotton is sold domestically or exported. Main importeurs are Bulgaria, the United Emirates and Burundi among others (Ibid.).
The Tanzania Cotton Lint and Seed Board still plays an important role in input provision and extension service (Kaehkoenen/Leather 1999, p.85). It regulates the industry, inspecting the quality of lint and other by-products; announces indicative prices; and collects and disseminates statistics. The Board collects 0.8% of export prices as a Board Fee (Baffes 2002, p.24).
Support to cotton producers is given mainly through the Cotton Development Fund, established in 1999.
The CDF collects a 3 % levy on cotton exports to finance seeds, fertilizer and research and development. The inputs are distributed to members of the Board below market prices. (Baffes 2002, p.5). Some of the main functions of the Fund include financing R&D, extension services, and procurement and distribution of cotton inputs (WTO 2007, p.174).
Baffes (2002) found considerable variability in cotton production in Tanzania. He refers to a World Bank study stating that cotton’s short-run supply elasticity is unity, implying that cotton’s price variability is fully translated into supply variability. This reflects the flexibility of farmers in crop-switching (Baffes 2002, p.4).
Furthermore, the existence of several marketing channels resulted in a decline of input supply which led to a collapse in supply and distribution (Baffes 2002, p.5).
Tariff and Non-Tariff Barriers:Even though the cotton sector is said to be widely liberalised many barriers can be found
according to Kaehkoenen/Leathers (1999) which influence the marketing of cotton.
35
MarKeting and trade PoLicy oF agricuLturaL croPS
Institutional barriers for entering the cotton market are very high. Producers and traders as well as exporters and ginneries have to obtain seperate licenses (Kaehkoenen/Leathers 1999, p. 83). Exporters of cotton have to pay a 1000$ flat fee and private ginneries are charged of a flat fee of 2000$ (Baffes 2002, p.24).
Also, competition is limited by the Cotton Industry Regulations of Tanzania controlling the number of ginneries in each area. Transaction costs are very high due to bad infrastructural arrangements (Ibid.).
Pricing of seed cotton is not fully liberalized. An indicative price is set jointly between cotton buyers and board officials, farmers who are not members of the Board are not represented. The result is that farmers make their production decisions before knowing the possible price at which they are likely going to sell their produce. Additionally, farmers are not producing in response to market situations (ESRF 2004, p.9).
Marketing transaction costs are very high due to various fees and requirements. The taxes and levies raised amount to 13% of the producer price as is indicated in the table below.
The import tariff on raw cotton is 0%, while the average tariff on cotton products (HS 52.04-12) is 21.1%, with rates ranging from 10% to 50% (WTO 2007, p.174). Exporters have to pay an export duty of 2% on the export price (Baffes 2002, p.24).
3.10 RICEProduction:
Rice is Tanzania`s second most important staple good (see Kilima 2006, p. 15). Rice is mainly produced by small-scale farmers and marketed by the private sector (Ibid.), large-scale production is under the National Food Company (DAEA 1999, p.14).
Marketing Channels:There are many people involved in the marketing chain: farmer, local trader,
pieceworkers, millers, regional traders, transporters, brokers, loaders and unloaders, wholesalers, and retailers, with each one taking their piece of the price. This ultimately reduces the price to the producer. Above all, producer prices are lowered by extremely high transport costs (Ibid.).
Tanzania exports as well as imports rice but export is rather negliable. Export permits are required for anyone who desires to export rice from Tanzania. The Director of the Strategic Grain Reserve (SGR) issues these permits.
Due to long distances, information from Dar es Salaam’s wholesale market about prices and information about improved means of production rarely reach farms and actors on the
36
]B
io
en
er
gy
a
nd
F
oo
d
Se
cu
ri
ty
[
small-town level. This information asymmetry leads farmers to sell their products at lower prices than they could acquire and to produce irrational amounts (DAI 2003, p.30).
Regulations:The rice sub-sector is not heavily regulated. The main areas where regulation occurs is
for exports (regulated by the Strategic Grain Reserve) and at the district cess.
Export permits are required for anyone who desires to export rice from Tanzania. The Director of the Strategic Grain Reserve (SGR) issues these permits.
A cess is charged at the district level on each bag of rice leaving the district, which varies by each district. For example, Ifakara has placed a cess of 1000/= per bag of rice which is much higher than in Iringa (700/=) and Kyela (400/=). When this is factored into the higher costs of transport and the lower value of the Ifakara rice compared to the rice from other regions, it hinders the competitive advantage of Ifakara rice (DAI 2003, p.25).
3.11 NON-TARIFF BARRIERS FOR OTHER COMMODITIES Food crops as well as cash crops are facing major constraints in Tanzania concerning non-tariff barriers.
Custom Procurements:Export documentation includes the following documents: - (a) an invoice indicating
an F.O.B value; (b) specification showing type of products; (c) Export permit, authorizing exportation of the relevant crop (for some crops only), this export permit can be obtained from the relevant ministry (e.g. MIT, and MNRT, etc) or crop board (e.g. Sisal); (d) a Business License to export; and (e) certificate of origin issued by TCCIA (Amani et al. 2003, p.9).
A study by Amani et. all also states that the administration of customs at some boarder towns is impaired by the physical nature of the border itself. The study included long procedures, high clearing and forwarding costs, long immigration procedures and security issues as non-tariff barriers affecting exports as well as imports in Tanzania (Amani et al 2003, p.10).
Permits:Another problem cash crops are facing is the need to obtain council’s permits.
Regulations:All purchases over $5000 have to be made through open tender. These tenders are
frequently awarded to uncompetitive firms in which government officials have a significant interest (Amani et all 2003, p.10).
Standards, Testing, Labeling and Certification: The Tanzania Bureau of standards (TBS) is responsible for standards, labeling, testing
37
MarKeting and trade PoLicy oF agricuLturaL croPS
and certification. However, the labeling and packaging requirements are not harmonized. There are many regulating entities including: TBS, the Tanzania Pesticide Research Institute, the Pharmacy Board, and the National Food Control Commission (Ibid.), which results in uncertainty on the part of farmers and traders in which standard and regulation to adopt and fosters corruption as well as the imposition of false fees.
Weighbridges and in-country controlling:A recent research study on non-tariff barriers by the Economic and Social Research
Foundation pointed out the problem of weighbridges and road blocks. Weighbridges as well as inspections on the road take time and are often prone to corruption due to unclear regulations and standards.
Information Assymetries:As wholesale markets as well as centres for research and technology are often located in
Dar es Salaam and production occurs in rural areas, farmers often suffer from information assymetries. This includes the uncertainity about prices set on the wholesale markets which leads farmers to selling their products below the indicated minimum price. Also, as they do not know about supply and demand, they have to produce irrational amounts which are not in accordance to current demands at the wholesale market. Information about standards as well as improved facilities and means of production often not reach small farmers (DAI 2003, p.25).
Infrastructure Limitations: Lack of infrastructure severly limits the ability of farmers both to obtain means of
production as well as to export goods and access local and national trade. This lack of infrastructure, which includes telecommunications as well as roads and railways, results in lower producer prices.
rer e_anserarerarearrile7erarearearartardireSaCrear e -et* ee-Tifttife:
etaior Seal
38
A N N E X 1]B
io
en
er
gy
a
nd
F
oo
d
Se
cu
ri
ty
[
T a b l e 1
Harmonized System Code for Wheat in Tanzania
Hs Code Hs Description Country of origin % Duty charged
1001.10.90 Wheat and meslin - durum wheat - other
import duty (Sadc, tz+za) 0.00%
import duty (Sadc without za) 0.00%
import duty 0.00%
1001.90.20 Wheat and meslin - other - Hard Wheat import duty 10.00%
1001.90.90 Wheat and meslin - other
import duty (Sadc, tz + za) 10.00%
import duty (Sadc WitHout za) 10.00%
import duty 10.00%
1101.00.00 Wheat or meslin flour
import duty (Sadc, tz + za) 15.00%
import duty (Sadc without za) 25.00%
import duty (Ke) 2.00%
import duty 60.00%
1109.00.00 Wheat gluten, whether or not dried
import duty (Sadc, tz + za) 15.00%
import duty (Sadc without za) 25.00%
Vat (Sadc, tz + za) 20.00%
Vat (Sadc, without za) 20.00%
Vat (Ke) 20.00%
Vat (ug) 20.00%
import duty 10.00%
Vat standard rate
Source: www.Tiscan.Co.Tz/tariffbook (31/1/2008)
T a b l e 2
Harmonized System Code for Maize in Tanzania
Hs Code Hs Description Country of origin % Duty charged
1005.10.00 Maize (corn).- Seed
import duty (Sadc, tz+za) 25.00%
import duty (Sadc without za) 15.00%
import duty 25.00%
1005.90.00 Maize (corn).- other
import duty (Sadc, tz + za) 15.00%
import duty (Sadc without za) 15.00%
import duty 50.00%
Source: www.tiscan.co.tz/TariffBook (31/1/2008)
39
anneX 1
T a b l e 3
Harmonized System Code for Coffee in Tanzania
Hs Code Hs Description Country of origin % Duty charged
0901.11.00
coffee, whether or not roasted or decaffeinated; coffee husks and skins; coffee substitutes containing coffee in any proportion. - coffee, not roasted: -- not decaffeinated
import duty 25.00%
import duty (Sadc without za) 0.00%
import duty (Sadc + za) 0.00%
0901.12.00
coffee, whether or not roasted or decaffeinated; coffee husks and skins; coffee substitutes containing coffee in any proportion.- coffee, not roasted: -- decaffeinated
import duty 25.00%
import duty (Sadc without za) 0.00%
import duty (Sadc + za) 0.00%
0901.21.00
coffee, whether or not roasted or decaffeinated; coffee husks and skins; coffee substitutes containing coffee in any proportion.- coffee roasted :-- not decaffeinated
import duty (Sadc, tz + za) 15.00%
Vat (Sadc, tz + za) 20.00%
import duty (Sadc without za) 15.00%
Vat (Sadc without za) 20.00%
Vat (Ke) 20.00%
Vat (ug) 20.00%
0901.22.00
coffee, whether or not roasted or decaffeinated; coffee husks and skins; coffee substitutes containing coffee in any proportion.- coffee roasted :-- decaffeinated
import duty (Sadc, tz + za) 15.00%
Vat (Sadc, tz + za) 20.00%
import duty (Sadc without za) 15.00%
Vat (Sadc without za 20.00%
Vat (Ke) 20.00%
Vat (ug) 20.00%
0901.90.00
coffee, whether or not roasted or decaffeinated; coffee husks and skins; coffee substitutes containing coffee in any proportion.- coffee roasted :-- other
import duty (Sadc, tz + za) 15.00%
Vat (Sadc, tz + za) 20.00%
import duty (Sadc without za) 15.00%
Vat (Sadc without za 20.00%
import duty (Ke) 2.00%
Vat (Ke) 20.00%
Vat (ug) 20.00%
import duty 25.00%
Vat Standard rate 25.00%
Source: www.tiscan.co.tz/TariffBook
40
]B
io
en
er
gy
a
nd
F
oo
d
Se
cu
ri
ty
[
T a b l e 4
Harmonized System Code for Sugar in Tanzania
Hs Code Hs Description Country of origin % Duty charged
1704.10.00Sugar confectionery (including white chocolate), not containing cocoa.- chewing gum, whether or not sugar-coated
import duty (Sadc, tz + za) 15.00%
Vat (Sadc, tz + za) 20.00%
import duty (Sadc without za) 15.00%
Vat (Sadc without za) 20.00%
Vat (Ke) 20.00%
Vat (ug) 20.00%
1704.90.00 Sugar confectionery (including white chocolate), not containing cocoa.- other
import duty (Sadc, tz + za) 0.00%
Vat (Sadc, tz + za) 20.00%
import duty (Sadc without za) 0.00%
Vat (Sadc without za 20.00%
Vat (Ke) 20.00%
Vat (ug) 20.00%
2940.00.00
Sugars, chemically pure, other than sucrose, lactose, maltose, glucose and fructose; sugar ethers, sugar acetals and sugar esters and their salts, other than products of heading 29.37, 29.38 or 29.39.
1. Amani, Haidari, Ndulu, B. and L. Msambichaka (1983): Agricultural Development of Tanzania: Policy Evolution, Performance and Evaluation. The first Two Decades of Independence. Published by Friedrich Ebert Foundation, Dar es Salaam.
2. Amani, Haidari et al (2003): Trade Policies and Agricultural Trade in the SADC Region: Challenges and Implications. Preliminary Report for Tanzania. ESRF, Dar es Salaam.
3. Baffes, John (2003): Tanzania`s Coffee Sector: Constraints and Challenges in a Global Environment. World Bank Africa Region Working Paper Series No..
4. Baffes, John (2002): Tanzania`s Cotton Sector: Constraints and Challenges in a Global Environment. World Bank Africa Region Working Paper Series No. 42, December 2002.
5. Coelho, S.T, (2005): Biofuels – Advantages and Trade Barriers. United Nations Conference on Trade and Development Publication.
6. DAI (2003): Rice Sub-Sector Study. Prepared by ECI, London.
7. DAEA (Department of Agricultural Economics and Agrarbusiness, Sokoine University) (1999): Analysis of the Comparative Economic Advantage of Alternative Agricultural Production Options in Tanzania. USAID, Technical Paper No. 102, September 1999.
8. East African Community (2005): A Guide for Maize Traders on Regulatory Requirements for Imports and Exports of Maize in EAST African Community. EAC, Arusha.
9. Economic Research Bureau (2001): Rural Agricultural Marketing Services in Tanzania. ERB, UDSM, Dar es Salaam.
10. Eskola, Elina (2005): Agricultural Marketing and Supply Chain Management in Tanzania: A Case Study. ESRF Working Paper Series, No. 16, Dar es Salaam.
11. ESRF (Economic and Social Research Foundation) (2004): Agricultural Marketing Policy (AMP): Sector Position Paper. Ministry of Cooperatives and Marketing, Dodoma.
12. Global Subsidies Initiative (2007): Biofuels: At What Cost? Government Support for Ethanol and Biodiesel in the European Union. Institute for Sustainable Development, Geneva.
43
13. Government of Tanzania (1984): The Cashewnut Marketing Board Act.
14. Government of Tanzania (1998): The Cashewnut Marketing Regulations.
15. Government of Tanzania (2001): The Coffee Industries Act.
16. Government of Tanzania (2003): The Coffee Industry Regulations.
17. Government of Tanzania (2005): Agricultural Marketing Policy.
18. GTZ (2005): Liquid Biofuels for Transportation in Tanzania. Study commissioned by the GTZ, August 2005.
20. Jumbe, Charles, Frederick Msiska & Lewis Mhango (2007): Report on National Policies on Biofuels Sector Development in Sub-Saharan Africa. FANPRAN.
21. Kaehkoenen, Satu and Howard Leathers (1999): Transaction Costs Analysis of Maize and Cotton Marketing in Zambia and Tanzania. SD Publication Series, Technical Paper 105, June 1999, University of Maryland.
22. Kherallah M et al (2002): Reforming Agricultural Markets in Africa, IFPRI, Washington.
23. Kilima, Fredy (2006): Are Price Changes in the World Market Transmitted to Markets in Less Developed Countries? A Case Study of Sugar, Cotton, Wheat, and Rice in Tanzania. IIIS Discussion Paper, No. 160, June 2006.
24. Laswai, Henry et al. (2006): Impovement and Popularization of Diversified Cassava Products for Income Generation and Food Security. A Case Study of Kibabu. In: AJFAND Online, Volume 6 No.1, Sokoine University, Morogoro.
25. Mashindano O. and Wanga G. (2006): Globalization and Market Opportunities for Smallholder Farmers in Tanzania, in Msambichaka L. A, Mwamba N. E and Mashindano O. J (eds), Globalization and Challenges for Development in Tanzania; Economic Research Bureau (ERB) and Dar-es-Salaam University Press (DUP), Dar-es-Salaam.
26. Mashindano, O. Mmasi, P and Nassoro H. (2007). Linking Production and Marketing, Using Sesame in Tanzania As a Model. A Draft Report. ESRF, Dar es Salaam.
44
]B
io
en
er
gy
a
nd
F
oo
d
Se
cu
ri
ty
[
27. Michigan State University (2008): Enhancing African Food Security through Improved Regional Marketing Systems for Food Staples. A policy Research Agenda For COMESA and Michigan State University. Available at: http://www.aec.msu.edu/fs2/outreach/comesa-msu_policy_research_agenda.pdf (27/2/2008).
28. Mitchell, Donald (2004): Tanzania’s Cashew Sector: Constraints and Challenges in a Global Environment. Africa Region Working Paper Series, No. 70, June 2004.
29. Ponte, Stefano (2001): Coffee Markets in East Africa: Local Responses to Global Challenges or Global Challenges to Local Responses? CDR Working Papers, No. 01.5, September 2001.
30. Regional Agricultural Trade Expansion Support Program (2003): Maize Market Assessment and Baseline Study for Tanzania. Nairobi. Kenya.
31. Rohrbach, D.D./J. A. B. Kiriwaggulu (2007): Commercialization Prospects for Sorghum and Pearl Millet in Tanzania. SAT eJournal, Issue 1, Volume 3, December 2007, ejournal.icrisat.org (31/1/2008).
32. Stevens, Christopher (2008): Biofuels and Development, will the EU help or hinder? ODI Briefing Paper 32, January 2008.
33. URT (United Republic of Tanzania) (2001): Agricultural Sector Development Strategy (ASDS). Ministry of Agriculture and Food Security (MAFS), Dar-es-Salaam.
34. URT (United Republic of Tanzania) (2005): Agricultural Marketing Policy (AMP) – Draft. Ministry of Cooperatives and Marketing, Dodoma.
35. WTO (World Trade Organization) (2007): Trade Policy Analysis Tanzania.
45
Survey 3:
Agricultural Trade PoliciesThailandAuthor: Dr. Ruangrai Tokrisna, Department of Agricultural
and Resource Economics, Faculty of Economics,
Kasetsart University, Bangkok, Thailand
0
47
1.1 RICE Tariff rates
Rice (HS 1006) can be grouped into to 4 main categories: rice in husk or paddy (HS 100610), husked or brown rice (HS 100620), semi-milled or wholly milled rice (HS100630), and broken rice (HS100640). Specific duty of Baht2.75 /kg is applied for these four categories in general.
For WTO (World Trade Organization) members, Cambodia and Laos ad valorem duty of 30% is applied for the import in quota while off-quota ad valorem duty rate is 52%.
For AFTA (ASEAN Free Trade Area) members, under CEPT (Common Effective Preferential Tariff) scheme, specific duty rate is Baht2.75/kg while the ad valorem duty rate is 5%.
Import duty is exempted for imports from Australia and New Zealand under FTAs. Ad valorem duty of 27.27% is applied for imports from Japan according to JTEPA (Japan Thai Economic Partnership Agreement).
Non-tariff measures There are two non-tariff measures applied for rice import, quota and licensing. These
non-tariff measures are applied for all four categories of rice.
n Import quota. To apply for the import quota, the importer must be a juristic person. This quota, subjected to lower import duty, is limited only for import from WTO members and Laos. In 2007 the import quota was 249,757 ton for ad valorem duty of 30% while it is 52% for off-quota import.
n Import licensing. In principle, rice import from non-WTO member countries is not allowed. For WTO members, including Laos, import licensing is required. Nevertheless there is no restriction on import quantity but that off-quota has to pay higher import duty (52% as compared to 30% in-quota rate).
1.2 SUGAR Tariff rates
Included in this commodity are cane or beet sugar and chemically pure sucrose in solid form (HS 1701) and molasses resulting from the extraction or refining of sugar (HS 1703). Sugar (HS 1701) consists of cane sugar (HS 170111), beet sugar (HS 170112), coloring matter
C H A P T E R 1 LIST OF TRADE POLICIES ON SELECTED COMMODITIES
48
]B
io
en
er
gy
a
nd
F
oo
d
Se
cu
ri
ty
[
(HS 170191), and other (HS 170199). Molasses consist of cane molasses containing added flavoring or coloring matter (HS 1703101) and other (HS 1701109) and other molasses containing added flavoring or coloring matter (HS 1703901) and other (HS 1701909).
For cane sugar (HS 170111), beet sugar (HS 170112), coloring matter (HS 170191), and other (HS 170199) specific duty in general is Baht3.50/kg. For WTO members, Cambodia and Laos; there is ad valorem duty 65% under import quota and 94% for off-quota. For AFTA specific duty is Baht3.50/kg while ad valorem duty is 5%. For Australia the ad valorem duty is 52% according the bi-lateral trade agreement. Import duty is exempted for Japan and New Zealand under FTAs.
For cane molasses containing added flavoring or coloring matter (HS 17031010) and other (HS 17011090) and other molasses (HS 17019090) specific duty in general is Baht0.08/kg while for WTO members, Cambodia and Laos there is 30% ad valorem duty. Import duty is exempted for imports from AFTA. Import from China is subjected to 12% ad valorem duty according to ASEAN – China FTA, as well as imports from Australia and New Zealand under bi-lateral FTAs. Import from Japan is subjected to 26.67% ad valorem duty under JTEPA. Import duty is exempted for import from Myanmar through Mae Sai and Chiang Dao Custom Houses.
There is ad valorem duty of 65% in general for other molasses containing added flavoring or coloring matter (HS 1703901). For WTO members, Cambodia and Laos there is 40% ad valorem duty and exemption for AFTA. Imports from Australia and New Zealand are subjected to 12% ad valorem duty under FTAs. Import from Japan is subjected to 36.36% ad valorem duty under JTEPA.
Non-tariff measures
n Import quota. For sugar (HS 1701) there is import quota in getting lower duty rate ( 65% compared to 94% off-quota). The quota is for sugar with origin from WTO members and Laos only. Import quota application must be submitted to Department of Foreign Trade. Importers are processing plants in demand of sugar for raw materials, they must submit a copy of letter to certify their being juristic persons and Form 4 for industrial plants. For importers who are cooperatives/ farmer groups/ or associations, a copy of registration of the establishment, regulations, and minutes on committee election must be submitted.
1.3 MAIZE Tariff rates
Maize (HS 1005) consists of seed (HS 100510) and others (HS 100590) for human consumption/ animal feed/ other.
For maize in general there is specific duty of Baht2.75/ kg. For WTO members there is ad valorem duty of 20% for maize in import quota and 73% for off-quota.
49
LiSt oF trade PoLicieS on SeLected coMModitieS
For maize seed (HS 100510) import duty is exempted for imports from AFTA, Cambodia, Laos, Japan, Australia, and New Zealand. For Myanmar there is 5% ad valorem duty. For China there is Baht1.38/kg specific duty.
For feed maize (HS 100590) import duty is 16% for import from Australia. For import from AFTA there is 5% ad valorem duty and Baht2.75/kg specific duty. Import from ACMECS (Ayeyawady-Chao Phraya-Mekhong Economic Cooperation Strategy) including Cambodia, Laos, and Myanmar the import duty is exempted, providing that the certification on origin is submitted at the Custom. Import duty is also exempted for Japan New Zealand,
Non-tariff measures Non-tariff measures for maize are found for feed maize. They are import quota for
lower duty rate, licensing, and surcharge.
n Import quota. Import quota in imposed on feed maize (HS 100590). Public Warehouse Organization (PWO), Ministry of Commerce is the sole importer. In-quota import is subject to an ad valorem duty of 20%. Off-quota duty is 73%. The import in quota must be from WTO members and Laos. Off-quota imports from non-WTO members and Laos are subject to specific duty of Baht2.75/kg plus an extra charge 10.22% of the import duty. Off-quota import from Australia is subject to 65.70% duty according to FTA Thai-Australia. In quota import must be during 1 March – 30 June, time range can be adjusted annually.
n Import licensing. The license is required for specific agreement. Imports from ACMECS (including Cambodia, Laos and Myanmar) must submit origin certification (Form AISP) to the Custom to be eligible for the duty exemption. Imports from AFTA are not subject to import quota volume and time range and they are subject to 5% duty, surcharge is exempted; but they must submit origin certification (Form D) to the Custom.
n Surcharges. Off quota imports from non-WTO members, except Laos, are subjected to surcharge (varies annually depending on domestic demand and supply).
1.4 CASSAVA Tariff rates
Cassava (HS 071410) can be imported as roots, pellet and others. All are subjected to 60% ad valorem duty in general. Nevertheless for frozen, the rate is discounted to 30%. For WTO members the duty is lower to 40%. Import duty is exempted for AFTA, China, Australia, and New Zealand according to FTAs as well as import from Myanmar through Mae sai and Chiang Dao Custom Houses. For import fro Japan there is 30% ad valorem duty under JTEPA.
Non-tariff measures There is not any non-tariff measure for cassava. The emphasis is more on quality
control for export, especially to European Union.
50
]B
io
en
er
gy
a
nd
F
oo
d
Se
cu
ri
ty
[
1.5 COCONUT Tariff rates
Relevant commodities in this group are coconuts (HS0801) and coconut oil and its fraction (HS 1513). Coconuts include desiccated (HS 080111), other (HS 080119), in shell (HS 080121), and shelled (HS 080122). Coconut oil and its fractions include crude oil (HS 151311).
For all coconuts in general there is a 60% ad valorem duty. For desiccated (HS 080111) and other (HS 080119) coconuts imported from WTO
members, Cambodia and Laos are subjected to 20% ad valorem duty for those in-quota and increase to 54% for off-quota. Import duty is exempted for AFTA, China, Japan, Australia, and New Zealand under FTAs and also Myanmar imported through Mae Sai and Chiang Dao Customs Houses in the North under AISP – ACMECS.
Beside 60% ad valorem duty, in shelled (HS 080121) and shelled (HS 080122) coconuts are also subjected to specific duty of 50 Baht/kg. For WTO members and Laos, ad valorem duty is lower to 40% while specific duty is Baht33.50/kg. Import duty is exempted for AFTA, China, Japan, Australia and New Zealand under FTAs and also Myanmar imported through Mae Sai and Chiang Dao Customs Houses in the North under AISP – ACMECS.
For crude coconut oil (HS 151311), in general there is Baht2.5/litre specific duty. Those in-quota imports from WTO members and Laos are subjected to 20% ad valorem duty and increases to 52% for off-quota. For AFTA there is 5% ad valorem duty while specific duty is Baht2.50/litre. Import duty is exempted for imports from Japan, Australia, New Zealand, under FTAs.
Non-tariff measures
n Import quota. Import quota (about 110 ton for HS 08011100 and 2,317 ton for HS 08011900) is applied for a lower import duty 20%.
n Import licensing. Importers must be processors who imported for raw material and be juristic persons. The license is approved by Minister of Commerce.
1.6 OIL PALM Tariff rates
Import duty is imposed on palm oil and its fraction whether or not refined but not chemically modified (HS 1511) which is divided in to crude oil (HS 151110) and other (HS 151190).
In general specific duty Baht2.50/litre is imposed on palm oil both f HS 151110 and HS 151190. For imports from WTO members, Cambodia and Laos ad valorem duty of 20% is applied for in-quota import and 143% for off-quota. For imports from AFTA there is 5% ad valorem duty and Baht2.50/litre specific duty. For import from Japan, under JTEPA there is 18.18% ad valorem duty. Under FTAs import duty is exempted for imports from Australia and New Zealand.
Non-tariff measures
n Import quota. Import quota for about 4,840 ton, adjusted annually is given for 20%
51
LiSt oF trade PoLicieS on SeLected coMModitieS
ad valorem duty, for WTO members, Cambodia and Laos only. Public Warehouse Organization is the sole importer.
n Import licensing. For countries other than WTO members, Cambodia and Laos, import licensing is required. It has to be applied with Ministry of Commerce and approved by the Cabinet.
1.7 BEANS Tariff rates
n Beans (Vigna spp. and Phaseolus spp.) (HS 07082000). In general there is 60% ad valorem duty and reduced to 40% for imports from WTO members and 12% from Australia. Import duty is exempted for imports from AFTA, Myanmar, China and Japan.
n Groundnuts for sowing (HS 12021000). In general there is 35% ad valorem duty which is reduced to 30% for WTO members and 12% for Australia, 20.44% for Japan,6% for New Zealand, and 5% for Laos. Import duty is exempted for imports from AFTA.
n Edible and other groundnuts (HS 12021090). In general there is 35% ad valorem duty which is reduced to 30% for WTO members, 26.67% for Japan, 12% for Australia and New Zealand, and 5% for AFTA.
n Crude groundnut oil (HS 15081000). In general there is Baht2.50/litre specific duty. For imports from WTO members, there is 37% ad valorem duty. For AFTA, there is 5% ad valorem or Baht2.50/litre specific duty. For import from China, there is Baht0.66/litre specific duty. Import duty is exempted for Japan, Australia, and New Zealand.
n Groundnut oil cake (HS 23050000). In general there is 10% ad valorem duty and reduced to 9% for WTO members, 6% for Australia and New Zealand, 5% for China. Import duty is exempted for AFTA and Japan.
n Cocoa bean whole or broken, raw or roasted (HS 18010000). In general there is 30% ad valorem duty and reduced to 27% for WTO members, and 12% for China. Import duty is exempted for AFTA, Japan, Australia, and New Zealand.
Non-tariff measures There is not any non-tariff measure for beans.
1.8 WHEAT Tariff rates
Included in this item are durum wheat (HS 100110), other wheat and meslin (HS 100190), wheat and meslin flour (HS 110100), and wheat gluten whether or not dried (HS 110900).
52
]B
io
en
er
gy
a
nd
F
oo
d
Se
cu
ri
ty
[
Specific import duty Baht2.75/kg is imposed on durum wheat (HS 100110)and other wheat and meslin (HS 100190). For WTO members there is 27% ad valorem duty. For import from AFTA, Myanmar through Mae Sai and Chiang Dao Custom Houses, Australia, and New Zealand; import duty is exempted. Import from China is subjected to Baht0.50/kg specific duty while it is Baht0.09 for Japan.
For wheat and meslin flour (HS 110100), in general there are 40% ad valorem duty or Baht2.75/kg specific duty. For WTO members, the rates are reduced to 30% and Baht2.06/kg accordingly. For AFTA there is 5% specific duty. Import from China is subjected to 40% ad valorem while specific duty is Baht2.75/kg. Ad valorem duty is 20% for Japan; 12% for Australia and New Zealand. Import duty is exempted for import from Myanmar through Mae Sai and Chiang Dao Custom Houses.
For wheat gluten whether or not dried (HS 110900), in general there are 40% ad valorem duty or Baht2.75/kg specific duty. For WTO members, the rates are reduced to 30% and Baht2.06/kg accordingly. For AFTA there is 5% specific duty. Import from China is subjected to 12% ad valorem while specific duty is Baht0.82/kg. Ad valorem duty is 4.17% for Japan; 3% for New Zealand. Import duty is exempted for import from Australia.
Non-tariff measures There is not any non-tariff measure on wheat.
1.9 SOYBEAN Tariff rates
Included in this item are soybean whether or not broken (HS 1201) which can be categorized into those for sowing (HS 12010010) and other soybean (HS 12010090), crude soybean oil (HS 15071000), soybean oil and its fraction whether or not refined but not chemically modified (HS 15079000) Also included in this item is soybean cake (HS 23040000).
For sowing soybean (HS 12010010), there is 35% ad valorem duty in general which is exempted for in-quota imports from WTO members and AFTA while those off-quotas from these countries are subjected to 80% ad valorem duty. Import duty is exempted for in-quota imports from Myanmar, Cambodia, and Laos. Import duty is exempted for Japan, Australia, and New Zealand.
For other soybean (HS 12010090), there is 60% ad valorem duty in general which is exempted for in-quota imports from WTO members while those off-quotas are subjected to 80% ad valorem duty. Import from AFTA is subjected to 5% ad valorem duty. Import duty is exempted for imports from Myanmar, Cambodia, Laos, Japan, Australia, and New Zealand.
53
LiSt oF trade PoLicieS on SeLected coMModitieS
For crude soybean oil (HS 15071000) and soybean oil and its fraction whether or not refined but not chemically modified (HS 15079000), there is Baht2.5/litre specific duty in general. For imports from WTO members as well as Cambodia and Laos, there are 20% ad valorem duty for those in-quota and 146% for off-quota. For AFTA there is 5% ad valorem duty while specific duty is Baht2.50/litre. Import duty is exempted for imports from Japan, Australia, and New Zealand.
For soybean cake (HS 23040000), there is Baht2.50/kg specific duty in general. For imports from WTO members as well as Cambodia and Laos, there are 20% ad valorem duty for those in-quota and 119% for off-quota. For AFTA there is 5% ad valorem duty. Import duty is exempted for imports from Japan, Australia, and New Zealand.
Non-tariff measures
n Import quota For soybean (HS 12010010 and HS 12010090) import duty is exempted for in-quota
import and is 80% for off-quota import from WTO members including Lao. Quota varies annually.
For soybean oil (HS 15071000 and HS 15079000) import duty is 20% for in-quota import and is 146% for off-quota import from WTO members including Lao. Food Processing Association is the importer. Quota varies annually.
For soybean cake (HS 23040000) import duty is 4% for in-quota import and is 119% for off-quota import from WTO members including Lao. Quota varies annually.
n Import Licensing For soybean (HS 12010010 and HS 12010090) imports from non - WTO member
countries must be approved by the Minister of Commerce. The approval depends on domestic demand and supply. For soybean seed upon approval from Department of Agriculture, import duty can be exempted.
For soybean oil (HS 15071000 and HS 15079000) imports from non - WTO member countries must be approved by the Minister of Commerce. The approval depends on domestic demand and supply.
For soybean cake (HS 23040000) imports from AFTA must submit origin certificate (Form D) for the import duty 5%
n Surcharge For soybean cake (HS 23040000), surcharge as determined by Ministry of Commerce
must be paid (about Baht2,519/ton).
rer e_anserarerarearrile7erarearearartardireSaCrear e -et* ee-Tifttife:
etaior Seal
54
A N N E X 1]B
io
en
er
gy
a
nd
F
oo
d
Se
cu
ri
ty
[
T a b l e 1
Tariff rates on selected agricultural commodities
HS code Description
Gen
eral
WTO
AFT
A
Mya
nmar
Cam
bodi
a
Laos
Chin
a
Japa
n
Aus
tral
ia
New
Ze
alan
d
100610rice in Husk or paddy
฿2.75/kg30%* 52%
฿2.75/kg 5%
30%* 52%
30%* 52%
27.27% 0 0
100620Husked or brown rice
฿2.75/kg30%* 52%
฿2.75/kg 5%
30%* 52%
30%* 52%
27.27% 0 0
100630Semi-milled or wholly milled rice
฿2.75/kg30%* 52%
฿2.75/kg 5%
30%* 52%
30%* 52%
27.27% 0 0
100640 Broken rice ฿2.75/kg30%* 52%
฿2.75/kg 5%
30%* 52%
30%* 52%
27.27% 0 0
170111 cane sugar ฿3.50/kg65%* 94%
฿3.50/kg 5%
65%* 94%
65%* 94%
0 52% 0
170112 Beet sugar ฿3.50/kg65%* 94%
฿3.50/kg 5%
65%* 94%
65%* 94%
0 52% 0
170191 coloring matter ฿3.50/kg65%* 94%
฿3.50/kg 5%
65%* 94%
65%* 94%
0 52% 0
170199
other cane or beet sugar and chemically pure sucrose in solid form
For Wto members, cambodia and Laos to get lower duty rate. PWo is the importer.
countries other than Wto members, cambodia and Laos must apply for license from ministry of commerce to be approved by the cabinet
151190 other palm oil
For Wto members, cambodia and Laos to get lower duty rate. PWo is the importer.
countries other than Wto members, cambodia and Laos must apply for license from ministry of commerce to be approved by the cabinet
07082000Beans (Vigna supp and Phaseolus spp.)
For Wto members and Laos to get lower duty rate
12021000 groundnuts for sowingimporter must be juristic processor and submit Form 4 or record of establishment
12021090edible and other groundnuts
For Wto members and Laos to get lower duty rate
15081000 crude groundnut oilimporter must be juristic processor and submit Form 4 or record of establishment
23050000 groundnut oil cakeFor Wto members and Laos to get lower duty rate
100110 durum wheat
100190 other wheat and meslin
110100 Wheat and meslin flour
12010010 Sowing soybean For Wto members and Laos to get lower duty rate
For non-Wto members except Laos. to be approved by Minister of commerce
12010090 other soybean For Wto members and Laos to get lower duty rate
For non-Wto members except Laos. to be approved by Minister of commerce and department of agricultrue for soybean seed
15071000 crude soybean oil
For Wto members and Laos to get lower duty rate. eligible for Food Processing association in thailand
For non-Wto members. to be approved by Minister of commerce
1579000 Soybean oil and its fraction
For Wto members and Laos to get lower duty rate. eligible for Food Processing association in thailand
For non-Wto members. to be approved by Minister of commerce
23040000 Soybean cakeFor Wto members and Laos to get lower duty rate
aFta must submit origin certificate. (Form d)
as determined by Ministry of commerce
Source: Department of Foreign, Ministry of Commerce
rer e_anserarerarearrile7erarearearartardireSaCrear e -et* ee-Tifttife:
etaior Seal
58
A N N E X]B
io
en
er
gy
a
nd
F
oo
d
Se
cu
ri
ty
[
2 LIST OF STUDIES ON EFFECTS OF AGRICULTURAL TRADE POLICIES ON POVERTY AND FOOD SECURITY IN THE CONTEXT OF THAILAND
1. The 1991 Thailand revival plan for agriculture : Project outcomes and farmers’perceptions in Southern Thailand
By Somchai Visatapong and Kriengsak Pattamarakha. Kasetsart Journal (Social-Science) 18 : 195-205 (1997)
2. Effects of Trade Liberalization on Agriculture in Thailand: Commodity Aspects By Kajonwan Itharattana. Working Paper Series, November 1999 http://www.uncapsa.org/Publication/wp49.pdf
3 Effects of Trade Liberalization on Agriculture in Thailand: Institutional and Structural Aspects By Kajonwan Itharattana. Working Paper Series, January 1999. http://ageconsearch.umn.edu/items-by-author?author=Itharattana%2C+++Kajonwan
4. Dynamics of Income Inequality in Thailand : Evidence from Household Pseeudo-Panel Data By Hippolyte Fofack (AFTM3) and Albert Zeufack (DECRG). December 1999
5. Poverty incidence and economic growth in Southeast Asia By Peter G. Warr. Journal of Asian Economics 11 (2000) 431–44
6. A Study of Income Inequality and Poverty Incidence of Agricultural Households in Northern Thailand, 1998/99 Crop Year
By Nalinee Varana Graduate School, Kasetsart University. 2001
7. Hybrid rice technology for food security in the tropics: can the chinese miracle be replicated in the southeast asia?
By Aldas Janaiah, M. Hossain, C. B. Casiwan and T. T. Ut. Paper Presented at the International Symposium Sustaining Food Security and Managing Natural Resources in Southeast Asia -- Challenges for the 21st Century; January 8-11, 2002, Chiang Mai, Thailand. 2002.
8. Globalization of Thailand: Economic Impacts and Restucturing for Sustainability By Chalongphob Susungkornkarn, Somchai Jitsuchon and Yos Wacharakupt,
Year-end Seminar B.E. 2545 Thailand Development and Research Institute (In Thai) 9. Domestic Supply and Consumption Patterns of Coarse Grains, Pulses, Roots and Tuber
Crops in Asia and the Pacific By Bourgeois, Robin and Balerin, Yannick. CAPSA. Monograph Number 45. 2003.
10. Sustainable formula sought for rural energy development in Asia. Refocus, Volume 4, Issue 4, July 2003, Page 14
11. The impact of research led agricultural productivity growth on Poverty reduction in africa, asia and latin america
By Colin Thirtle, Lin Lin and Jenifer Piesse Contributed paper for the 25th conference of the International Association of Agricultural Economists Durban, August 2003.
12. An operational method for assessing the poverty outreach performance of development projects: results from four case studies in africa, asia and latin america
By Manfred Zeller, Manohar Sharma, Carla Henry and Cécile Lapenu. International Association of Agricultural Economists 2003 Annual Meeting, August 16-22, 2003, Durban, South Africa.
13. The growth–equity trade-off in modern economic development: the case of Thailand. By Medhi Krongkaew and Nanak Kakwani. Journal of Asian Economics, Volume 14,
Issue 5, October 2003, Pages 735-757.
14. Final Report on Factor Analyis of Rural Poverty and development Problems B.E. 2544 By Office of Community Economic Development and Income Distribution, Natioanal
Economic and Social Development Board, CAD-PAM, October B.E.2546 (In Thai)
15. Poverty, Economic security and the Role of the Thai Government By Somchai Jitsuchon and Jaraporn Plangpraphan in TDRI Quarter Review, Vol.18
No.4, December 2003, Pages20-27.
16. Sustainable biomass production for energy in Thailand By Boonrod Sajjakulnukit and Prasert Verapong. Biomass and Bioenergy 25 (2003)
557 – 570.
17. NESDB Moved Poverty Line to 1,163 Baht, the Number of the Poor up to 8.8 Million By Development Evaluation and Communication Office. National Economic and
Social Development Board. Volume 21 Number 9. September 2004.
18. Impact of Growth on Income Inequality and Poverty in Rural Households of Thailand By Tigist Redda Shiferaw. Graduate School, Kasetsart University. 2004
19. Prospects of Feed Crops in Southeast Asia: Alternatives to Alleviate Poverty Through Secondary Crops’ Development
By Erna M. Lokollo and Budiman Hutabarat. Proceedings of the Regional Workshop Held in Bogor, Indonesia, September 14-15, 2004. United Nations Centre for Alleviation of Poverty Through Secondary Crops’ Development in Asia and the Pacific (CAPSA).CAPSA Monograph Number 47. 2005.
20. Diminishing and negative welfare returns of economic growth: an index of sustainable economic welfare (ISEW) for Thailand
By Matthew Clarkea and Sardar M.N. Islamb. Ecological Economics 54 (2005) 81– 93.
21. Poverty in Thailand. By Knowledge Management and Poverty Reduction Policy Unit. Community
Economic Development and Income Distribution Office. Office of the National Economic and Social Development Board. 2005
22. Thailand Poverty Profile & Poverty Reduction Strategies By Office of Community Economic Development and Income Distribution,. National
Economic and Social Development Board., Presentation, March 2005
23. Service Delivery Aspects of Poverty Reduction Policies in Thailand By Dararat Anantanasuwong and Suchittra Chammivickorn, , Center of Poverty
Studies, School of Development Economics, National Institute of development Administration, A Report submitted to Office of the Public Sector development Commission, January 2006
24. Enhancing Sustainable Development of Diverse Agriculture in Thailand By Nareenat Roonnaphai. Economic and Social Commission for Asia and the Pacific.
CAPSA Working Paper No.90, 2006.
25. Poverty Alleviation Initiatives: Thailand Experiences By Office of the National Economic and Social Development Board. Seminar and
Study Visit Program on Rural Poverty Alleviation3 -14 July 2006, Thailand
26. Pathways out of Poverty through Cassava, Maize and Soybean in Thailand By Nareenat Roonnaphai. United Nations Centre for Alleviation of Poverty Through
Secondary Crops’ Development in Asia and the Pacific (CAPSA). CAPSA Working Paper No. 93, 2006.
1. Africover: specifications for geometry and cartography, summary report of the workshop on Africover, 76 pages, 2000 (E)
2. terrestrial c arbon Observation: the Ottawa assessment of requirements, status and next steps, by J.cihlar, A.s. denning and J. GOsz, 108 pages, 2002 (E)
3. terrestrial carbon Observation: the rio de Janeiro recommendations for terrestrial and atmospheric measurements, by .cihlar, A.s. denning, 108 pages 2002 (E)
4. Organic agriculture: Environment and food security, by nadia El-Hage scialabba and caroline Hattam, 258 pages, 2002 (E and s)
5. terrestrial carbon Observation: the Frascati report on in situ carbon data and information, by J.cihlar, m.Heimann and r.Olson, 136 pages, 2002 (E)
6. the clean development mechanism: implications for energy and sustainable agriculture and rural development projects, 2003 (E)*: Out of print/not available
7. the application of a spatial regression model to the analysis and mapping of poverty, by Alessandra Petrucci, nicola salvati, chiara seghieri, 64 pages, 2003 (E)
8. land cover classification system (lccs) + cd-rOm, version 2, Geo-spatial data and information, by Antonio di Gregorio and louisa J.m.Jansen, 208 pages, 2005 (E)
9. coastal GtOs. strategic design and phase 1 implementation plan, Global Environmental change, by christian, r.r “et al”, 2005 (E)
10. Frost Protection: fundamentals, practice and economics- volume i and ii + cd, Assessment and monitoring, by richard l snyder, J.Paulo de melo-Abreu, scott matulich, 72 pages, 2005 (E), 2009 (s)
11. mapping biophysical factors that influence agricultural production and rural vulnerability, Geo-spatial data and information, by Harri van velthuizen “et al”, ~90 pages 2006 (E)
12. rapid Agriculture disaster Assessment routine (rAdAr) 2008 (E)13. disaster risk management systems analysis: A guide book, 2008 (E and s) 14. community Based Adaptation in Action: A case study from Bangladesh, 2008 (E)15. coping with a changing climate: considerations for adaptation and mitigation in
1. inventory and monitoring of shrimp farms in sri lanka by Ers sAr data, by carlo travaglia, James mcdaid Kapetsky, Giuliana Profeti, 34 pages, 1999 (E)
2. solar photovoltaics for sustainable agriculture and rural development, by Bart van campen, daniele Guidi, Gustavo Best, 76 pages, 2000 (E)
3. Energia solar fotovoltaica para la agricultura y el desarrollo rural sostenibles, by Bart van campen, daniele Guidi, Gustavo Best, 92 pages, 2000 (s)
4. the energy and agriculture nexus, 99 pages, 2000 (E)5. World wide agroclimatic database, FAOclim cd-rOm v. 2.01, 2001 (E)6. Preparation of a land cover database of Bulgaria through remote sensing and Gis,
by carlo travaglia “et al”, 57 pages, 2001 (E)7. Gis and spatial analysis for poverty and food insecurity, by daniel Z.sui “et al”, 60
pages, 2002 (E)8. Environmental monitoring and natural resources management for food security
and sustainable development, cd-rOm, 2002 (E)9. local climate estimator, locclim 1.0 cd-rOm, 2002 (E)10. toward a Gis-based analysis of mountain environments and populations, by
Barbara Hyddleston”et al”, 32 pages, 2003 (E)11. tErrAstAt: Global land resources Gis models and databases for poverty and food
insecurity mapping, cd-rOm, 2003 (E)12. FAO & climate change, cd-rOm, 2003 (E)13. Groundwater search by remote sensing, a methodological approach, by carlo
travaglia, niccoló dainelli, 41 pages, 2003 (E)14. Geo-information for agriculture development. A selection of applications, by
robert A.ryerson “et al”, 120 pages, 2003 (E)15. Guidelines for establishing audits of agricultural-environmental hotspots, by
michael H.Glantz, 28 pages, 2003 (E)16. integrated natural resources management to enhance food security. the case for
community-based approaches in Ethiopia, by Alemneh dejene, 56 pages2003 (E)17. towards sustainable agriculture and rural development in the Ethiopian highlands.
Proceedings of the technical workshop on improving the natural resources base of rural well-being, by Alemneh dejene “et al”, 56 pages, 2004 (E)
18. the scope of organic agriculture, sustainable forest management and ecoforestry in protected area management, by nadia El-Hage scialabba, douglas Williamson, 56 pages, 2004 (E)
19. An inventory and comparison of globally consistent geospatial databases and libraries, Geo-spatial data and information, by Joseph F.dooley Jr, 200 pages, 2005 (E)
20. new locclim, local climate Estimator cd-rOm, 2005 (E)21. Agromet shell: a toolbox for agrometeorological crop monitoring and forecasting
cd-rOm (E)**22. Agriculture atlas of the union of myanmar (agriculture year 2001-2002), by Aidan
Gulliver and John latham, 124 pages, 2005 (E)23. Better understanding livelihood strategies and poverty through the mapping of
livelihood assets: a pilot study in Kenya, Geo-spatial data and information, by Patti Kristjanson “et al”, 52 pages, 2005 (E)
24. mapping global urban and rural population distributions, Geo-spatial data and information, by mirella salvatore “et al”, 88 pages, 2005 (E)
64
]B
io
en
er
gy
a
nd
F
oo
d
Se
cu
ri
ty
[
25. A geospatial framework for the analysis of poverty and environment links, Geo-spatial data and information, by Barbara Huddleston “et al”, 56 pages, 2006 (E)
26. Food insecurity, Poverty and Environment Global Gis database (FGGd) and digital Atlas for the Year 2000, Geo-spatial data and information, by Ergin Ataman “et al”, ~80 pages, 2006 (E)
27. Wood-energy supply/demand scenarios in the context of the poverty mapping, Geo-spatial data and information, by rudi drigo, 118 pages, 2006 (E)
28. Policies, institutions and markets shaping Biofuel Expansion: the case of ethanol and biodiesel in Brazil, (E)
29. Geoinformation in socio-Economic development determination of Fundamental datasets for Africa, (E) and (F)
30. Assessment of energy and greenhouse gas inventories of sweet sorghum for first and second generation bioethanol, (E)
31. small scale Bioenergy initiatives, Brief description and preliminary lessons on livelihood impacts from case studies in Asia, latin America and Africa, (E)
32. review of Evidence on dryland Pastoral systems and climate change: implications and opportunities for mitigation and adaptation, (E)
33. Algae Based Biofeuls: A review of challenges and Opportunities for developing countries, (E)
34. carbon Finance Possibilities for Agriculture, Forestry and Other land use Projects in a smallholder context (E)
35. Bioenergy and Food security: the BEFs Analysis for tanzania (E)36. technical compendium: description of Agricultural trade Policies in Peru, tanzania
and thailand (E)37. Household level impacts of increasing food prices in cambodia (E)


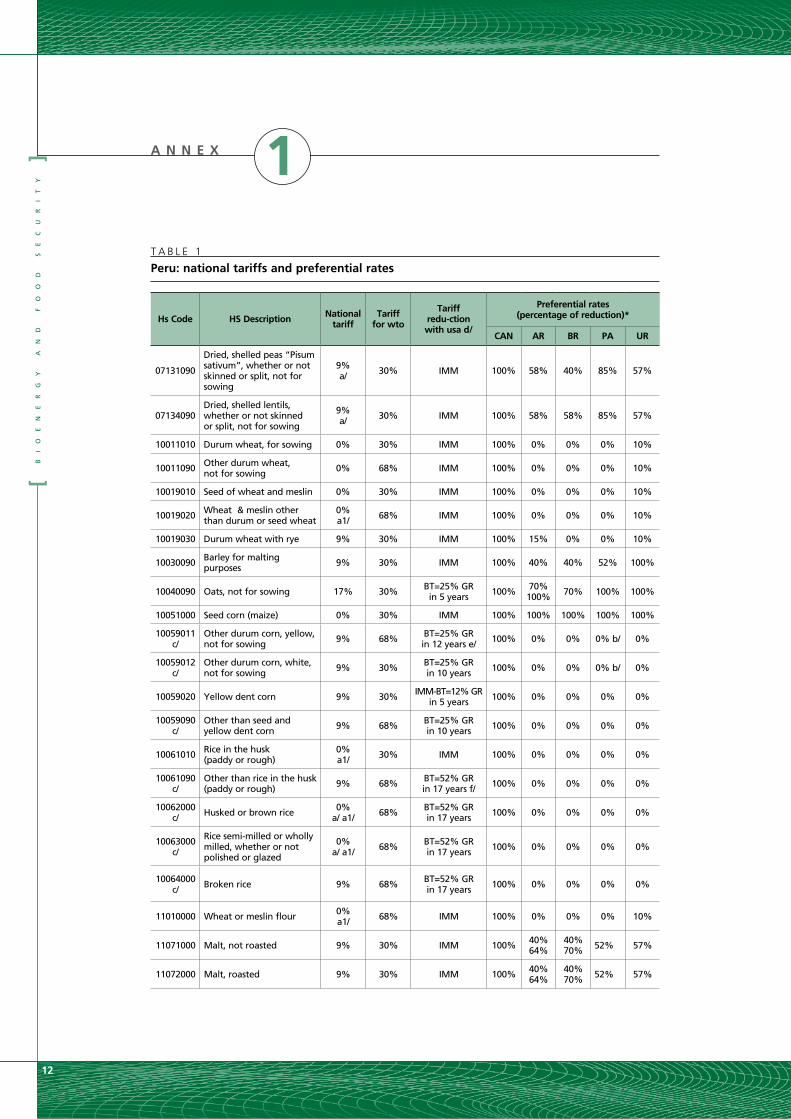


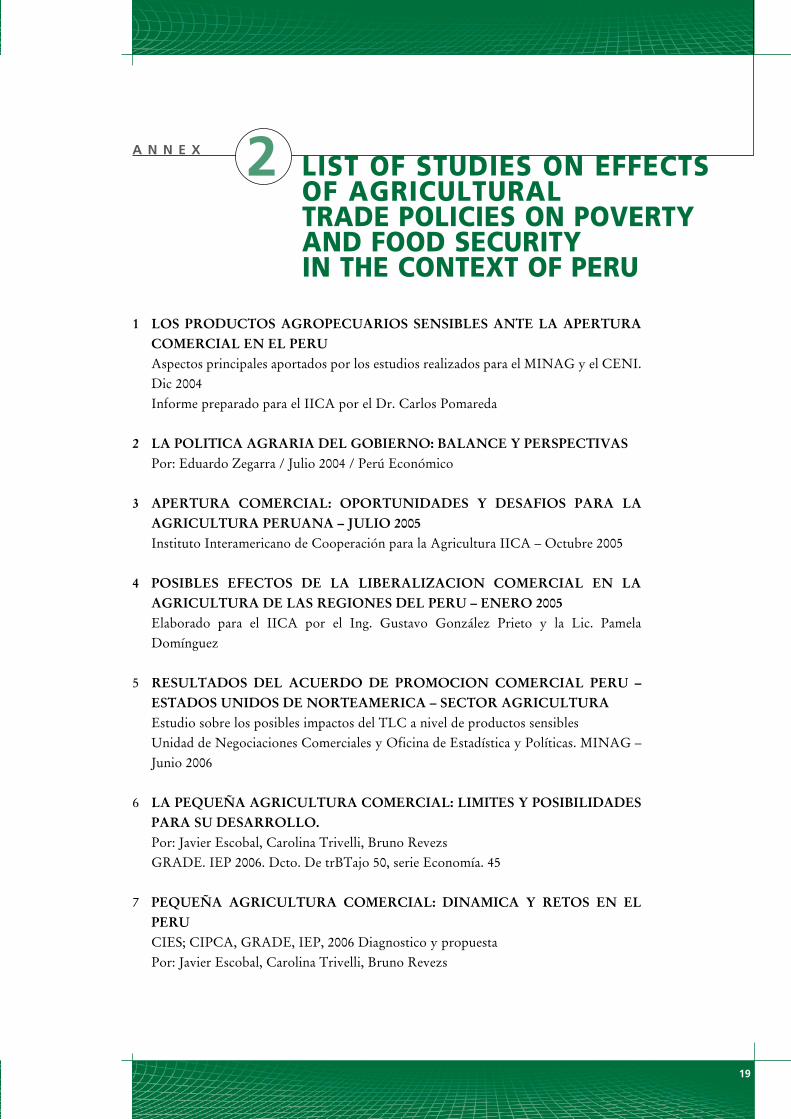


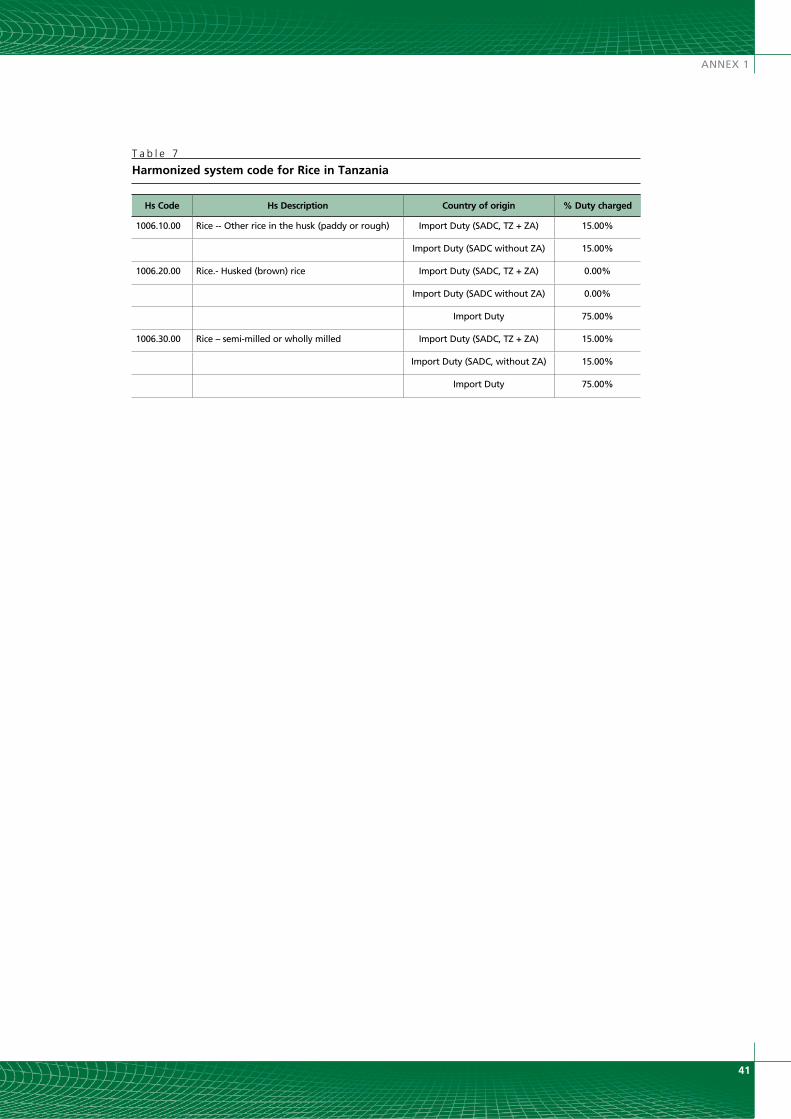


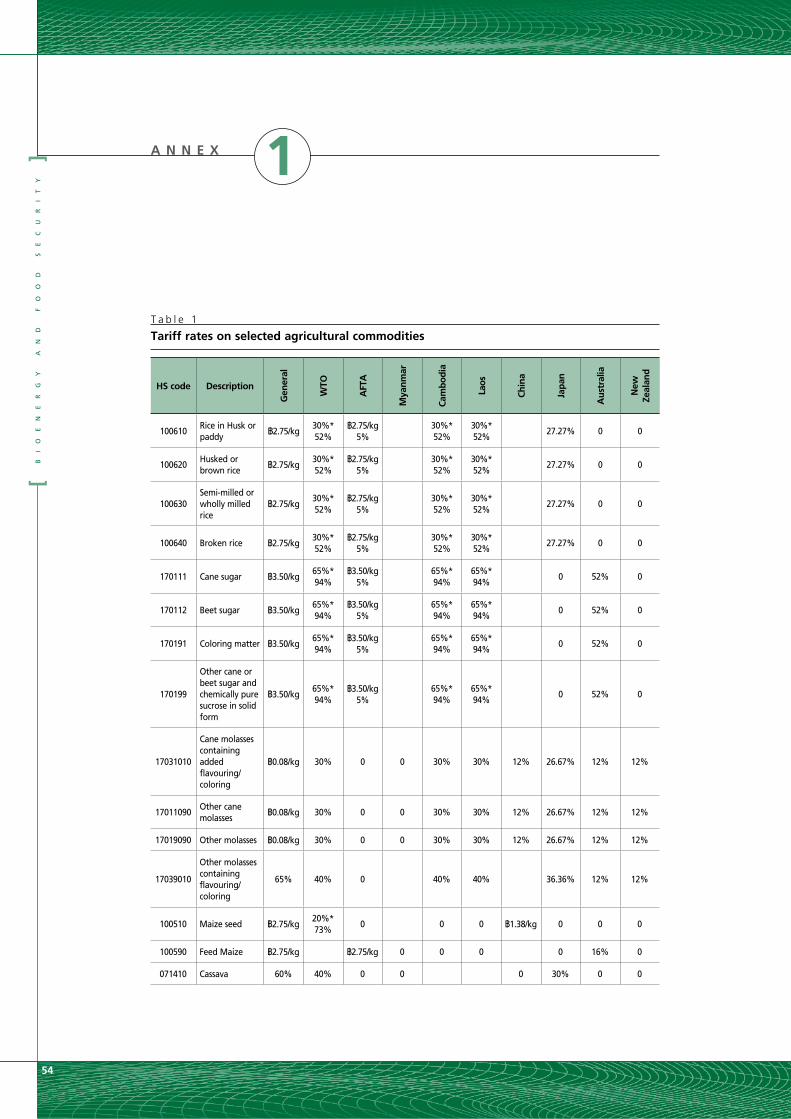

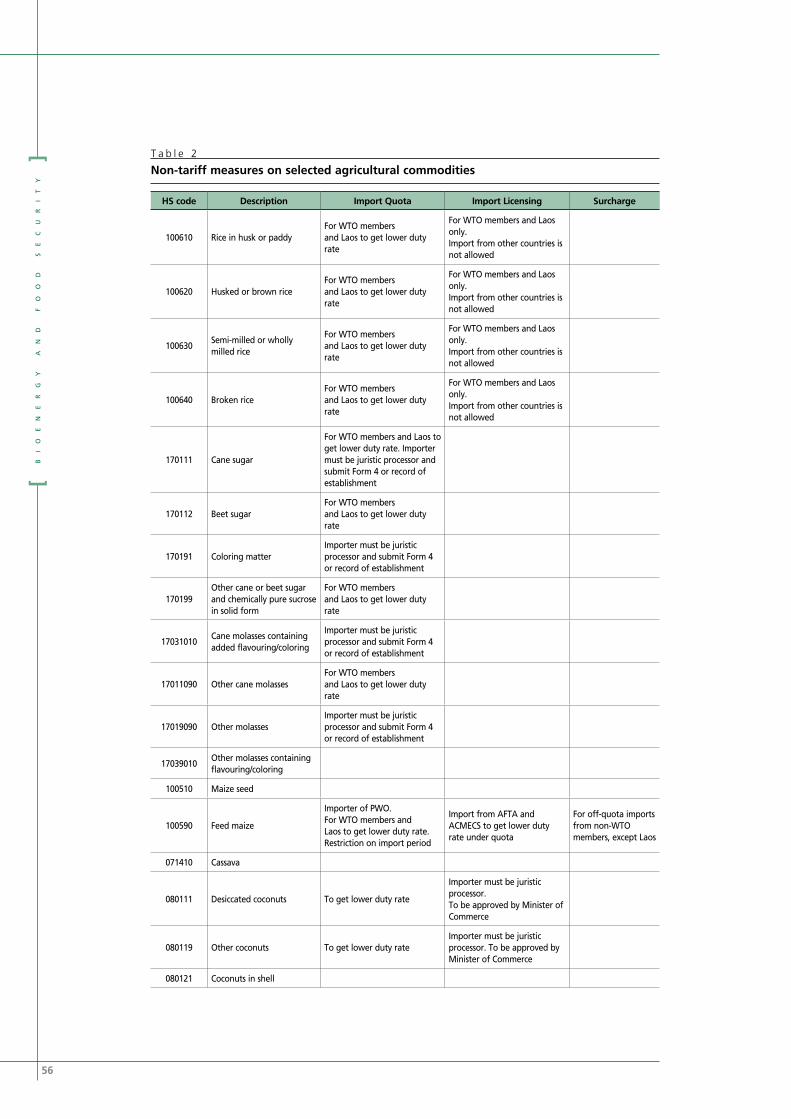


![Development of Agricultural Policies in Bangladesh[1] · 2019-03-11 · Agricultural Policies • Research and Development: The paradigm of agricultural research system needs to be](https://static.documents.pub/doc/80x56/5e818732f3e2174e900651c1/development-of-agricultural-policies-in-bangladesh1-2019-03-11-agricultural.jpg)


