APPENDIX-A 275 SAMPLE DESIGN APPENDIX-A Technical details of sample design I. SAMPLE DESIGN FOR THE MICS PUNJAB, 2011 The major features of the sample design are described in this appendix. The primary objective of the sample design for MICS Punjab, 2011 was to produce statistically reliable estimates of most indicators, at tehsil level, for urban and rural areas. Sample design features included target sample size, sample allocation, sampling frame and listing, choice of domains, sampling stages, stratification, and the calculation of sample weights. Universe The universe of this Survey consists of all urban and rural areas of Punjab defined as such by 1998 population census and changes made thereafter by the Provincial Governments. The military restricted areas and cantonment have been excluded from the scope o f the survey. Sampling Frame A. Urban Areas PBS has developed its own sampling frame through Quick Count Record Survey. This frame is an area frame wherein each city/town has been divided into a number of small compact areas called enumeration blocks (EBs). Each EB consists of an average of 200-250 households, with well-defined boundaries in the prescribed forms and maps thereof with physical features. Each Enumeration block has been divided into low, middle and high-income group, keeping in view the majority of households located in the enumeration block belonging to a particular income class. Similarly each enumeration block has been classified as residential, commercial and industrial in accordance with the predominance of an activity therein. This sampling frame now comprises all urban areas of the Punjab except Military restricted areas. The frame is regularly up-dated after every 5 to 7 years due to rapid growth in cities/towns/urban areas. It was updated last in 1998 and there are 14683 enumeration blocks in all urban areas of Punjab. B. Rural Areas The sampling frame for rural domain consists of list of villages/mouzas/dehs prepared by Population Census. A village/mouza/deh is the smallest revenue estate identified by its name, had-bast number, cadastral map, name of Tehsil, District & Province in which it is located. The rural sampling frame comprising 25846 villages/Mouzas/Dehs has been used for drawing the sample for Multiple Indicator Cluster Survey. STRATIFICATION PLAN A. Urban Domain There are eight major cities in the Punjab province as shown below:-
Transcript
AP PEND IX -A275
SAMPLE DESIGN APPENDIX-A
Technical details of sample design
I. SAMPLE DESIGN FOR THE MICS PUNJAB, 2011
The major features of the sample design are described in this appendix. The primary objective of the sample design for MICS Punjab, 2011 was to produce statistically reliable estimates of most indicators, at tehsil level, for urban and rural areas. Sample design features included target sample size, sample allocation, sampling frame and listing, choice of domains, sampling stages, stratification, and the calculation of sample weights.
Universe
The universe of this Survey consists of all urban and rural areas of Punjab defined as such by 1998 population census and changes made thereafter by the Provincial Governments. The military restricted areas and cantonment have been excluded from the scope of the survey.
Sampling Frame
A. Urban Areas
PBS has developed its own sampling frame through Quick Count Record Survey. This frame is an area frame wherein each city/town has been divided into a number of small compact areas called enumeration blocks (EBs).
Each EB consists of an average of 200-250 households, with well-defined boundaries in the prescribed forms and maps thereof with physical features. Each Enumeration block has been divided into low, middle and high-income group, keeping in view the majority of households located in the enumeration block belonging to a particular income class. Similarly each enumeration block has been classified as residential, commercial and industrial in accordance with the predominance of an activity therein. This sampling frame now comprises all urban areas of the Punjab except Military restricted areas. The frame is regularly up-dated after every 5 to 7 years due to rapid growth in cities/towns/urban areas. It was updated last in 1998 and there are 14683 enumeration blocks in all urban areas of Punjab.
B. Rural Areas
The sampling frame for rural domain consists of list of villages/mouzas/dehs prepared by Population Census. A village/mouza/deh is the smallest revenue estate identified by its name, had-bast number, cadastral map, name of Tehsil, District & Province in which it is located. The rural sampling frame comprising 25846 villages/Mouzas/Dehs has been used for drawing the sample for Multiple Indicator Cluster Survey.
STRATIFICATION PLAN
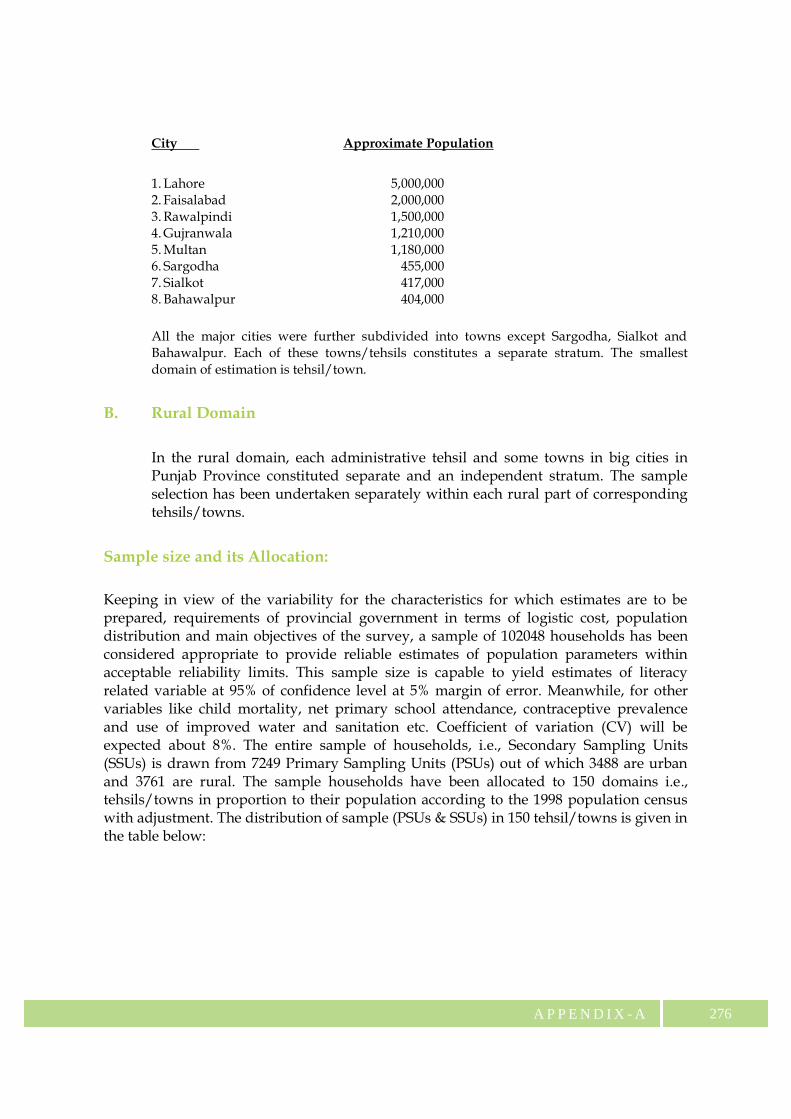
A. Urban Domain There are eight major cities in the Punjab province as shown below:-
All the major cities were further subdivided into towns except Sargodha, Sialkot and Bahawalpur. Each of these towns/tehsils constitutes a separate stratum. The smallest domain of estimation is tehsil/town.
B. Rural Domain
In the rural domain, each administrative tehsil and some towns in big cities in Punjab Province constituted separate and an independent stratum. The sample selection has been undertaken separately within each rural part of corresponding tehsils/towns.
Sample size and its Allocation:
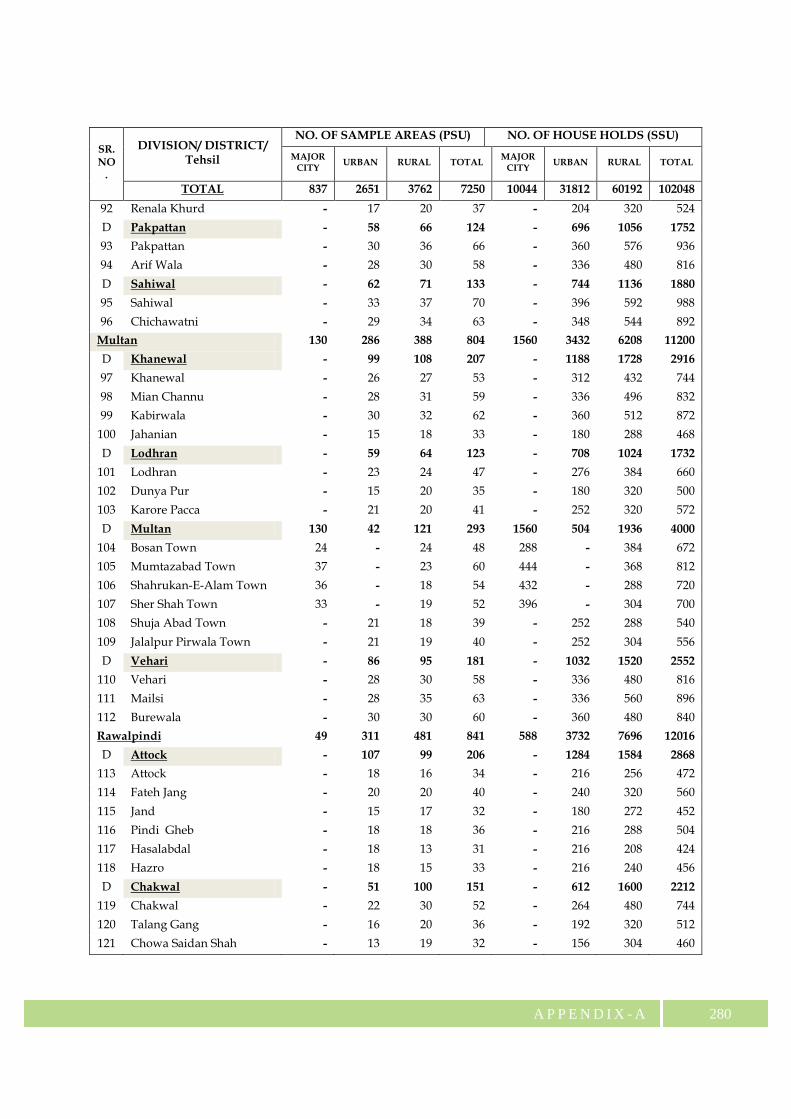
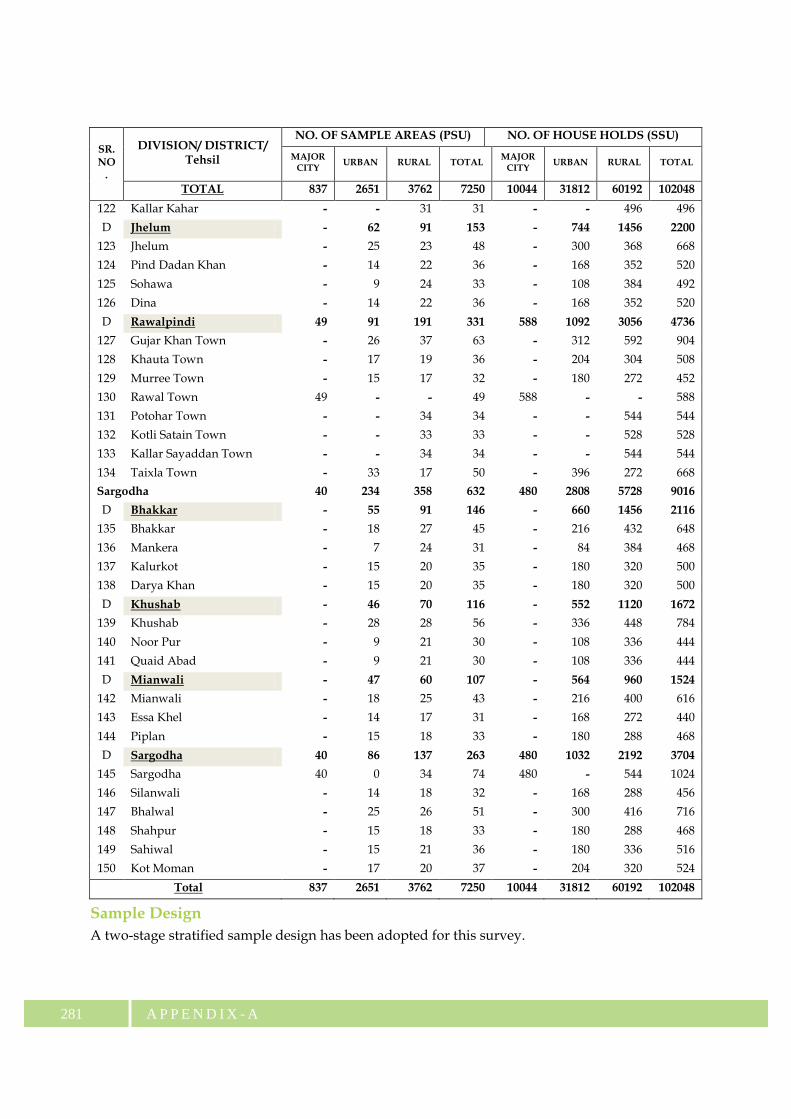
Keeping in view of the variability for the characteristics for which estimates are to be prepared, requirements of provincial government in terms of logistic cost, population distribution and main objectives of the survey, a sample of 102048 households has been considered appropriate to provide reliable estimates of population parameters within acceptable reliability limits. This sample size is capable to yield estimates of literacy related variable at 95% of confidence level at 5% margin of error. Meanwhile, for other variables like child mortality, net primary school attendance, contraceptive prevalence and use of improved water and sanitation etc. Coefficient of variation (CV) will be expected about 8%. The entire sample of households, i.e., Secondary Sampling Units (SSUs) is drawn from 7249 Primary Sampling Units (PSUs) out of which 3488 are urban and 3761 are rural. The sample households have been allocated to 150 domains i.e., tehsils/towns in proportion to their population according to the 1998 population census with adjustment. The distribution of sample (PSUs & SSUs) in 150 tehsil/towns is given in the table below:
A P P E N D I X - A277
NUMBER OF SAMPLE EBs AND VILLAGES FOR MICS PUNJAB, 2011
SR. NO.
DIVISION/ DISTRICT/ Tehsil
NO. OF SAMPLE AREAS (PSU) NO. OF HOUSE HOLDS (SSU)
Sample Design A two-stage stratified sample design has been adopted for this survey.
A P P E N D I X - A 282
Enumeration blocks demarcated as part of urban sampling frame in urban domain, mouzas/dehs/villages whose lists were prepared by Population Census Organization at the time of 1998 Population Census have been taken as PSUs. Sample PSUs from each stratum/sub-stratum have been selected with probability proportionate to size. The numbers of households and population have been considered as measure of size pertaining to urban and rural domain respectively.
Selection of Secondary Sampling Units
Based on actual listing undertaking in respect of each sample PSU by the Field Staff 16 and 12 households have been selected from rural and urban sample areas respectively adopting systematic sampling technique with a random start. Households have been considered as secondary sampling units for urban while population has been taken as measure of size in respect to rural areas.
Procedure to Select Housing Units
Whatever the distribution of sample Enumeration Blocks (EBs) in the different substrata might be, the selection of Housing Units (HUs) (or dwelling units, as were defined above), will follow the same procedure in all substrata.
If the sample will be spread during a one-year period, each week, the sampler will have at his/ her disposal the Listing Form (obtained after the listing operation) pertaining to the corresponding updated sample EBs for the corresponding period. A fixed number of valid HUs (12 in the urban area, 16 in the rural area) will be selected systematically and with equal probability from the Listing Form
In general, it is good practice to select reserve units in case there are no responses or refusals to keep the actual sample size. However, in Pakistan, the response rate is very high (almost 99% in the MICS Punjab, 2007-08) and therefore, it will not be necessary to select reserve units. Within each sample EB i of socioeconomic substratum h, we must identify and number the valid HUs, that is, the HUs that are occupied by one household on a permanent basis. They must have a correlative number between 1 and M'hi, the total number of valid HUs in the EB i and socioeconomic substratum h, after having listed the EB. The value M'hi will then be inserted in a spreadsheet from where a systematic sample of 12 units (16 in the urban area) will be selected.
The j-th HU to be selected within the EB i of socioeconomic substratum h is obtained during the following expression:
[Ahi+ (j–1) * Ihi] + 1 for j = 1,..., mhi
omitting the decimals in the results, without rounding (truncation process).where, Ihi = M'hi/mhi = sampling interval within the i-th EB and socioeconomic
stratum h. M'hi = number of valid HUs in the i-th EB of socioeconomic stratum h. Mhi = m = fixed number of HUs to be selected within the i-th EB and
socioeconomic stratum h. Ahi = a random number between 0 and Ihi, including 0 but excluding Ihi
Selection of Primary Sampling Units
AP PEND IX -A283
ESTIMATION PROCEDURE ADOPTED FOR MICS PUNJAB, 2011II
Probabilities of Selection and Sampling Weights
In order to expand the data from the MICS Punjab, 2011 to the provincial or domain levels(tehsils), it is necessary to apply a weight (expansion factor) to the data from each surveyquestionnaire. The basic weight for a sample household would be equal to the inverse of theits probability of selection. Since the Ebs will be selected independently with probabilityproportional to size (PPS) within each domain of estimation, the probability of selection of anEB is given by:
A P P E N D I X - A 284
NOTATIONS
ESTIMATION FORMULAE FOR TOTALS AND THEIR VARIANCES(i):


![[ftp tt] Engineering Design Sample Titlemhhe.com/designwebsite/SEM_Interiors/SEMint02.pdf · Engineering Design Sample Title [ftp_tt] Engineering Design Sample Title Second Edition](https://static.documents.pub/doc/80x56/5e759b0bbbce06708c4cfe82/ftp-tt-engineering-design-sample-engineering-design-sample-title-ftptt-engineering.jpg)


