Page 1
22
AMSE JOURNALS –2014-Series: Advances B; Vol. 57; N° 2; pp 22-43
Submitted Feb. 2014; Revised Sept. 16, 2014; Accepted October10, 2014
Technical Directives for Building and Operating MSG3 and
NOAA19 Satellites Receiving Station
*A. Hassini, **A.H. Belbachir
*Department of Maintenance in Instrumentation, Institute of Maintenance and Industrial Safety, University of Oran,
BP 05 Route de l’Aéroport Es-Senia, Oran, Algeria ([email protected] ) **Laboratory of Analysis and Application of Radiations, Faculty of Physics, University of
Sciences and Technology (USTOMB), BP 1505 El M’Nouar Bir El Djir, Oran, Algeria ([email protected] )
Abstract
The SEVIRI (Spinning Enhanced in Visible and Infrared Imager) sensor on the MSG3
satellite provides an image every 15 minutes, so the development of a system that can exploit the
temporal behaviour of the observations of terrestrial half-disc, is crucial for these near-real-time
applications. To validate the processing results, we need to use some others sensors, like AVHRR
(Advanced Very High Resolution Radiometer) from NOAA19 satellite. A terrestrial station is
required to collect and follow the temporal, spectral, and space evolution of the treated topic of
interest. In this research, we have described a simple satellite ground station with some parts
realized, to receive daily data from either SEVIRI-MSG3 geostationary satellite or AVHRR-
NOAA19 polar satellite. Some results of acquisition and processing by using our MSGViewer
software are described. The remote sensed data gathered are useful in many Physics applications.
Different combinations between visible and infrared windows based on images received from
NOAA19 satellite and MSG3 have obtained through its AVHRR Radiometer and SEVIRI
Imager. The system can be easily applied for under graduate research uses.
Key words: Remote sensing, optical radiometer, images, satellites, antenna, autotracking,
realization, development, softwares, thematic products.
1. Introduction
The second of the new generation of METEOSAT satellites, known as METEOSAT
Second Generation (MSG3), was launched in July, 05th 2012. As with the current METEOSAT
Page 2
23
series, MSG3 is spin-stabilized, and capable of greatly enhanced Earth observations. The
satellite’s 12-channels imager, known formally as the Spinning Enhanced in Visible and Infrared
Imager (SEVIRI), observes the full half disk of the Earth with an unprecedented repeat cycle of
15 minutes in 12 spectral wavelength regions or channels [1].
The NOAA19 Polar Orbiting Environmental Satellite (POES) system was launched in
February, 06th 2009 is equipped by an Advanced Very High Resolution Radiometer (AVHRR
Version 3). The latter provides remote sensing data in five wavelength bands and tow full spatial
resolutions, Automatic Picture Transmission (APT) and High Resolution Picture Transmission
(HRPT), the first one is approximately 4 Km, the second one is down to 1.1 Km pixels. These
data sets can be used for a variety of remote sensing physic’s applications , and daily captured
with a feed horn motorized system and image processing equipment. They concern a large
identified users community has expressed the need for information tools operating on
environment. Applications are numerous, for example: coastal protection, climate and
meteorology, security, tourism and leisure, fishing and aquaculture, sea traffic, and other domains
[2][3]. This project is actually operational and used like a practical work in module of Remote
Sensing (Master 2 degree in Radiology Science and Imagery, Faculty of Physics, University
USTOMB, Oran, Algeria).
2. Materials and Methods
SEVIRI Sensor
SEVIRI sensor embedded on MSG3 Satellite is a 50 cm-diameter aperture, line-by line
scanning radiometer, which provides image data in four Visible and Near-InfraRed (VNIR)
channels and eight InfraRed (IR) channels. A key-feature of this imaging instrument is its
continuous imaging of the Earth in 12 spectral channels with a baseline repeat cycle of 15
minutes. The imaging sampling distance is 3 Km at the sub-satellite point for standard channels,
and down to 1 Km for the High Resolution Visible (HRV) channel. The main characteristics of
the instrument are summarized in Tab.1.
The primary mission of the second generation METEOSAT satellites is the continuous
observation of the Earth’s full disk with a multi-spectral imager. The repeat cycle of 15 minutes
for full-disk imaging provides multi-spectral observations of rapidly changing phenomena such
as forest fires, cyclones, deep convection and others. It also provides better retrieval of wind
fields which are obtained from the tracking of clouds by using physics atmospheric models like
radiative transfer operator RTTOV [4], water vapour and ozone features [5].
Page 3
24
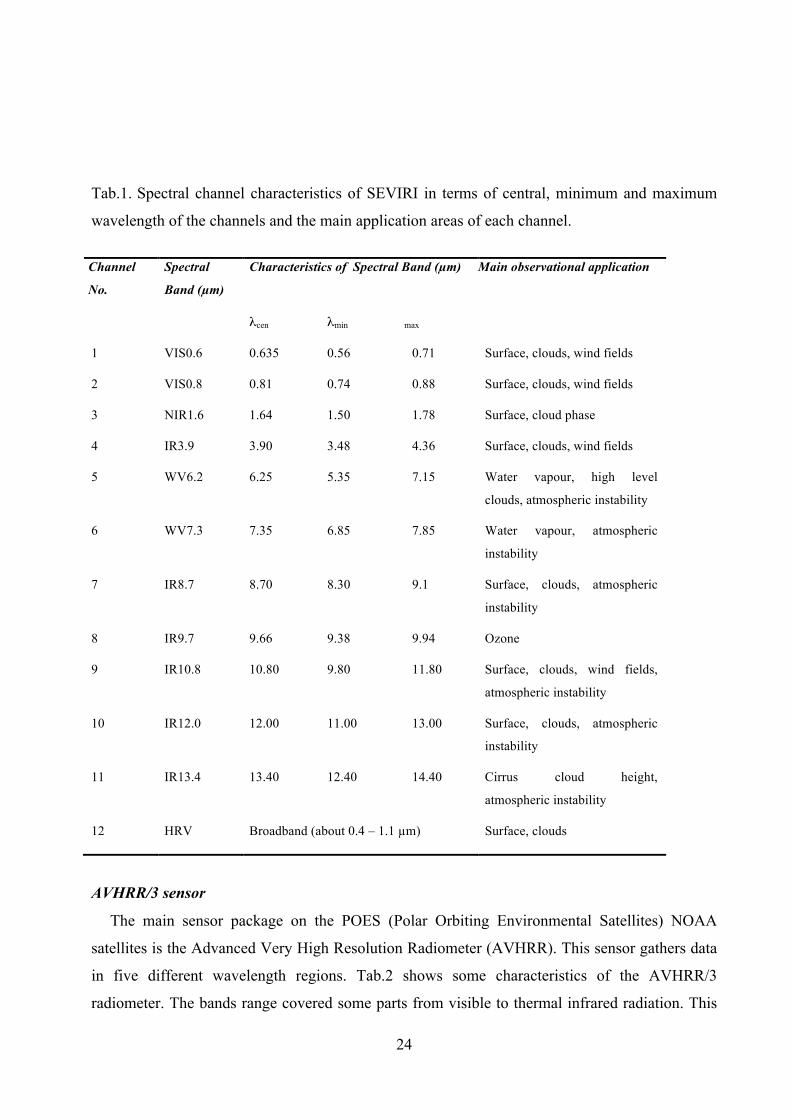
Tab.1. Spectral channel characteristics of SEVIRI in terms of central, minimum and maximum
wavelength of the channels and the main application areas of each channel.
Channel
No.
Spectral
Band (µm)
Characteristics of Spectral Band (µm) Main observational application
λcen λmin λmax
1 VIS0.6 0.635 0.56 0.71 Surface, clouds, wind fields
2 VIS0.8 0.81 0.74 0.88 Surface, clouds, wind fields
3 NIR1.6 1.64 1.50 1.78 Surface, cloud phase
4 IR3.9 3.90 3.48 4.36 Surface, clouds, wind fields
5 WV6.2 6.25 5.35 7.15 Water vapour, high level
clouds, atmospheric instability
6 WV7.3 7.35 6.85 7.85 Water vapour, atmospheric
instability
7 IR8.7 8.70 8.30 9.1 Surface, clouds, atmospheric
instability
8 IR9.7 9.66 9.38 9.94 Ozone
9 IR10.8 10.80 9.80 11.80 Surface, clouds, wind fields,
atmospheric instability
10 IR12.0 12.00 11.00 13.00 Surface, clouds, atmospheric
instability
11 IR13.4 13.40 12.40 14.40 Cirrus cloud height,
atmospheric instability
12 HRV Broadband (about 0.4 – 1.1 µm) Surface, clouds
AVHRR/3 sensor
The main sensor package on the POES (Polar Orbiting Environmental Satellites) NOAA
satellites is the Advanced Very High Resolution Radiometer (AVHRR). This sensor gathers data
in five different wavelength regions. Tab.2 shows some characteristics of the AVHRR/3
radiometer. The bands range covered some parts from visible to thermal infrared radiation. This
Page 4
25
data is broadcast continually from each satellite as HRPT data in the microwave frequency range,
and can be received on the ground during the times that the satellite is visible above the horizon.
The maximum pass time is usually 15 minutes. The data can also be stored on board the satellite
on tape recorders for later playback. In the AVHRR/3 version used since NOAA-14 satellite,
there are six bands [6][7].
Tab.2. AVHRR/3 Channels Characteristics
General Operational Requirements
To receive HRIT, HRPT or APT data from NOAA19 and MSG3 satellite transmissions, a
ground station is required. A block diagram of minimum ground station components is presented
in Fig.1. The antenna system for the APT system consists of a quadrifilar helix omnidirectional,
circularly polarized beam fixed pointing straight up, while the HRPT and HRIT system uses a
microwave dish that is pointed at the satellite by a computer controlled dual axis mount. A
preamplifier is necessary in both cases because the signal transmitted by the satellites is weak
(about 4 mW). In case of the APT acquisition mode, the receiver then converts the radio signals
into audio tones, and the decoder converts the audio tones, which represents analogue voltage
levels generated by the sensors, into digital data a computer can recognize. In case of the HRPT
acquisition mode, the corresponding receiver demodulates the SHF FSK-NRZ signal, after
frequency conversion by a LNB device [8]. The HRIT acquisition system is composed by a
simple PCI DVB satellite TV system connected with an USB key system. To receive HRIT-MSG
data from EUMETSAT via EUROBIRD 19 East satellite relay, we have used some special
softwares, DVB card will communicate with TechniSat software when it installed. It turns the
DVB card into a channel through which files are received from EUMETSAT, and saved on
PC. All compressed acquired data are opened and processed by using our MSGViewer (PC
compatible) software written in C++ language.
Channels Resolution at Nadir Wavelength (um)
1 1.09 km 0.58 - 0.68
2 1.09 km 0.725 - 1.00
3A 1.09 km 1.58 - 1.64
3B 1.09 km 3.55 - 3.93
4 1.09 km 10.30 - 11.30
5 1.09 km 11.50 - 12.50
Page 5
26
USB Key System
HRPT and HRIT antenna
APT antenna
Pre-amp
HRPT Receiver
Pre-amp Downconverter
Positioner Controller
Computer Decoder
PCI-DVB Card
Fig.1. Global scheme of the GOES and POES realized station.
Polar Satellite Passes Prediction
Since the NOAA satellites can cover a part of the same terrestrial area approximately four
times per day but from different longitudes, the computer captures the data on to storage media
for later processing. In either system, it is necessary to predict the satellites track both as paths
above the earth. For that, it is necessary to have orbital prediction program and current orbital
elements for the satellites to determine when they will be in direct visibility from our ground
station, for this reason, we have developed a quick software, called PCNOAA_TRACK (the main
menu is looked in Appendix A1). This program contains files with functions for calculating the
position and rotational velocity of a satellite using the NORAD (North American Aerospace
Defense Command) SGP4 (Simplified General Perturbations version 4) and SDP4 (Simplified
Deep-space Perturbation Version 4) routines and from these the azimuth, elevation, range and
range rate of same. Routines are also included for calculating the position of the sun and the
illumination status and eclipse depth of the satellite. In the APT and the HRPT systems, the
predictions inform the user when to have the system active and any slight error is generally not
important.
PCNOAA_TRACK works with the two-line element orbital data files (resource.txt,
stations.txt and weather.txt contains the Kepler data of each satellite). These files should be
Page 6
27
updated regularly, perhaps every month because the SGP4 model has an error around 1 Km at
epoch and grows at 1 to 3 Km per day. This data is updated frequently in NASA and NORAD
sources due to this error. The original SGP model was developed by Kozai in 1959 refined by
Hilton & Kuhlman in 1966 and was originally used by the National Space Surveillance Control
Center (and later the United States Space Surveillance Network) for tracking of objects in orbit.
The SDP4 model has an error of 10 km at epoch. The operating frequency and some technical
information’s for satellites are specified in the file TLEnotes.txt, which includes an explanation
of the data format [9]. The format of data in TLEnotes.txt is documented in fig.2. A two-line
element set (TLE) is a data format used to convey sets of orbital elements that describe the orbits
of Earth-orbiting satellites. PCNOAA_TRACK can use the TLE to compute the position of a
satellite at a particular time. The TLE is a format specified and used by NORAD and NASA. The
TLE can be used directly by the SGP4 model (or one of the SGP8, SDP4, and SDP8 models).
Orbital elements are freely distributed on NORAD web site.
General Perturbations (SGP) models apply to near earth objects with an orbital period of less
than 225 minutes. Simplified Deep Space Perturbations (SDP) models apply to objects further
from Earth or those with an orbital period greater than 225 minutes.
SGP4 orbital model takes into account the following perturbations:
• Atmospheric drag based on a static, non-rotating, spherically-symmetric
atmosphere,
• Fourth-order zonal geopotentail harmonics,
• Spin-orbit resonance effects for synchronous and semi-synchronous orbits,
• Solar and lunar gravitational effects to the first order.
The latter two terms are less important for low-Earth orbit, for period less than
255minutes (period for NOAA satellite series is about 102 minutes). Details of SGP4
and SDP4 are found in to [10] [11].
To summarize, SGP4 uses a geopotential model of the fourth order described in equation (1).
(1)
where V is the geopotential, G is the gravitational constant, M is the mass of Earth, r is Earth’s
mean radius, and re are respectively the latitude and the radius of the observational point, Pn is
the normalized associated Legendre function, and Jn represents the zonal terms.
This model takes into consideration:
• The equatorial pad of Earth (J2),
Page 7
28
• The pear form of Earth (J3),
• An additional deviation (J4).
it also models the atmospheric trail, which slows down satellites on their trajectories [12].
Fig.2. NASA/NORAD 2-Line Elements Description
Satellite Autotracking System
In the HRPT part of the established system, however, we used the predictions to aim the dish
antenna at the satellite as it passes above our receiving station, accuracy in the predictions and
proper timing is essential. The HRIT reception need to a fixed 2 m in diameter dish. The HRPT
system requires an autotracking motorised equipment. The system consists of an azimuth-
elevation motor, controlled by using manual or automatic positionner controller (using a serial
COM PC port). Fig.3 shows the synoptic diagram of the automatic positionner (autotracker)
realized in this project. Appendix A2 presents the electronic scheme of the instrument, the mean
device of the tracker is the PIC16F876 microcontroller, including A/D converters, a bidirectional
asynchronous serial port, in-circuit programming, With the open architecture and choice of
design of our autotracker, it will allow others to implement a satellite antenna tracking interface
at extremely low cost but simultaneously provide the highest versatility and compatibility of any
PC. It uses a fairly standard PIC16F876 implementation. The only slightly novel approach is that
if we choose an USB interface, then the FTDI (Future Technology Devices International) USB-
Serial converter evaluation board is used. For the RS-232 interface that we selected in this
project, a standard MAX232 chip is used for level conversion. The FTDI USB/Serial converter
module is pre-fabricated using a standard 28 pin with DIL (Dual In-Line) package. Although
more expensive than using the 32 pin LQFP (Low Profile Quad Flat Pack) package, for easy
construction for the user the pre-fabricated module was used. The device is powered from the
Yaesu rotator interface. Tab.3 shows a list of connecting pins used by the autotracker circuit.
Page 8
29
The communication block ensures the communication between the PC (PCNOAA_TRACK
software) and the microcontroller PIC16f876.The RS-232 connection receives the data from PC
(PCNOAA_TRACK software) and sent to standardized tensions +12/-12V, the PIC16f876
receives these data on pins RC7/RX/DT with tensions 0/+5V. The adaptation of the data is done
using a circuit adapter of line (MAX232), which transforms the logical levels resulting from the
numerical system (0/+5V), in logical levels compatible with the standards RS-232 (+12v/-12v)
and vice versa. The communication between the PC and the RS-232 connection is done under an
EasyComm protocol. The control block allows the command of the antenna position compared
to the satellite. The antenna elevation is recovered through pin 1 in DIN socket in the rear panel
of controller block of Yaesu G-5500 rotator (described in Appendix A3 and Appendix A4). When
the autotracker provides a tension from 2 to 4.5 V DC in this pin, it corresponding to 0 to 180° in
elevation of the satellite Antenna. When the autotracker provides a tension from 2 to 4.5 VDC in
this pin, it corresponding to 0 to 450° in azimuth of the satellite antenna.
Analogue/Digital conversion is done on the level of RA0 and RA1 of PORTA of
microcontroller, these two lines are configured as “input” of the converter, this one is the aim of
our system, and it ensures the correspondence between our PCNOAA_TRACK software and the
Yaesu G-5500 rotator of the reception antenna. Moreover the PORTC of microcontroller
connects the control circuit through the lines (RC0-RC3) which are configured as “output”.
After having recovered the two analogues potentials of site and azimuth, we can consider that the
internal condenser is charged and ready to be connected on the Analogue/Digital entry of the
converter, this last will have to carry out conversion by successive approximation. Once finished
the conversion, the digitized value is recorded in registers ADRESH and ADRESL. Then the
microcontroller will proceed to the comparison of these values compared to that provided by the
PCNOAA_TRACK software. The difference between these two values will be sent through the
RC0-RC3 pins of the PORTC like a command to control the position of the antenna. When one
of these outputs is ON, transistor BC547 is saturated (the current of the collector is maximum).
While it is be blocked when the output is OFF. Transistors (BC547) will change the potential in
pins 2, 3, 4 and 5 of the DIN socket.
PIC16F876 Microcontroller
2 x 16 LCD display
DC power supply block
Control circuit block of G-5500 rotor
Serial communication Block RS232 and USB
Page 9
30
Fig.3.
Synoptic diagram and photography of the autotracker.
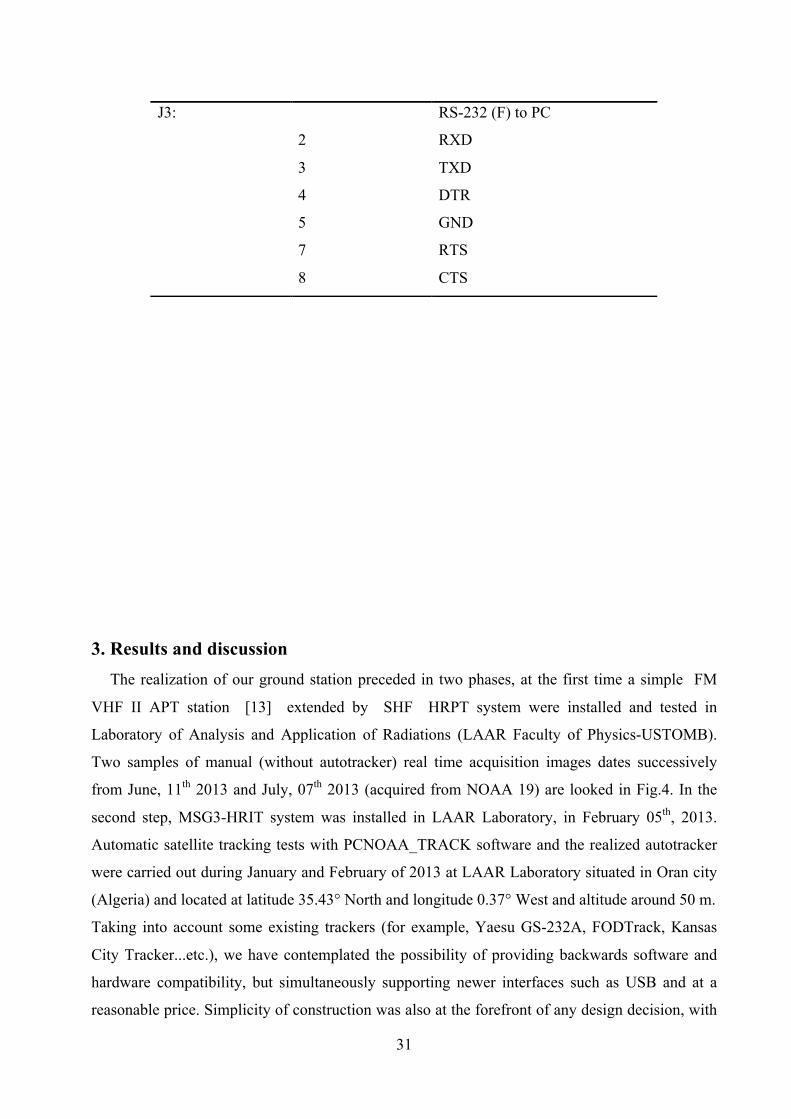
Tab.3. List of connecting pins used in the autotracker circuit.
Pin number description
J1: To Yaesu 8 pins DIN
1 Elevation
2 Right
3 Up
4 Left
5 Down
6 Azimuth
7 -13 V
8 GND
J2: 1-6 LCD debugger header (optional)
Page 10
31
3. Results and discussion
The realization of our ground station preceded in two phases, at the first time a simple FM
VHF II APT station [13] extended by SHF HRPT system were installed and tested in
Laboratory of Analysis and Application of Radiations (LAAR Faculty of Physics-USTOMB).
Two samples of manual (without autotracker) real time acquisition images dates successively
from June, 11th 2013 and July, 07th 2013 (acquired from NOAA 19) are looked in Fig.4. In the
second step, MSG3-HRIT system was installed in LAAR Laboratory, in February 05th, 2013.
Automatic satellite tracking tests with PCNOAA_TRACK software and the realized autotracker
were carried out during January and February of 2013 at LAAR Laboratory situated in Oran city
(Algeria) and located at latitude 35.43° North and longitude 0.37° West and altitude around 50 m.
Taking into account some existing trackers (for example, Yaesu GS-232A, FODTrack, Kansas
City Tracker...etc.), we have contemplated the possibility of providing backwards software and
hardware compatibility, but simultaneously supporting newer interfaces such as USB and at a
reasonable price. Simplicity of construction was also at the forefront of any design decision, with
J3: RS-232 (F) to PC
2 RXD
3 TXD
4 DTR
5 GND
7 RTS
8 CTS
Page 11
32
the aim of being no more complicated than the existing trackers to construct. For more advanced
construction, there are also several options available such as an LCD display and configuration
buttons, or the option to choose between USB and RS-232 and maintain backwards compatibility
with existing software. Because the unit uses a microcontroller, of prime concern was also the
provision for the user to be able to program the unit without the need of a programmer.
The downlink frequency for NOAA19 is 1698.0 MHz. The local oscillator for the
downcoverter used in our station has a frequency of 1557.0 MHz. The mean operation of the
down-converter is to convert SHF (fs) signals from 1691-1707 MHz to VHFII (fc) 134- 150
MHz range, the oscillator (Fig.5) is accorded at fo around 1557 MHz.
The frequency on the output of oscillator fc is the difference between the input frequency fs
and the frequency of the oscillator fo, i.e. fofsfc −= . On Tab.4 we can give some examples of
some satellite input/output frequencies treated by the down-converter. This means that the signal
of NOAA19 satellite is observable after down-conversion at frequency 141.0 MHz. Fig. 6 shows
a detailed scheme of the autotracking satellite system used. Fig. 7-a and Fig. 7- b presents a
sample spectra observed at LAAR Laboratory by spectrum analyzer. Fig. 7-a presents a reference
spectrum with no satellite signal. Fig. 7-b presents a signal from HRPT NOAA19 at down-
conversion frequency 141.0 MHz was detected in October, 05 2013.
Fig. 8 presents, a sample of acquiring images from MSG3-SEVIRI sensor. The full images
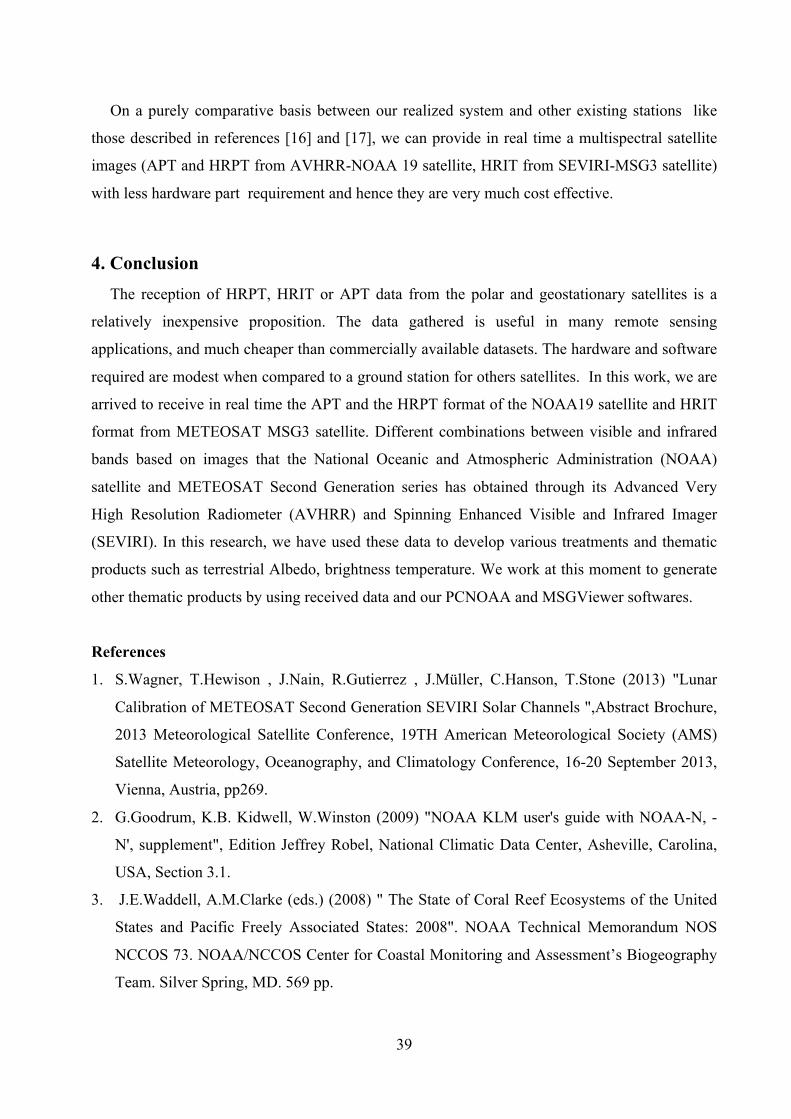
scan (12 channels) is acquired from MSG3 in June, 12 2013 at 10h45 min UTC. The flowchart
in Fig. 9 shows the methods used to calibrate HRIT images, after the radiometric calibration,
infrared channels are converted to thermal images, in the case of visible channels; they are
converted to Terrestrial Albedo images. This algorithm is included in our MSGViewer software
(Appendix A5).
With:
A, B: coefficients depending to the sensor.
Coffset: Coefficient offset of digital count.
Cslop: Coefficient slope of digital count.
Count(i): 10 Bits raw count
JD: Julian Day.
RadVIS(i): measured Radiance of visible channel i.
RadIR(i): measured Radiance of infrared channel i.
TB(i): brightness temperature of channel i.
Te(i): equivalent temperature of channel i.
Page 12
33
ψ(i): solar constant of channel i at top of the Atmosphere.
γ(JD): earth sun distance.
θ: Solar zenithal angle.
ρ(i): terrestrial Albedo of channel i.
νc(i): central wave number of channel i.
Fig.4. A sample of acquisition images: (a) Image APT received in June, 11th 2013 at 14h33min
UTC (Visible & InfraRed), (b) Image HRPT received in July, 07th 2013 at 11h13min UTC
(a)
(b)
Page 13
34
Fig.5. Synoptic scheme of the down-converter oscillator.
Fig.10-(a) and Fig.10-(b) present successively channel Vis 0.6 µm before and after radiometric
calibration process, the operation consist to convert each raw count to terrestrial Albedo
(reflectance) by applying algorithm looked in Fig. 9 . In the other hand, Fig.10–(c) and Fig. 10-
(d) present successively raw and calibrated IR 3.9 µm channel, each pixel presents brightness
temperature count. Calibration coefficients associated with each scan are used to convert visible
raw images in Albedo charts and, the IR raw images in radiance temperature charts [14] [15].
Tab.4. Some satellite input frequencies down converted by Pre-amp down-converter block.
Input frequency fs
(MHz)
Oscillator frequency fo
(MHz)
Output frequency fc
(MHz)
1691.0 1557.0 134.0
1694.5 1557.0 137.5
1698.0 1557.0 141.0
1707.0 1557.0 150.0
« Satellite » frequency band SHF (fs)
Converted Frequency to VHFII (fc)
Oscillator frequency (fo)
Page 14
35
Fig.6. Global scheme of the autotracking satellite system.
(a) (b)
Fig.7. A sample Spectra observed at LAAR Laboratory by spectrum analyzer: (a) a reference
spectrum with no Satellite signal, (b) a signal from NOAA19 at down converting frequency 141.0
MHz was detected in October, 05 2013.
Site control
Azimuth control
Autotracker interface
Yaesu-G5500 manual controller
block
DC Motor Azimuth
DC Motor Site
+ 13 V
+ 13 V
Recopy Site
Recopy Azimuth
PC
Page 15
36
Fig.8. A sample of one MSG3- HRIT scan acquired in June, 12th 2013 at 10h45 min UTC.
yes no
Read Raw Count (10 Bits)
, , , ,
Page 16
37
Fig.9. Flowchart about the radiometric correction applied to MSG3-HRIT images developed in
MSGViewer software.
Fig.10. Radiometric correction results: (a) Raw HRIT acquired Vis 0.6µm image.(b) Terrestrial
Albedo image result.(c) Raw HRIT IR3.9 µm acquired image.(d) Brightness temperature image
result.
Fig. 11 and Fig. 12 represents respectively the result of polar north projection algorithm and
the procedure used, after this operation, each pixel in the image represent a square of 3x3 Km2 in
spatial resolution. Map transformations are referred to as projections because they are commonly
visualized as geometric constructs. That is, we think of the map as a rectangle flat surface
wrapped around a globe with lines emanating from points on the globe and "projected" onto the
plane surface. It is important to note that not all map projections can be constructed in this
manner. Map projections are specified as a set of equations giving x and y in terms of latitude and
longitude. The manner in which we wrap the rectangle around the globe determines the form of
the equations. Conical projections wrap the rectangle around in a cone. Several parameters are
(a) (b)
(c) (d)
Page 17
38
used in these equations to specify exactly where the surface intersects the globe, the scale or size
of the globe, and the translation and rotation of the map on the plane surface.
Fig.11. Polar north projection of channel IR 1.6 µm
Fig.15. Different steps of Polar North projection used.
Fig.12. Different steps of Polar North projection used.
Geographic coordinates Polar North projection Grid coordinates
Page 18
39
On a purely comparative basis between our realized system and other existing stations like
those described in references [16] and [17], we can provide in real time a multispectral satellite
images (APT and HRPT from AVHRR-NOAA 19 satellite, HRIT from SEVIRI-MSG3 satellite)
with less hardware part requirement and hence they are very much cost effective.
4. Conclusion
The reception of HRPT, HRIT or APT data from the polar and geostationary satellites is a
relatively inexpensive proposition. The data gathered is useful in many remote sensing
applications, and much cheaper than commercially available datasets. The hardware and software
required are modest when compared to a ground station for others satellites. In this work, we are
arrived to receive in real time the APT and the HRPT format of the NOAA19 satellite and HRIT
format from METEOSAT MSG3 satellite. Different combinations between visible and infrared
bands based on images that the National Oceanic and Atmospheric Administration (NOAA)
satellite and METEOSAT Second Generation series has obtained through its Advanced Very
High Resolution Radiometer (AVHRR) and Spinning Enhanced Visible and Infrared Imager
(SEVIRI). In this research, we have used these data to develop various treatments and thematic
products such as terrestrial Albedo, brightness temperature. We work at this moment to generate
other thematic products by using received data and our PCNOAA and MSGViewer softwares.
References
1. S.Wagner, T.Hewison , J.Nain, R.Gutierrez , J.Müller, C.Hanson, T.Stone (2013) "Lunar
Calibration of METEOSAT Second Generation SEVIRI Solar Channels ",Abstract Brochure,
2013 Meteorological Satellite Conference, 19TH American Meteorological Society (AMS)
Satellite Meteorology, Oceanography, and Climatology Conference, 16-20 September 2013,
Vienna, Austria, pp269.
2. G.Goodrum, K.B. Kidwell, W.Winston (2009) "NOAA KLM user's guide with NOAA-N, -
N', supplement", Edition Jeffrey Robel, National Climatic Data Center, Asheville, Carolina,
USA, Section 3.1.
3. J.E.Waddell, A.M.Clarke (eds.) (2008) " The State of Coral Reef Ecosystems of the United
States and Pacific Freely Associated States: 2008". NOAA Technical Memorandum NOS
NCCOS 73. NOAA/NCCOS Center for Coastal Monitoring and Assessment’s Biogeography
Team. Silver Spring, MD. 569 pp.
Page 19
40
4. A.Razagui, K.Bouchouicha, N.E.I.Bachari (2013) " Cloudy simulation algorithm in
RTTOV using aladin forecasting output ", AMSE, Advances in Modelling, Series B Signal
Processing and Pattern Recognition, Volume 56, Issue 1, 2005, pp 52-67.
5. D.M.A.Aminou, A.Ottenbacher, B.Jacquet, A.Kassighian (1999) "METEOSAT Second
Generation: On-ground Calibration, Characterisation and Sensitivity Analysis of the SEVIRI
Imaging Radiometer ", Proceedings of SPIE 3750, Earth Observing Systems IV, Vol. 3750,
September 24, 1999, pp 419-430. doi:10.1117/12.363538.
6. K.B.Kidwell (1998) " NOAA Polar Orbiter Data User’s Guide (TIROS-N, NOAA-6, NOAA-
7, NOAA-8, NOAA-9, NOAA-10, NOAA-11, NOAA-12, NOAA-13 and NOAA-14)" November 1998 Revision, NOAA/NESDIS/NCDC, USA.
7. A.Hassini, A.H. Belbachir (2012) "AVHRR-NOAA and MODIS-Aqua/Terra data receiving
and processing system", Nanoscale Science and Technology (NS&T’12) Proceedings,
Humboldt Kolleg, edited by Michael J. Schöning and Adnane Abdelghani , 17-19 March,
2012, Hammamet, Tunisia, pp 83.
8. N.M.Zemaili, N.Benbadji, A.Hassini, A.H.Belbachir (2009) "Méthode d'étalonnage
radiométrique des images satellitaires NOAA-HRPT ", Troisièmes Journées d’Animation
Scientifique du Réseau de Télédétection de l’AUF, JAS’09 Proceedings, 08-11 November
2009, USTHB, Algeirs, Algeria, 435 p. 2009.
9. A.Hassini, N.Benabadji, A.H.Belbachir, "Acquisition and Treatment of MSG Satellite
Images", 5th International Conference: Sciences of Electronic, Technologies of Information
and Telecommunications, SETIT 2009 Proceedings, 22-26 March 2009,
Hammamet, Tunisia, 563 p.
10. F.R.Hoots, R.L. Roehrich (1980) "Space Track Report No. 3: Models for Propagation of
NORAD Element Sets", Peterson: Aerospace Defense Center, United States Air Force,
Colorado, USA, pp 1-87.
11. L.Shenggang, H.Chao, W.Shaokai, L.Qinqin (2012) "Data Warehouse Design For Earth
Observation Satellites ", 2012 International Workshop on Information and Electronics
Engineering, Procedia Engineering, Vol.29, pp3876-3882, 2012,
DOI:10.1016/j.proeng.2012.01.587
12. T.Bak, (1999) "Spacecraft Attitude Determination- a Magnetometer Approach ", Ph.D.
Thesis, Department of Control Engineering Aalborg University Fredrik Bajers Vej 7, DK-
9220 Aalborg Ø, Denmark., Second edition, December 1999, pp 188.
Page 20
41
13. A.Hassini, N.Benabadji, A.H.Belbachir (2005) " Reception of the APT weather satellite
images", AMSE journals, Advances in Modelling, Series B Signal Processing and Pattern
Recognition, Volume 48, Issue 1, 2005, pp 25-42.
14. A.Hassini, F.Benabdelouahed, N.Benabadji, A.H. Belbachir (2009) "Active Fire Monitoring
with Level 1.5 MSG Satellite Images ", American Journal of Applied Sciences, Vol. 6:1,
2009, pp 157-166, DOI: 10.3844/ajassp.2009.157.166.
15. N.Benkahla, A.Hassini (2013) "Identification of Terrestrial Vegetation by MSG-SEVIRI
Radiometer and Follow-Up of Its Temporal Evolution", Book Title Modelling Approaches
and Algorithms for Advanced Computer Applications, pp 305-314, Series Title Studies in
Computational Intelligence Series, 2013, Volume 488,. DOI 10.1007/978-3-319-00560-7_34.
16. M.S.Nordin, F.Abdul Aziz (2007) "Ground Receiving Station (GRS) of UMS – Receiving
and Processing the Electromagnetic Wave Data from Satellite", Journal of Nuclear and
Related Technology Vol. 4, Special Edition 2007, pp 199-208.
17. J.M.Friedt (2005) "Satellite image eavesdropping: a multidisciplinary science education
project" European Journal of Physics, Vol. 26, pp 1-16, DOI:10.1088/0143-0807/26/0/000.
Appendixes
A1: Main menu of PCNOAA_TRACK software.
Page 21
42
A2: The electronic circuit of the realized autotracker:
A3: External control of the Yaesu controller block: DIN socket connections.
A4: List of connecting pins used in the external DIN controller block of Yaesu G-5500 Rotator.
Page 22
43
A5. Main menu of MSGViewer software.
Pin number Description
1 Provides 2 to 4.5VDC corresponding to 0 to 180° in elevation
2 Connect to Pin 8 to rotate right (clockwise)
3 Connect to Pin 8 to rotate DOWN
4 Connect to Pin 8 to rotate left (counter clockwise)
5 Connect to Pin 8 to rotate UP
6 Provides 2 to 4.5VDC corresponding to 0 to 450° in Azimuth
7 Provides DC13V to 6V at up to 200mA
8 Common ground GND