Page 1
UNESCO-NIGERIA TECHNICAL & VOCATIONAL EDUCATION
REVITALISATION PROJECT-PHASE II
YEAR I- SE MESTER I
THEORY/PRACTICAL
Version 1: December 2008
NATIONAL DIPLOMA IN
BUILDING TECHNOLOGY
TECHNICAL DRAWING
COURSE CODE: BLD 107
Page 2
WEEK 1 DRAWING EQUIPMENT
1.1 Equipment
1.2 Types of Lines
1.3 Application of Types
WEEK 2 DRAWING SCALES AND LETTING METHOD
2.1 Drawing Scales
2.2 Lettering Methods
WEEK 3 CIRCLES AND POLYGONS
3.1 Circles
3.2 Properties of A Circle
3.3 Polygons
WEEK 4 LOCI
4.1parabola
4.2 Hyperbola
4.3 Ellipse
WEEK 5 PROJECTION
5.1 Orthographic Projection
5.2 Multi views Projection
5.3 Differences Between First and Third Angle Projection
WEEK 6 ISOMETRIC AND OBLIQUE PROJECTIONS
6.1 Isometric Projections
6.2 Oblique Pictorial Projections
WEEK 7 PERSPECTIVE DRAWING
7.1 One- Point Perspective
7.2 Two Point Perspective
7.3 Three-Point Perspective
WEEK 8 DIMENSIONS FOR TECHNICAL DRAWING
8.1 Types Of Dimensioning Techniques
Page 3
8.2 Chain Dimensioning
8.3 Dimensioning Small Features
8.4 Dimensioning Circles
8.5 Dimensioning Radius
8.6 Simplified Dimensioning by Co-Ordinates
8.7 Arrangement of Dimensions
WEEK 9 ABBREVIATIONS IN SYMBOLS USED IN MECHANICAL,
ELECTRICAL AND BUILDING DRAWING
9.1 Technical Drawing Symbols
9.2 Conventional Symbols
9.3 Line and Block Diagrams
WEEK 10 FREE HAND SKETCHING
10.1 General Notes Before Sketching
WEEK 11 SKETCHING THE VIEW FROM AND ACTUAL OBJECT
11.1 Oblique Sketching
WEEK 12 THE MAIN FEATURES OF THE SIX VIEW OF AN OBJECT
WEEK 13 MISSING VIEW
13.1 First Angle Projection
13.2 Third Angle of Projection
WEEK 14 INTERSECTION OF SOLIDS
WEEK 15 SURFACE DEVELOPMENT OF SOLIDS
15.1 Surface Development of Diagonal Box
15.2 Surface Development of a Hexagonal Box
15.3 Development of an Oblique Hexagonal Tube
15.4 Development of a Hexagonal Prism Cut By a Plan
15.5 Development of a Hexagonal Prism Cut By a Plane
15.6 Development of an Oblique Circular Tube
15.7 Development of a Cylindrical Cut By a Plane
Page 4
WEEK 1: DRAWING EQUIPMENT
Introduction Technical drawing is concerned mainly with using lines, circles, arcs etc., to illustrate general configuration of an object. It is a language of communication between architects and Engineers, usually to convey information about the object. However, it is very important that the drawing produced to be accurate and clear. The ability to read and understand drawings is a skill that is very crucial for technical education students; this text aims at helping students to gain this skill in a simple and realistic way, and gradually progress through drawing and interpreting different level of engineering drawings. 1.1 Equipment Some basic equipment is necessary in order to learn drawing effectively, here are the main ones.
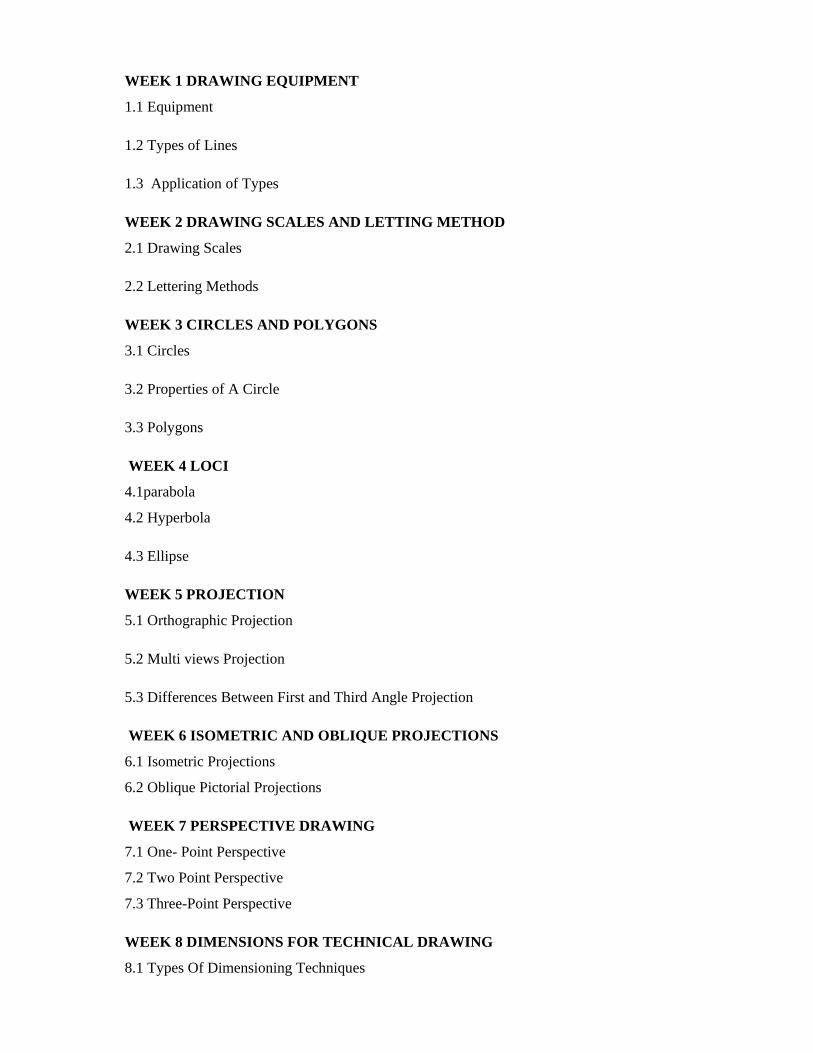
o T-square:
A T-square is a technical drawing instrument primarily used for drawing horizontal lines on a drafting table, it is also used to guide the triangle that is used to draw vertical lines. The name “T-square” comes from the general shape of the instrument where the horizontal member of the T (blade) slides on the side of the drafting table. Figure (1. 1)
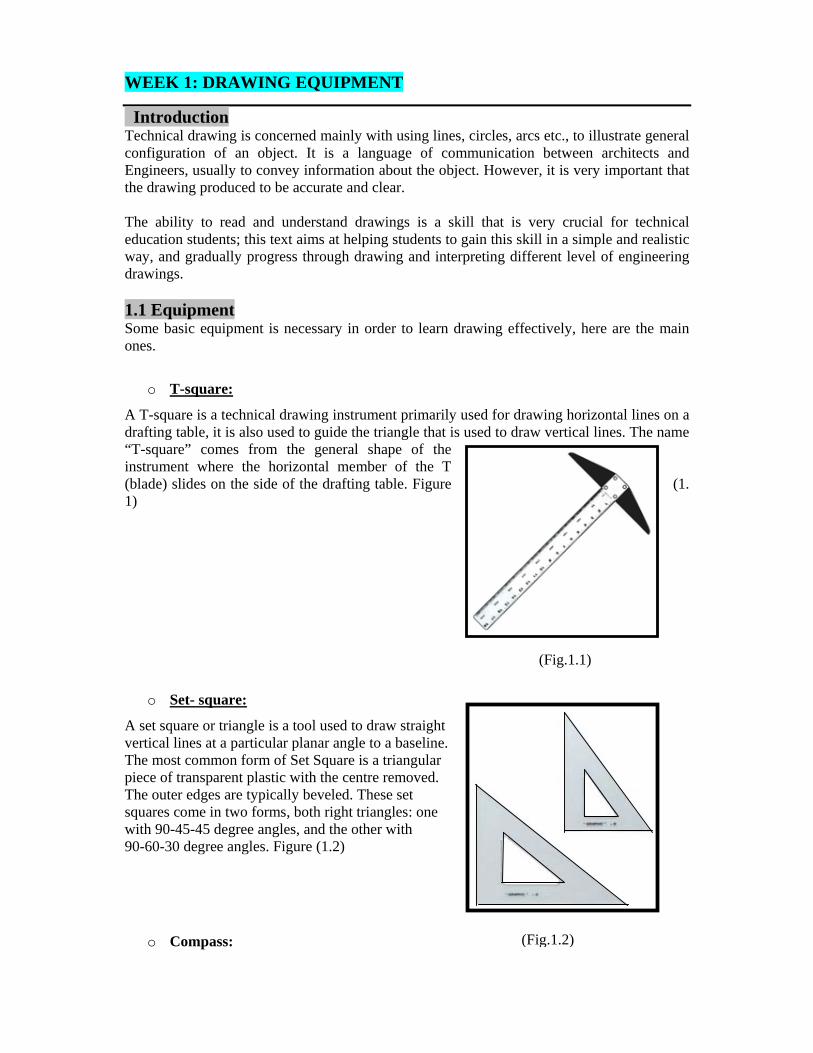
o Set- square:
A set square or triangle is a tool used to draw straight vertical lines at a particular planar angle to a baseline. The most common form of Set Square is a triangular piece of transparent plastic with the centre removed. The outer edges are typically beveled. These set squares come in two forms, both right triangles: one with 90-45-45 degree angles, and the other with 90-60-30 degree angles. Figure (1.2)
o Compass: (Fig.1.2)
(Fig.1.1)
Page 5
Compasses are usually made of metal, and consist of two parts connected by a hinge which can be adjusted. Typically one part has a spike at its end, and the other part a pencil. Circles can be made by pressing one leg of the compasses into the paper with the spike, putting the pencil on the paper, and moving the pencil around while keeping the hinge on the same angle. The radius of the circle can be adjusted by changing the angle of the hinge. Figure (1. 3)
o Drawing table:
It is a multi-angle desk which can be used in different angle according to the user requisite. The size suites most paper sizes, and are used for making and modifying drawings on paper with ink or pencil. Different drawing instruments such as set of squares, protractor, etc. are used on it to draw parallel, perpendicular or oblique lines. Figure (1. 4)
o Irregular Curves (French curves):
French curves are used to draw oblique curves other than circles or circular arc, they are irregular set of templates. Many different forms and sizes of curve are available. Figure (1. 5)
(Fig.1. 5)
(Fig.1.4)
(Fig.1.3)
Page 6
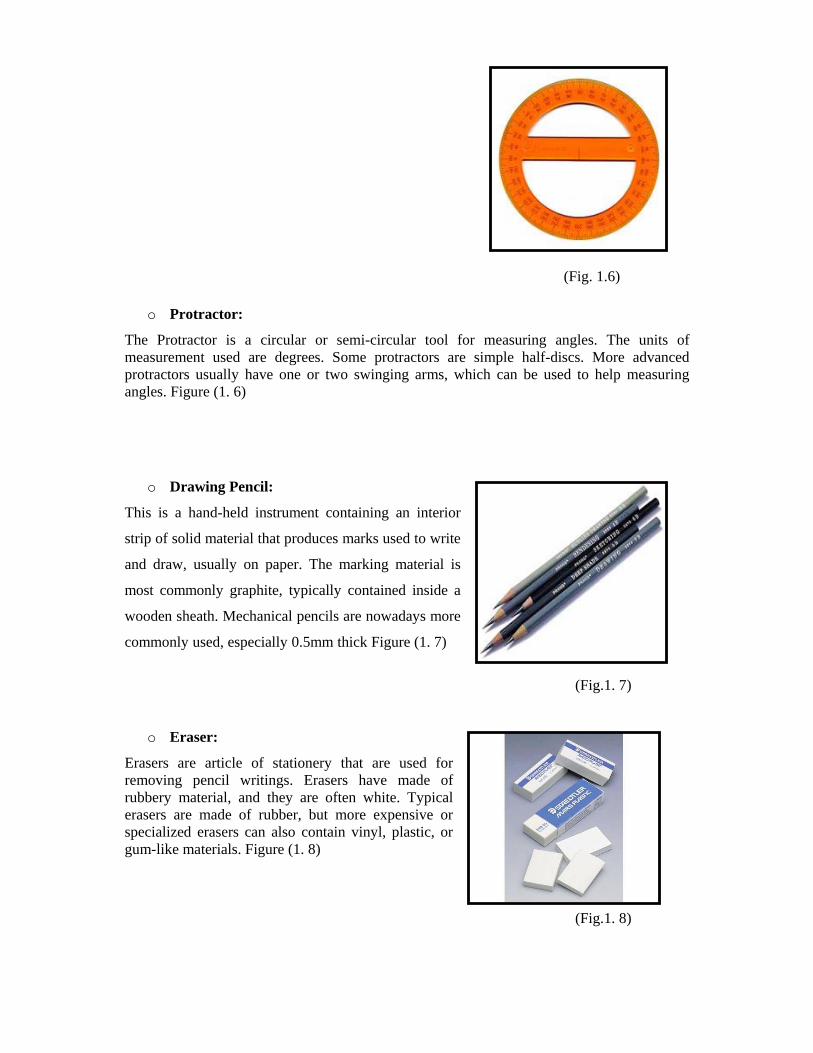
o Protractor:
The Protractor is a circular or semi-circular tool for measuring angles. The units of measurement used are degrees. Some protractors are simple half-discs. More advanced protractors usually have one or two swinging arms, which can be used to help measuring angles. Figure (1. 6)
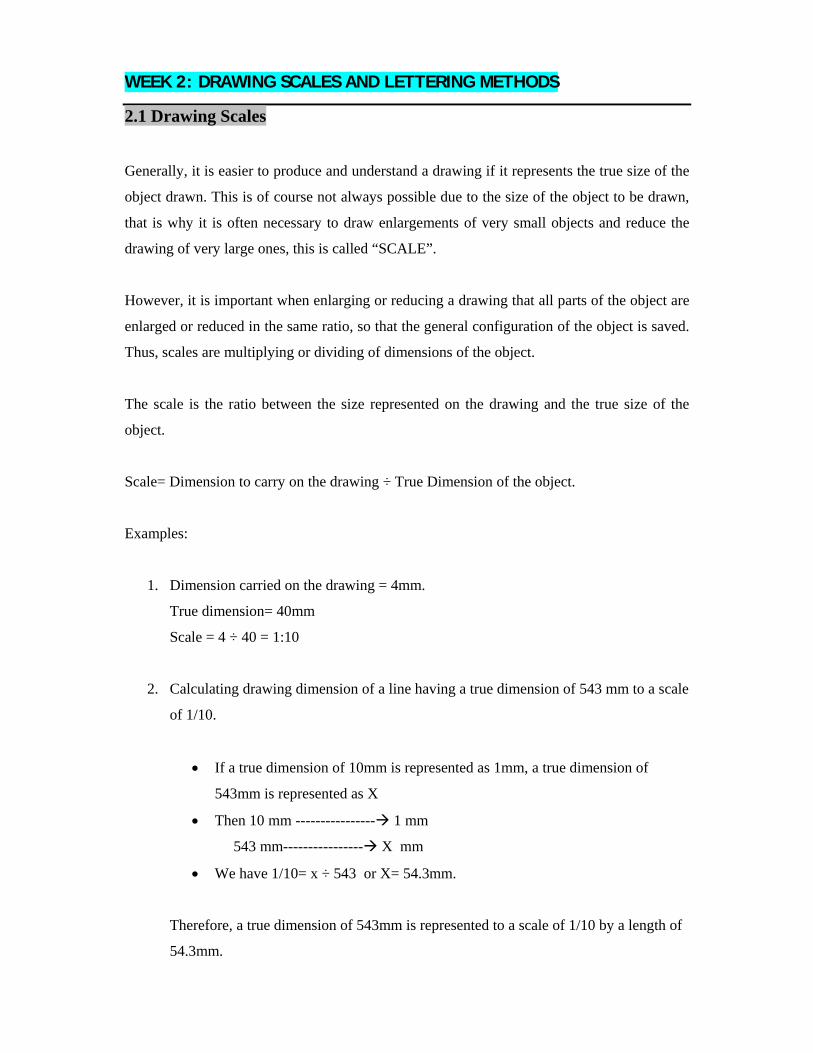
o Drawing Pencil:
This is a hand-held instrument containing an interior
strip of solid material that produces marks used to write
and draw, usually on paper. The marking material is
most commonly graphite, typically contained inside a
wooden sheath. Mechanical pencils are nowadays more
commonly used, especially 0.5mm thick Figure (1. 7)
(Fig.1. 7)
o Eraser:
Erasers are article of stationery that are used for removing pencil writings. Erasers have made of rubbery material, and they are often white. Typical erasers are made of rubber, but more expensive or specialized erasers can also contain vinyl, plastic, or gum-like materials. Figure (1. 8)
(Fig.1. 8)
(Fig. 1.6)
Page 7
1.2 Types of Lines:
Usually lines created are all of the same thickness and type, but lines on an engineering drawing signify more than just the geometry of the object, and it is important that appropriate line type is used in the right place, because each gives different meaning.
o Line Thickness
For most engineering drawings two thicknesses of lines are mainly required, a thick and thin one. The general recommendations are that thick lines to be twice as thick as the thin lines.
A thick line is used for visible leader edges and outline
A thin line is used for hatching, lines, short centre lines, dimensions and projections.
o Line Styles
Line styles are used to clarify important features on drawings, some examples are as shown below. Figure (1. 9)
(Fig.1. 9) – Line styles and types
Line styles are used to graphically represent physical objects, and each has its own meaning, these include the following:
• Visible lines - are continuous lines used to draw edges directly visible from a particular angle.
• Hidden lines- are short-dashed lines that may be used to represent edges that are not directly visible.
Page 8
1.3 Application of Types of Lines
Thick long chain line with arrow heads for sectioning
Ruled line with zig-zags to show continuity
Thin short dashes to indicate hidden details
Thick continuous line for outline of an object
(Fig. 1.11)
(Fig.1.10)
Page 9
WEEK 2: DRAWING SCALES AND LETTERING METHODS
2.1 Drawing Scales
Generally, it is easier to produce and understand a drawing if it represents the true size of the
object drawn. This is of course not always possible due to the size of the object to be drawn,
that is why it is often necessary to draw enlargements of very small objects and reduce the
drawing of very large ones, this is called “SCALE”.
However, it is important when enlarging or reducing a drawing that all parts of the object are
enlarged or reduced in the same ratio, so that the general configuration of the object is saved.
Thus, scales are multiplying or dividing of dimensions of the object.
The scale is the ratio between the size represented on the drawing and the true size of the
object.
Scale= Dimension to carry on the drawing ÷ True Dimension of the object.
Examples:
1. Dimension carried on the drawing = 4mm.
True dimension= 40mm
Scale = 4 ÷ 40 = 1:10
2. Calculating drawing dimension of a line having a true dimension of 543 mm to a scale
of 1/10.
• If a true dimension of 10mm is represented as 1mm, a true dimension of
543mm is represented as X
• Then 10 mm ---------------- 1 mm
543 mm---------------- X mm
• We have 1/10= x ÷ 543 or X= 54.3mm.
Therefore, a true dimension of 543mm is represented to a scale of 1/10 by a length of
54.3mm.
Page 10
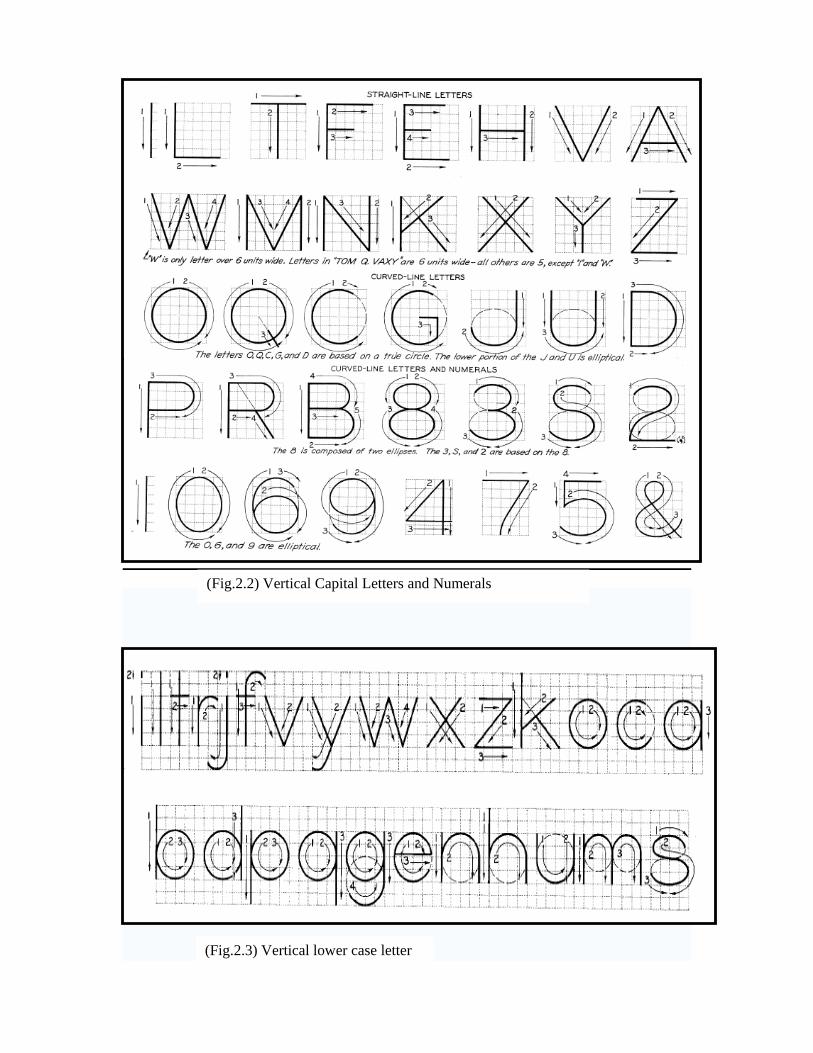
2.2 Lettering Methods
Lettering is more as freehand drawing and rather of being writing. Therefore the six
fundamental strokes and their direction for freehand drawing are basic procedures for
lettering.
There are a number of necessary steps in learning lettering, and they include the following:
• Knowledge of proposition and form of letters and the orders of the stroke.
• Knowledge of the composition the spacing of letters and words.
• Persistent practices.
Capital letters are preferred to lower case letters since they are easier to read on reduced size
drawing prints although lower case letters are used where they from of a symbol or an
abbreviation.
Attention is drawn the standard to the letters and characters. Table (2.1) below give the
recommendation for minimum size on particular drawing sheets:
(Fig.2. 1) An example of scaling a drawing
Page 11
Table (2.1) Recommendations for minimum size of lettering on drawing sheets
Application
Drawing Sheets Size
Minimum character height
Drawing numbers, etc.
A0, A1, A2 and A3
A4
5 mm
3 mm
Dimension and notes
A0
A1, A2, A3 and A4
3.5 mm
2.5 mm
The spaces between lines of lettering should be consistent and preferably not less than half of
the character height.
There are two fundamental methods of writing the graphic languages freehand and with
instruments. The direction of pencil movements are shown in Figure. (2.2) and (2.3).
Page 12
Vertical Capital Letters & Numerals
(Fig.2.3) Vertical lower case letter
(Fig.2.2) Vertical Capital Letters and Numerals
Page 13
Quiz Sheet (2):
1 Reproduce Figure (2.4) to a scale of 1:5.
2 Redraw Figure (2.5) to a scale of 3:1.
3 On a drawing sheet copy the following text in Figure (2.4) using the correct lettering
methods:
Page 14
WEEK3: CIRCLES AND POLYGONS
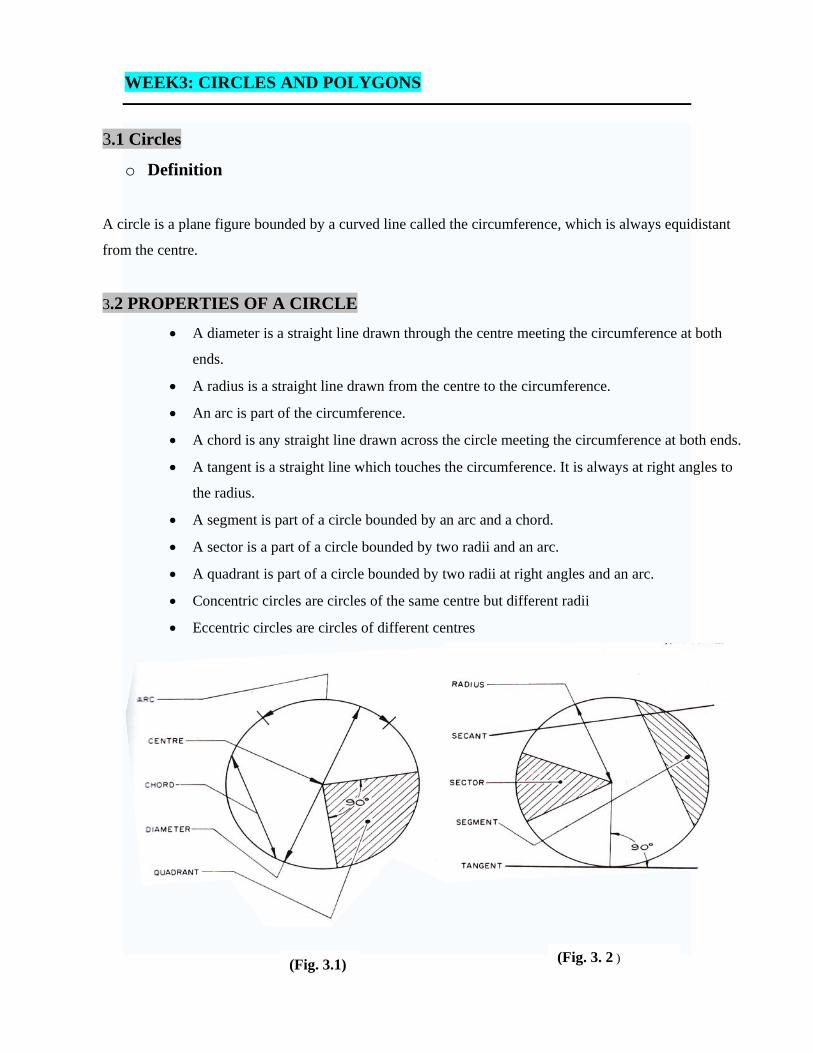
(Fig. 3. 2 )
3.1 Circles
o Definition
A circle is a plane figure bounded by a curved line called the circumference, which is always equidistant
from the centre.
3.2 PROPERTIES OF A CIRCLE
• A diameter is a straight line drawn through the centre meeting the circumference at both
ends.
• A radius is a straight line drawn from the centre to the circumference.
• An arc is part of the circumference.
• A chord is any straight line drawn across the circle meeting the circumference at both ends.
• A tangent is a straight line which touches the circumference. It is always at right angles to
the radius.
• A segment is part of a circle bounded by an arc and a chord.
• A sector is a part of a circle bounded by two radii and an arc.
• A quadrant is part of a circle bounded by two radii at right angles and an arc.
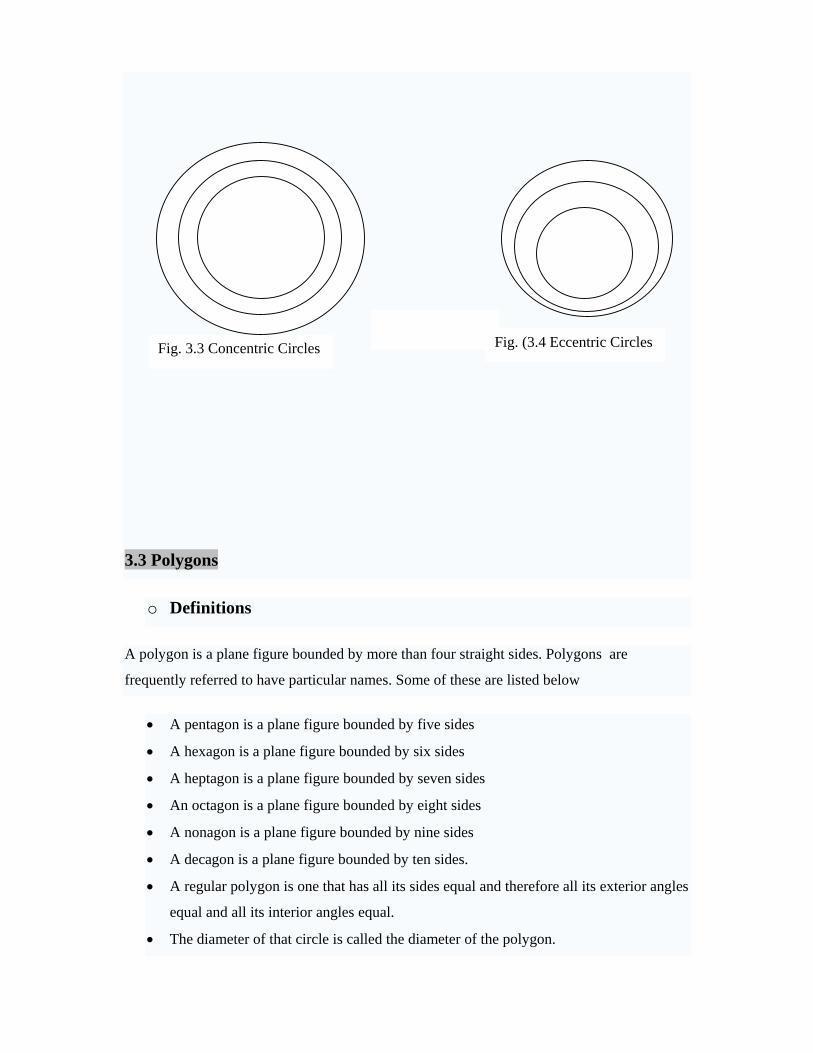
• Concentric circles are circles of the same centre but different radii
• Eccentric circles are circles of different centres
(Fig. 3.1)
Page 15
3.3 Polygons
o Definitions
A polygon is a plane figure bounded by more than four straight sides. Polygons are
frequently referred to have particular names. Some of these are listed below
• A pentagon is a plane figure bounded by five sides
• A hexagon is a plane figure bounded by six sides
• A heptagon is a plane figure bounded by seven sides
• An octagon is a plane figure bounded by eight sides
• A nonagon is a plane figure bounded by nine sides
• A decagon is a plane figure bounded by ten sides.
• A regular polygon is one that has all its sides equal and therefore all its exterior angles
equal and all its interior angles equal.
• The diameter of that circle is called the diameter of the polygon.
Fig. 3.3 Concentric Circles Fig. (3.4 Eccentric Circles
Page 16
• The diagonal of a polygon is the distance from one corner to the corner furthest away
from it.
o To construct a regular octagon given the diagonal, i.e. within a given circle
Steps
• Draw the circle and insert a diameter AE.
• Construct another diagonal CG, perpendicular to the first diagonal.
• Bisect the four quadrants thus produced to cut the circle in B, D, F, and H.
ABCDEFGH is the required octagon.
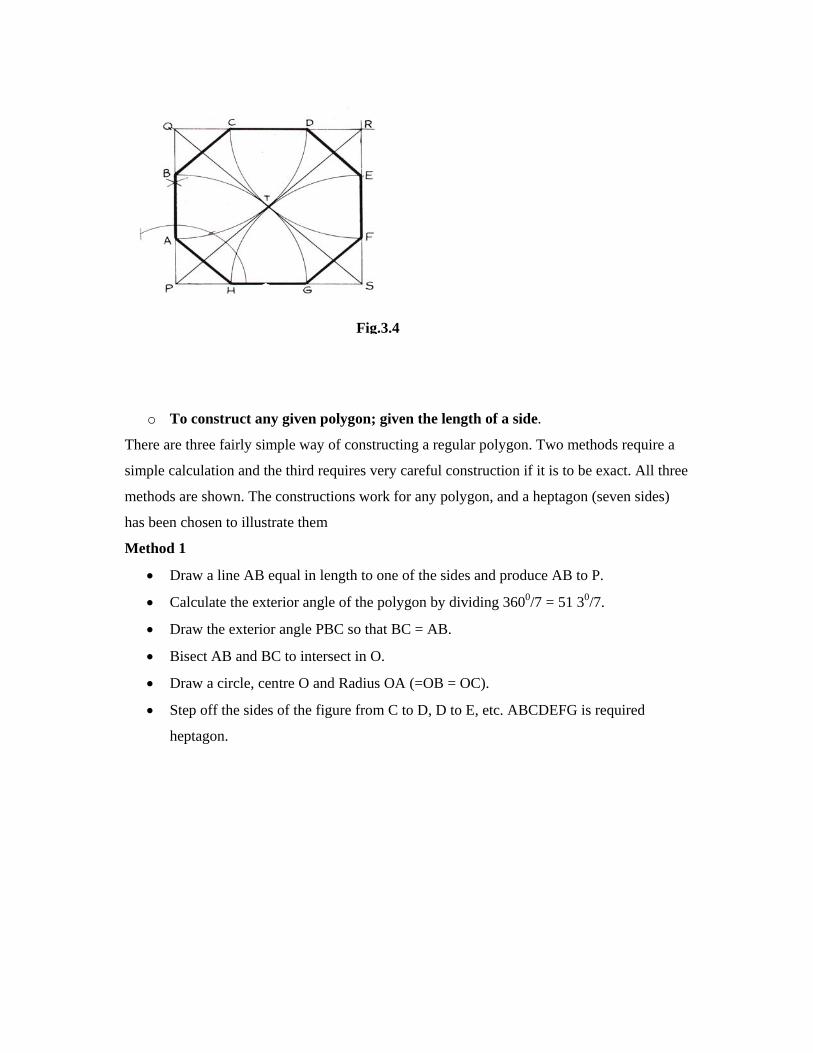
o To construct a rectangular octagon; given the diameter, i.e, within a given
square.
• Construct a square PQSR, length of side equal to the diameter.
• Draw the diagonals SQ and PR to intersect in T.
• With centres P, Q, R, and S draw four arcs, radius PT (=QT = RT=ST) to cut the
square in A, B, C, D, E, F, G and H.
ABCDEFGH is the required octagon.
(Fig. 3.3.)
Page 17
o To construct any given polygon; given the length of a side.
There are three fairly simple way of constructing a regular polygon. Two methods require a
simple calculation and the third requires very careful construction if it is to be exact. All three
methods are shown. The constructions work for any polygon, and a heptagon (seven sides)
has been chosen to illustrate them
Method 1
• Draw a line AB equal in length to one of the sides and produce AB to P.
• Calculate the exterior angle of the polygon by dividing 3600/7 = 51 30/7.
• Draw the exterior angle PBC so that BC = AB.
• Bisect AB and BC to intersect in O.
• Draw a circle, centre O and Radius OA (=OB = OC).
• Step off the sides of the figure from C to D, D to E, etc. ABCDEFG is required
heptagon.
Fig.3.4
Page 18
Method 2
• Draw a line AB equal in length to one of the sides
• From a, erect a semi –circle, radius AB to meet BA produced in P.
• Divide the semi circle into the same number of equal parts as the proposed polygon
has sides. This may be done by trial and error or by calculation (1800 /7 = 25 50/7 for
each arc).
• Draw a line from A to point 2 (For all polygons). This forms a second side to the
polygon.
• Bisect AB and A2 to intersect in O.
• With centre O draw a circle, radius OB ( =OA = O2).
• Step off the sides of the figure from B to C, C to D etc.
ABCDEFG is the required septagon.
(Fig.3. 5)
Page 19
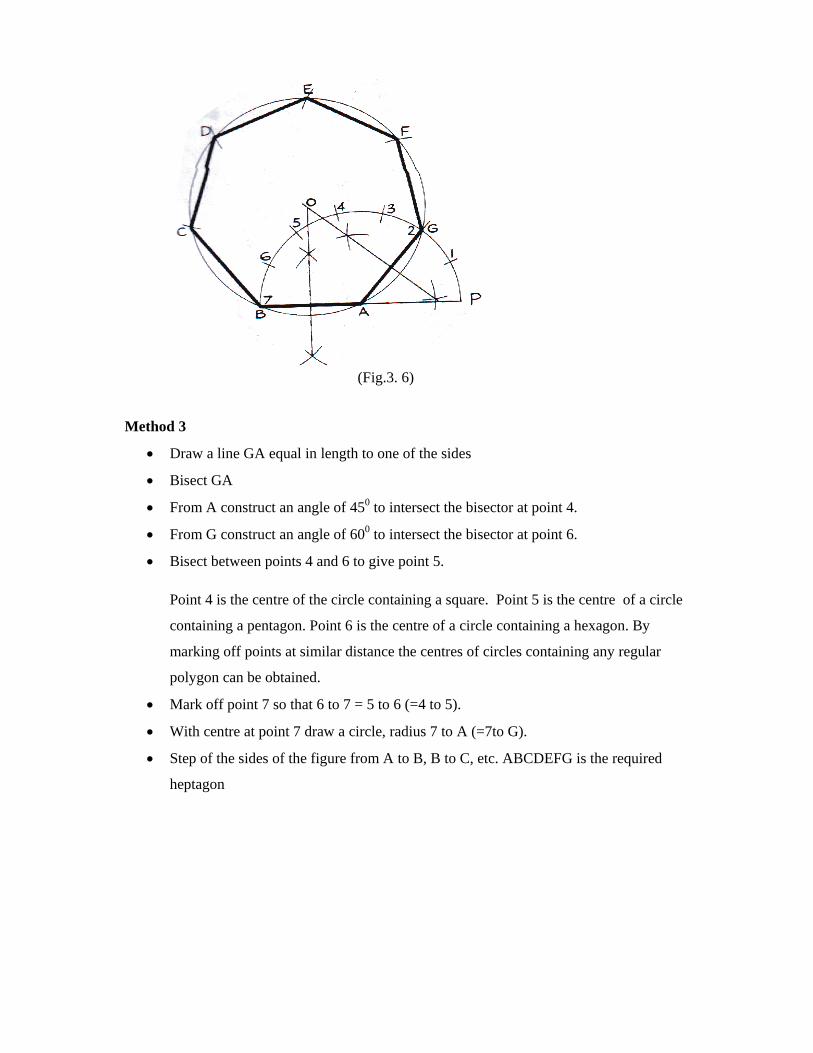
Method 3
• Draw a line GA equal in length to one of the sides
• Bisect GA
• From A construct an angle of 450 to intersect the bisector at point 4.
• From G construct an angle of 600 to intersect the bisector at point 6.
• Bisect between points 4 and 6 to give point 5.
Point 4 is the centre of the circle containing a square. Point 5 is the centre of a circle
containing a pentagon. Point 6 is the centre of a circle containing a hexagon. By
marking off points at similar distance the centres of circles containing any regular
polygon can be obtained.
• Mark off point 7 so that 6 to 7 = 5 to 6 (=4 to 5).
• With centre at point 7 draw a circle, radius 7 to A (=7to G).
• Step of the sides of the figure from A to B, B to C, etc. ABCDEFG is the required
heptagon
(Fig.3. 6)
Page 20
o To construct a regular polygon given a diagonal i.e. within a given circle
• Draw the given circle and insert a diameter AM.
• Divide the diameter into the same number of diversions as the polygon has sides.
• With centre M draw an arc, radius MA. With centre A draw another arc of the same
radius to intersect the first arc in N.
• Draw N2 and produce to intersect the circle in B (for any polygon).
• AB is the first side of the polygon. Step out the other sides BC, CD, etc.
• ABCDE is the required polygon.
• draw the given circumference AB
• Bisect AB in C.
• With centre C, and radius CA, Draw a semi – circle.
• With centre B and radius BC, draw an arc to cut the semi-circle in D.
• From D draw perpendicular to AB, to cut AB in E.
• With centre E and radius ED draw an arc to cut AB in F. AF is the required diameter.
The rest of this chapter shows the construction for finding circles drawn to satisfy certain
gain conditions.
(Fig.3. 7)
Page 21
Quiz Sheet (3):
1. Draw a polygon of any number of sides in the figure below.
2. Construct a nonagon and a heptagon on the same base of 45mm using method 3.
(Fig. 3.8)
(Fig.3.9)
120mm
Page 22
WEEK (4) - LOCI A locus (Plural loci) is the path traced out by a point which moves under given definite
conditions or rules. You may not have been aware of it, but you have met loci many times
before. One of the most common loci is that of a point which moves so that its distance from
another fixed point remains constant: this produces a circle. Another locus that you know is
that of a point which moves so that its distance from a line remains constant: this produces
parallel lines.
The problems of loci can take several different forms. One important practical application in
building is in the setting out of curves such as parabolic, hyperbolic and circular curves.
Another important application of loci in engineering is finding the path traced out by points
on mechanisms. This may be simply to see if there is sufficient clearance around a
mechanism.
4.1 Parabola This is the locus of a point which moves such that its distance from a fixed point called the
focus bears a constant ratio usually equal to 1 to its perpendicular distance from a straight line
called the directrix.
Figure 1 shows how to draw a parabola given the relative positions of the focus and the
directrix. In this case the focus and directrix are 20mm apart.
The first point to plot is the one that lies between the focus and the directrix. By definition it
is the same distance, 10mm, from both.
The condition of the locus is that it is always the same distance from the focus as it is from
directrix. The parabola is therefore found by plotting the intersections of radii 15mm, 20mm,
30mm, etc. Centre on the focus, with lines drawn parallel to the directrix at distances 15mm,
20mm, 30mm, etc.
Page 23
-
4.2 Hyperbola
o Definition A hyperbola is the locus of a point which moves so that its distance from a fixed point (called
the focus) bears a constant ratio, always greater than 1, to its perpendicular distance from a
straight line (called the directrix.
Figure 2 shows how to draw a hyperbola given the relative positions of the focus and the
directrix (in this case 20mm) and the eccentricity (3/2)
The first point to plot is the one that lies between the focus and the directrix. This is done by
dividing the distance between them in the same ratio as the eccentricity.3:2.
The condition for the locus is that it is always 2/3 as far from the directrix as it is from the
focus. Thus, if the point is 15mm from the focus, it is 2/3 x 15mm from the directrix; if it is
20mm from the focus, it is 2/3 x 20mm from the directrix. This is continued for as many
points as may be required.
(Fig. 4.1)
Page 24
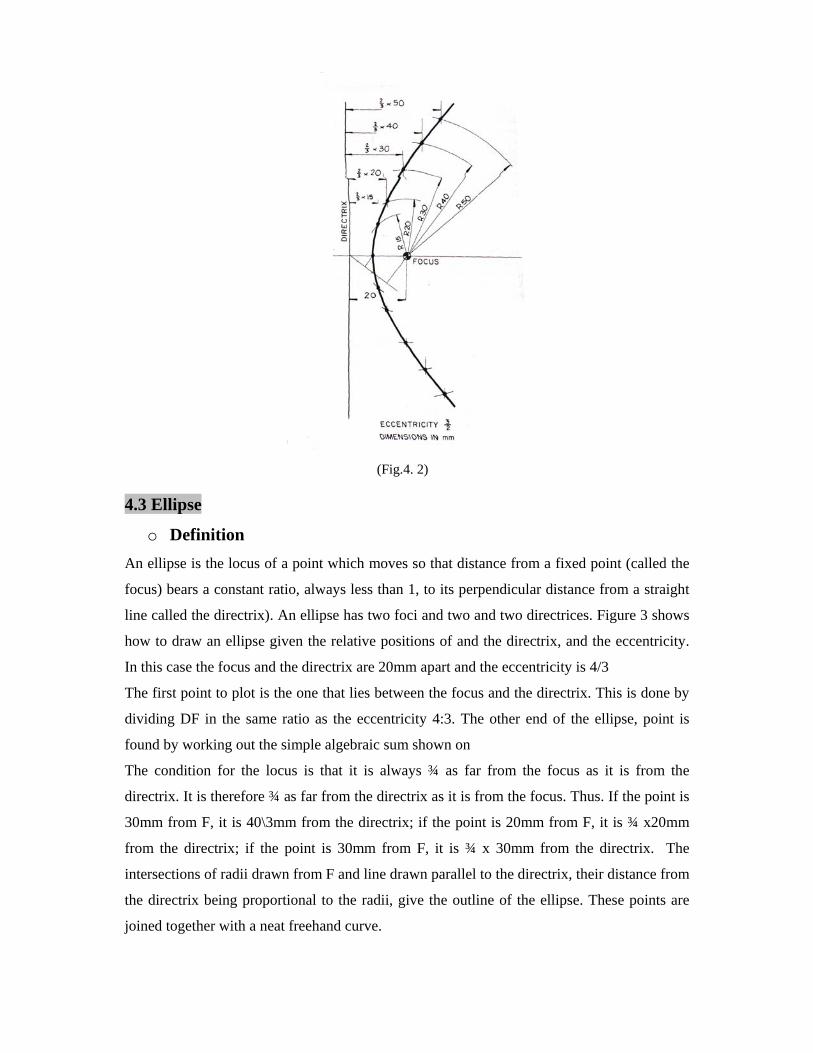
4.3 Ellipse
o Definition An ellipse is the locus of a point which moves so that distance from a fixed point (called the
focus) bears a constant ratio, always less than 1, to its perpendicular distance from a straight
line called the directrix). An ellipse has two foci and two and two directrices. Figure 3 shows
how to draw an ellipse given the relative positions of and the directrix, and the eccentricity.
In this case the focus and the directrix are 20mm apart and the eccentricity is 4/3
The first point to plot is the one that lies between the focus and the directrix. This is done by
dividing DF in the same ratio as the eccentricity 4:3. The other end of the ellipse, point is
found by working out the simple algebraic sum shown on
The condition for the locus is that it is always ¾ as far from the focus as it is from the
directrix. It is therefore ¾ as far from the directrix as it is from the focus. Thus. If the point is
30mm from F, it is 40\3mm from the directrix; if the point is 20mm from F, it is ¾ x20mm
from the directrix; if the point is 30mm from F, it is ¾ x 30mm from the directrix. The
intersections of radii drawn from F and line drawn parallel to the directrix, their distance from
the directrix being proportional to the radii, give the outline of the ellipse. These points are
joined together with a neat freehand curve.
(Fig.4. 2)
Page 25
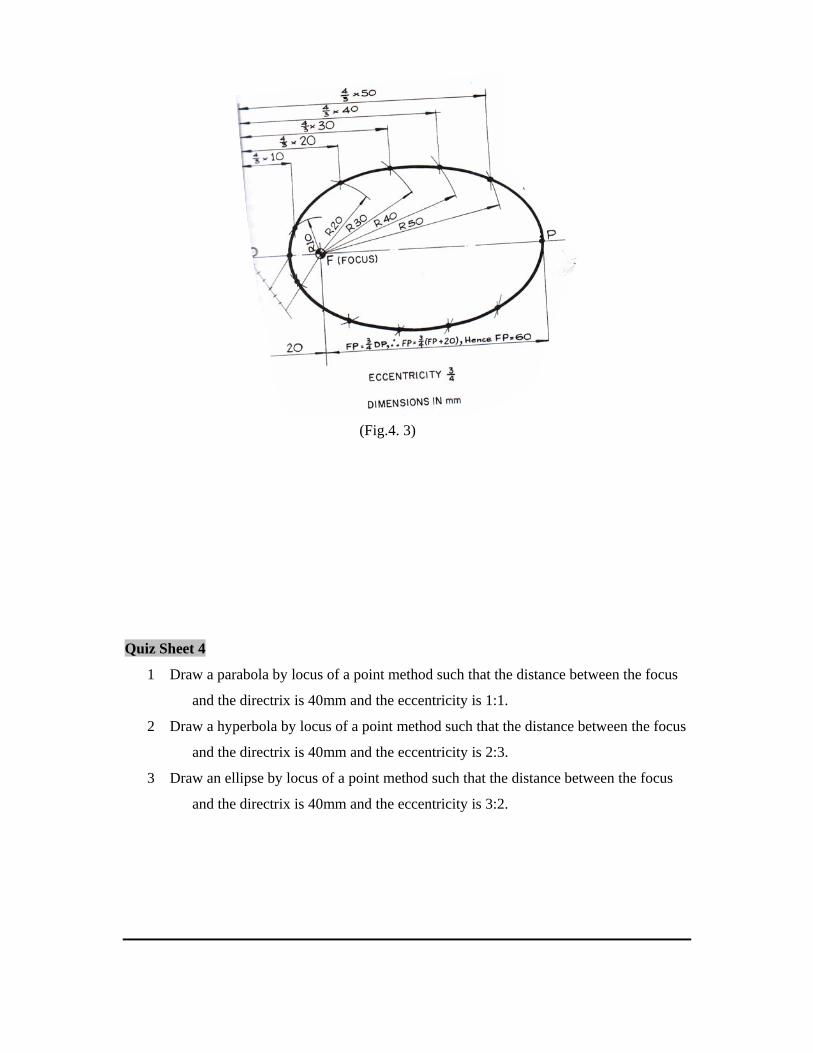
Quiz Sheet 4
1 Draw a parabola by locus of a point method such that the distance between the focus
and the directrix is 40mm and the eccentricity is 1:1.
2 Draw a hyperbola by locus of a point method such that the distance between the focus
and the directrix is 40mm and the eccentricity is 2:3.
3 Draw an ellipse by locus of a point method such that the distance between the focus
and the directrix is 40mm and the eccentricity is 3:2.
(Fig.4. 3)
Page 26
WEEK5: PROJECTIONS
The technique of representing an object in a drawn form is referred to as projection.
Projection can be divided into pictorial (3- dimensional) projection and orthographic (2-
dimensional) projection. Pictorial projection is further divided into isometric, oblique and
perspective projections; while the orthographic projection is divided into 1st angle and 3rd
angle projection as shown in Figure (5.1).
PROJECTIONS
Pictorial Projection Orthographic Projection (3 – Dimensional Projection) (2 – Dimensional Projection)
Isometric Oblique Perspective 1st -angle 3rd –angle
1-point 2-point 3 -point
Cabinet Cavalier
5.1 Orthographic projection is a means of representing a three-dimensional object
Figure (5.1) in two dimensions (2D). It uses multiple views of the object, from points of view
rotated about the object's center through increments of 90°.
(Fig.5. 1)
Page 27
The views are positioned relative to each other according to either of two schemes: first-
Angle or third-Angle projection. In each, the appearances of views may be thought of as
being projected onto planes that form a transparent "box" around the object. Figure (5.2)
demonstrate the views of an object using 1St. Angle and 3rd. Angle projections.
Illustrating the difference between 1st. and 3rd. Angles projection
(Fig 5.2)
Fig 5.3 Fig 5.4
Page 28
5.2 Multi views projection:
Multi views projection is a mean of producing the true shape and dimension of all details of
three-dimensional object or two-dimensional plane surface such as tile drawing paper. For
this reason, this method of projection is universally used for the production of working
drawing, which is intended for manufacturing purposes.
(Fig.5. 5) Multi-views projection
In multi-views projection, the observer looks directly at each face of the object and draws
what can be seen directly (90 Degree rays). Concretively, other sides are also seen and drawn
in the same way Figure (5. 5).
Hence, there are two system of multi-views projection that is acceptable as British standard
(Fig. 6), these are known as:
o First Angle (1st Angle) or European projection.
o Third Angle (3rd Angle) or American projection.
Page 29
5.3 The Differences Between 1st & 3rd Angle Projection
o First-angle projection
In first-angle projection, each view of the object is projected in the direction (sense) of sight
of the object, onto the interior walls of the box Figure (5.6).
(Fig. 5. 6)
A two-dimensional representation of the object is then created by "unfolding" the box, to
view all of the interior walls Figure (5.7)
Page 30
(Fig.5.7)
o Third-angle projection
In third-angle projection, each view of the object is projected opposite to the direction
(sense) of sight, onto the (transparent) exterior walls of the box Figure (5. 9).
(Fig. 5.8)
(Fig 5.10) (Fig 5.9)
Page 31
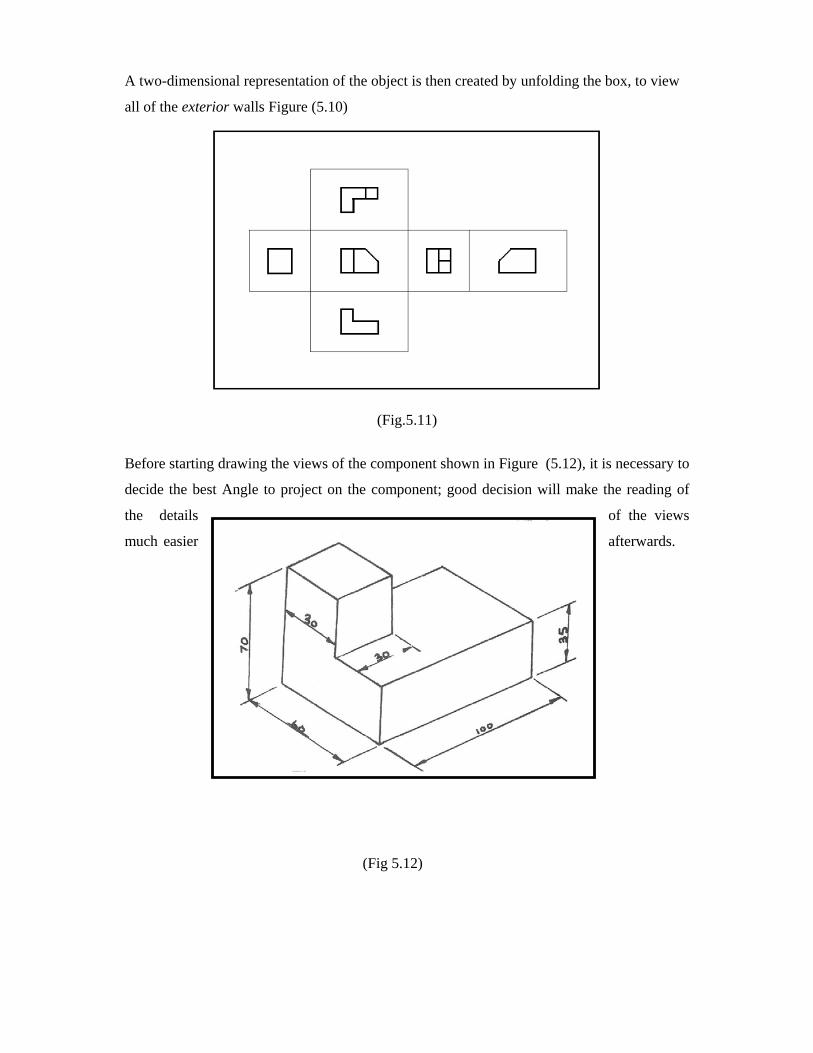
A two-dimensional representation of the object is then created by unfolding the box, to view
all of the exterior walls Figure (5.10)
(Fig.5.11)
Before starting drawing the views of the component shown in Figure (5.12), it is necessary to
decide the best Angle to project on the component; good decision will make the reading of
the details of the views
much easier afterwards.
(Fig 5.12)
Page 32
Also it is important to layout the drawing sheet so as to have a neat presentation at the end.
One of the common methods to layout the drawing sheet is shown through the following step
(Let us assume that three views are needed):
• Identify the size of the drawing sheet after minimizing 10mm from each side for the
frame (A-3 in this case= 400 X 277 after framing).
• Draw in free hand on a scrap paper the location of the three views, and determine the area
needed for each view (width and height) Figure (5.13).
(Fig.5.13)
Now, to determine the spacing between the views Figure (5.14), it is noticed that,
Three equal spaces are horizontally situated.
Three equal spaces are vertically situated.
Page 33
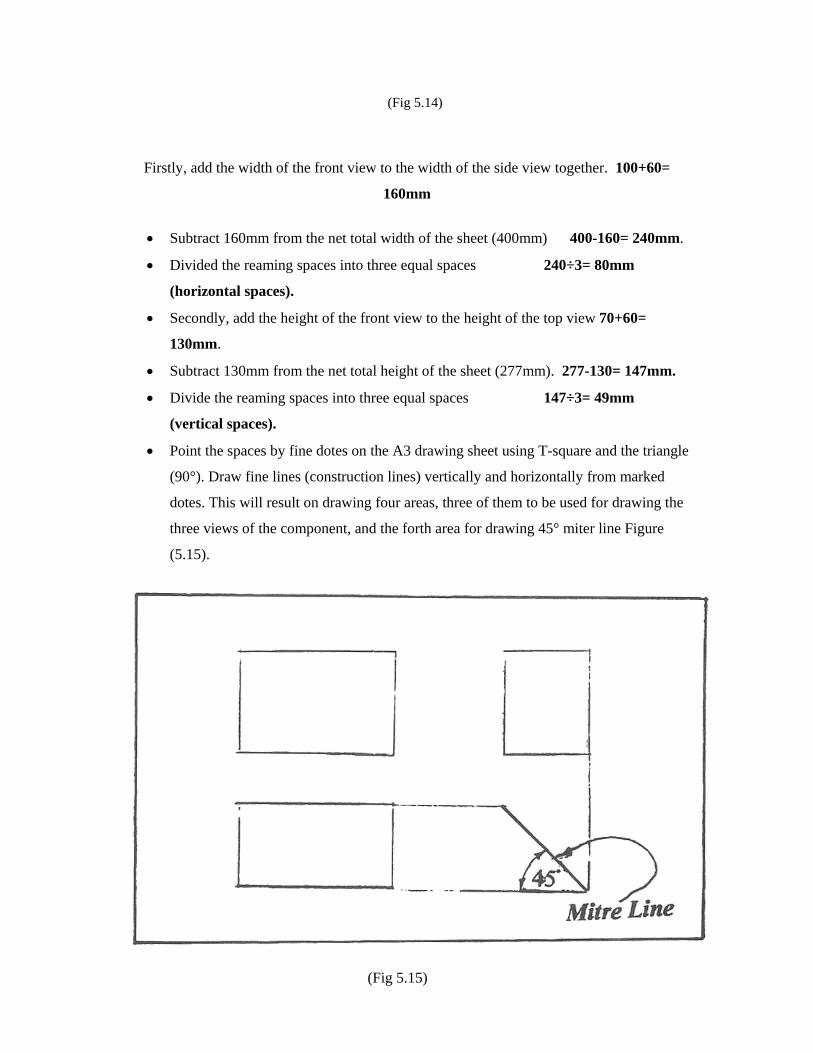
Firstly, add the width of the front view to the width of the side view together. 100+60=
160mm
• Subtract 160mm from the net total width of the sheet (400mm) 400-160= 240mm.
• Divided the reaming spaces into three equal spaces 240÷3= 80mm
(horizontal spaces).
• Secondly, add the height of the front view to the height of the top view 70+60=
130mm.
• Subtract 130mm from the net total height of the sheet (277mm). 277-130= 147mm.
• Divide the reaming spaces into three equal spaces 147÷3= 49mm
(vertical spaces).
• Point the spaces by fine dotes on the A3 drawing sheet using T-square and the triangle
(90°). Draw fine lines (construction lines) vertically and horizontally from marked
dotes. This will result on drawing four areas, three of them to be used for drawing the
three views of the component, and the forth area for drawing 45° miter line Figure
(5.15).
(Fig 5.15)
(Fig 5.14)
Page 34
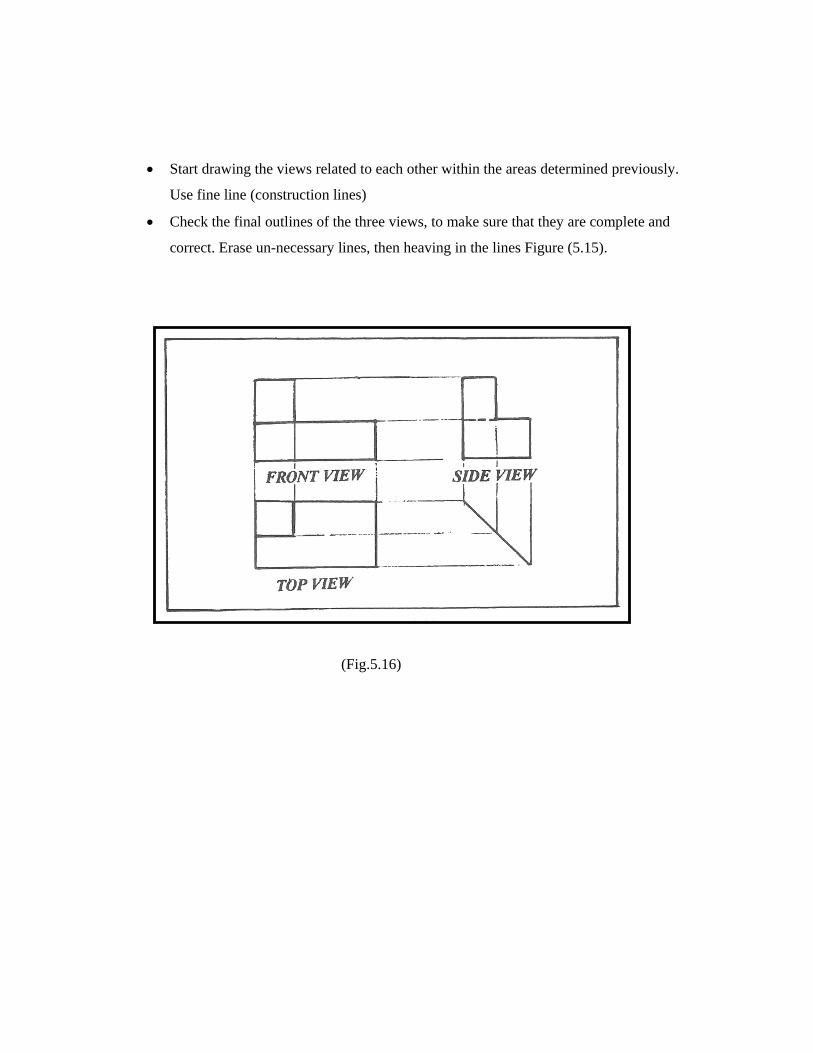
• Start drawing the views related to each other within the areas determined previously.
Use fine line (construction lines)
• Check the final outlines of the three views, to make sure that they are complete and
correct. Erase un-necessary lines, then heaving in the lines Figure (5.15).
(Fig.5.16)
Page 35
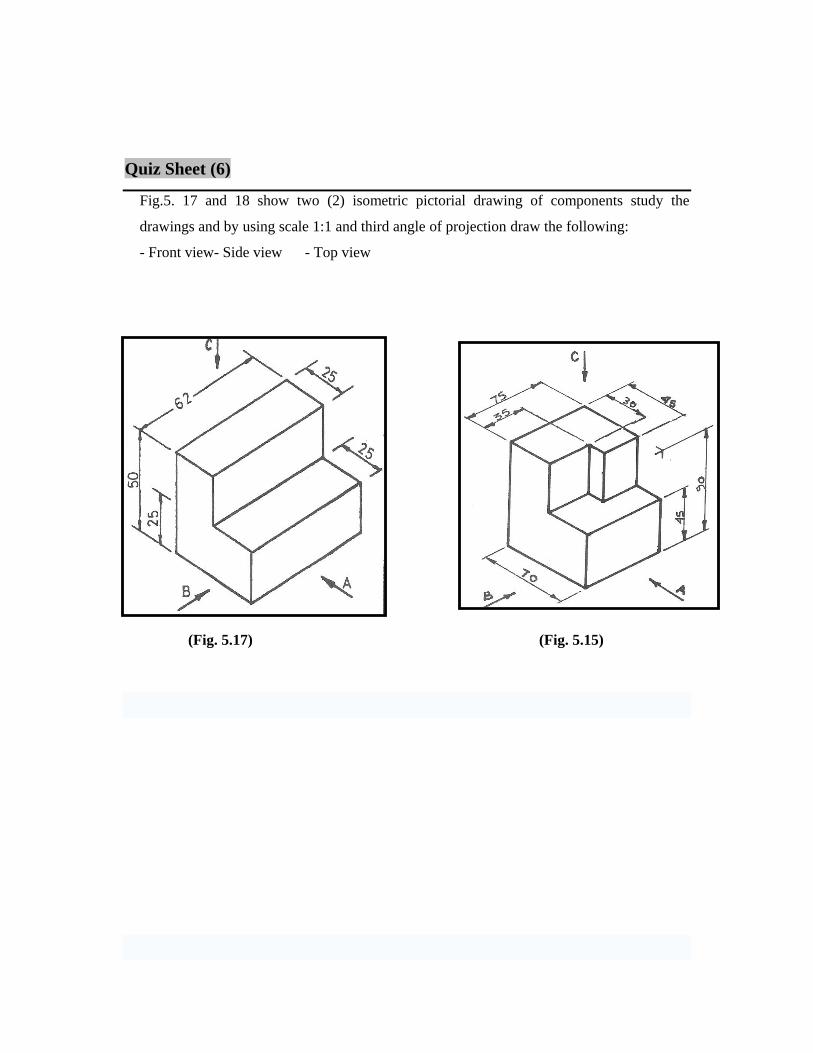
Quiz Sheet (6)
Fig.5. 17 and 18 show two (2) isometric pictorial drawing of components study the
drawings and by using scale 1:1 and third angle of projection draw the following:
- Front view- Side view - Top view
(Fig.5.18)
(Fig. 5.15) (Fig. 5.17)
Page 36
Fig.(5.19) and 20 show two (2) isometric pictorial drawing of components study the drawings
and by using scale 1:1 draw the following:
• Fig.(5.19) using 1st angle of projection draw,
1- Front view 2 -Side view 3- Top view
• Fig.5. 20 using 3rd angle of projection draw,
1- Front view 2-Side view 3 - Top view
(Fig.5.20)
(Fig.5.19)
Page 37
WEEK (6) - ISOMETRIC AND OBLIQUE PROJECTIONS
6.1 Isometric Projection Isometric projection is a pictorial projection which gives a 3-dimentional impression of a
drawn object in one view. Isometric projection has the advantage of communicating
information about an object easily than orthographic projection as such it is preferred by
laymen.
Figures (6.1) to (6.4) show four (4) isometric pictorial drawing of components, study the
awn drawings and by using proper drawing tools and scale 1:1 re-draw the isometric
pictorial drawings.
Note: All dimensions are in mm
(Fig 6.1) (Fig 6.2)
(Fig. 6.3) (Fig 6.4) (Fig.6.3)
Page 38
6.2 Oblique Pictorial Projection
Oblique projection is another method of pictorial drawing. It is simpler than isometric but it
does not present so realistic a picture.
Figure ( 6.5) shows a shaped block drawn in oblique projection.
There are three drawings of the same block in fig6.6. They all show the front face of the
block drawn in the plane of the paper and the side and top faces receding at 30o, 45o and 60o
on the three drawings. An oblique line is one which is neither vertical nor horizontal, and the
receding lines in oblique projection can be at any angle other than 0o or 90o as long as they
remain parallel in any one drawing. In practice, it is usual to keep to the set square angles and
of the three to choose from, 45o is the most widely used.
If you check the measurement on the oblique drawings with those on the isometric sketch,
you will find that the measurements on the front and oblique faces are all true lengths. This
gives rise to a distorted effect. The drawings of the block in the oblique view appear to be cut
out of proportion, particularly when compared with the isometric view.
(Fig. 6.5)
Page 39
(Fig 6.6)
QUIZ SHEET (6)
Figures (6.7) to (6.10) shows four (4) isometric pictorial drawing of components, study the
drawings and by using proper drawing tools and scale 1:1 re-draw them in isometric
projection.
Note: All dimensions are in mm
Page 40
(Fig 6.7) (Fig. 6.8)
(Fig. 6.9) ( Fig. .10)
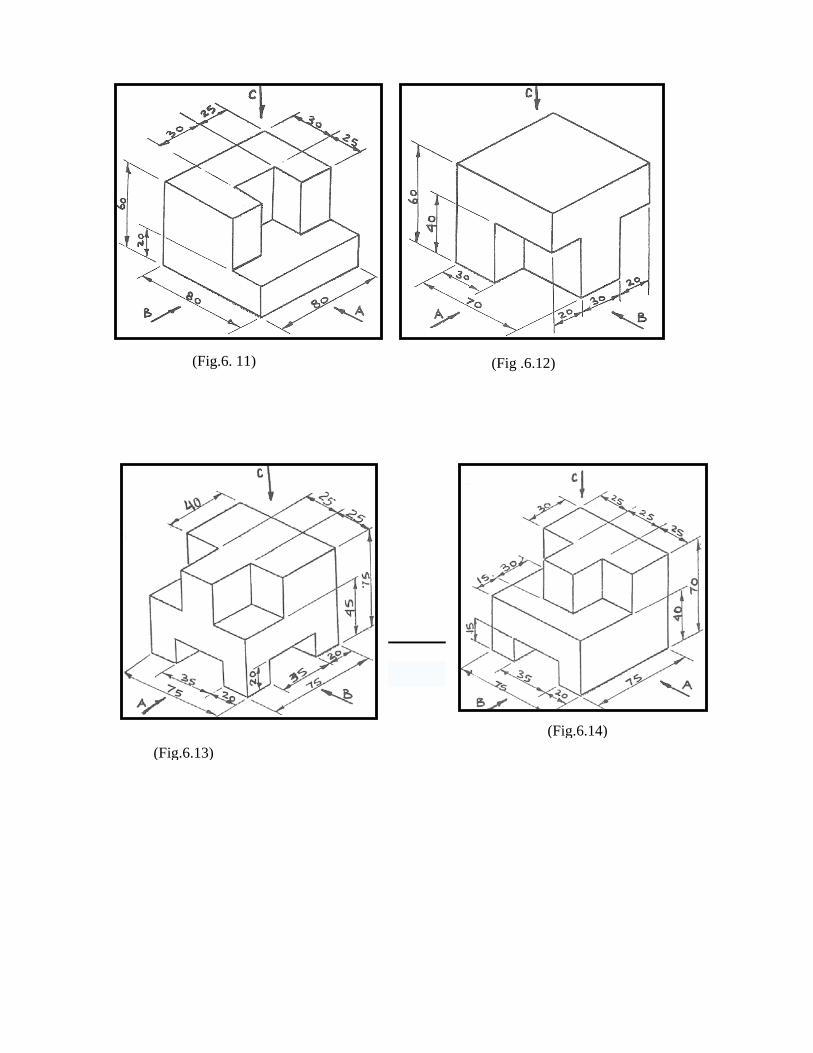
Figures (6.11) to (6.14) illustrate four (4) isometric pictorial drawing of components, study the
drawing and by using scale 1:1 re-draw them in oblique projection of 30o,45o and 60o.
Note: All dimensions are in mm
Page 41
(Fig.6. 11) (Fig .6.12)
(Fig.6.14) (Fig.6.13)
Page 42
WEEK (7): PERSPECTIVE DRAWING
Introduction
Perspective drawings are design drawings that convey more or less the actual appearance of
the building or object and are therefore of considerable value in enabling layman to
appreciate points of design which are not easily understood by them from autographic
projections. There are a number of ways of setting up perspectives and the under laying
theories are complex.
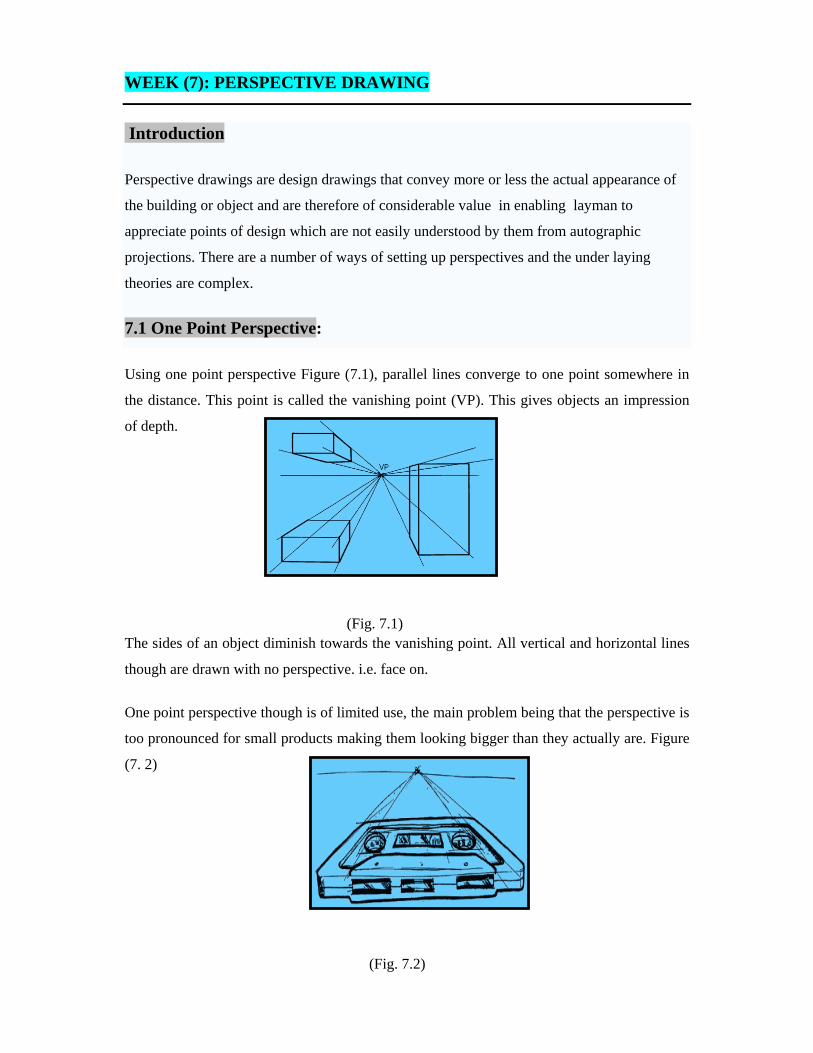
7.1 One Point Perspective:
Using one point perspective Figure (7.1), parallel lines converge to one point somewhere in
the distance. This point is called the vanishing point (VP). This gives objects an impression
of depth.
The sides of an object diminish towards the vanishing point. All vertical and horizontal lines
though are drawn with no perspective. i.e. face on.
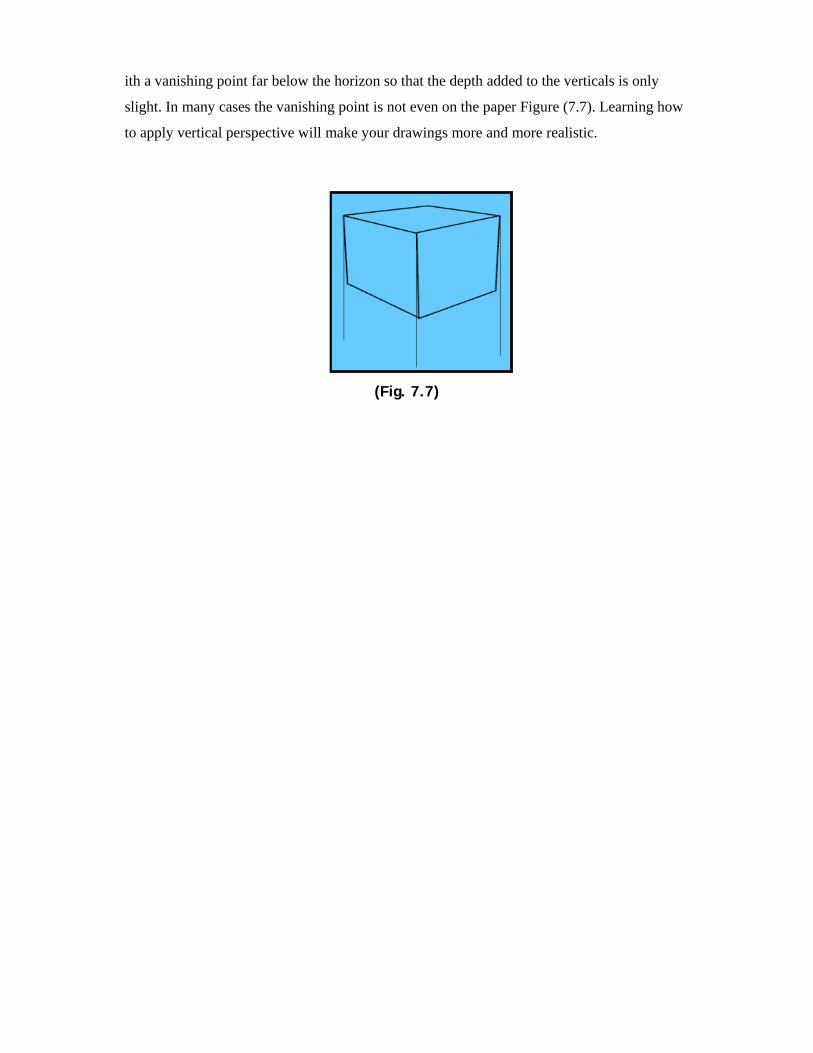
One point perspective though is of limited use, the main problem being that the perspective is
too pronounced for small products making them looking bigger than they actually are. Figure
(7. 2)
(Fig. 7.1)
(Fig. 7.2)
Page 43
Although it is possible to sketch products in one point perspective, the perspective is too
aggressive on the eye making products look bigger than they actually are. Figure (7. 3).
7.2 Two Point Perspective
Two Points Perspective is a much more useful drawing system than the simpler One Point
Perspective. Objects drawn in two point perspective have a more natural look Figure (7. 4).
In two point perspective the sides of the object vanish to one of two vanishing points on the
horizon. Vertical lines in the object have no perspective applied to them.
(Fig. 7.3)
(Fig.7.4)
Page 44
By altering the proximity of the vanishing points to the object, you can make the object look
big or small Figure (7.5).
7.3 Three Point Perspective
Three points perspective is a development of two point’s perspective. Like two point it has
two vanishing points somewhere on the horizon. But three points perspective also has a
vanishing point somewhere above or below the horizon which the vertical vanish to.
The nearer the vanishing point is to the object, the bigger the object looks. Look at these
buildings Figure (7.6), all the vanishing points are too close. This has caused an excessive
amount of vertical perspective. Learning how to apply vertical perspective is the key to
making your drawings realistic.
In general most designers create drawings w
(Fig. 7.5)
(Fig7.6)
Page 45
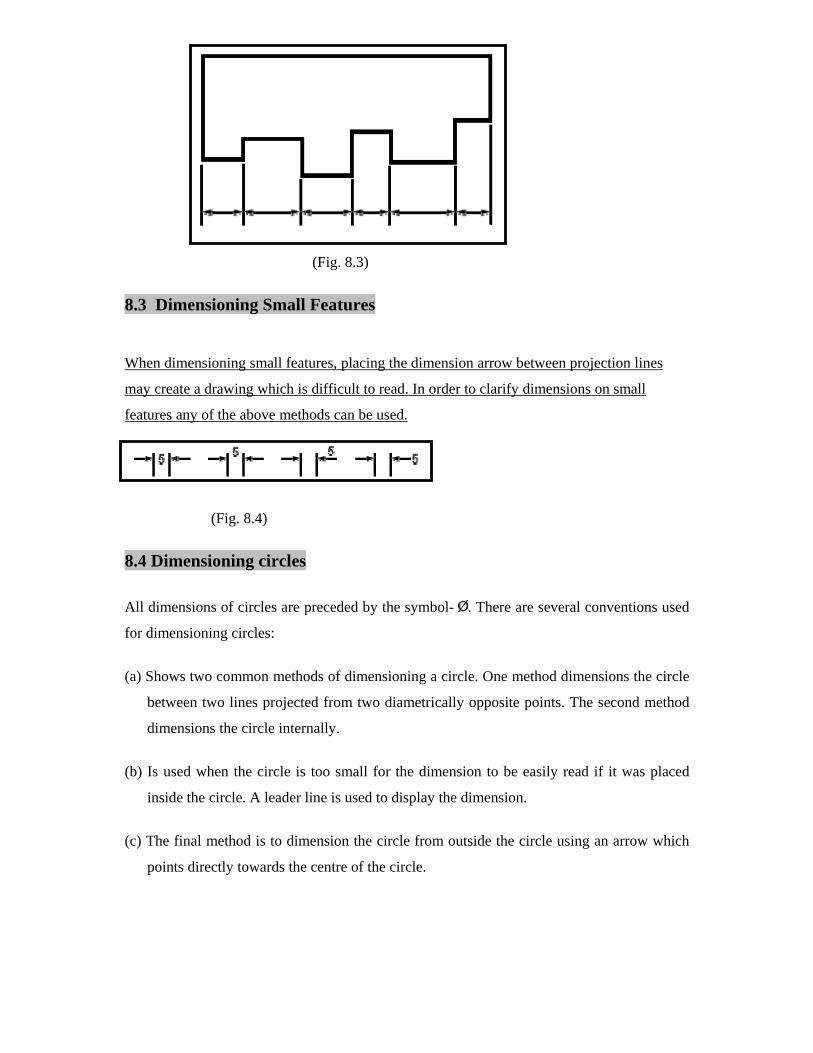
ith a vanishing point far below the horizon so that the depth added to the verticals is only
slight. In many cases the vanishing point is not even on the paper Figure (7.7). Learning how
to apply vertical perspective will make your drawings more and more realistic.
(Fig. 7.7)
Page 46
WEEK (8): DIMENSIONS FOR TECHNICAL DRAWING
An engineering drawing must be properly dimensioned in order to convey the designer’s
intent to the end user. Dimensions provide the information needed to specify the size and
location of every feature on the object.
A properly dimensioned drawing ensures that the part produced in the manufacturing phase
matches the part asked for by designer. There are a few simple guidelines to be followed
when dimensioning a drawing and these guidelines covers the majority of cases you will
encounter.
A number of terms are used for illustrating dimensioning on the drawing, these include the
following Fig. (8.1):
• Dimension line.
• Projection line.
• Dimension.
• Leader line.
• Dimensional notes.
• Auxiliary dimension.
(Fig.8.1)
The basic rules of dimensioning are:
• Distribute dimensions between the views.
Page 47
• Keep the dimension line about 10mm apart from the object.
• Do not repeat dimensioning same distance.
• If possible do not dimension hidden lines.
• Stagger dimensioning values.
• Create a logical arrangement of dimensions.
8.1 Types of Dimensioning techniques
• Parallel Dimensioning Parallel dimensioning consists of several dimensions
originating from one projection line.
(Fig.8.2)
8.2 Chain Dimensioning
Chains of dimension should only be used if the function of the object would not be affected
by the accumulation of the tolerances.
Page 48
(Fig. 8.3)
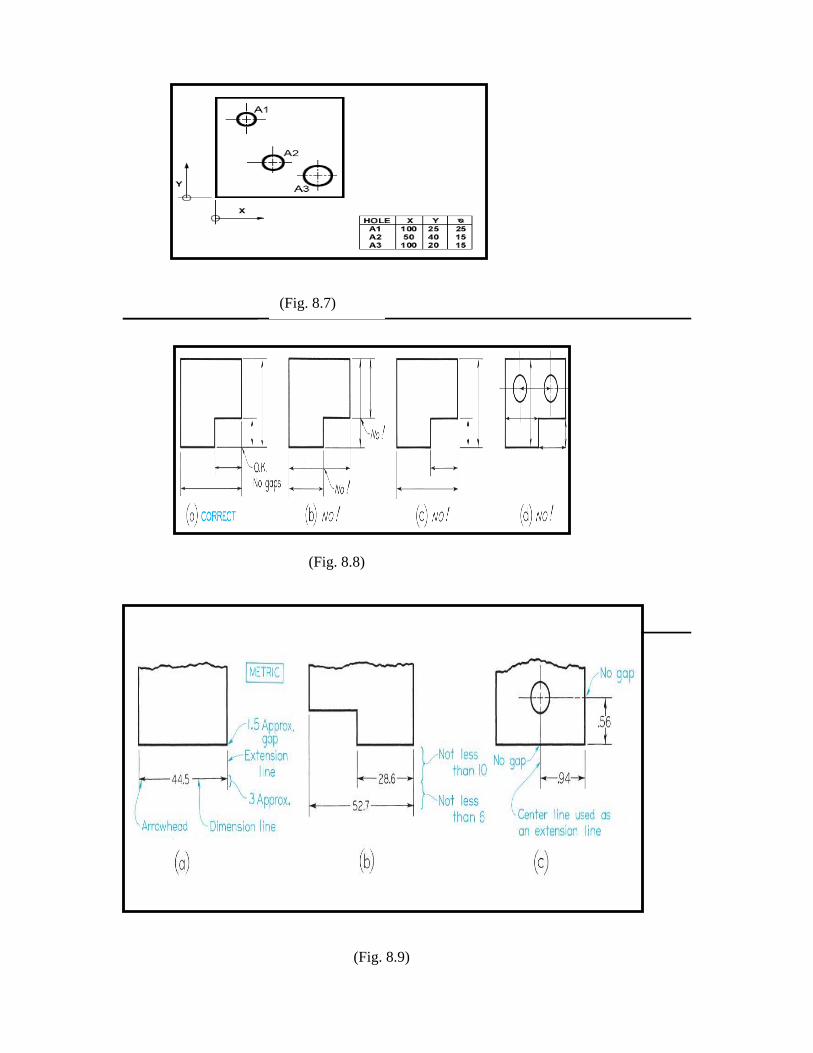
8.3 Dimensioning Small Features
When dimensioning small features, placing the dimension arrow between projection lines
may create a drawing which is difficult to read. In order to clarify dimensions on small
features any of the above methods can be used.
(Fig. 8.4)
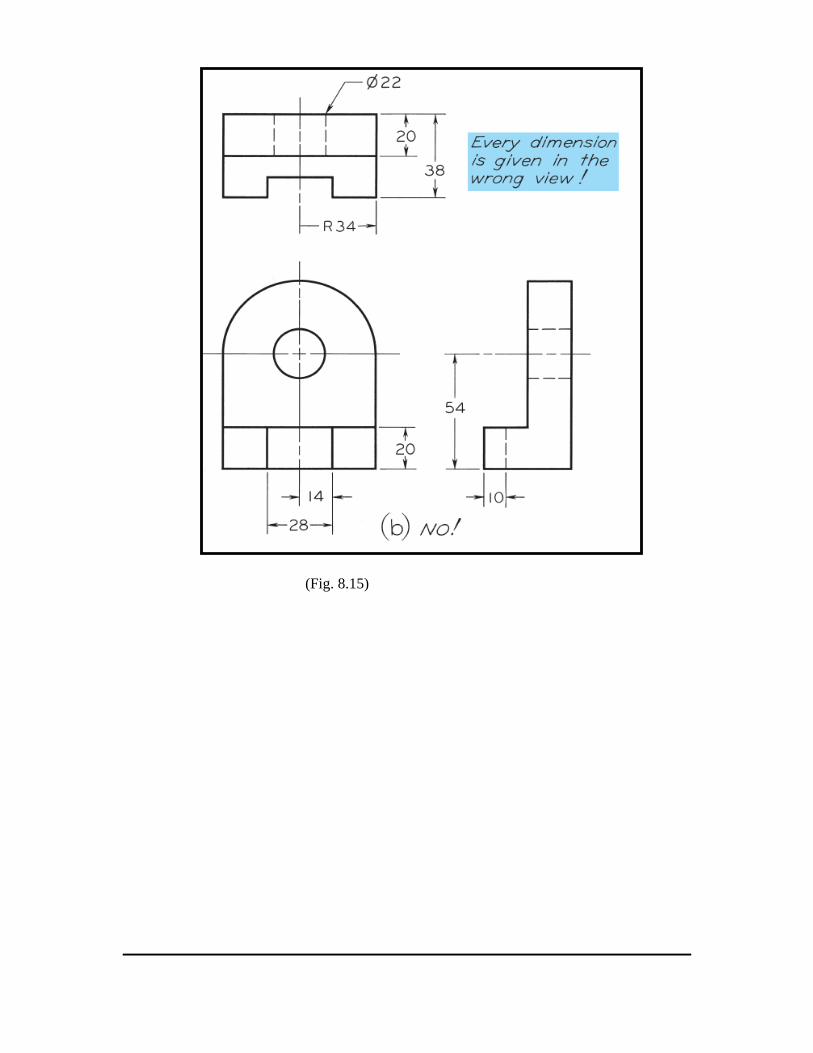
8.4 Dimensioning circles
All dimensions of circles are preceded by the symbol- . There are several conventions used
for dimensioning circles:
(a) Shows two common methods of dimensioning a circle. One method dimensions the circle
between two lines projected from two diametrically opposite points. The second method
dimensions the circle internally.
(b) Is used when the circle is too small for the dimension to be easily read if it was placed
inside the circle. A leader line is used to display the dimension.
(c) The final method is to dimension the circle from outside the circle using an arrow which
points directly towards the centre of the circle.
Page 49
8.5 Dimensioning Radius
All radial dimensions are preceded by the capital “R” - Fig. (8.6). All dimension arrows
and lines should be drawn perpendicular to the radius so that the line passes through the
centre of the arc. All dimensions should only have one arrowhead which should point to the
line being dimensioned. There are two methods for dimensioning radii.
(a) Shows a radius dimensioned with the centre of the radius located on the drawing.
(b) Shows how to dimension radii which do not need their centers locating.
8.6 Simplified dimensioning by co-ordinates
It is also possible to simplify Co-ordinate dimensions by using a table to identify features and
positions. Figure (8.7). this method of dimensioning is mainly used in drawing by computers
(CAD).
(Fig. 8.6)
(Fig. 8.5)
Page 50
(Fig. 8.8)
THE DIMENSIONING DRAWING PRINCIPLE:
Layout of Dimensions Dimension feature contours.
(Fig. 8.7)
(Fig. 8.9)
Page 51
(Fig 8.10)
(Fig. 8.11)
(Fig. 8.12)
Page 52
8.7 Arrangement of Dimensions • Keep dimensions off the part to be dimensioned where possible.
• Arrange extension lines so the larger dimensions are outside of the smaller dimensions.
• Stagger the dimension value labels to ensure they are clearly defined.
(Fig. 8.13)
(Fig. 8.14)
Page 54
QUIZ SHEET (8) -
Add dimensions correctly to drawings in Fig. (8.16) to (8.19).
(Fig.8.16) (Fig.8.17)
(Fig.8.18) ( Fig.8.19)
Page 55
WEEK (9): ABBREVIATION AND SYMBOLS USED IN MECHINCAL ,
ELECTRICAL AND BUILDING DRAWINGS.
Introduction:
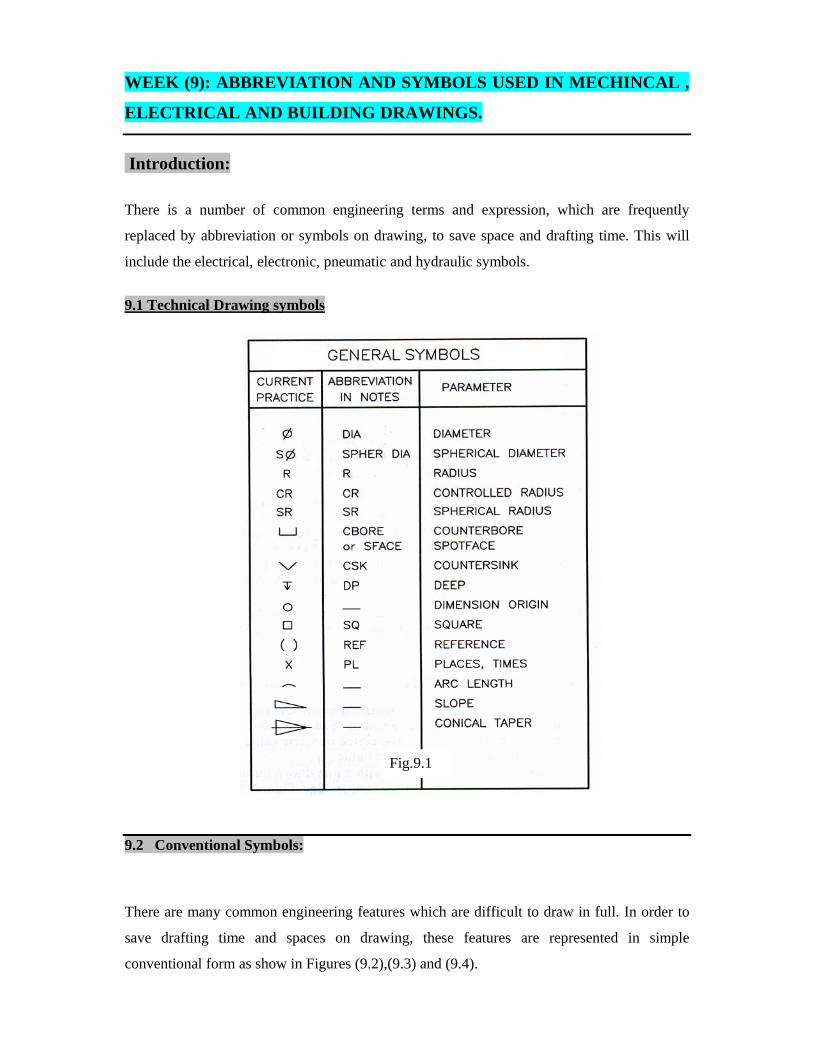
There is a number of common engineering terms and expression, which are frequently
replaced by abbreviation or symbols on drawing, to save space and drafting time. This will
include the electrical, electronic, pneumatic and hydraulic symbols.
9.1 Technical Drawing symbols
9.2 Conventional Symbols:
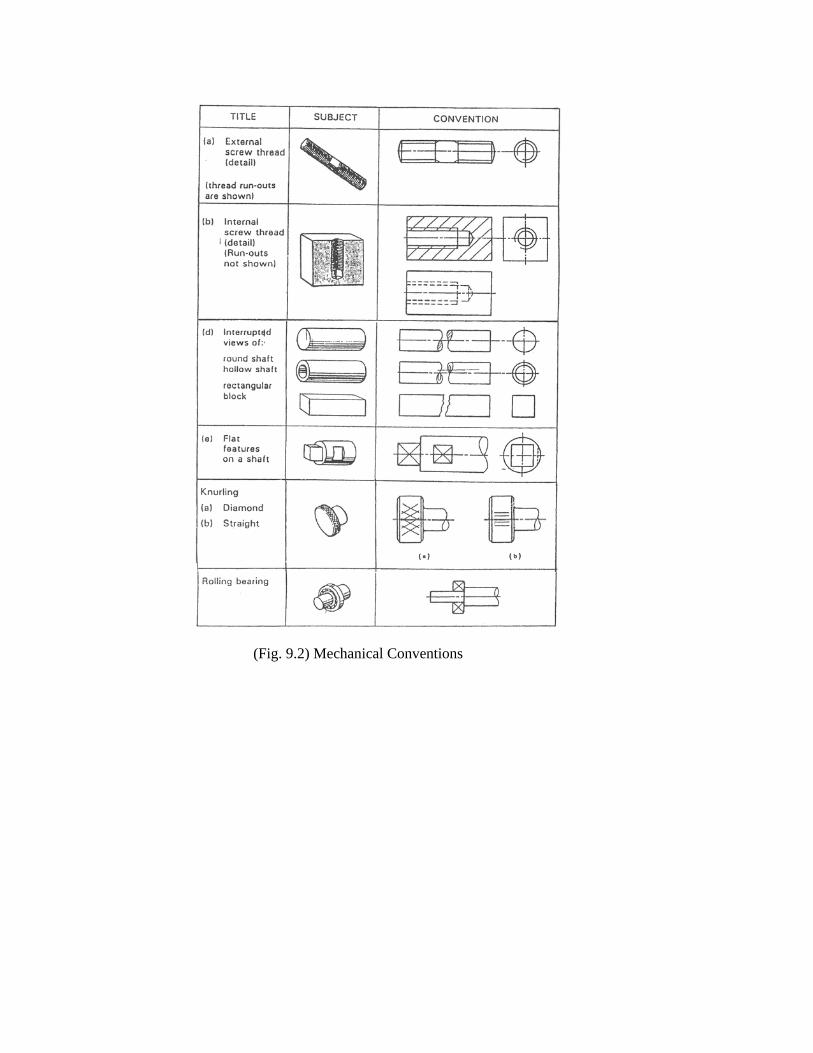
There are many common engineering features which are difficult to draw in full. In order to
save drafting time and spaces on drawing, these features are represented in simple
conventional form as show in Figures (9.2),(9.3) and (9.4).
Fig.9.1
Page 56
(Fig. 9.2) Mechanical Conventions
Page 57
(Fig, 9.3) Electrical Conventions
Page 59
TITLE SYMBOL
9. Stone
10. Partition block
11. Herb
12. Steel
13. Marble Granite or Natural stone
16. Wrot wood (Planed)
14. Insulation
15. Un wrot wood (rough)
. .. .. .... .. .. ...
..... .. .. .. .. ...
. .. .. ...... ...
....... ......
...
(Fig. 9.4) Building Conventions
Page 60
9.4 Line and Block Diagrams:
Engineering Diagrams usually indicate the only relative positions of inter-connected
components or systems represented their relevant diagrams.
o Block Diagram Method:
Block diagram indicates simple form as to functional system where a number of blocks
represent the elements of that system- Figure 9.5.
(Fig. 9.5)Block diagram of an Audio Amplifier System
o Line Diagram Method:
The diagram disregarding indicates the standard symbols representing the functional
components and connection their physical size or position.
(Fig.9.6) Typical microphone pre - amplifier
Page 61
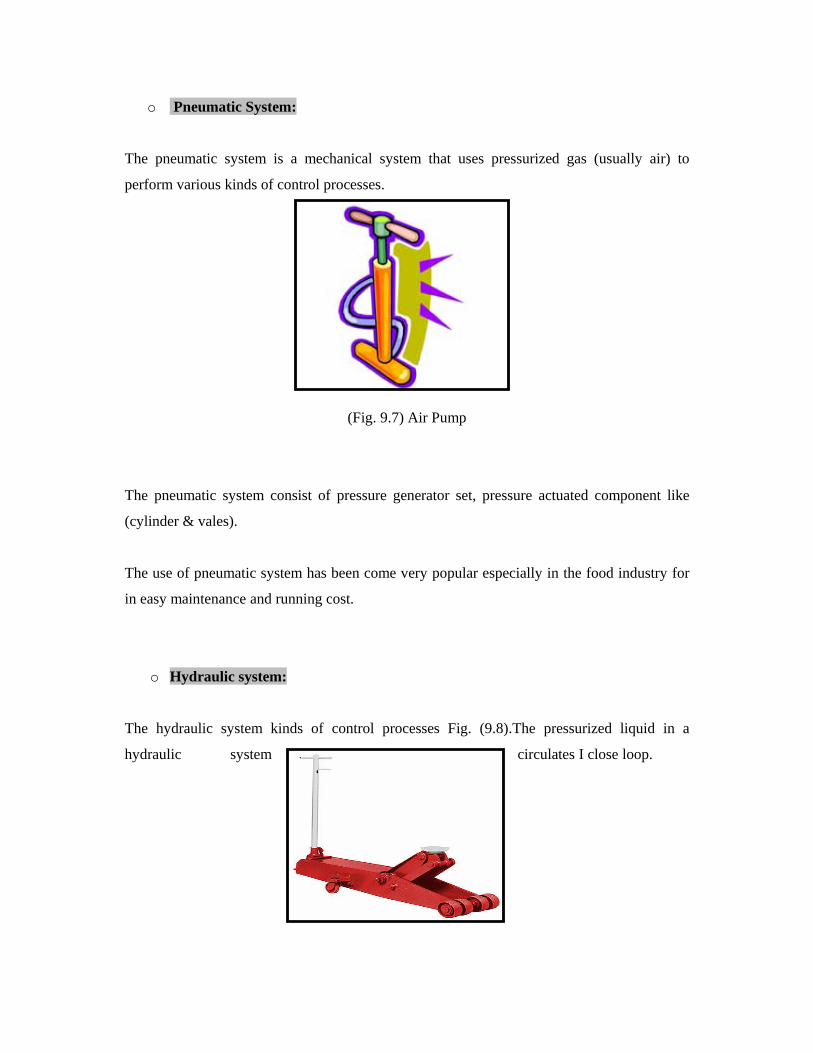
o Pneumatic System:
The pneumatic system is a mechanical system that uses pressurized gas (usually air) to
perform various kinds of control processes.
(Fig. 9.7) Air Pump
The pneumatic system consist of pressure generator set, pressure actuated component like
(cylinder & vales).
The use of pneumatic system has been come very popular especially in the food industry for
in easy maintenance and running cost.
o Hydraulic system:
The hydraulic system kinds of control processes Fig. (9.8).The pressurized liquid in a
hydraulic system circulates I close loop.
Page 62
(Fig. 9.8) Hydraulic Jack
(Fig. 9.9) Pneumatic Symbols
Page 63
Quiz Sheet (9)
1) The drawing in Figure (9.10) illustrates assembled mechanical parts, study the drawing
then fill the table 9.1 accordingly.
(Fig.9.10)
Table 9.1
1 5
2 6
3 7
4 8
2) The drawing in Figure (9.11) illustrates a pneumatic/Hydraulic diagram, study the drawing
then fill the table 9.2 accordingly.
Page 64
(Figure 9.11)
Table 9.2
1 5
2 6
3 7
4 8
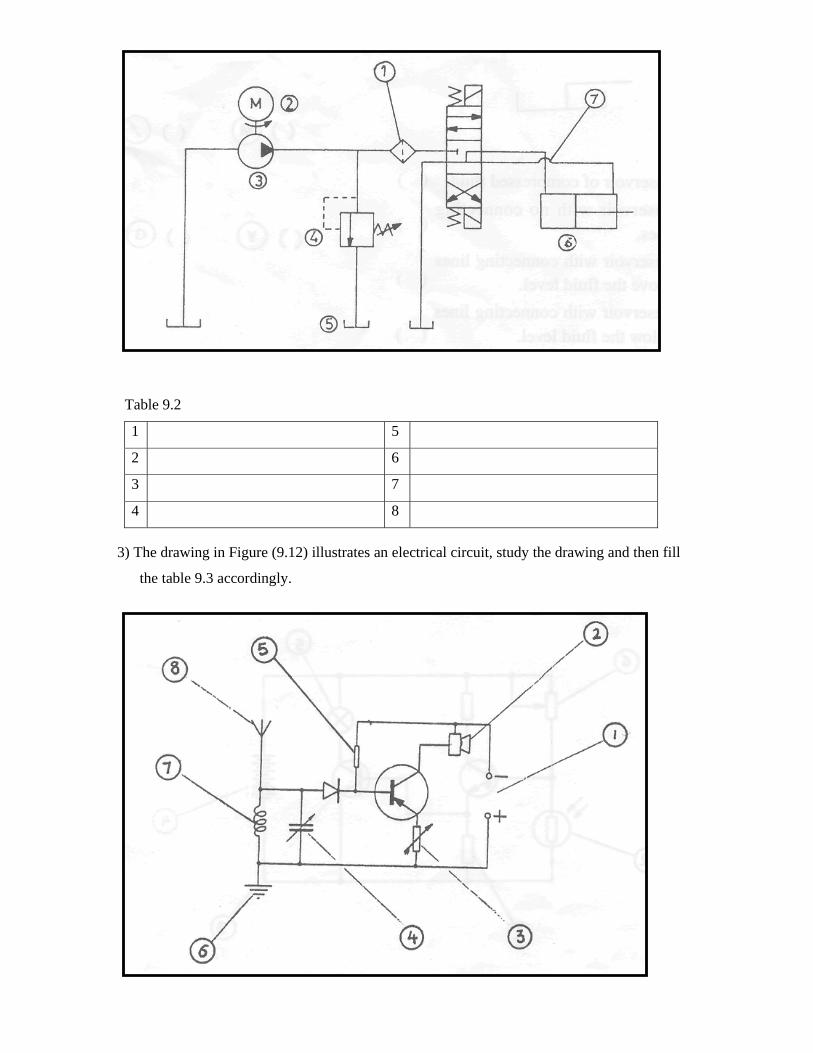
3) The drawing in Figure (9.12) illustrates an electrical circuit, study the drawing and then fill
the table 9.3 accordingly.
Page 65
(Figure 9.12)
Table 9.3
1 5
2 6
3 7
4 8
Page 66
WEEK (10): FREEHAND SKETCHING
Introduction:
Free-hand sketching is used extensively during the early design phases as an important tool
for conveying ideas, guiding the thought process, and serving as documentation.
Unfortunately there is little computer support for sketching. The first step in building a sketch
understanding system is generating more meaningful descriptions of free-hand.
One of the advantages of freehand sketching is it require only few simple items such as
• Pencil (soft pencil i.e. HB).
• Paper (A3 & A4).
• Eraser.
(Fig. 10.1) Clipboard
When sketches are made on the field, where an accurate record is required, a sketching pad
with clipboard are frequently used Figure (10.1). Often clipboard is employed to hold the
paper.
10.1 General Notes Before Sketching:
• The pencil should be held naturally, about 40mm from general direction of the line down.
• Place the paper rotated position so the horizontal edge is perpendicular to the natural
position of your forearm.
• When ruled paper is being used for sketching try to locate the sketched line on ruling line
Use your imagination and common sense when choosing the most suitable angle of view.
Figures 10.2 to 10.7 are the demonstration of different sketching techniques of lines and
shapes.
Page 67
(Fig.10.2) Sketching Technique of horizontal lines
(Fig. 10.3) Demonstration of the sketching technique of horizontal and vertical lines
Page 68
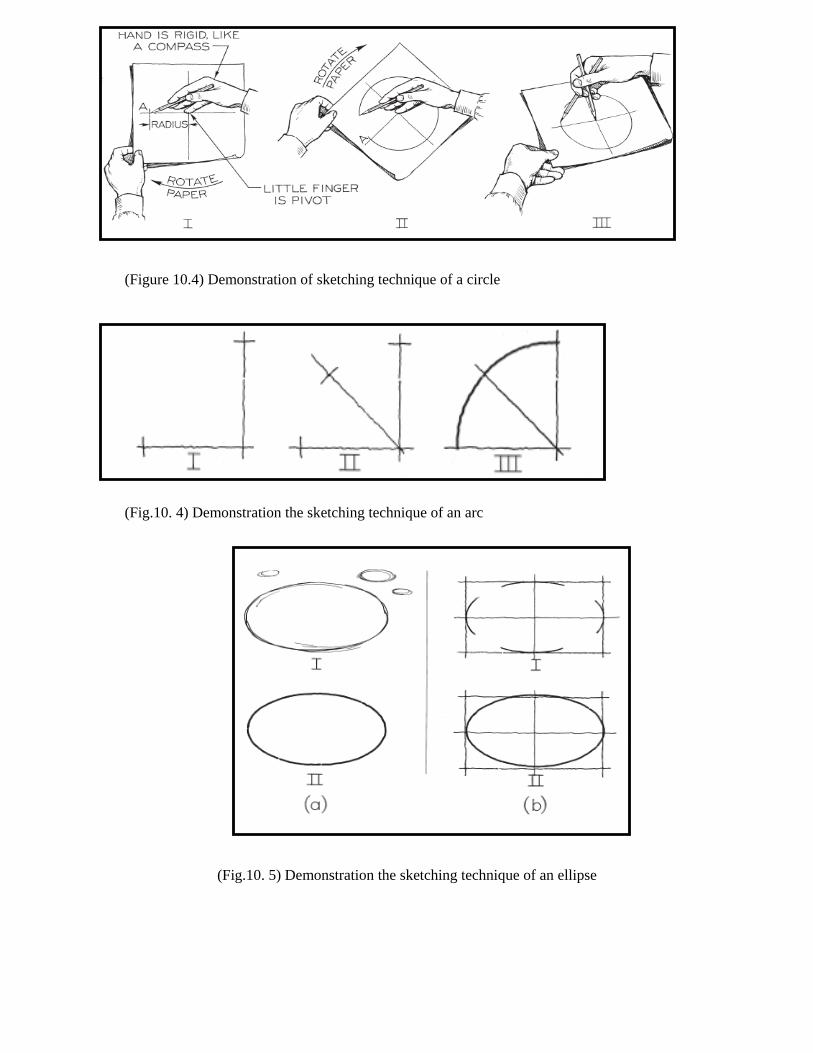
(Figure 10.4) Demonstration of sketching technique of a circle
(Fig.10. 4) Demonstration the sketching technique of an arc
(Fig.10. 5) Demonstration the sketching technique of an ellipse
Page 69
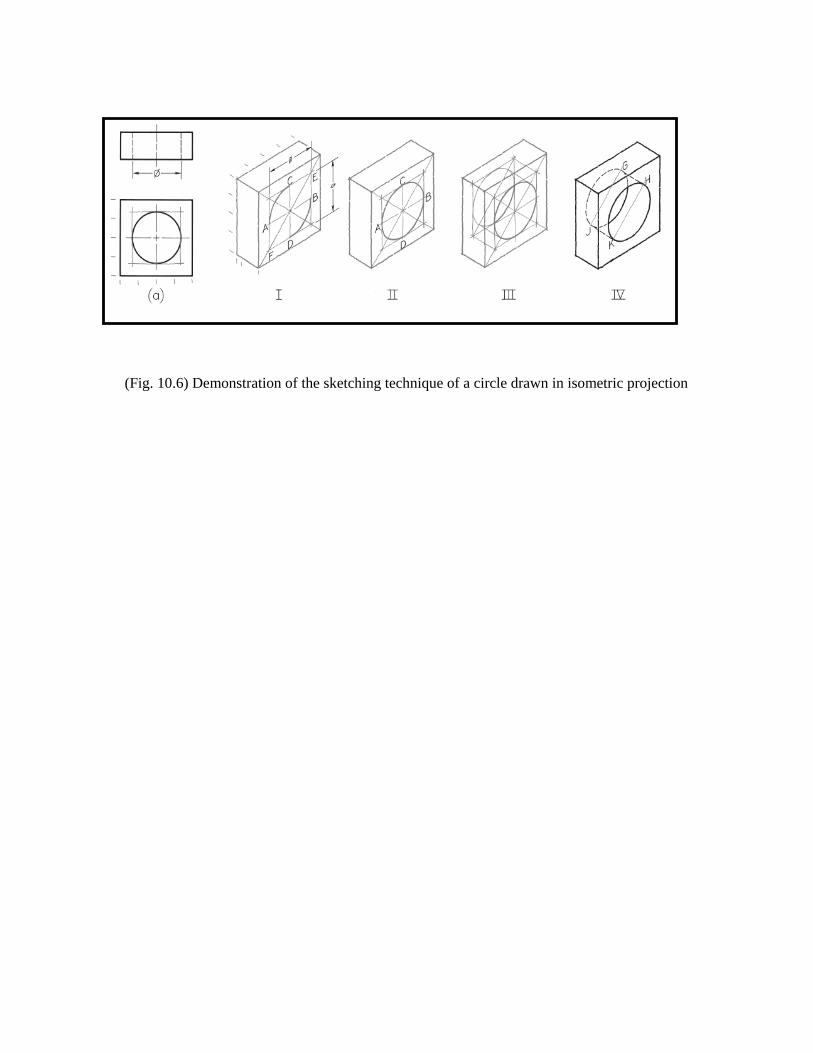
(Fig. 10.6) Demonstration of the sketching technique of a circle drawn in isometric projection
Page 70
Quiz Sheet (10)
1) Use A4 sheet with a pencil and try to draw the lines as shown in Figure. (10.7).
(Fig.10.7)
Use A4 sheet with a pencil and try to draw the component shown in Figure (10.8).
(Fig.10.8)
Page 71
WEEK11: SKETCHING THE VIEWS FROM AN ACTUAL OBJECT
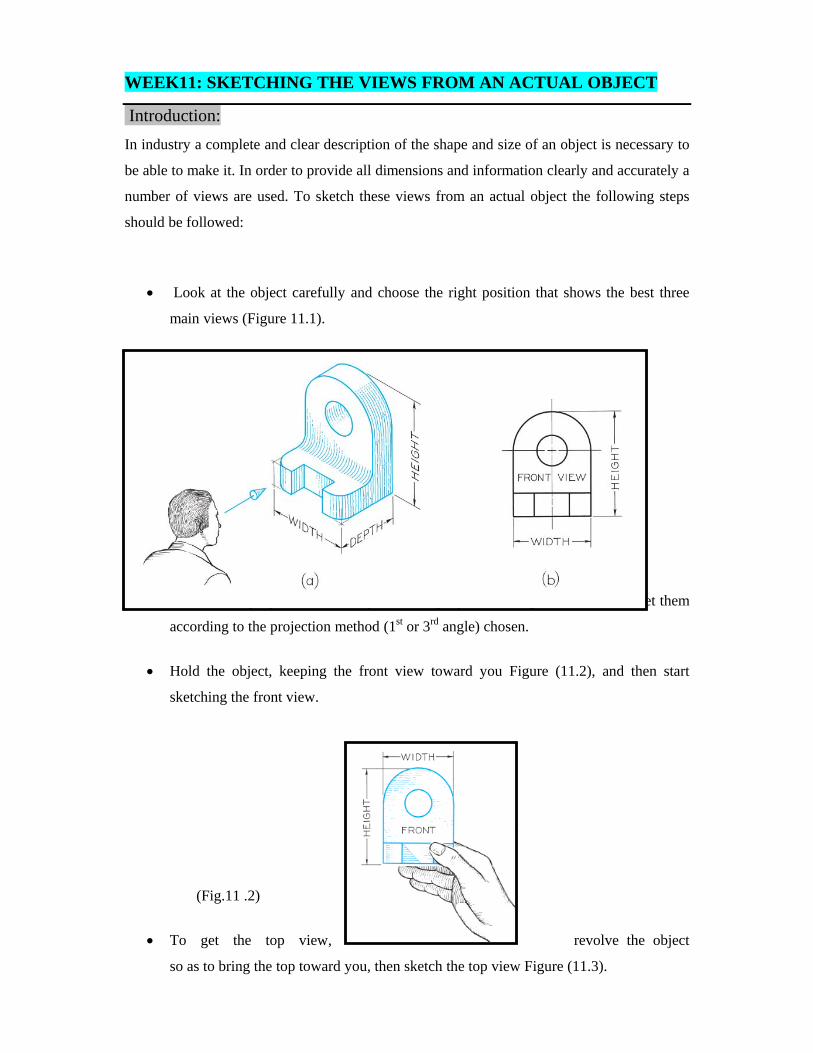
Introduction: In industry a complete and clear description of the shape and size of an object is necessary to
be able to make it. In order to provide all dimensions and information clearly and accurately a
number of views are used. To sketch these views from an actual object the following steps
should be followed:
• Look at the object carefully and choose the right position that shows the best three
main views (Figure 11.1).
Fig. (11.1)
• Estimate the proportions carefully, sketch lightly the rectangles of views and set them
according to the projection method (1st or 3rd angle) chosen.
• Hold the object, keeping the front view toward you Figure (11.2), and then start
sketching the front view.
(Fig.11 .2)
• To get the top view, revolve the object
so as to bring the top toward you, then sketch the top view Figure (11.3).
Page 72
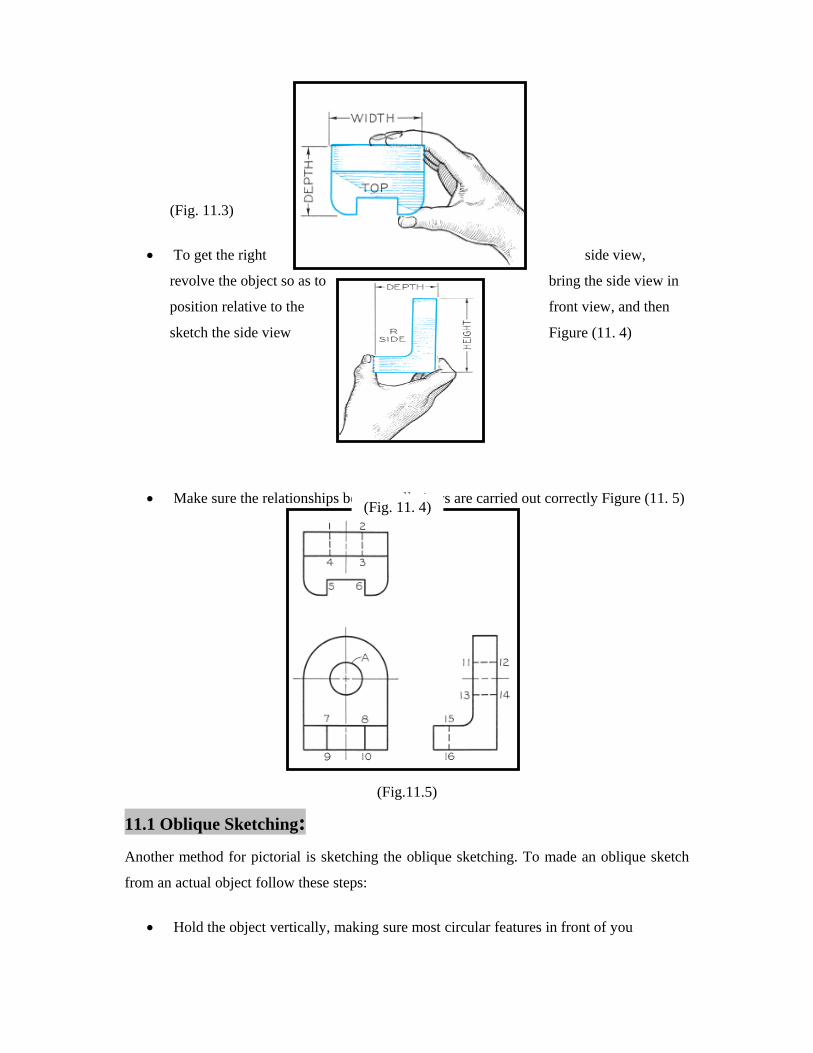
(Fig. 11.3)
• To get the right side view,
revolve the object so as to bring the side view in
position relative to the front view, and then
sketch the side view Figure (11. 4)
• Make sure the relationships between all views are carried out correctly Figure (11. 5)
(Fig.11.5) 11.1 Oblique Sketching: Another method for pictorial is sketching the oblique sketching. To made an oblique sketch
from an actual object follow these steps:
• Hold the object vertically, making sure most circular features in front of you
(Fig. 11. 4)
Page 73
• Sketch the front face of the object in suitable proportional dimensions Figure (11.7).
• Sketch the receding lines parallel to each other or a convenient angle between (30°-
45°) with horizontal, these lines may in full length to sketch a caviller oblique or may
be one half sizes to sketch cabinet oblique.
(Fig.11.6)
(Fig.11.7)
(Fig.11.8)
Page 74
• Complete the required sketch as explained for isometric sketch previously.
(Fig.11.9)
Quiz Sheet 11
Fig. (11.10) shows an isometric pictorial drawing of component, study the drawing and then
using scale 1:1 draw the following:
• An isometric pictorial drawing (freehand).
• The following views (freehand).
A front view.
Side view.
Top view.
Note: All dimensions are in mm
Fig. 11
Page 75
WEEK (12) - THE MAIN FEATURES OF THE SIX VIEWS OF AN
OBJECT
Introduction Any object can be viewed from six mutually perpendicular directions, as shown in Figure
(12.1) below. Thus, six views may be drawn if necessary. These six views are always
arranged as shown below, which the American National Standard arrangement of views. The
top, front, and bottom views line up vertically, while the rear, left-side, front, and right-side
views line up horizontally.
(Fig. 12.1) Demonstration of the six views of an object
Page 76
(Fig. 12.2) The six views of an object
If the front view is imagined to be the object itself, the right-side view is obtained by looking
toward the right side of the front view, as shown by the arrow RS. Likewise, if the right-side
view is imagined to be the object, the front view is obtained by looking toward the left side of
the right-side view, as shown by the arrow F.
The same relation exists between any two adjacent views. Obviously, the six views may be
obtained either by shifting the object with respect to the observer, as we have seen, or by
shifting the observer with respect to the object Figure (12.2).
Page 77
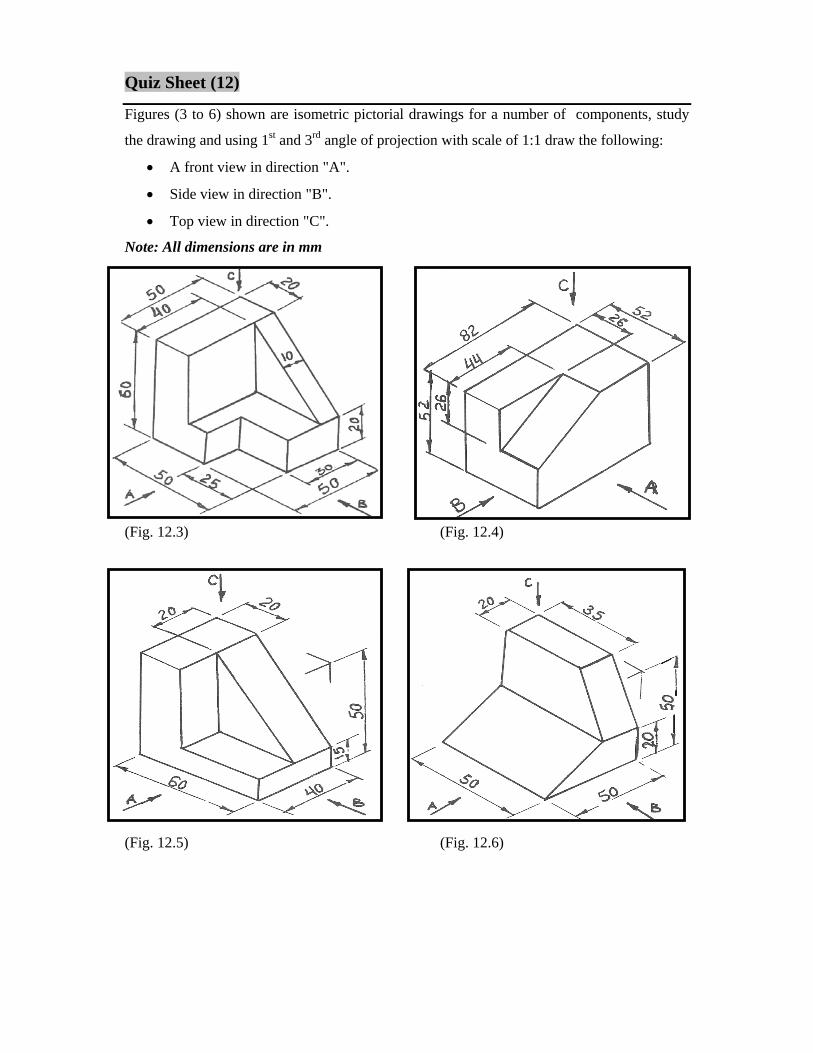
Quiz Sheet (12)
Figures (3 to 6) shown are isometric pictorial drawings for a number of components, study
the drawing and using 1st and 3rd angle of projection with scale of 1:1 draw the following:
• A front view in direction "A".
• Side view in direction "B".
• Top view in direction "C".
Note: All dimensions are in mm
(Fig. 12.3) (Fig. 12.4)
(Fig. 12.5) (Fig. 12.6)
Page 78
WEEK13: MISSING VIEW
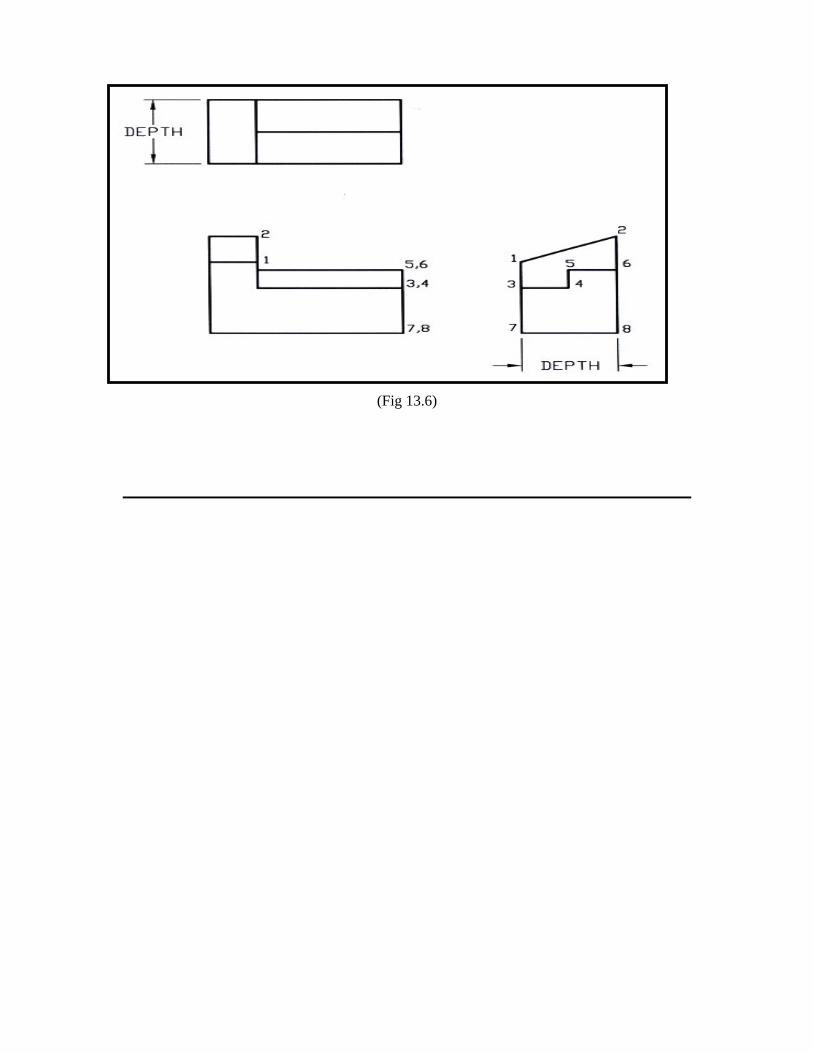
Introduction In orthographic projection, the object has principle dimensions, width, height, and depth
which are fixed terms used for dimensions of the three views.
Note that the front view shows only the height and width of the object, the top view shows
the depth and width only. In fact, any one view of three-dimensional object can show only
two dimensions, the third dimension will be found in an adjacent view Figure (13.1).
Fig. (1)
Fig. (13.1)
Note that:
• The top view is the same width as front view.
• The top view is placed directly above or below the front view depending on the
angle of projection (1st or 3rd).
• The same relation exists between front and side view, same height.
• The side view is placed directly right or left to the front view, (right side view or
left side view).
13.1 First Angle Projection:
Page 79
The Figure (13.2) is a pictorial drawing of given object, three-views of which are required
using first angle of projection. Each corner of the object is given a number as shown. At I the
top view and the front view are shown, with each corner properly numbered in both views.
Each number appears twice, once in the top view and again front view.
(Fig 13.2)
At I point 1 is visible in both views, therefore placed outside the corner in both views.
However point 2 is visible in the top view and number is placed outside, while in the front
view it is invisible and placed inside.
13.2 Third Angle Projection:
Page 80
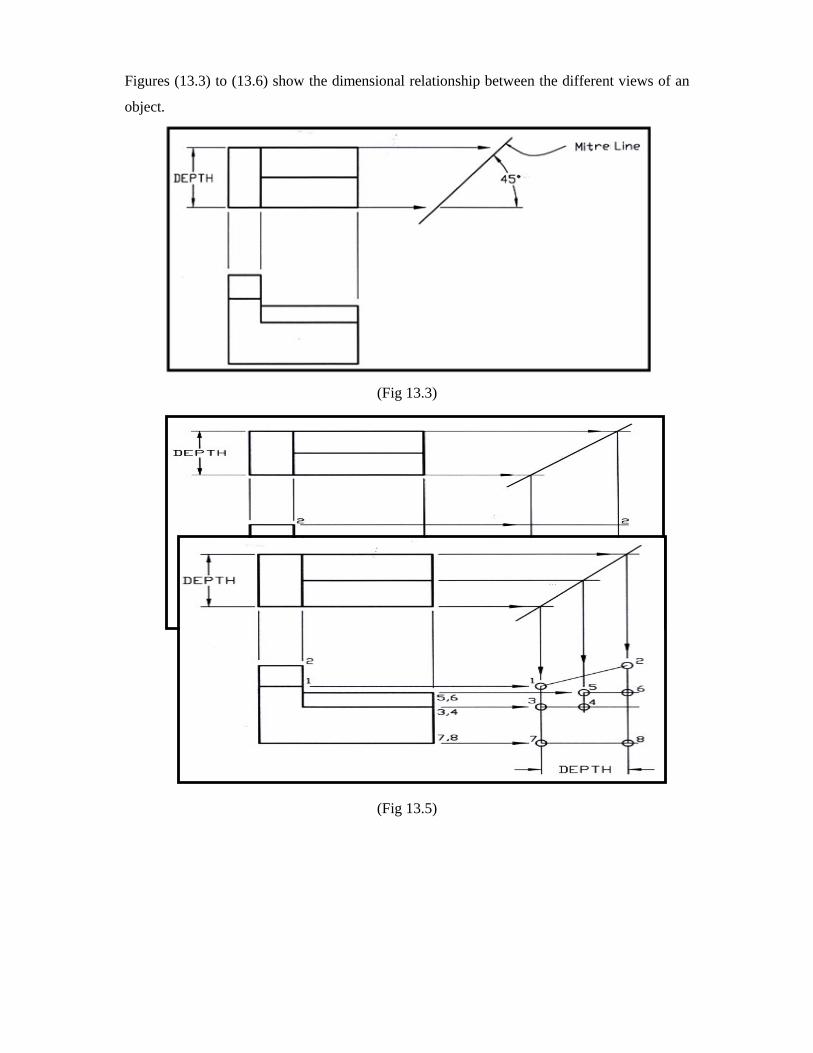
Figures (13.3) to (13.6) show the dimensional relationship between the different views of an
object.
(Fig 13.3)
(Fig 13.4)
(Fig 13.5)
Page 82
Quiz Sheet (13)
1. Figures (13.7 to 13.10) show isometric pictorial drawing of a number of components. Study
the drawing and using 1st and 3rd angle of projection and a scale of 1:1 draw the missing view
of each of the following: (hint; teacher should draw any two views while the students
should draw the missing view)
Note: All dimensions are in mm
(Fig. 13.7) (Fig.13.8)
(Fig. 13.9) (Fig. 13.10)
Page 83
2. Complete the drawing shown in Figure (13.11) to produce the third missing view
(Figure 13.11)
Page 84
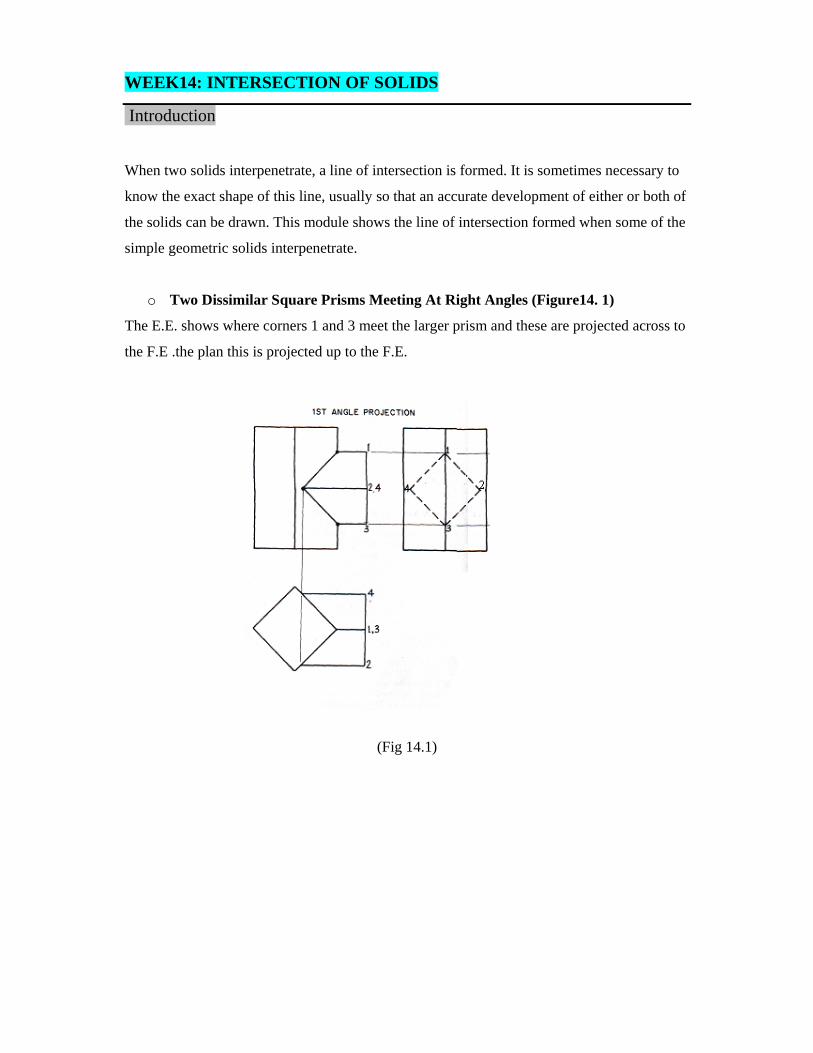
WEEK14: INTERSECTION OF SOLIDS
Introduction
When two solids interpenetrate, a line of intersection is formed. It is sometimes necessary to
know the exact shape of this line, usually so that an accurate development of either or both of
the solids can be drawn. This module shows the line of intersection formed when some of the
simple geometric solids interpenetrate.
o Two Dissimilar Square Prisms Meeting At Right Angles (Figure14. 1)
The E.E. shows where corners 1 and 3 meet the larger prism and these are projected across to
the F.E .the plan this is projected up to the F.E.
(Fig 14.1)
Page 85
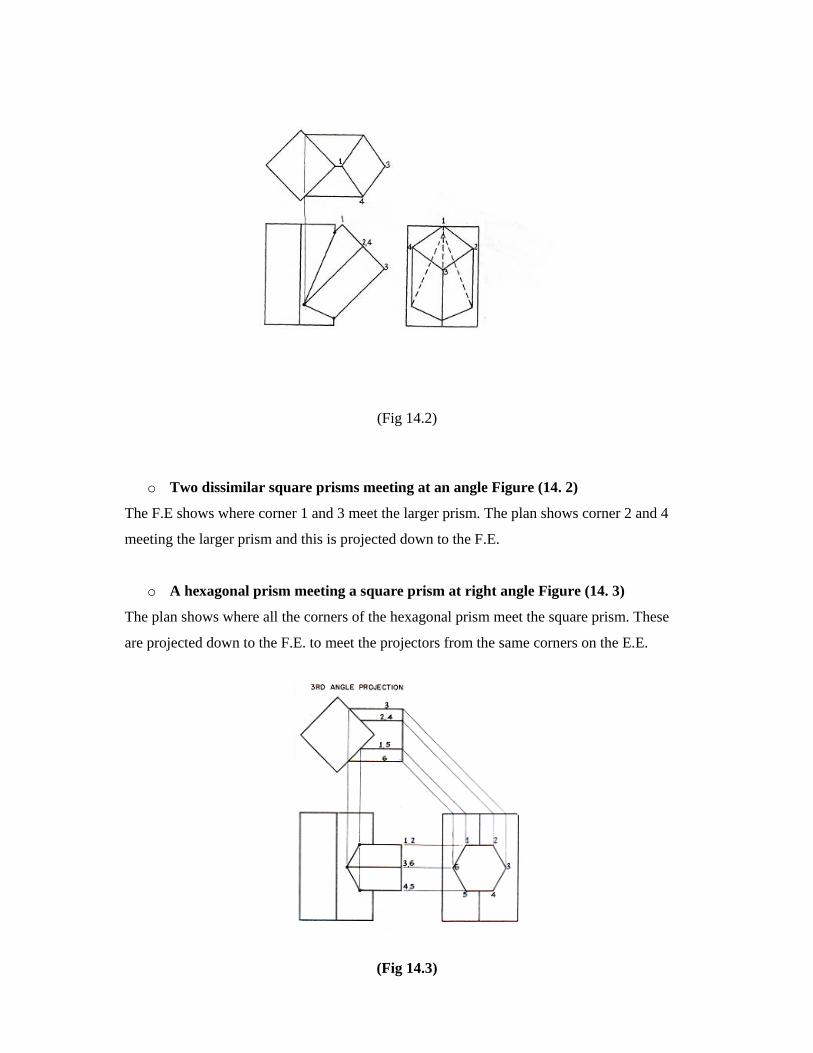
(Fig 14.2)
o Two dissimilar square prisms meeting at an angle Figure (14. 2)
The F.E shows where corner 1 and 3 meet the larger prism. The plan shows corner 2 and 4
meeting the larger prism and this is projected down to the F.E.
o A hexagonal prism meeting a square prism at right angle Figure (14. 3)
The plan shows where all the corners of the hexagonal prism meet the square prism. These
are projected down to the F.E. to meet the projectors from the same corners on the E.E.
(Fig 14.3)
Page 86
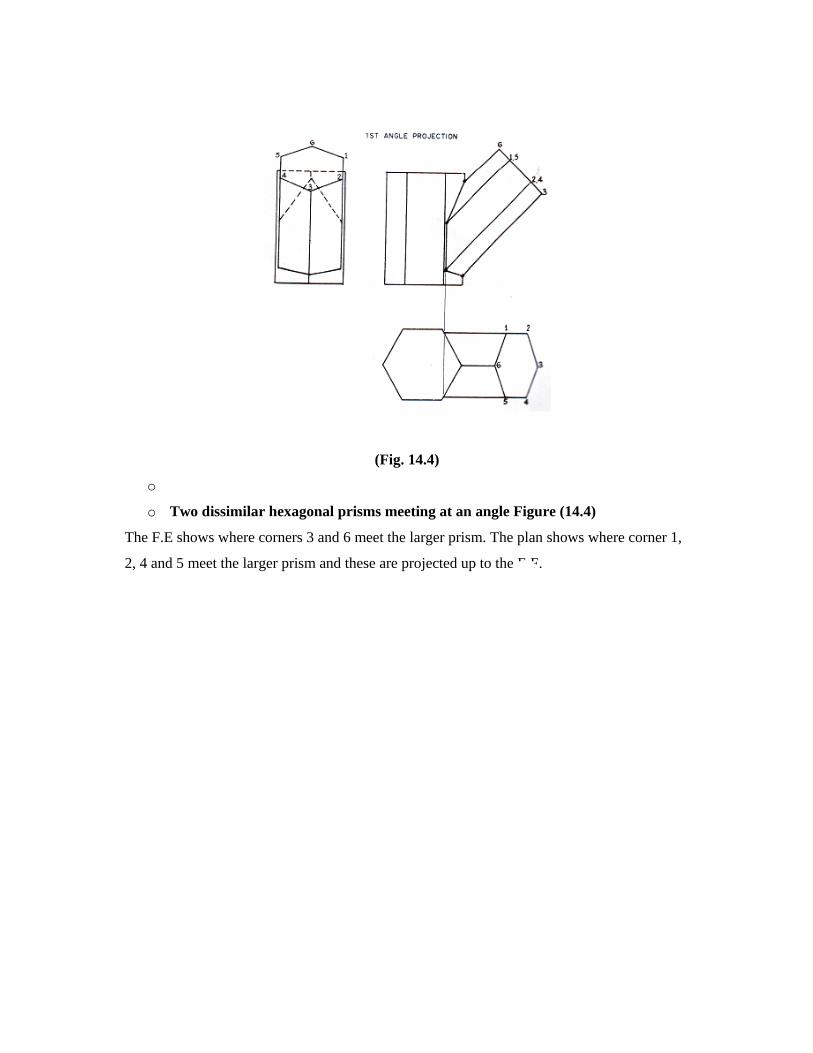
(Fig. 14.4)
o
o Two dissimilar hexagonal prisms meeting at an angle Figure (14.4)
The F.E shows where corners 3 and 6 meet the larger prism. The plan shows where corner 1,
2, 4 and 5 meet the larger prism and these are projected up to the E.F.
Page 87
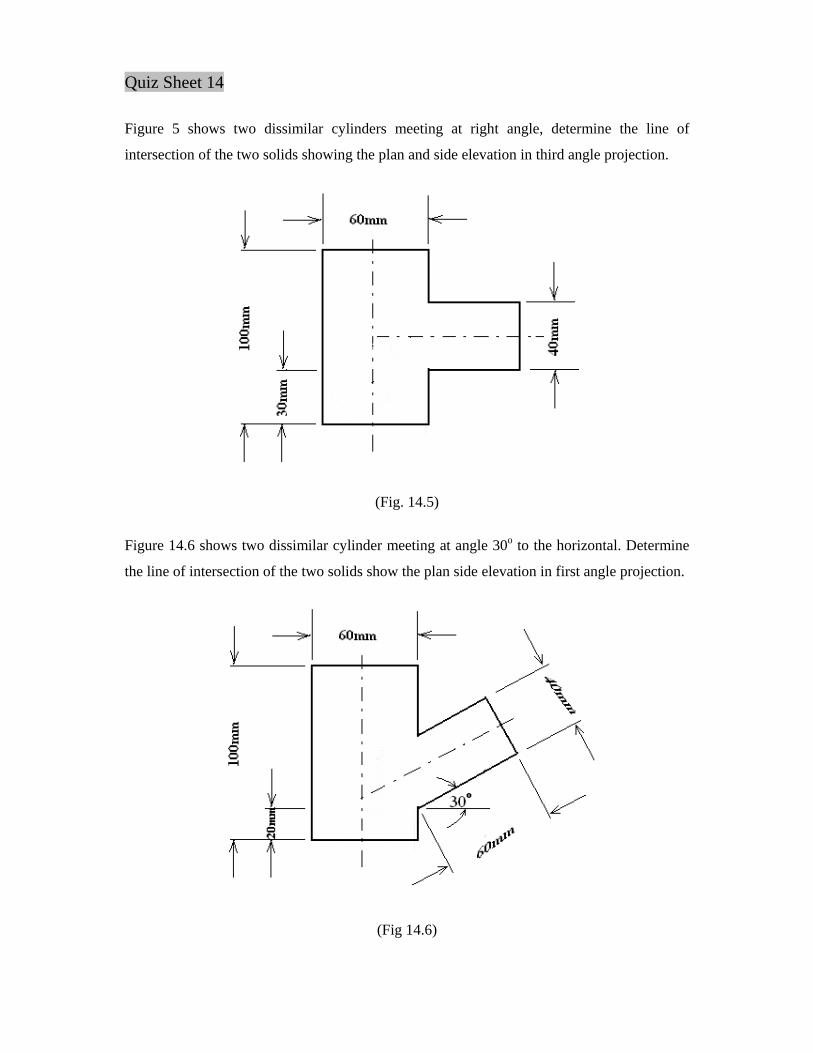
Quiz Sheet 14
Figure 5 shows two dissimilar cylinders meeting at right angle, determine the line of
intersection of the two solids showing the plan and side elevation in third angle projection.
(Fig. 14.5)
Figure 14.6 shows two dissimilar cylinder meeting at angle 30o to the horizontal. Determine
the line of intersection of the two solids show the plan side elevation in first angle projection.
(Fig 14.6)
Page 88
WEEK 15: SURFACE DEVELOPMENT OF SOLIDS
Introduction The process of unfolding a three –dimensional ‘solid’ is called development.
The shapes of most engineering components are whole or parts of prisms, pyramids,
cylinders or cones and so this module deals with the development of the shapes
15.1 Surface Development of a Closed Box Figure (15.1) shows an isometric drawing of a closed box in the shape of a cube, while the
diagram at (b) is a drawing of the box showing the labeled sides prior to joining; (c) is the
development or pattern of the box laid out as a flat sheet. Following the system of labeling at
(b) the position of the sides in the flat sheet are as indicated. The chain – dotted lines are the
bend lines between the six sides.
It is intended that the edges of this box should be joined by soldering. In order to make the
box very secure extra material could be left on adjoining sides to form tags. These would give
an additional area of solder and the joints would be stronger. The shape of a typical tag is
shown chain dotted on the outer edge of side (d).
It will be noted that the side pieces E and F in the development could be position adjoining
any of the other sides and they need not be opposite one another.
15.2 Surface Development of a Hexagonal Tin Figure (15.2a) is an isometric drawing of a hexagonal part made in thin metal. The
development is shown in diagram Figure (15.2b). Notice that the sides of the part are formed
from rectangles having one side length equal to the side length of the hexagon.
The hexagon ends can be positioned adjoining any of the side rectangles.
Assuming that both of these examples were concerned with solid figures instead of hollow
ones the method of developing the surfaces, neglecting the thickness of the metal, would be
exactly the same.
Page 89
(Fig.15.1)
(Fig. 15.2)
Page 90
Fig. 2
(Fig. 15.3)
(Fig. 15.4)
(Fig.15. 5)
Page 91
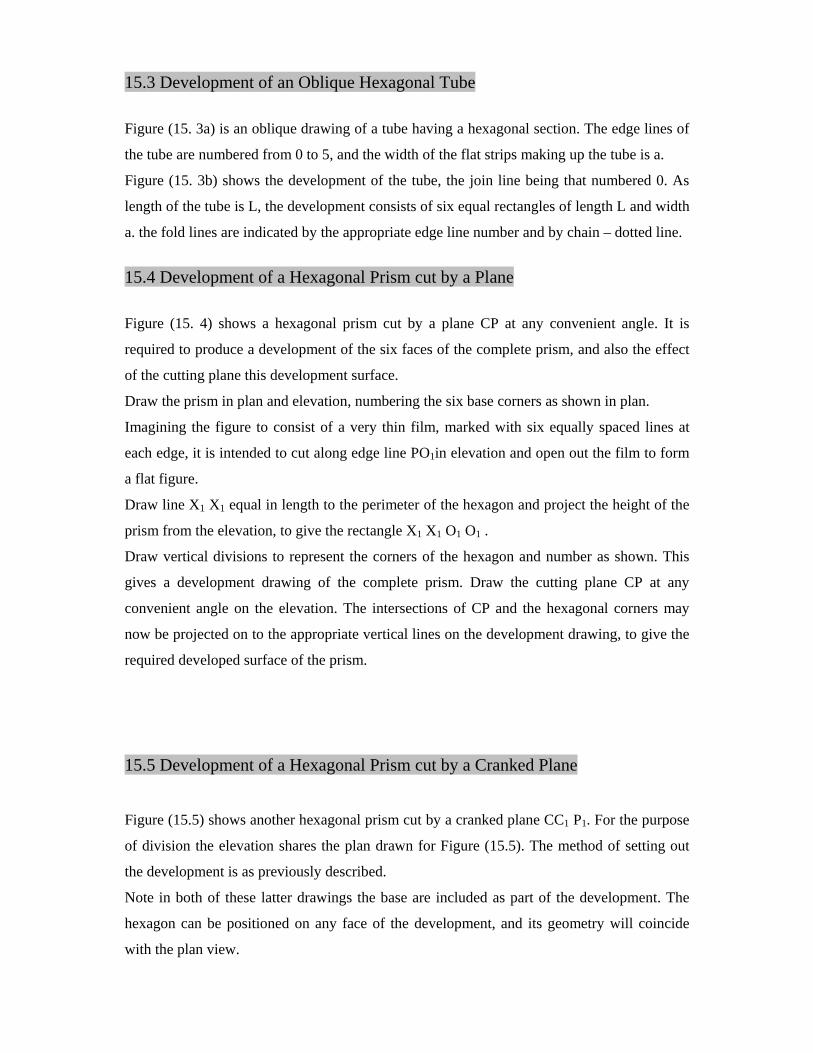
15.3 Development of an Oblique Hexagonal Tube
Figure (15. 3a) is an oblique drawing of a tube having a hexagonal section. The edge lines of
the tube are numbered from 0 to 5, and the width of the flat strips making up the tube is a.
Figure (15. 3b) shows the development of the tube, the join line being that numbered 0. As
length of the tube is L, the development consists of six equal rectangles of length L and width
a. the fold lines are indicated by the appropriate edge line number and by chain – dotted line.
15.4 Development of a Hexagonal Prism cut by a Plane
Figure (15. 4) shows a hexagonal prism cut by a plane CP at any convenient angle. It is
required to produce a development of the six faces of the complete prism, and also the effect
of the cutting plane this development surface.
Draw the prism in plan and elevation, numbering the six base corners as shown in plan.
Imagining the figure to consist of a very thin film, marked with six equally spaced lines at
each edge, it is intended to cut along edge line PO1in elevation and open out the film to form
a flat figure.
Draw line X1 X1 equal in length to the perimeter of the hexagon and project the height of the
prism from the elevation, to give the rectangle X1 X1 O1 O1 .
Draw vertical divisions to represent the corners of the hexagon and number as shown. This
gives a development drawing of the complete prism. Draw the cutting plane CP at any
convenient angle on the elevation. The intersections of CP and the hexagonal corners may
now be projected on to the appropriate vertical lines on the development drawing, to give the
required developed surface of the prism.
15.5 Development of a Hexagonal Prism cut by a Cranked Plane
Figure (15.5) shows another hexagonal prism cut by a cranked plane CC1 P1. For the purpose
of division the elevation shares the plan drawn for Figure (15.5). The method of setting out
the development is as previously described.
Note in both of these latter drawings the base are included as part of the development. The
hexagon can be positioned on any face of the development, and its geometry will coincide
with the plan view.
Page 92
It is often useful to draw these developments on cartridge paper, or thin card, and then cut out
and fold them into the shapes from which the developments were derived. Transparent advice
tape can be used to hold the folded sheet in place. This exercise will underlined the need for
accuracy in drawing, the use of bend lines and the reasons for choosing the shortest length as
the join line.
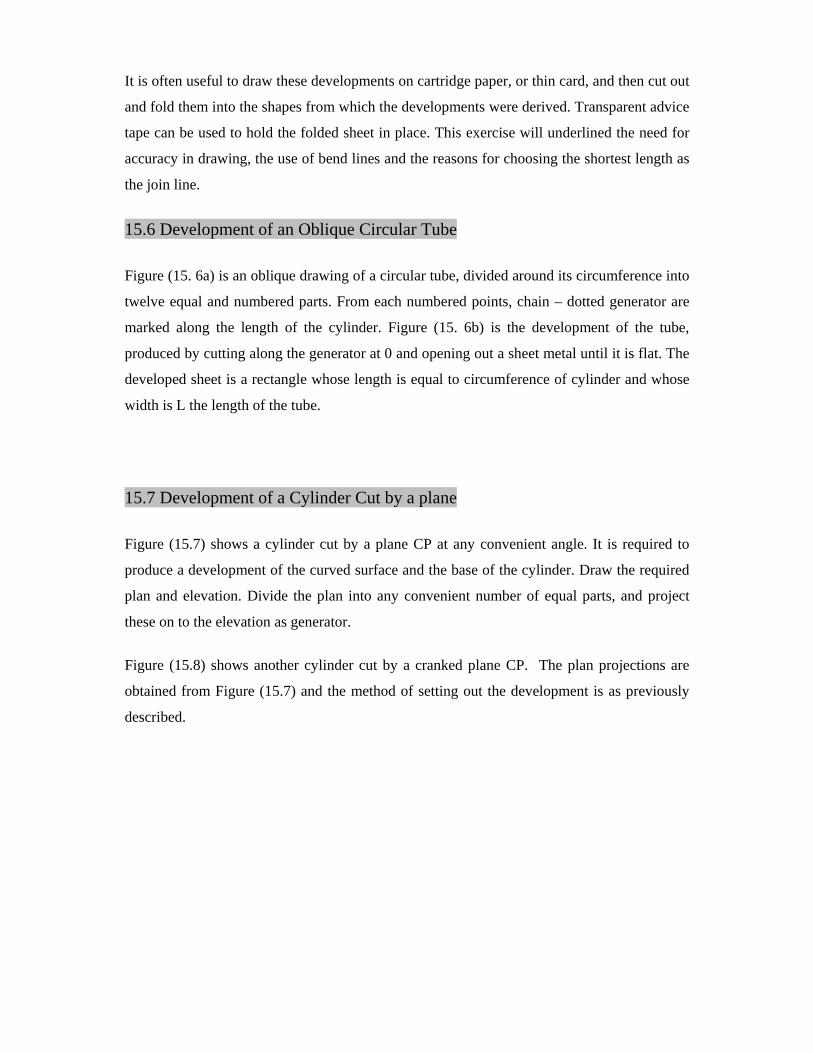
15.6 Development of an Oblique Circular Tube
Figure (15. 6a) is an oblique drawing of a circular tube, divided around its circumference into
twelve equal and numbered parts. From each numbered points, chain – dotted generator are
marked along the length of the cylinder. Figure (15. 6b) is the development of the tube,
produced by cutting along the generator at 0 and opening out a sheet metal until it is flat. The
developed sheet is a rectangle whose length is equal to circumference of cylinder and whose
width is L the length of the tube.
15.7 Development of a Cylinder Cut by a plane
Figure (15.7) shows a cylinder cut by a plane CP at any convenient angle. It is required to
produce a development of the curved surface and the base of the cylinder. Draw the required
plan and elevation. Divide the plan into any convenient number of equal parts, and project
these on to the elevation as generator.
Figure (15.8) shows another cylinder cut by a cranked plane CP. The plan projections are
obtained from Figure (15.7) and the method of setting out the development is as previously
described.
Page 93
(Fig. 15. 6)
(Fig. 15.8)
(Fig. 15.
Page 94
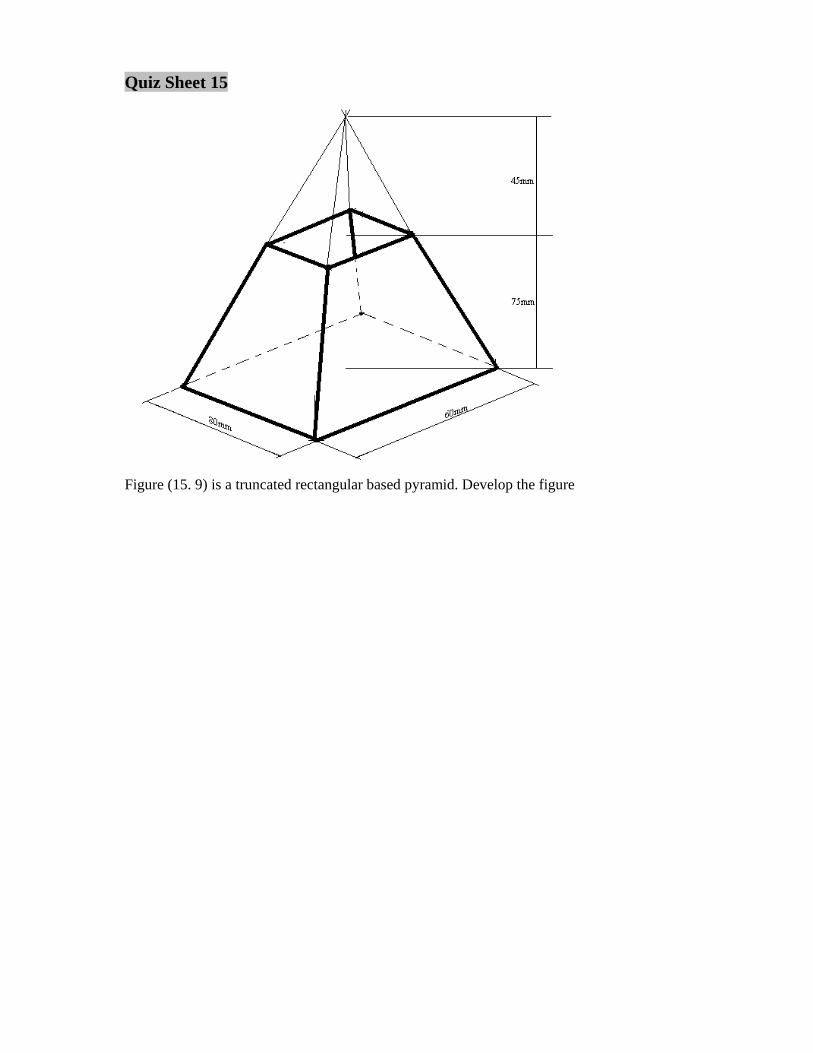
Quiz Sheet 15
Figure (15. 9) is a truncated rectangular based pyramid. Develop the figure