TECHNICAL, ECONOMIC AND ENVIRONMENTAL RISK ASSESSMENT OF CEMENT PRODUCTION IN NIGERIA. EXECUTIVE SUMMARY 1.0 INTRODUCTION 1.1 Background to the Study Cement can be defined as a hydraulic binder, which hardens when water is added. Technically, it can be defined as a material with adhesive and cohesive properties which makes it capable of bonding mineral fragment into a compact whole. It is essentially a necessity with no close substitutes. Globally, cement is used in the construction of residential and public buildings, roads, bridges and drainages as well as rehabilitation of infrastructure. It is therefore an essentially commodity and forms part of the day-to – day living of every society. Globally, the cement manufacturing industry is a major mineral industry that is powered by state – of – the art production plants, which requires highly sophisticated continuous processes, advanced control technology and energy management systems. It is also a highly capital and energy intensive industry; the cost of a new cement plant averages out at about $130million per million tonnes of cement produced, this translates into a long payback period which equates to about three years’ worth of production revenue at a typical plant. Also, with rotary kiln operating continuously at temperatures over 1,500 0 C, massive fuel requirements are inevitable (Klee, 2002). The cement industry is also a labour intensive industry, providing direct employment for an estimated over 850,000 workers worldwide (ERM, 2002). In 2005, the world production of cement was 2284million metric tonnes (USGS, 2006) and the industry accounted for two – thirds of total energy use in the production of non – metallic minerals with an average energy consumption of 8 to 10 EJ of energy annually ( Taylor et al, 2006). The demand for cement is considered to be price inelastic due to lack of apparent substitutes. This can be seen with varying degrees across the world today. As the economies of different countries are in recession and the construction business has been negatively impacted, cement prices persistently increased in real terms. In the UAE, for example, the price of cement has increased even though the real estate market is in turmoil. In Egypt, even though there has been a reduction in steel prices in 2008 – 2009, cement prices soared. In North America and Europe the prices are fluctuating but they are clearly on the rise (Portland Cement Association, 2009). This can be attributed to the fact that even when private enterprise is not using cement, the governmental demand on it is high as it needs it for infrastructure build -up The main environmental issues associated with cement production are emissions to air and energy use. The process of producing cement causes negative environmental externalities at all levels of production. To make clinker and mix it to prepare concrete the material must be grounded and heated to more than 1500 o C. Such energy intensive production releases NO X (nitrogen oxides), CO 2 (carbon dioxide), and SO 2 (sulfur dioxide). All of these gaseous materials
Transcript
TECHNICAL, ECONOMIC AND ENVIRONMENTAL RISK
ASSESSMENT OF CEMENT PRODUCTION IN NIGERIA.
EXECUTIVE SUMMARY
1.0 INTRODUCTION
1.1 Background to the Study
Cement can be defined as a hydraulic binder, which hardens when water is added. Technically, it
can be defined as a material with adhesive and cohesive properties which makes it capable of
bonding mineral fragment into a compact whole. It is essentially a necessity with no close
substitutes. Globally, cement is used in the construction of residential and public buildings,
roads, bridges and drainages as well as rehabilitation of infrastructure. It is therefore an
essentially commodity and forms part of the day-to – day living of every society.
Globally, the cement manufacturing industry is a major mineral industry that is powered by state
– of – the art production plants, which requires highly sophisticated continuous processes,
advanced control technology and energy management systems. It is also a highly capital and
energy intensive industry; the cost of a new cement plant averages out at about $130million per
million tonnes of cement produced, this translates into a long payback period which equates to
about three years’ worth of production revenue at a typical plant. Also, with rotary kiln operating
continuously at temperatures over 1,5000C, massive fuel requirements are inevitable (Klee, 2002).
The cement industry is also a labour intensive industry, providing direct employment for an
estimated over 850,000 workers worldwide (ERM, 2002). In 2005, the world production of
cement was 2284million metric tonnes (USGS, 2006) and the industry accounted for two – thirds
of total energy use in the production of non – metallic minerals with an average energy
consumption of 8 to 10 EJ of energy annually ( Taylor et al, 2006). The demand for cement is
considered to be price inelastic due to lack of apparent substitutes. This can be seen with
varying degrees across the world today. As the economies of different countries are in recession
and the construction business has been negatively impacted, cement prices persistently
increased in real terms.
In the UAE, for example, the price of cement has increased even though the real estate market is
in turmoil. In Egypt, even though there has been a reduction in steel prices in 2008 – 2009,
cement prices soared. In North America and Europe the prices are fluctuating but they are
clearly on the rise (Portland Cement Association, 2009). This can be attributed to the fact that
even when private enterprise is not using cement, the governmental demand on it is high as it
needs it for infrastructure build -up
The main environmental issues associated with cement production are emissions to air and
energy use. The process of producing cement causes negative environmental externalities at all
levels of production. To make clinker and mix it to prepare concrete the material must be
grounded and heated to more than 1500oC. Such energy intensive production releases NOX
(nitrogen oxides), CO2 (carbon dioxide), and SO2 (sulfur dioxide). All of these gaseous materials
cause harmful effects on the environment and contribute to the global climate change on earth.
Waste water discharges from cement plants are usually limited to surface run – offs and
discharges to nearby streams and rivers, which could contribute to water pollution. Quarry
activities associated with the cement industry impact land use and biodiversity resulting in land
and landscaping issues.
The energy consumed by the cement industry is estimated at about 2% of the global primary
energy consumption and cement alone contributes about 5% of the world’s total greenhouse
gases (Adam, 2007 and Loreti Group, 2008). Not only do these gases contribute to global
warming, they also contribute to poor air quality that can cause weakening in human health and
respiratory systems. When cement factories become even more concentrated in the developing
world, this means that children and people living in these areas will be paying the price for
construction firms to use the cement in Europe or North America (Miller, 2009).
.Hence, the global cement industry can be characterized as having global distributional
inefficiency across space and time. The environmental impact is further complicated through the
harmful effects of resource depletion. In order to make cement and burn the components at the
aforementioned temperature, the amount of fuel used –oil or coal —is very high. While clinker is
not under the threat of being depleted anytime soon, the economic costs of fuel resource
depletion needed to make the cement is under attack. Furthermore once the final product is
produced, some solid wastes remain as a result of the production process. Such solid waste, in
countries with loose environmental regulations or weak enforcement mechanisms, is thrown
into the water or burned in an uncontrolled location. This lack of oversight continues to cause
levels of inequality that the world cannot sustain in the long run.
These environmental challenges have gone uncontrolled because of the importance of cement
for developing countries due to industrialization, export proceeds, and infrastructure
requirements. The industry traditionally has gone under the radar–unlike the aviation industry
that has been under attack for environmental impact. It is worth to mention here that industry
leaders have taken the lead, in real or artificial terms, to meet and discuss the impact of their
industry on the environment (Adam, 2007).
Specifically, the World Business Council for Sustainable Development (WBCSD) has started a
Cement Sustainability Initiative (CSI) led by global industry firms. However, action has yet to take
place in an organized and succinct manner that can prevent the long term environmental and
health damage that is caused by the production of cement on a global scale. The environmental
challenges posed to the world are exacerbated because of the lack of substitutes for cement.
Building hospitals, hotels, homes, schools, etc. is a necessary component for development and
infrastructure build up.
1.2 Problem Statement
The history of cement production in Nigeria dates back to 1957. Initially, three cement plants
were commissioned by the Northern, Eastern and Mid-Western regional governments.
Subsequently, other companies such as Ashaka Cement, Benue Cement Company (BCC), West
African Portland Cement Company (WAPCO) and Cement Company of Northern Nigeria (CCNN)
were established. Other cement factories established between 1957 and 1980 were the Calabar
cement coOmpany in 1965 and Bendel Cement Company in 1964. All the cement companies are
members of the Cement Manufacturers Association of Nigeria (CMAN), which was established in
1979 with the aim of addressing the problems confronting the industry.
By 1980, the country had seven cement plants with total installed capacity of 5 million metric
tonnes. However, the plants were performed below expectation. Between the period 1981 –
1997, the production capacity of the cement plants fell from a peak of 3.4 million metric tonnes
(representing 65% capacity utilization) in 1988 to an all-time low of 2.5 million metric tonnes
(representing 49% capacity utilization) by 1997. Apart from the Ashaka cement plant, which
operated at about 70% capacity utilization, other cement plant during the period operated at
below 50% capacity utilization and some even operated at 10% capacity utilization (see
Appendix 1&2).
Within the same period, the demand for cement grew in the country leading to the country
resorting to mass importation to meet its local needs. Various factors were adduced for the
deplorable performance of the Nigerian cement Industry including poor funding to procure new
equipments and modernize operations; the rising cost and supply of fuel oil to meet production.
Poor power supply and lack of government policy. As a consequence of the rather deplorable
situation, CMAN had to alert the nation that its members were bugged down with a production
cost of US$ 62/ tonne as against the international average cement production cost which falls
within the range US$ 18 – 25 /tonne (Eyo – Ita, 2002).
By the end of 2002, the situation in the Nigerian cement industry was pathetic; of the eight
integrated cement plants, with a total capacity of 5.4 million tonnes; three of them –
NigercemNkalagu; Calabar cement and Bendel cement plants had been shut down for 3yrs
running; while two plants (Benue cement company, Gboko and Cement Company of Northern
Nigerian , Sokoto) could only sustain limping operations below 20% capacity utilization level;
while only three plants (Ashaka, Ewekoro and Sagamu) were operational and contributing as
much as 70% of the national cement production figures (Eyo – Ita, 2002).
With the advent of democratic governance in Nigeria in May 2009, the government inaugurated
the backward integration policy in 2001 to revert the rot that had set into the cement industry in
the country. The policy involved the sale of government controlling shares in then existing
plants and all the cement plant were listed for full privatization by the National Council on
Privation (NCP) and the Bureau of Public Enterprises (BPE). Also, bulk importers of cement were
given up to the end of the year 2002 to show positive and concrete evidence of investment in
local manufacturing of cement using the rich deposits of limestone which is available in the
country. There was also a proposal by government to ban altogether the importation of bulk
cement into the country by January, 2006 (Mohammed, 2004). Also, as part of the government
effort to encourage direct investments in the cement sub – sector, duties payable by cement
companies on their spares and machineries were reduced and the national gas pipeline grid is to
be extended to connect the cement industries (Jamodu, 2002).
The cumulative effect of this industrial policy in the cement industrial sector is that the
cumulative capacity of the industry grew from 2 million metric tonnes in 2002 to 28 million
metric tonnes in 2013; a space of 11yrs. Infact during the period 2005 – 2012, the installed
capacity of the industry grew by over 95.5%. Current local demand of cement is now between
18.3 – 20 million metric tonnes per year, making supply to outstrip demand and turning Nigeria
into cement exporting rather than cement importing country.
Nothingness, considering the infrastructure deficit in housing and roads; and low per capita
consumption of cement, the demand for cement in the country will continue to rise. Currently,
rapid urbanization in Nigeria with close to 50% of the population living in the urban areas versus
a meager 38% in 1993 and even lesser at 10% in 1952; it reflects the potentials of the real estate
market and with more than 80% of the population living in the informal residential housing, this
reflects the hugely untapped housing sector.
With regards to the roads, the development of road transportation network for a country like
Nigeria where more than 90% of the freight and passengers commute through roads; is of
indispensable importance. Out of the 200,000 kilometers (kms) of roads, 35,000 kms are owned
the FGN and account for 70% of the national vehicular and freight traffic. The rest is owned by
the 36 states and 777 local government areas. Only 30% of the federal roads are in good
conditions while the remaining 70% are in dire need of reconstruction and expansion. The FGN
has a budget of N 1.4 trillion covering 6,628 kms of roads construction. It has N850 million as an
outstanding commitment for maintenance of existing roads while N600 billion is needed to
bring the road transportation network at per with the developed nations, constructing 14,000
kilometers of roads per year to achieve the goals of Vision 20: 2020.
Also, despite the increase in local capacity in the manufacturing of cement, Nigeria still lags
behind in its cement consumption per capita. Globally, the average consumption of cement is
273kg per capital, while in North Africa the average consumption of cement is 300 kgs per
capita, it is 1000kgs in Libya, 640 kgs in Tunisia; 500kgs in Algeria; 280kgs in South Africa; 170
kgs in Senegal; 140kgs in Ghana and average in BRIC countries is 420 kgs. The current per capita
consumption of cement in Nigeria is 110 kgs. This consumption level is expected to rise given
the development at various level of governance in physical infrastructure and rapid urbanization
(Nwolisa, 2012).
Another paradox in the last ten years of the expansion of the cement industry in Nigeria is that
the increase in the production capacity of cement has not reflected in the current price of the
average 50kg of cement in Nigeria. The price of cement in Nigeria for the average 50kg bag in
2002 was N625:00; the price moved to N2, 000:00 in 2008 and currently stands at N 1,650:00 to
N1, 800:00 ($10 - $11) in various parts of the country. This is quite high when compared with the
price of the commodity across the globe; giving the impression that cement price in Nigeria
defies the laws of demand and supply. The price of cement in Ghana and Republic of Benin is $9
and $6 respectively, while in the prices in other countries across the globe are United States of
America (USA) ($5 - $6.00); India ($3.40 - $5.00); South Africa ($6.50) and Kenya ($5.00).
1.3 Objective of the Study
Based on the above, the objectives of the environment risk assessment of cement production in
Nigeria are:
1. Conduct a policy evaluation of the Industrial Policy of 2002 and the Backward
Integrations Programme that was used to drive the cement industry from 2002 – 2012.
2. Examine the fiscal policies of government from 2002 to 2012 that led to increase in local
production capacity of the Nigerian cement industry.
3. Examine the factors that have been responsible for high cement prices despite the high
increase in cement production in the country.
4. Examine the energy utilization pattern of the Nigerian cement industry and how it has
contributed to the production cost/ selling price of cement in Nigeria.
5. Examine the environmental health issues being encountered by communities within and
around cement plants at various locations in the country.
6. Examine and evaluate the extent to which newly established cement have fulfilled their
mandates to their host communities as expressed in their Environmental Impact
Assessment (EIA), which was approved before the establishment of the plants.
7. Examine the economic factors that have resulted in the consistent low consumption per
capita of cement in Nigeria when compared with other countries across the globe.
8. Examine and evaluate the socio – economic impact on the host communities of cement
plants in the areas of employment, physical development and commerce.
9. Examine to what extent the cement industry has contributed to employment and labour
– related issues in the country.
10. Examine the noise – level compliance and other safety regulations of the cement industry
in Nigeria.
11. Examine other factors that may arise in the technical, economic and social evaluation of
the cement manufacturing plants in Nigeria.
.1.4 Justification for the Study
The study of the socio – economic, health and other related impact of the cement industry in
Nigeria in the past ten years is in line with the institute objectives and the increase in production
volume of the industry has been taunted as a major policy success in Nigeria. This makes the
success in the industry a subject for policy review and re – examination.
1.5 Scope of the Study
The study is expected to cover the six geo political zone of the country. This is because currently
the cement industry is spread across the country and new cement plants are also spread across
the country.
2.0 The Cement Manufacturing Process in Nigeria
2.1 Cement Production Process
Portland cement is a fine powder, gray or white in colour that consists of a mixture of hydraulic
cement materials comprising primarily calcium silicates, aluminates and alumino – ferrites. The
composition of the materials used to manufacture Portland cement can be divided into four
distinct categories – calcareous (limestone or chalk), siliceous (silica), argillaceous (shale or clays),
and ferriferous (iron compounds). These materials are chemically combined through
pyroprocessing and subjected to subsequent mechanical processing operations to form gray
and white Portland cement.
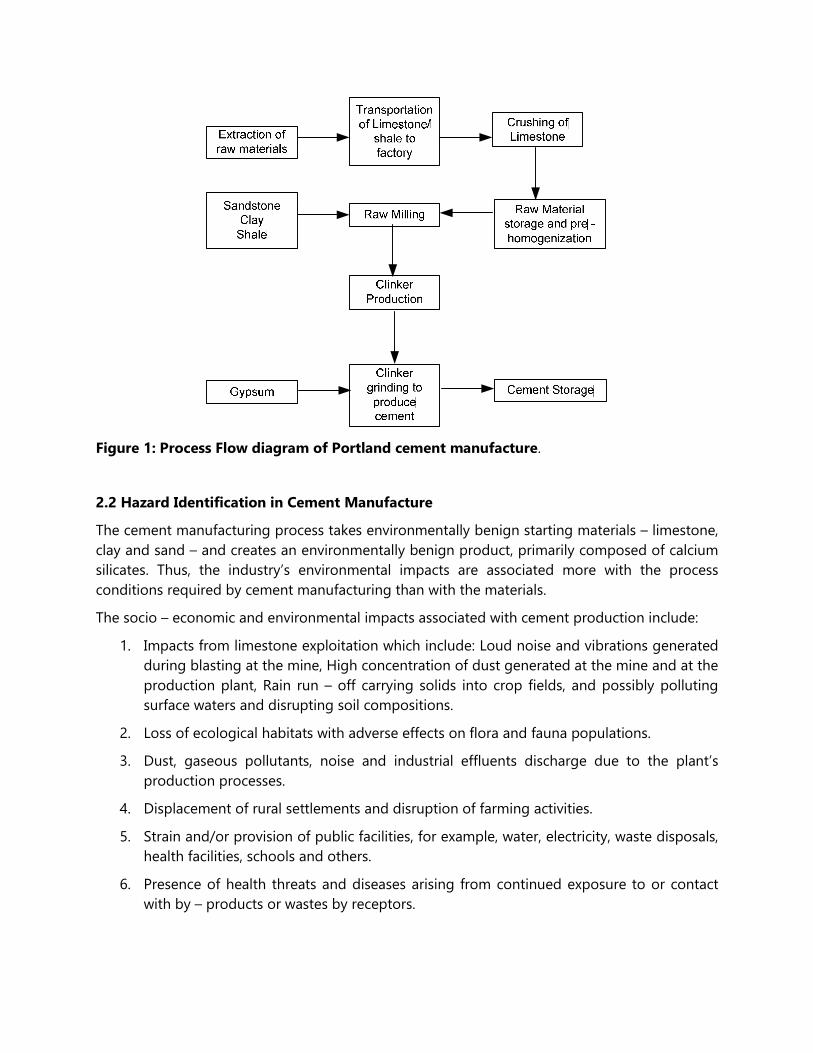
Gray Portland cement is used for structural applications and is the more common type of
cement produced. Figure 1 shows the production process for Portland cement. The production
process can be divided broadly into the following primary components: raw materials
acquisition and handling, kiln feed preparation, pyroprocessing, and finished cement grinding.
Each of the process is discussed as follows:
2.1.1 Raw Materials Acquisition and Handling
The initial production step in Portland cement manufacture is the raw materials acquisition.
Calcium, the element of highest concentration in Portland cement, is obtained from a variety of
calcareous raw materials, including limestone, chalk, sea shells, and an impure limestone known
as “natural cement rock”. Typically, these raw materials are obtained from open – face quarries
which vary in properties from facility to facility. Other elements included in the raw mix are
silicon, aluminum, and iron. These materials are obtained from ores and minerals such as sand,
shale, clay and iron ore.
2.1.2 Kiln Feed or Raw Mix Preparation
The second step in Portland cement manufacture is preparing the raw – mix, or kiln feed, for the
pyroprocessing operation. Raw material preparation includes a variety of blending and sizing
operations that are designed to provide a feed with appropriate chemical and physical
composition. The raw material processing operations differs for wet and dry processes.
Material transport associated with dry raw milling systems can be accomplished through a
variety of mechanisms, including screw conveyors, belt conveyors and pneumatic conveying
systems. The dry raw – mix is pneumatically blended and stored in specially constructed silos
until it is fed to the pyroprocessing system.
In the wet process, water is added to the raw mill during the grinding of the raw materials in ball
or tube mills, thereby producing pump able slurry, of approximately 65% solids. The slurry is
agitated, blended and stored in various kinds and sizes of cylindrical tanks or slurry basins until
it is fed to the pyroprocessing system.
2.1.3 Pyroprocessing
The heart of the Portland cement manufacturing process is the pyroprocessing system which
transforms the raw mix into clinkers, which are gray, glass – hard, spherically shaped nodules
that range from 0.32 to 5.1cm. The complex chemical reactions and physical processes that
constitute the transformation can be viewed conceptually as the following sequential events:
Evapouration of free water;
Evolution of combined water in the argillaceous components;
Calcination of the calcium carbonate (CaCo3) to calcium oxide (CaO);
Reaction of CaO with silica to form di – calcium silicate;
Reaction of CaO with the aluminium and iron – bearing constituents to form liquid
phase;
Formation of the clinker nodules;
Evapouration of volatile constituents and
Reaction of excess CaO with di – calcium silicate to form tri – calcium silicate.
This sequence of events may be conveniently divided into four stages namely: evapouration,
dehydration; Calcination and reaction and takes place over a temperature range of 1000C and
15000C in rotary kilns which are long, cylindrical slightly inclined furnaces. The kilns rotate at
about 1 to 4 revolutions per minute (rpm) and are lined with refractory to protect the steel shell
and retain heat within the kiln.
Five different pyroprocessing processes are used in the Portland cement industry, these are: the
wet process, the dry process, the semi – dry and/or semi – wet process, and the dry process with
a pre – heater/pre – calciner. Cement plants in Nigeria employ the wet, semi – wet and dry
processes in their operations.
2.1.4 Finish Cement Grinding
The final step in Portland cement manufacturing involves a sequence of blending and grinding
operations that transforms the clinker to finished Portland cement. Up to 5% gypsum or natural
anhydrite is added to the clinker during the grinding to control the cement setting time and
other speciality chemicals are added as needed to impart specific product properties.
Figure 1: Process Flow diagram of Portland cement manufacture.
2.2 Hazard Identification in Cement Manufacture
The cement manufacturing process takes environmentally benign starting materials – limestone,
clay and sand – and creates an environmentally benign product, primarily composed of calcium
silicates. Thus, the industry’s environmental impacts are associated more with the process
conditions required by cement manufacturing than with the materials.
The socio – economic and environmental impacts associated with cement production include:
1. Impacts from limestone exploitation which include: Loud noise and vibrations generated
during blasting at the mine, High concentration of dust generated at the mine and at the
production plant, Rain run – off carrying solids into crop fields, and possibly polluting
surface waters and disrupting soil compositions.
2. Loss of ecological habitats with adverse effects on flora and fauna populations.
3. Dust, gaseous pollutants, noise and industrial effluents discharge due to the plant’s
production processes.
4. Displacement of rural settlements and disruption of farming activities.
5. Strain and/or provision of public facilities, for example, water, electricity, waste disposals,
health facilities, schools and others.
6. Presence of health threats and diseases arising from continued exposure to or contact
with by – products or wastes by receptors.
7. Air quality concerns associated with high temperature combustion, with Nitrogen and
Sulfur Oxides (NOx and SO2) being of particular concern.
8. Emission of Carbon – dioxide (CO2), from two different sources – the calcinations of
limestone or other carbonate – containing starting materials and high rate of carbon fuel
consumption.
9. Emissions to water in the environment via effluent or industrial waste discharge.
10. Occupational hazards in relation to constant exposure to noise, cement kiln dust (CKD)
and other particulate matter, and other gaseous and chemical pollutants.
2.3 Environmental Risk Assessment (ERA)
Environmental risks refer to hazards or dangers which arise in or are transported through the air,
water, soil or biological food chain. Mathematically, it can be expressed as (Main, 2005):
Risk = Hazard * Exposure. ….. (1)
Risk assessment incorporates not only the probable adverse consequences but also the
evaluation of these risks by the society; and involves three major activities namely: Risk
Identification, Risk Estimation and Risk Evaluation.
Risk identification entails the recognition that a hazard with definable characteristics exist. It
would also involve the identification of consequences if the hazard was to occur. Risk estimation
is the scientific determination of the nature and level of the risks. It is the estimation of the
magnitude of the consequences of a hazard which can include consideration of the spatial and
temporal scale of the consequences and the time to onset of same. Risk evaluation is the
product of the likelihood of the hazard being realized and the severity of the consequences. It
entails the judgements about the acceptability or otherwise of risk probabilities and
consequences.
Risk identification and estimation warrant information on the nature and extent of the sources;
the chain of events, pathways and processes that link the cause to the effects; and the
relationship between the characteristics of the problem and the type of response. Thus
environmental risk assessment covers the risk to all ecosystems, including humans, exposed via,
or impacted via air, water and land; and it involves a search for the best route between social
benefits and environmental risks.
Environmental Risk Assessment (ERA) differs fundamentally from other environmental
management techniques such as Environmental impact Assessment (EIA) and Environmental
Auditing (EA). While EIA is a study of the effects of a proposed action on the environment, EA is
a management tool used by industries and organizations to evaluate their environmental
performance. ERA involves the identification, estimation and evaluation of hazards which
ultimately are transported through air, water, soil and biological food chain.
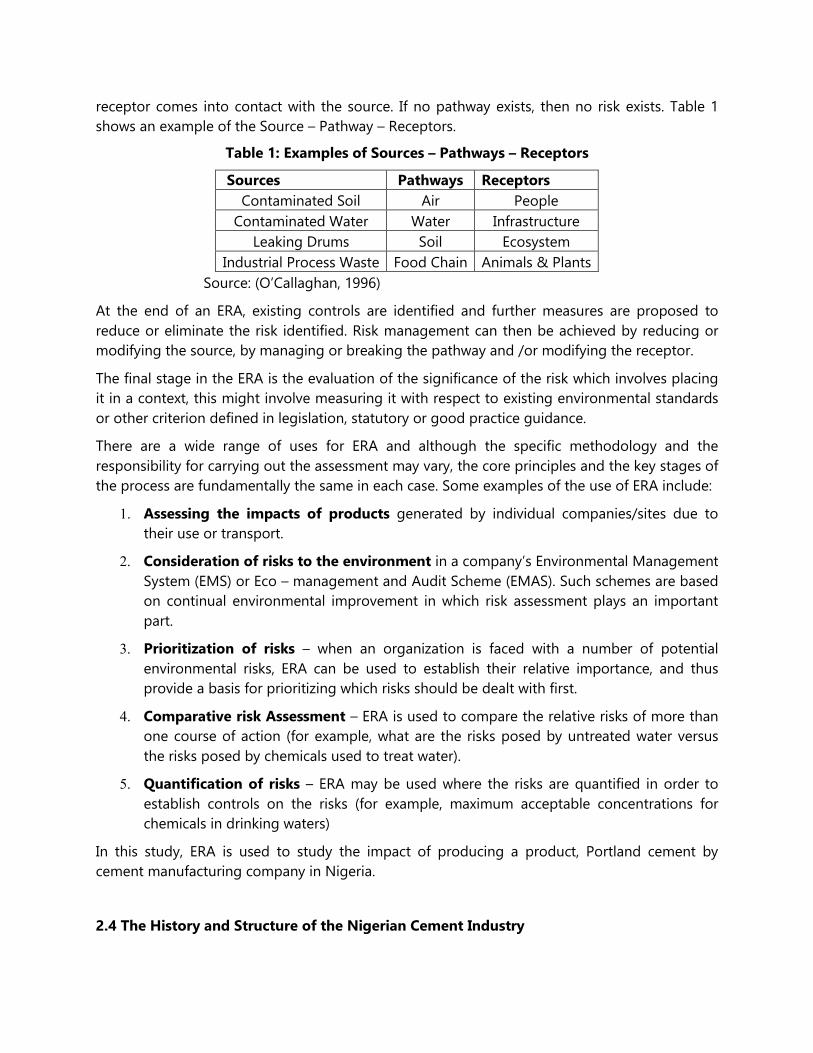
ERA frequently uses the concept of source – pathway – receptor. The source is the contaminant,
and the receptor is the particulate ecosystem, while the pathway is the linkage by which the
receptor comes into contact with the source. If no pathway exists, then no risk exists. Table 1
shows an example of the Source – Pathway – Receptors.
Table 1: Examples of Sources – Pathways – Receptors
Sources Pathways Receptors
Contaminated Soil Air People
Contaminated Water Water Infrastructure
Leaking Drums Soil Ecosystem
Industrial Process Waste Food Chain Animals & Plants
Source: (O’Callaghan, 1996)
At the end of an ERA, existing controls are identified and further measures are proposed to
reduce or eliminate the risk identified. Risk management can then be achieved by reducing or
modifying the source, by managing or breaking the pathway and /or modifying the receptor.
The final stage in the ERA is the evaluation of the significance of the risk which involves placing
it in a context, this might involve measuring it with respect to existing environmental standards
or other criterion defined in legislation, statutory or good practice guidance.
There are a wide range of uses for ERA and although the specific methodology and the
responsibility for carrying out the assessment may vary, the core principles and the key stages of
the process are fundamentally the same in each case. Some examples of the use of ERA include:
1. Assessing the impacts of products generated by individual companies/sites due to
their use or transport.
2. Consideration of risks to the environment in a company’s Environmental Management
System (EMS) or Eco – management and Audit Scheme (EMAS). Such schemes are based
on continual environmental improvement in which risk assessment plays an important
part.
3. Prioritization of risks – when an organization is faced with a number of potential
environmental risks, ERA can be used to establish their relative importance, and thus
provide a basis for prioritizing which risks should be dealt with first.
4. Comparative risk Assessment – ERA is used to compare the relative risks of more than
one course of action (for example, what are the risks posed by untreated water versus
the risks posed by chemicals used to treat water).
5. Quantification of risks – ERA may be used where the risks are quantified in order to
establish controls on the risks (for example, maximum acceptable concentrations for
chemicals in drinking waters)
In this study, ERA is used to study the impact of producing a product, Portland cement by
cement manufacturing company in Nigeria.
2.4 The History and Structure of the Nigerian Cement Industry
Makoju (2010) reported that demand for cement increased rapidly and initially all the
requirement was met with imports. For instance, imports which was estimated to be 80.000tons
in 1946 grew by more than double in 1950 and quadruple to 626,500 tons by 1960. All this
supply was met entirely with imports until the establishment of Nigercem in Nkalagu in the then
Eastern Region in 1957. This was followed by the construction of another 600,000tpa plant
sponsored by the then Western Region government in Ewekoro which was commissioned in
1960. Next was Bendel Cement Plant in Ukpilla in the then Bendel State (150,000mt) in 1964 and
Calabar Cement which was commissioned in 1965. In the North, at the Cement Company of
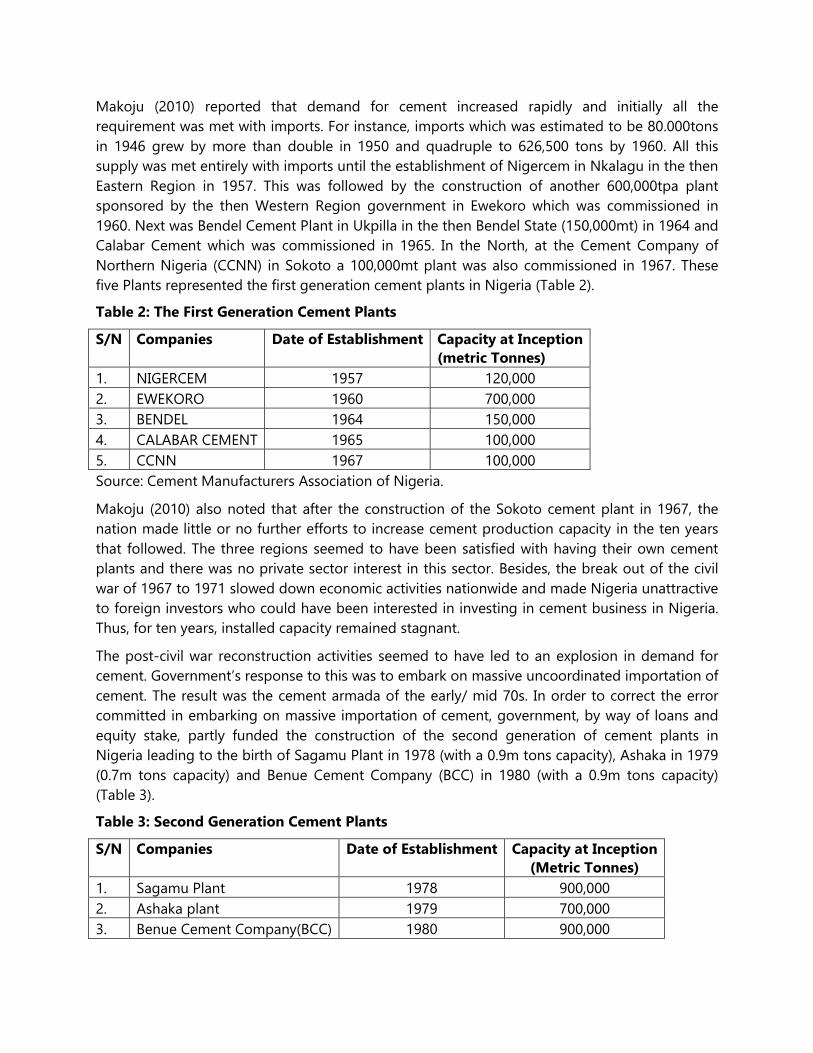
Northern Nigeria (CCNN) in Sokoto a 100,000mt plant was also commissioned in 1967. These
five Plants represented the first generation cement plants in Nigeria (Table 2).
Table 2: The First Generation Cement Plants
S/N Companies Date of Establishment Capacity at Inception
(metric Tonnes)
1. NIGERCEM 1957 120,000
2. EWEKORO 1960 700,000
3. BENDEL 1964 150,000
4. CALABAR CEMENT 1965 100,000
5. CCNN 1967 100,000
Source: Cement Manufacturers Association of Nigeria.
Makoju (2010) also noted that after the construction of the Sokoto cement plant in 1967, the
nation made little or no further efforts to increase cement production capacity in the ten years
that followed. The three regions seemed to have been satisfied with having their own cement
plants and there was no private sector interest in this sector. Besides, the break out of the civil
war of 1967 to 1971 slowed down economic activities nationwide and made Nigeria unattractive
to foreign investors who could have been interested in investing in cement business in Nigeria.
Thus, for ten years, installed capacity remained stagnant.
The post-civil war reconstruction activities seemed to have led to an explosion in demand for
cement. Government’s response to this was to embark on massive uncoordinated importation of
cement. The result was the cement armada of the early/ mid 70s. In order to correct the error
committed in embarking on massive importation of cement, government, by way of loans and
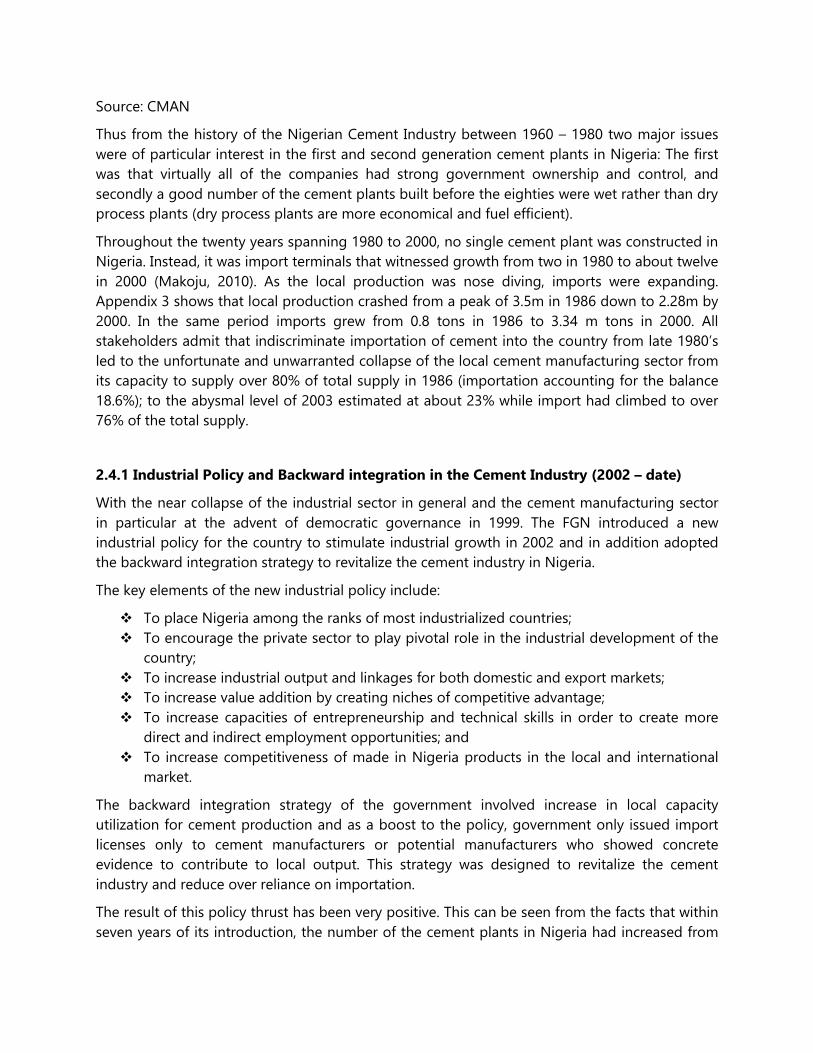
equity stake, partly funded the construction of the second generation of cement plants in
Nigeria leading to the birth of Sagamu Plant in 1978 (with a 0.9m tons capacity), Ashaka in 1979
(0.7m tons capacity) and Benue Cement Company (BCC) in 1980 (with a 0.9m tons capacity)
(Table 3).
Table 3: Second Generation Cement Plants
S/N Companies Date of Establishment Capacity at Inception
(Metric Tonnes)
1. Sagamu Plant 1978 900,000
2. Ashaka plant 1979 700,000
3. Benue Cement Company(BCC) 1980 900,000
Source: CMAN
Thus from the history of the Nigerian Cement Industry between 1960 – 1980 two major issues
were of particular interest in the first and second generation cement plants in Nigeria: The first
was that virtually all of the companies had strong government ownership and control, and
secondly a good number of the cement plants built before the eighties were wet rather than dry
process plants (dry process plants are more economical and fuel efficient).
Throughout the twenty years spanning 1980 to 2000, no single cement plant was constructed in
Nigeria. Instead, it was import terminals that witnessed growth from two in 1980 to about twelve
in 2000 (Makoju, 2010). As the local production was nose diving, imports were expanding.
Appendix 3 shows that local production crashed from a peak of 3.5m in 1986 down to 2.28m by
2000. In the same period imports grew from 0.8 tons in 1986 to 3.34 m tons in 2000. All
stakeholders admit that indiscriminate importation of cement into the country from late 1980’s
led to the unfortunate and unwarranted collapse of the local cement manufacturing sector from
its capacity to supply over 80% of total supply in 1986 (importation accounting for the balance
18.6%); to the abysmal level of 2003 estimated at about 23% while import had climbed to over
76% of the total supply.
2.4.1 Industrial Policy and Backward integration in the Cement Industry (2002 – date)
With the near collapse of the industrial sector in general and the cement manufacturing sector
in particular at the advent of democratic governance in 1999. The FGN introduced a new
industrial policy for the country to stimulate industrial growth in 2002 and in addition adopted
the backward integration strategy to revitalize the cement industry in Nigeria.
The key elements of the new industrial policy include:
To place Nigeria among the ranks of most industrialized countries;
To encourage the private sector to play pivotal role in the industrial development of the
country;
To increase industrial output and linkages for both domestic and export markets;
To increase value addition by creating niches of competitive advantage;
To increase capacities of entrepreneurship and technical skills in order to create more
direct and indirect employment opportunities; and
To increase competitiveness of made in Nigeria products in the local and international
market.
The backward integration strategy of the government involved increase in local capacity
utilization for cement production and as a boost to the policy, government only issued import
licenses only to cement manufacturers or potential manufacturers who showed concrete
evidence to contribute to local output. This strategy was designed to revitalize the cement
industry and reduce over reliance on importation.
The result of this policy thrust has been very positive. This can be seen from the facts that within
seven years of its introduction, the number of the cement plants in Nigeria had increased from
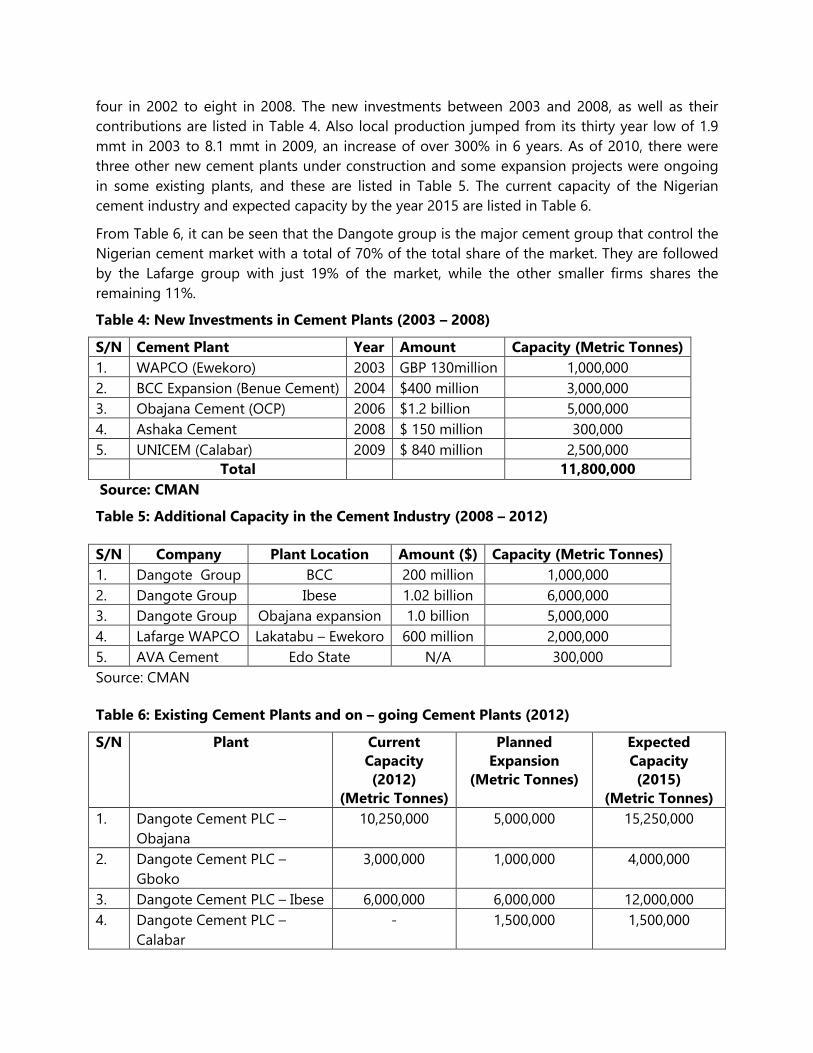
four in 2002 to eight in 2008. The new investments between 2003 and 2008, as well as their
contributions are listed in Table 4. Also local production jumped from its thirty year low of 1.9
mmt in 2003 to 8.1 mmt in 2009, an increase of over 300% in 6 years. As of 2010, there were
three other new cement plants under construction and some expansion projects were ongoing
in some existing plants, and these are listed in Table 5. The current capacity of the Nigerian
cement industry and expected capacity by the year 2015 are listed in Table 6.
From Table 6, it can be seen that the Dangote group is the major cement group that control the
Nigerian cement market with a total of 70% of the total share of the market. They are followed
by the Lafarge group with just 19% of the market, while the other smaller firms shares the
remaining 11%.
Table 4: New Investments in Cement Plants (2003 – 2008)
S/N Cement Plant Year Amount Capacity (Metric Tonnes)
1. WAPCO (Ewekoro) 2003 GBP 130million 1,000,000
2. BCC Expansion (Benue Cement) 2004 $400 million 3,000,000