52
1 Technical Guidance Note M18 (Monitoring) Monitoring of discharges to water and sewer
1
Technical Guidance Note M18 (Monitoring)
Monitoring of discharges to water and sewer
Monitoring of discharges to water and sewer
Version 5, October 2014 2
Foreword
This Technical Guidance Note (TGN) is one of a series providing guidance to our staff and
monitoring contractors, industry and other parties interested in the monitoring of discharges1 to
water. It is also a technical reference for our Operator Monitoring Assessment (OMA).
It describes our overall approach to operator self-monitoring (OSM) for discharges to the water
environment and provides guidance on the selection of analytical methods used for regulatory
purposes. The approach is also applicable to discharges to sewer, although caveats are given
in the text where discharges of difficult matrices may cause additional problems.
It contains:
• quality assurance and quality control requirements
• different approaches to sampling
• guidance on selection and validation of analytical methods
• reporting requirements
• an index of common monitoring methods.
We consider that the best way for us to have confidence in the quality and integrity of
selfmonitoring discharge data is for operators to use and adhere to a management system
approach. We expect operators carrying out their own monitoring to develop a documented
management system to cover all aspects of sampling and analysis of discharges. This will be
based on the requirements of proven international standards such as ISO/IEC 17025,
supported by accreditation as appropriate to provide additional reassurance.
This TGN will be particularly useful for operators with installations falling under the
Environmental Permitting Regulations (EPR), which implement the requirements of the
Integrated Pollution Prevention and Control (IPPC) Directive, and the Urban Waste Water
Treatment Regulations (UWWTR) (SI 94/2841).
Record of amendments
Version
number Date Amendments
1 July 2004 First published.
1 In this document the term discharge will be used to describe a release or emission of substances to the water environment, including sewers.
Monitoring of discharges to water and sewer
Version 5, October 2014 3
2 April 2009 Throughout the document sections have been updated to reflect additional and amended MCERTS schemes(1.2, 2.4, 3.5,) Definitions of validation criteria moved to a glossary (Appendix 1) Section 4.1 amended to emphasise that alternative methods to those listed in the Appendix may be used. Rewrite and update of introduction
Appendices covering method validation protocol (3) and performance
requirements (2) removed, as better placed in the appropriate MCERTS
performance standard. List of methods (now Appendix 3) updated,
glossary of terms created as Appendix 1. Sampling requirements now
Appendix 2.
3 March
2012 General – Document restructured, reordered and updated and some sections simplified, deleted or inserted, to reflect experience gained during OMA audits of operator self-monitoring. Section1 - Deleted section1.1 legislative requirements and moved section 2.1 to section 1.2 Section 1.2 concerning MCERTS renumbered section 2 and updated. Section 2 monitoring strategy renumbered section 3 and updated Expanded section on quality assurance (2.5), moved from sub section 2.5 to its own section 4 Sections on Sampling and laboratory analytical systems updated and renumbered 5 and 6. Table 2: examples of best practice in sample preservation added. Added new section 7 on continuous water monitors, reflecting their increased availability and robustness. Other sections updated and renumbered. Appendix 2 on sampling requirements removed as covered elsewhere, two new appendices added on laboratory method performance requirements (A2) and using quality control charts (A3). Index of monitoring methods ( now A4) updated.
4 August
2014 Rebrand to Natural Resources Wales
5 October
2014 Further reformatting

Monitoring of discharges to water and sewer
Version 5, October 2014 4
Status of this guidance
This TGN may be subject to review and amendment following its publication.
Contents
1. Introduction 6
1.1 Scope 6
1.2 Operator self-monitoring 6
2. MCERTS and discharges to water 7
3. Monitoring strategy 8
3.1 Approaches to monitoring discharges 8
3.2 Definition of substance to be measured 9
3.3 Specification of analytical method performance: error targets 10
4. Quality assurance 11
4.1 Management systems 11
4.2 Management 12
4.3 Sampling programme design 12
4.4 Staff training 13
4.5 Internal audit and review 13
4.6 Operator Monitoring Assessment (OMA) - Audit of Operators by Natural Resources Wales 13
5. Sampling 13
5.1 Choice of sampling point 14
5.2 Composite or spot samples 14
5.3 Automatic sampling equipment and MCERTS 15
5.4 Access, facilities and services 15
5.5 Sample bottles, storage and transportation. 16
5.6 Sampling procedure manual 17
5.7 Sampling quality control 18
Monitoring of discharges to water and sewer
Version 5, October 2014 5
6. Laboratory analysis 19
6.1 Choosing a method 19
6.2 Laboratory equipment 19
6.3 Test kits 20
6.4 Validation 20
6.5 Methods and procedures 20
6.6 Quality control 21
6.7 Measurement uncertainty 22
6.8 Collection and reporting of data 23
6.9 Electronic data reporting 23
7. Continuous water monitors 23
7.1 Location of sensor 23
7.2 Type of CWM 24
7.3 Calibration and maintenance 24
8. Flow measurement 24
9. References 25
Appendix 1: Glossary of terms 26
Appendix 2: Performance characteristics of analytical methods 28
Appendix 3: Preparing and interpreting simple AQC charts 29
A3.1 Introduction 29
A3.2 Laboratory Control (AQC) Samples 29
A3.3 Treatment of results for Laboratory Control Samples 30
A3.4 Setting Up and Updating Control Charts 30
A3.5 Control Rules and Failure Investigation 31
A3.6 Reporting 31
A3.7 Example: Shewhart Chart 31
Appendix 4: Index of monitoring methods 34
Monitoring of discharges to water and sewer
Version 5, October 2014 6
1. Introduction
1.1 Scope
This TGN provides guidance on the monitoring of effluent discharges to the water
environment. It is primarily aimed at operators of industrial plants and their monitoring
contractors, and our permitting and regulatory officers.
It covers:
• management and quality assurance of monitoring activities
• the role of MCERTS
• sampling and collection
• laboratory analysis – selecting methods and quality control
• continuous and portable monitors/laboratory equipment – calibration and quality control
• what to look for when auditing (operator internal audits and our audits).
1.2 Operator self-monitoring
We must ensure that operator self-monitoring is performed correctly to an acceptable standard
and to this end encourage operators to use and adhere to quality management systems.
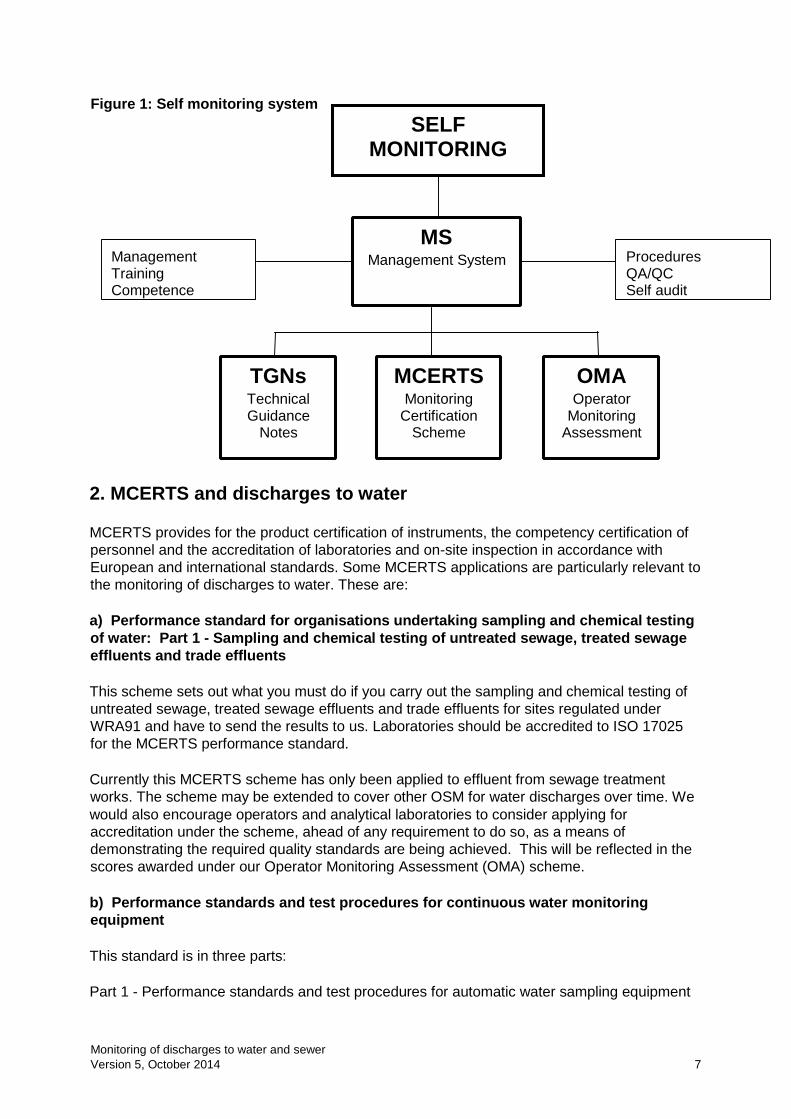
Operator self-monitoring is supported by a number of tools that will give both regulator and
regulated confidence in the accuracy and reliability of data (see Figure 1):
• Technical guidance notes, for example this document, provide a specification of the
standards and procedures to be employed.
• The MCERTS scheme ensures that specific monitoring services and equipment are
independently quality assured and therefore fit for purpose. MCERTS supports the
requirements of EU Directives.
• The Operator Monitoring Assessment (OMA) scheme is used to provide a consistent and
transparent approach to the assessment of the management and performance of an
operator’s monitoring arrangements, with a view to identifying areas that may require
improvement.
Monitoring of discharges to water and sewer
Version 5, October 2014 7
2. MCERTS and discharges to water
MCERTS provides for the product certification of instruments, the competency certification of
personnel and the accreditation of laboratories and on-site inspection in accordance with
European and international standards. Some MCERTS applications are particularly relevant to
the monitoring of discharges to water. These are:
a) Performance standard for organisations undertaking sampling and chemical testing
of water: Part 1 - Sampling and chemical testing of untreated sewage, treated sewage
effluents and trade effluents
This scheme sets out what you must do if you carry out the sampling and chemical testing of
untreated sewage, treated sewage effluents and trade effluents for sites regulated under
WRA91 and have to send the results to us. Laboratories should be accredited to ISO 17025
for the MCERTS performance standard.
Currently this MCERTS scheme has only been applied to effluent from sewage treatment
works. The scheme may be extended to cover other OSM for water discharges over time. We
would also encourage operators and analytical laboratories to consider applying for
accreditation under the scheme, ahead of any requirement to do so, as a means of
demonstrating the required quality standards are being achieved. This will be reflected in the
scores awarded under our Operator Monitoring Assessment (OMA) scheme.
b) Performance standards and test procedures for continuous water monitoring
equipment
This standard is in three parts:
Part 1 - Performance standards and test procedures for automatic water sampling equipment
Figure 1: Self monitoring system
Management Training Com p etence
Procedures QA/QC Self audit
OMA Operator
Monitoring Assessment
TGNs Technical Guidance
Notes
MCERTS Monitoring
Certification Scheme
MS Management System
SELF MONITORING
Monitoring of discharges to water and sewer
Version 5, October 2014 8
Part 2 – Performance standards and test procedures for on-line monitors
This covers monitoring of: ammonia; COD; conductivity; dissolved oxygen; free cyanide;
nitrates; orthophosphate; pH; temperature; TOC; total arsenic; total cadmium; total chlorine;
total copper; total lead; total mercury; total nickel; total oxidised nitrogen; total phosphorus;
turbidity
Equipment covered has applications under various regulatory regimes including UWWTR,
EPR and WRA91 for monitoring discharges.
Part 3 – Performance standards and test procedures for water flowmeters (See section 8 and
d below for more details of the overall flow monitoring scheme)
c) Performance standards and test procedures for portable water monitoring
equipment
This covers monitoring of: ammonia; chlorophyll a; COD; conductivity; dissolved oxygen; free
cyanide; nitrate; nitrite; orthophosphate; pH; temperature; total arsenic; total cadmium; total
chlorine; total copper; total lead; total mercury; total nickel; turbidity
d) Minimum requirements for the self-monitoring of effluent flow
The scheme sets the minimum standards that we require for operators that carry out
selfmonitoring of effluent flow. It also establishes a competency standard for independent
MCERTS Inspectors who will inspect the operators’ effluent flow monitoring arrangements.
Further information on these applications including copies of the performance standards, other
guidance, and lists of certified instruments can be obtained from our web site.
3. Monitoring strategy
3.1 Approaches to monitoring discharges
Monitoring can be conveniently classified into two types:
• Periodic monitoring – In the context of discharges to water periodic monitoring usually
occurs by removing a discrete sample from the effluent flow and sending the sample to a
laboratory for analysis. Samples can be single spot samples or composite samples
collected over a period of time, for example over 24 hours. This is discussed further in
section 3. For a number of determinands portable instrumentation can be taken to the
discharge site, examples are pH and dissolved oxygen measurements.
• Continuous Water Monitoring systems (CWMs) – automatic measurements carried out
continuously, with few if any gaps in the data produced. Measurement may be carried out
in situ in the effluent flow or a sample taken from the effluent flow automatically to a
permanently sited instrument. Continuous monitoring for certain determinands is specified
in WID2 and IPPC sector guidance. CWMs are often used to trigger alarms when permit
limits are approached, so effluent can be diverted automatically to storage before the
receiving water becomes polluted.
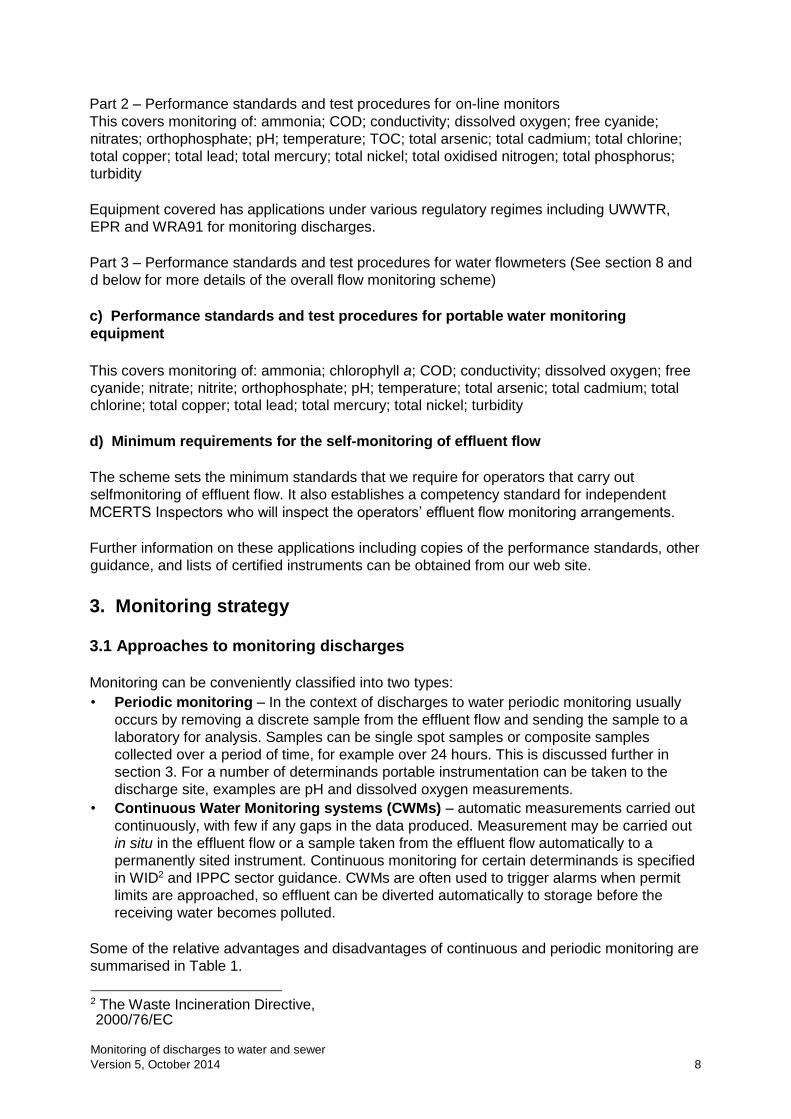
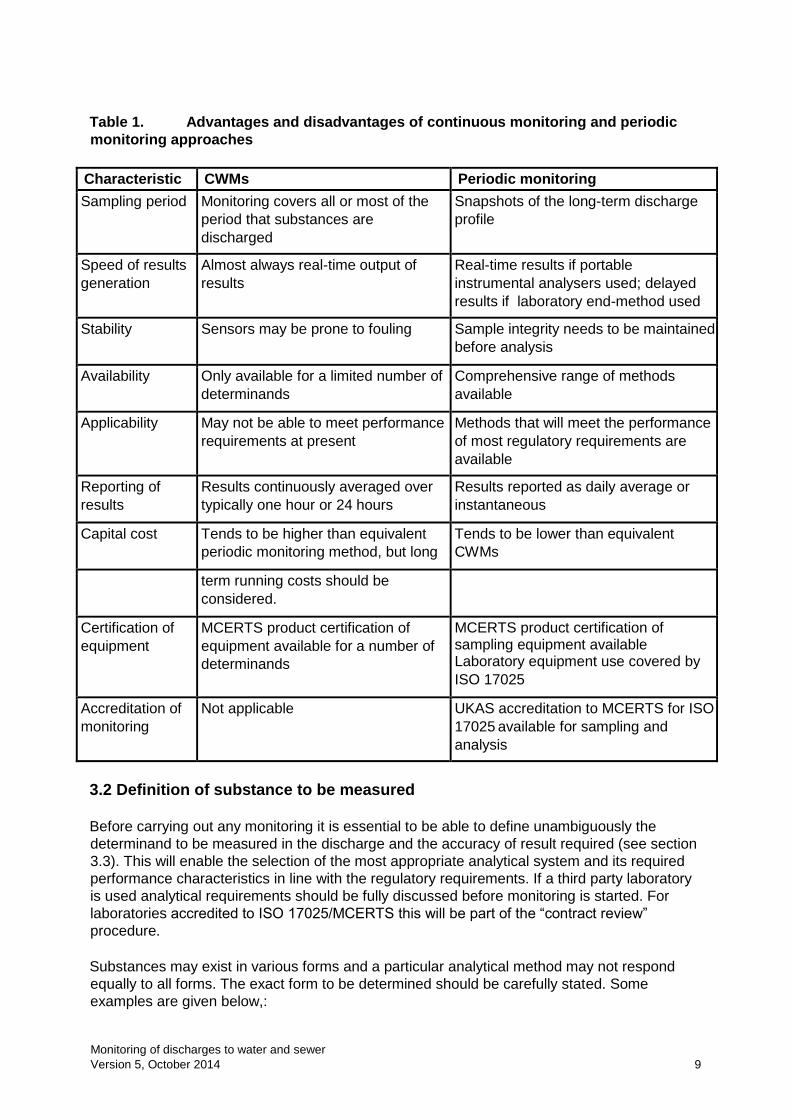
Some of the relative advantages and disadvantages of continuous and periodic monitoring are
summarised in Table 1.
2 The Waste Incineration Directive, 2000/76/EC
Monitoring of discharges to water and sewer
Version 5, October 2014 9
Table 1. Advantages and disadvantages of continuous monitoring and periodic
monitoring approaches
Characteristic CWMs Periodic monitoring
Sampling period Monitoring covers all or most of the
period that substances are
discharged
Snapshots of the long-term discharge
profile
Speed of results
generation
Almost always real-time output of
results
Real-time results if portable
instrumental analysers used; delayed
results if laboratory end-method used
Stability Sensors may be prone to fouling Sample integrity needs to be maintained
before analysis
Availability Only available for a limited number of
determinands
Comprehensive range of methods
available
Applicability May not be able to meet performance
requirements at present
Methods that will meet the performance
of most regulatory requirements are
available
Reporting of
results
Results continuously averaged over
typically one hour or 24 hours
Results reported as daily average or
instantaneous
Capital cost Tends to be higher than equivalent
periodic monitoring method, but long
Tends to be lower than equivalent
CWMs
term running costs should be
considered.
Certification of
equipment
MCERTS product certification of
equipment available for a number of
determinands
MCERTS product certification of sampling equipment available Laboratory equipment use covered by
ISO 17025
Accreditation of
monitoring
Not applicable UKAS accreditation to MCERTS for ISO
17025 available for sampling and
analysis
3.2 Definition of substance to be measured
Before carrying out any monitoring it is essential to be able to define unambiguously the
determinand to be measured in the discharge and the accuracy of result required (see section
3.3). This will enable the selection of the most appropriate analytical system and its required
performance characteristics in line with the regulatory requirements. If a third party laboratory
is used analytical requirements should be fully discussed before monitoring is started. For
laboratories accredited to ISO 17025/MCERTS this will be part of the “contract review”
procedure.
Substances may exist in various forms and a particular analytical method may not respond
equally to all forms. The exact form to be determined should be carefully stated. Some
examples are given below,:
Monitoring of discharges to water and sewer
Version 5, October 2014 10
Dissolved, total or particulate - for metals and nutrients the dissolved portion of a sample is
defined as that which will pass through a 0.45 micron membrane filter. Normally this filtration
will take place immediately after sampling and the procedure employed should be fully
documented (see section 3.4). Disposable single use filters can be used.
Total mercury - the method employed should be able to determine organo-mercury
compounds as well as inorganic mercury, the effectiveness of sample digestion procedures to
break down some compounds may need to be demonstrated.
Phosphorus - phosphorus can exist in various forms in the water environment, including
orthophosphates, condensed phosphates and organophosphates. Recognised methods of
analysis utilise an acid medium, as some of the condensed phosphates may be partially
hydrolysed and labile organic phosphorus compounds broken down if present. It is therefore
not possible to specify exactly the form of phosphorus being measured, so the term reactive
phosphorus is employed. The fractions normally quoted are dissolved reactive phosphorus
(sample filtered through 0.45 micron membrane), total reactive phosphorus (unfiltered sample)
and total phosphorus (unfiltered sample pre-digested).
Phenols - individual phenols can be identified and determined chromatographically but a
measure of the phenol content of a test sample can be obtained using the colorimetric phenol
index method. Many common phenolic compounds will be detected by this method, but it is
not equally sensitive to all. The system is calibrated using phenol itself, all other phenols will
be determined as phenol, without regard to their relative sensitivity. The phenol index
therefore only includes those phenolic compounds that can be determined under the specified
conditions.
Groups or classes of determinand - some determinands are grouped into classes such as
polycyclic aromatic hydrocarbons (PAHs) and polychlorinated biphenyls (PCBs), which are
large groups of chemicals and care must be taken to specify which individual species are to
be monitored. Factors such as analytical response and harmfulness should be considered.
Non specific (empirical) methods - such methods should be carefully defined and applied,
as the methods themselves define the determinand. An example is biochemical oxygen
demand (BOD) where it is imperative to define length of test (5 days is normal) and whether or
not allylthiourea (ATU) is to be added to suppress nitrification. Electrical conductivity is
another example, the determination should be either made at a specified temperature or the
measuring electrode must be temperature compensated to a standard value, usually 25°C.
3.3 Specification of analytical method performance: error targets
Analytical results are estimates of the true value or concentration. To ensure that results are fit
for their intended purpose, we have set performance targets for analytical accuracy. For
regulatory monitoring the results must show within acceptable limits of uncertainty that an
operator is meeting the conditions of the permit. If errors are not known and under control, we
will not be sure that permits are being complied with.
These performance targets are set in terms of both systematic errors (bias, trueness) and
random errors (precision), and an up to date list can be found in the latest version of the
MCERTS standard3, and in Appendix 2 of this document. Initial estimates of precision and 3 MCERTS Performance Standard for Organisations Undertaking Sampling and Chemical Testing of
Water Part 1 - Sampling and chemical testing of untreated sewage, treated sewage effluents and trade
effluents

Monitoring of discharges to water and sewer
Version 5, October 2014 11
bias are calculated during method validation studies (see section 6). To obtain MCERTS
accreditation a laboratory must not only show evidence of being able to achieve the
performance for each determinand during method validation but must maintain the
performance during routine operation. UKAS will check for continued compliance with
MCERTS requirements during annual surveillance audits. However, in-house unaccredited
laboratories should also aim to meet these targets.
Some trade effluents and discharges to sewer may be more difficult to analyse due to the
nature of the matrix, for example very high organic content, high solids etc. It may not be
possible to attain the targets set in the MCERTS standard. If this situation arises the actual
analytical performance that can be obtained should be reported to us. The MCERTS standard
makes provision for this under “ongoing validation”. We will then be able to decide if the
reported result will allow proper assessment of compliance with permit, or whether further
method development or even a change in analytical method is required.
4. Quality assurance
4.1 Management systems
The operator responsible for self-monitoring must ensure their management system covers all
aspects of self-monitoring, including:
• management of self-monitoring
• sampling programme design
• sampling procedures (see section 5)
• analysis and reporting procedures ( see section 6)
• staff training
• the process of audit and review of sampling and analysis operations
• addressing non-conformities.
The system used should be fully documented, for example in a quality manual.
The use of a third party contractor for some or all aspects of sampling and analysis is
acceptable. If the subcontractor is accredited to ISO 1702514 or MCERTS, as appropriate, the
operator will not require a quality system for those subcontracted parts but remains
responsible for the overall quality of the results.
ISO 17025 is an international standard that specifies the general requirements for laboratories
to demonstrate their technical competence. Laboratories are accredited to ISO 17025 by
UKAS (United Kingdom Accreditation Service) for specified tests, to give independent
recognition of competence to perform certain tests or calibrations. ISO 17025 is also the
standard used to accredit sampling activities, and is not restricted to laboratories, so
organisations that specialise in sampling may also gain accreditation.
ISO 17025 is clearly split into two major parts, management requirements and technical
requirements. The management requirements are written to ensure laboratory management
systems comply with ISO 9001.
As it only specifies requirements in general terms, ISO 17025 recognises that further
explanations may be needed, elaborating on the general criteria to for specific fields of testing
and calibration. MCERTS provides such an application for sampling and analysis of effluents.
Monitoring of discharges to water and sewer
Version 5, October 2014 12
Some operators may already be certified to ISO 9001, which is a generic standard for a quality
management system approach that is applicable to all organisations irrespective of size, type
of field of operation, including laboratories. Unlike ISO 17025 it does not contain reference to
the technical requirements of laboratories, so it cannot be assumed that laboratories holding
ISO 9001 certification will produce results fit for our purpose.
Operators may also use ISO 14001 or in-house management systems to cover monitoring
activities.
4.2 Management
The quality manual must include a clear quality policy statement, endorsed by a senior
executive. This should demonstrate the operators’ commitment to quality.
The person with overall responsibility for the self-monitoring quality policy (often termed quality
manager) must be identified, as must the person or persons responsible for control and
implementation of the self-monitoring process (technical management). Organisational charts
must be available that includes defined lines of responsibility.
In order to preserve the independence of compliance monitoring, it is good practice that
operation of the plant/process, wherever practical, is organisationally separate from sample
scheduling and collection of samples. This is to promote independence of self monitoring from
undue commercial pressures and influences. Appropriate evidence of such separation can be
presented in the organisation’s quality manual.
A clear document control system must be in place, to ensure only the latest versions of
documents and procedures are in use. All documents and amendments to documents must be
authorised.
The quality manual must contain a procedure to investigate complaints and anomalies
regarding the self-monitoring process.
Records must be kept to provide an auditable trail from definition of sampling programme to
results reporting.
4.3 Sampling programme design
The operator should set out a sampling schedule in advance of an assessment period, at
frequencies stated in its permit. The schedule is usually annual on a calendar year basis, but
this may not be suitable for batch processes or plants that operate seasonally. Best practice
would include contingency arrangements for sampling event failures, for example
malfunctioning autosamplers. The sampling schedule may need to be agreed with us in
advance. Failure to comply with the agreed sampling schedule may lead to us taking
enforcement action. However, in certain circumstances we will agree to a sampling event
being rescheduled, due, for example, to adverse weather conditions or plant operational
matters. For some regulatory regimes the Operator will need to inform us of any missed
samples within 24 hours of the scheduled event.
Sampling frequency will vary depending on the reason for sampling and the nature of the
process being monitored.
Monitoring of discharges to water and sewer
Version 5, October 2014 13
4.4 Staff training
All staff involved in the self-monitoring process must be shown to be competent in carrying out
their duties. Staff should be trained in the necessary skills and a detailed record of training for
each individual should be maintained as part of the quality system. Each documented
procedure used by the staff should be signed off by an appropriate trainer. A programme of
training updates should be detailed in the management system. Training records can include
details of formal qualification, internal courses, instrument manufacturers training and in-house
training.
4.5 Internal audit and review
The operator is required to carry out a series of audits of its management system. These
should cover all aspects of the monitoring process and serve to verify that documented
procedures are being adhered to. The audits should be pre-planned on an annual cycle, and,
if possible, carried out by trained staff independent of the audited procedure. Audit findings
and any corrective actions arising must be recorded, and follow up audits undertaken to
ensure any corrective actions are effective.
A management review of the management system should take place at least annually. It
should cover the results of internal audits and assessments by external bodies, and actions
taken to correct non-conformances. It should also consider feedback or complaints from us
and others. Details of management reviews should be recorded along with corrective actions
taken.
Assessment of performance in interlaboratory proficiency tests and internal Analytical Quality
Control (AQC) should be made, but this will not be required if a third party laboratory
accredited to MCERTS/ISO 17025 is used. However, we may request information regarding a
laboratory’s performance in analytical quality control and participation in proficiency testing
schemes.
4.6 Operator Monitoring Assessment (OMA) - Audit of Operators by Natural
Resources Wales
A general assessment of the monitoring performance of the operator will be made using the
OMA scheme. This may include vertical audits of specific samples. This auditing scheme was
developed to assess an operator’s self monitoring arrangements and identify if any
improvements are required. OMA covers:
• management, training and competence of personnel
• fitness for purpose of monitoring methods
• maintenance and calibration of monitoring equipment
• quality assurance of monitoring.
Guidance on what to expect in an audit and how to carry one out can be found on the
MCERTS website.
5. Sampling
Monitoring of discharges to water and sewer
Version 5, October 2014 14
5.1 Choice of sampling point
Discharge sample points must be at a location that ensures that the sample is truly
representative of the discharge.
• The sampling point location should be agreed with us, documented and clearly and
permanently labelled.
• A sampling position in a pipe or channel must be sufficiently far downstream of the last
inflow that mixing of the two streams is complete.
• Samples at an outfall should be taken from regions of high turbulence and good mixing, usually at the centre of the discharge. Solid materials will have little chance to settle out here.
• Samples in channels should be collected away from the sides and bottom of the channel
to avoid contamination of the sample with sediment and biological growths.
• When sampling from chambers (for example manholes), avoid contamination of the
sample by the disturbance of deposits from the cover when the cover is lifted and prevent
contamination of the sample from the chamber walls and any bottom deposits.
• Samples may also be drawn off from effluent streams at a tap. Care should be taken to
ensure any dead space is flushed out with effluent before the sample is collected.
Sampling staff should be aware that manholes and similar confined spaces are
dangerous and must not be entered unless in accordance with a safe system of work
and after appropriate training.
When automatic samplers are employed for composite sampling care should be taken to
ensure the sample probe is deployed taking the above factors into consideration. Also it is
important to ensure that the probe remains in the effluent flow during the entire period each
sample aliquot is being taken i.e. variations in effluent flow should not result in the sample
probe being left dangling in the air or in contact with the bottom of the channel.
Effluent may be discharged in batches from hold-up tanks, for example discharge may only be
permitted at high tides. Wherever possible, the tanks should be mixed, and in some cases
samples are taken from recirculation lines. If good mixing is not possible, it may be necessary
to increase the frequency of sampling during discharge.
5.2 Composite or spot samples
There are two main sampling methods identified for wastewater, composite sampling and spot
sampling:
Composite samples. Two types of composite sample are commonly used, flow-proportional
and time-proportional. For a flow-proportional sample, a fixed amount of sample is taken for
each pre-defined volume of effluent (for example every 10 m3). For time-proportional samples,
a fixed amount of sample is taken from the effluent for each time unit (for example every
hour). The analysis of a composite sample gives an average value of the determinand during
the period over which the sample has been collected. It is normal to collect composite
samples over 24 hours to give a daily mean value. Shorter times can be used with prior
agreement from us.
Monitoring of discharges to water and sewer
Version 5, October 2014 15
Flow proportional sampling should be employed when the volume of effluent discharged
varies significantly throughout the sampling period. When the volume of discharge is relatively
constant then time proportional composites are appropriate.
Automatic sampling equipment is recommended (see section 5.3). However, it is necessary to
consider the stability of the target substances over the total sample collection time, as
samples may deteriorate while sitting in the automatic sampling device.
Spot samples. These are discrete samples taken at random time intervals from a discharge,
and are not related to volume of discharge. They are best suited:
• where the composition of the waste water is relatively constant;
• when the discharge contains mineral oil or volatile substances, or when, due to
decomposition, evaporation or coagulation, the target substances are not stable in the
sample;
• separate phases are present (for example an oil layer floating on water);
• to check the quality of the discharge at a particular moment, normally to assess
compliance with the permit conditions;
• when the discharge is not continuous (from batch or hold-up tanks), but only when the
effluent is well mixed.
Avoid collecting larger object and floating matter that is not representative of the discharge.
Bulked composites. When a bulk sample is prepared by manually compositing a series of
samples in a laboratory, it is important to consider the stability of the determinand being
measured. For example, BOD will start to deteriorate significantly after 24 hours.
It may not be appropriate to automatically collect composite samples for periods greater than
24 hours, due to the stability of the determinands being monitored. For example, BOD, pH,
COD, ammonia, even when autosamplers are refrigerated.
5.3 Automatic sampling equipment and MCERTS
We require that automatic sampling devices used for self-monitoring purposes have been
tested and certified to the MCERTS performance standard:
Continuous Water Monitoring Equipment Part 1: Performance standards and conformity
testing procedures for automatic wastewater sampling equipment
This document and further information regarding the MCERTS scheme can be obtained from
our web-site. A list of certified equipment is held by Sira Certification Services and can be
accessed on the Sira Certification website or the MCERTS website.
Note that the MCERTS standard only covers sampling from non-pressurised channels and
vessels. Break tanks or other such devices may be installed to allow monitoring to take place.
5.4 Access, facilities and services
Access, facilities and services required for sampling will vary depending on the approach
taken to monitoring, and the equipment used. However all require:
• a safe means of access to, and a safe place of work at the sampling position
• provision of shelter and weatherproofing of equipment
Monitoring of discharges to water and sewer
Version 5, October 2014 16
• space for the equipment and personnel
• essential services, for example, electricity and lighting.
5.5 Sample bottles, storage and transportation.
If preservation of samples by refrigeration is required, then during transportation of samples to
the laboratory, including retention time in an automatic sampling device, the sample storage
environment should maintain a temperature of 5±3°C, using ice packs, refrigerators or other
appropriate methods. An organisation carrying out sampling should have appropriate
procedures for demonstrating this. It is recognised that some time may be required to bring
the sample temperature to within this range.
Samples should be transported in sealed containers, which should be regularly cleaned and
disinfected. Examination of the samples should be undertaken as soon as possible after
collection. Every attempt should be made to start the examination within 24 hours of sample
collection. Where logistics do not allow this, samples may be examined up to 48 hours after
collection provided they are kept cool (5±3°C) and in the dark.
When samples are stored at a laboratory, method specific storage requirements may need to
be invoked, for example, laboratory storage temperatures may be 1-5°C
Sample containers should be appropriate for the determinand and analytical system being
employed. Wherever possible they should be supplied by the analysing laboratory. Sample
containers should not be rinsed with sample before filling unless specified in the sampling
procedures.
It is very important to take note of laboratory requirements regarding the filling of sample
containers, for example some test will require no air space be left after filling to stop loss of
volatile components, while others need space left in the bottle to allow addition of extraction
solvents when reaching the laboratory. Failure to carry out laboratory instructions on the use
of sample bottles may lead to invalid analytical results. Laboratories accredited to ISO 17025
for an MCERTS standard should either reject improperly presented samples, or if the
customer insists on analysing the samples then a disclaimer should accompany the results
stating they may be invalid.
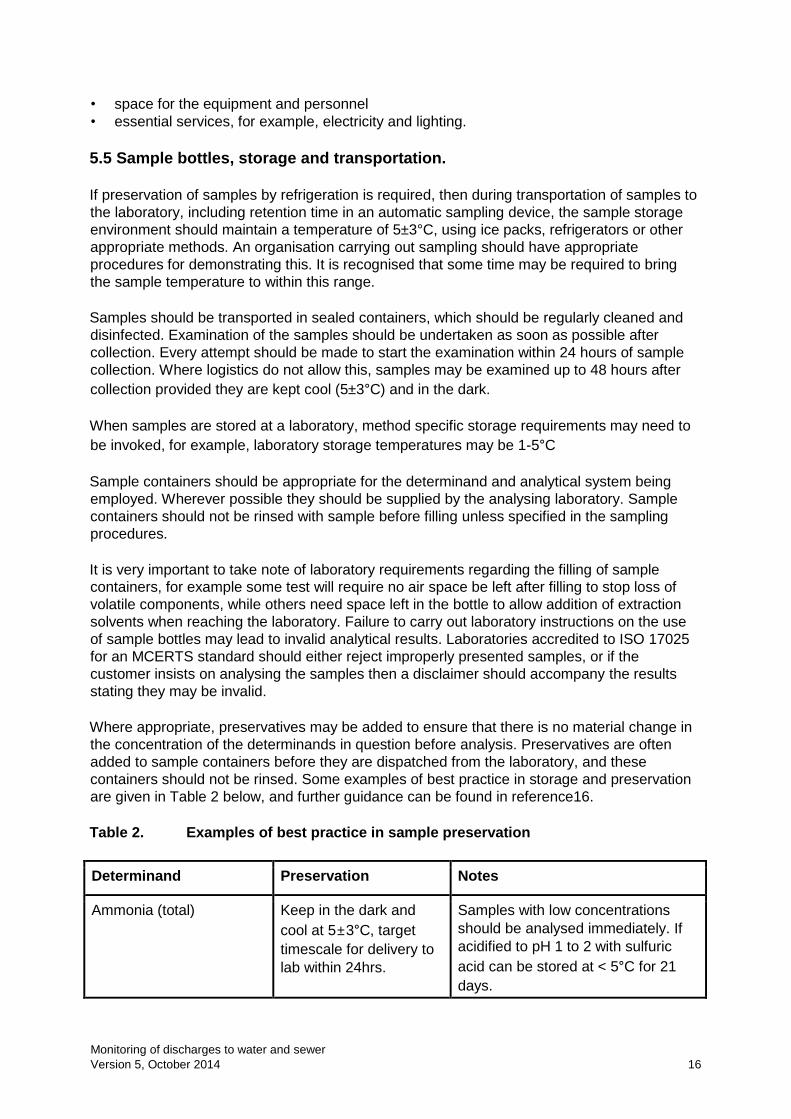
Where appropriate, preservatives may be added to ensure that there is no material change in
the concentration of the determinands in question before analysis. Preservatives are often
added to sample containers before they are dispatched from the laboratory, and these
containers should not be rinsed. Some examples of best practice in storage and preservation
are given in Table 2 below, and further guidance can be found in reference16.
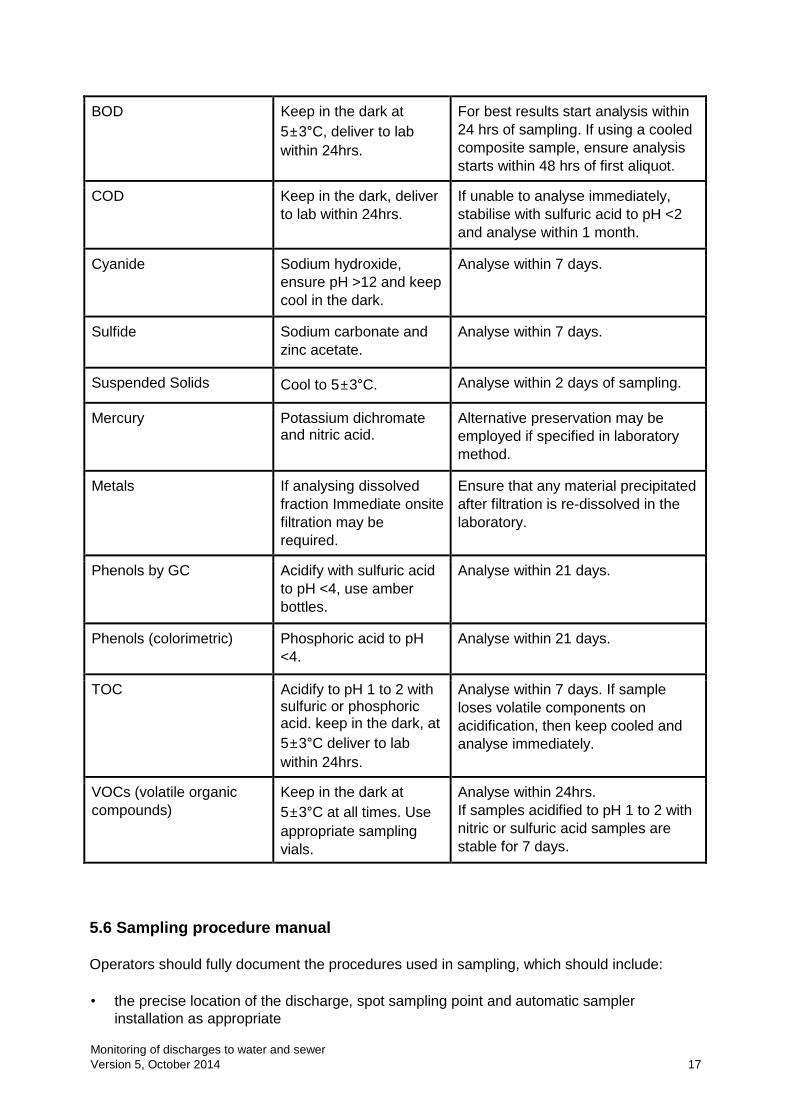
Table 2. Examples of best practice in sample preservation
Determinand Preservation Notes
Ammonia (total) Keep in the dark and
cool at 5±3°C, target
timescale for delivery to
lab within 24hrs.
Samples with low concentrations
should be analysed immediately. If
acidified to pH 1 to 2 with sulfuric
acid can be stored at < 5°C for 21
days.
Monitoring of discharges to water and sewer
Version 5, October 2014 17
BOD Keep in the dark at
5±3°C, deliver to lab
within 24hrs.
For best results start analysis within
24 hrs of sampling. If using a cooled
composite sample, ensure analysis
starts within 48 hrs of first aliquot.
COD Keep in the dark, deliver
to lab within 24hrs.
If unable to analyse immediately,
stabilise with sulfuric acid to pH <2
and analyse within 1 month.
Cyanide Sodium hydroxide,
ensure pH >12 and keep
cool in the dark.
Analyse within 7 days.
Sulfide Sodium carbonate and
zinc acetate.
Analyse within 7 days.
Suspended Solids Cool to 5±3°C. Analyse within 2 days of sampling.
Mercury Potassium dichromate and nitric acid.
Alternative preservation may be
employed if specified in laboratory
method.
Metals If analysing dissolved
fraction Immediate onsite
filtration may be
required.
Ensure that any material precipitated
after filtration is re-dissolved in the
laboratory.
Phenols by GC Acidify with sulfuric acid
to pH <4, use amber
bottles.
Analyse within 21 days.
Phenols (colorimetric) Phosphoric acid to pH
<4.
Analyse within 21 days.
TOC Acidify to pH 1 to 2 with sulfuric or phosphoric acid. keep in the dark, at
5±3°C deliver to lab
within 24hrs.
Analyse within 7 days. If sample
loses volatile components on
acidification, then keep cooled and
analyse immediately.
VOCs (volatile organic
compounds)
Keep in the dark at
5±3°C at all times. Use
appropriate sampling
vials.
Analyse within 24hrs.
If samples acidified to pH 1 to 2 with
nitric or sulfuric acid samples are
stable for 7 days.
5.6 Sampling procedure manual
Operators should fully document the procedures used in sampling, which should include:
• the precise location of the discharge, spot sampling point and automatic sampler
installation as appropriate
Monitoring of discharges to water and sewer
Version 5, October 2014 18
• the sampling process
• the conditions of storage and transport of samples
• the types of bottles or containers and their closures
• the cleaning procedure for each type of bottle, container and closure
• details of any sample preservation measures
• calibration and maintenance of automatic samplers, timers and thermometers etc
• provision of records and information. This to include records of training of those who take
the samples and the automatic sampler installation and testing record
• actions to be taken in the event of automatic sampler failure
• procedure for notification of sampling event failure to us
• quality assurance procedures for sampling activities.
These procedures should be part of the management system and be made available to all
staff that undertake sampling and if requested should be submitted to us for approval. The
procedures should include examples of:
• the sampling event record sheets to be presented to the analysing laboratory
• sample results forms returned from the laboratory plus format of any computer generated
data
• sampling staff training records
• calibration and maintenance records
• sample event failure reports.
Having a well controlled sampling methodology is essential to ensure the contribution of
sampling to the overall uncertainty budget is minimised.
5.7 Sampling quality control
The initial sampling process can make a substantial contribution to the overall uncertainty of a
measurement result. The performance of field procedures can be verified for each batch of
samples taken. Control samples should be taken and analysed with the batch of samples they
are associated with.
The following types of control sample may be suitable:
• Blank samples - can be used to assess levels of contamination in the sampling process,
and investigate contamination of different areas of the process, such as filtration or bottles.
• Spiked sample - a known quantity of a determinand standard solution is added to a
sample. Can be used to assess different areas of the sampling process, such as sample
bottles, pre-treatment (filtration, preservation), transport. Standards used for spiking the
sample should be from a different source or lot number to that used for calibration.
• Duplicate samples - as far as practical, the entire sampling procedure is repeated and two
separate samples are submitted to the laboratory for analysis.
• Reference materials/samples - can be used to carry out quality assurance checks on field
instruments used for on-site tests.
To monitor the variation of sampling control samples, results should be recorded or plotted on
control charts, see section 6.6 and Appendix 3. The data collected can be used as part of an
estimate of sampling uncertainty.
Monitoring of discharges to water and sewer
Version 5, October 2014 19
6. Laboratory analysis
6.1 Choosing a method
Standard methods are developed by various national and international organisations. It has
been suggested that choosing measurement methods published by the organisations listed
below will form the foundation for better reliability and comparability:
• standard methods required by relevant EU Directives
• CEN standard for the relevant pollutant or parameter
• ISO standards
• national standards (SCA blue books + BSI)
• alternative methods, such as in house methods, modified methods or test kits, with prior
approval from us. We may also impose extra requirements.
However, the degree of validation detailed in standard methods is variable, especially with
regard to the matrix the method is employed in. Therefore it is extremely important that the
measuring method is fully evaluated to check that it is fit for purpose, and that the laboratory
employing the method is itself able to verify any performance criteria that may be stated in the
appropriate standard or specified by us, for example in an MCERTS standard. If the sample to
be analysed is of a matrix that has not been the subject of suitable validation tests, then
further tests will need to be carried out to ascertain the suitability of the method. We may
require proof of method suitability and details of how matrix problems were addressed.
A list of analytical methods is given in Appendix 4. The list is neither mandatory nor
exhaustive, and other appropriate methods may be acceptable with satisfactory validation. For
example, automated methods of analysis have been listed for ammonia that use continuous
flow methods. However, in larger laboratories these methods have been superseded by
discrete analysers that use essentially the same method and can operate with the required
performance, but are more cost effective.
CEN, ISO and British Standards can be obtained from the British Standards Institute at, SCA
blue books can be obtained from us, details can be found on our website by typing SCA into
the search facility. ISO methods can also be obtained from the ISO website.
6.2 Laboratory equipment
Any equipment used in the analytical systems must be shown to be fit for purpose:
• Instrument operation instructions, calibration procedures and performance checks must be
fully documented and available to users as part of the management system.
• Instrument performance checks and calibration procedures must be carried out at
appropriate intervals and a record kept showing that calibration is maintained.
• All instruments must be correctly maintained and records of this maintenance are kept,
whether or not carried out by a third party, such as the instrument manufacturer.
• Traceability of calibration of equipment such as balances, thermometers, timers,
autopipettes etc. to national measurement standards must be demonstrated, and any
corresponding certificates or other records must be available.
• Calibrated equipment must be clearly labelled and identified to the user.
Monitoring of discharges to water and sewer
Version 5, October 2014 20
6.3 Test kits
The majority of appropriate test kits involve colorimetric methods. They come in two main
formats, those using visual comparators and those using portable or bench top spectrometers.
Generally, the use of visual comparators is not recommended, as these systems are very
dependent on the operator and environmental conditions. They often lack the accuracy
required for assessing regulatory permits. If they are employed the users must demonstrate
that they are fit for purpose.
Test kit methods using spectrometers have increased in sophistication and quality in recent
years, and many are based on standard laboratory methods. Traceability of the data can be
achieved due to electronic result storage capabilities.
Test kits offer some advantages as the methods may benefit from reagents being
prepackaged, ease and convenience of use, and built in calibration routines. However, they
should undergo a full evaluation before use, ensuring appropriate performance characteristics
and matrix suitability, and be treated the same as a standard method in terms of
documentation and QA/QC procedures.
Test kits are employed for many determinands, COD, ammonia, phosphate and iron included.
Comprehensive guidance to test kit usage can be found in reference 19.
6.4 Validation
Analytical methods must be supported by the assessment of the following performance
criteria, obtained in an appropriate matrix, to demonstrate that it is fit for purpose:
• selectivity and interference effects
• range of applicability
• linearity
• calibration and traceability
• bias (recovery)
• precision (repeatability, intermediate reproducibility)
• limit of detection (LOD)
• uncertainty estimates.
These performance tests should be carried out before a method is put into routine use, but
only when the analytical system has been optimised. If an analytical system is modified, it may
be necessary to revalidate, for example when a piece of equipment is replaced. A typical
protocol for validation is given in:
MCERTS Performance standard for organisations undertaking sampling and chemical testing
of water Part 1 - Sampling and chemical testing of untreated sewage, treated sewage effluents
and trade effluents, which can be downloaded from the MCERTS website.
6.5 Methods and procedures
The measuring method must be fully documented and must include details of:
• scope/performance characteristics/estimate of uncertainty
• principles
Monitoring of discharges to water and sewer
Version 5, October 2014 21
• hazards and disposal of waste materials
• reagents and standards
• equipment
• sample collection, preservation and preparation
• calibration and procedure
• quality control
• calculation and reporting
• references.
Detailed guidance can be obtained in references 4 and 17.
6.6 Quality control
Laboratories should have established and fully documented analytical quality control (AQC)
procedures that should be part of its quality management system. These procedures must
provide a continuing check on the day to day performance of analytical systems, and the
laboratory must subscribe to an external proficiency scheme (where available and
appropriate).
Internal quality control procedures relate to ensuring the quality of specific samples or
batches of samples and may include:
• analysis of reference materials/measurement standards
• analysis of blind samples
• use of quality control samples and control charts
• analysis of blanks
• analysis of spiked samples
• analysis in replicate
• system suitability checks.
As a minimum the use of Shewhart control charts is recommended for routine analysis of
effluent and water samples, as they easily identify at a glance when an analytical system is
out of statistical control.
A method is said to be in statistical control when the variability within the analytical system
arises from a stable set of what can be considered as sources of random analytical variability.
That is, the precision of the method fall within expected limits, a list of which can be found in
Appendix 2. These limits are those that must be achieved by MCERTS accredited
laboratories, and give a good guide to what is achievable by a well run laboratory.
These causes of variation can be assumed to be equally likely to result in analytical errors in a
positive or negative direction and will affect all measurements. Loss of statistical control is
characterised by the introduction of sources of systematic error (bias, trueness), or by a
change in the size of the random error (precision) operating in the analytical method.
Laboratories must have fully documented procedures for actions to be taken when a system is
identified as out of control. Records of breaches should be kept, and also of remedial
measures taken. A procedure for re-evaluating and updating the control limits should also be
present.
An example detailed procedure can be found in Appendix 3, and further information can be
found in references 2, 3, 6, 7 and 8.
Monitoring of discharges to water and sewer
Version 5, October 2014 22
Proficiency Testing (PT) schemes are interlaboratory comparisons of analytical
performance. They consist of a regular distribution of homogeneous samples to a number of
participating laboratories. The concentration of target determinands in the samples should
reflect the concentrations of determinands in permits and consents, but should not be known
by participating laboratories. The matrix of test samples should be as near as possible to that
analysed by participating laboratories. The results of the analysis are statistically evaluated
and give an assessment of the analytical performance of participants. Again laboratories
should have a fully documented procedure, including methods for investigating and recording
actions taken when poor performance occurs.
Examples of PT schemes, which are designed to comply with BS EN ISO/IEC 17043,9 can be
seen on the LGC website and EPTIS website.
6.7 Measurement uncertainty
Measurement uncertainty is the range of values, within which the true value of an analytical
result lies, with a specified level of confidence. Every measurement has an uncertainty
associated with it, resulting from errors arising in the various stages of sampling and analysis
and from imperfect knowledge of factors affecting the result. For measurements to be seen to
be fit for purpose some knowledge of these errors is required. We may request a statement of
the uncertainty associated with a reported result.
Two general approaches are used to estimate measurement uncertainty:
In the first approach all individual sources of uncertainty must be identified and listed. Sources
include random and systematic errors, volumetric equipment, balances and weights,
calibration, sample pre-treatment, temperature effects and interferences. Each independent
contribution should be estimated. Some data will be available, some may be available from
literature (certificates, equipment specifications etc.), some may require further experimental
studies. This approach may lead to an underestimate of measurement uncertainty, as it is
difficult to assign all causes or an overestimate, as it is difficult to be sure all identified
contributions of uncertainty are fully independent.
The second approach is probably more appropriate for routine analysis of discharges.
Measurement uncertainty is estimated using an overall estimate of precision obtained from
validation studies and long term AQC data (intermediate reproducibility). Again all possible
sources of uncertainty should be considered. It may be necessary to incorporate a contribution
to uncertainty from bias (recovery) measurements, sample homogeneity, matrix, concentration
etc. If a source of uncertainty is identified and found to be inherently accounted for in precision
and bias studies uncertainty may not require further evaluation. For example, if data is drawn
from a whole year then the variations in the laboratories environmental temperature will be
adequately represented and if a variety of different volumetric apparatus has been used their
effects on calibration etc. will be taken into account.
Bias (recovery) is usually studied by analysing certified reference materials or spiked samples
during method validation and/or longer-term evaluation. Every effort should be made to
eliminate or reduce the bias effect. Bias needs only to be included in estimates of uncertainty
if is considered to be significant. If an analytical procedure is considered empirical, then bias
need only be evaluated for laboratory performance, and not for the method, as the result
obtained is defined by the method applied, and depends solely on it.
Monitoring of discharges to water and sewer
Version 5, October 2014 23
Once all the important sources of uncertainty have been identified and estimated they should
be converted to standard uncertainties, which are expressed as standard deviation. If based
on single measurements then intermediate reproducibility data is usually already a standard
deviation, but if based on replicate determinations then standard deviation of the mean should
be calculated.
Individual standard uncertainties should then be used to calculate the combined standard
uncertainty using an appropriate method. These methods are fully discussed in the references
below.
Uncertainty should be expressed as an expanded uncertainty, by multiplying the combined
uncertainty by a coverage factor (k), which is derived from student t values. This gives an
appropriate level of confidence to the uncertainty estimation. It is envisaged that a value for k
of 2 will be used, giving a 95% confidence in most cases. This will not be true when the
combined degrees of freedom of the estimate is small, but this situation should not arise.
Results should be reported in the form R ± U, where R is the result and U is the expanded
uncertainty. If k has a different value than 2 then it needs to be stated with the result.
Further details and worked examples can be found in references 5, 10, 11, 12, and 18.
6.8 Collection and reporting of data
The routine test report must contain the following information:
• name and address of laboratory where analysis took place
• a reference to the method or standard used
• any deviations from the standard used, or options employed
• full identification of the sample, including date and time taken, date and time received
• the results of the determinations and expanded uncertainties if requested
• any factors which may have affected the results including recovery factors.
6.9 Electronic data reporting
The results of self-monitoring may be reported to us in an electronic format. For example, the
Generic Operator Returns (GOR) which is a web based portal, the file format required by the
system is XML. Full traceability is required.
7. Continuous water monitors
Many of the topics covered in section 5 for sampling and section 6 for laboratory analytical
methods apply to CWMs.
7.1 Location of sensor
This can be in situ, directly in the effluent flow, or remote from the effluent flow with sample
pumped to it. When positioning the sensor and/or the sample intake section 5.1 applies.
Access, facilities and services mentioned in section 5.4 apply, and provision should be made
for cleaning of sampling pipes and tubes where necessary.

Monitoring of discharges to water and sewer
Version 5, October 2014 24
7.2 Type of CWM
Method employed by the CWM must be appropriate in terms of the exact determinand
specified in the permit, and measured by an appropriate technique, some examples are given
below. Instruments with MCERTS certification should be employed where available and
suitable for the application.
• direct electrochemical, for example pH, DO, conductivity
• specific ion electrodes, for example nitrate and ammonia
• metals, for example anodic stripping voltametry
• colorimetric (spectrometry), for example ammonia, phosphate, total phosphorus, iron
• TOC • turbidity.
7.3 Calibration and maintenance
Regular calibration and maintenance of CWMs is vital to ensure that monitoring data of an
appropriate quality is produced with minimum data loss from breakdowns.
CWMs should be installed, commissioned and validated by their manufacturers or
manufacturers’ agents.
Maintenance procedures should be documented and carried out as per manufacturers
instructions and recommended frequencies. Major servicing is best carried out by
manufacturers or specialist companies, but interim (daily, weekly) calibration and maintenance
checks can be undertaken by suitably trained staff.
A written schedule of maintenance and calibration tasks should be followed, and records of all
maintenance and calibration activities should be kept.
An appropriate quantity of spare parts and consumables should be held on site to ensure the
CWM is in continuous operation. A call out contract is recommended for emergency repairs.
8. Flow measurement
The uncertainties associated with flow measurement can have a significant effect on the
calculation of emission loads. Small fluctuations in flow measurements can lead to large
differences in load calculations.
We have therefore produced two MCERTS standards to cover the inspection of effluent flow
monitoring arrangements including the monitoring installations and the associated quality
assurance systems. The standards are:
Minimum requirements for the self-monitoring of effluent flow - this specifies our
requirements for permit holders to measure the flow of sewage and/or trade effluent
discharging to controlled waters or public sewer. It also includes the relevant quality
systems and the collection/reporting of monitoring data.
Competency Standard for MCERTS inspectors – effluent flow monitoring – this
specifies the competency standard required for independent technical specialists who
will undertake the assessment process on behalf of the consent holder.
Monitoring of discharges to water and sewer
Version 5, October 2014 25
The scheme operates as follows:
• MCERTS Inspectors are appointed by Sira Certification Service who operate this scheme
on our behalf. The scheme is delivered through a number of companies operating in a
commercially competitive market. Operators place a contract with one of the companies
employing MCERTS Inspectors. Details of companies employing MCERTS Inspectors can
be found via the MCERTS Self monitoring of effluent flow web page.
• We have set a total daily volume target of better than +/- 8% uncertainty for effluent flow
monitoring systems. MCERTS Inspectors will check this during their inspection. This
uncertainty target covers the whole monitoring system, not just the performance of the flow
meter. For example, deviations in construction of V-notch weirs and other installation
issues.
• Following the inspection, the MCERTS Inspector prepares a report, including a
recommendation based on their expert opinion as to whether the flow monitoring
arrangements meet the MCERTS requirements. This includes an assessment of the flow
application, type of flow measurement device and maintenance.
• The QMS (quality management system) for flow monitoring also needs to be assessed.
This is done by a UKAS accredited Certification Body that has MCERTS for flow included
in its scope. This can be Sira or an Operators existing ISO 9000/14001auditor if they have
appropriate accreditation.
• Sira will then check the MCERTS Inspector's report and the QMS auditor’s report. If the
MCERTS requirements are met they will issue an MCERTS Site Conformity Inspection
Certificate, valid for five years.
• An annual QMS surveillance visit is also required by the QMS auditor. The frequency may
be reduced once it can be demonstrated to the Auditor that the QMS is able to guarantee
performance.
Operators are also required to use MCERTS certified flow meters. Meters that comply with the
requirements of the MCERTS performance standard for flow meters are capable of producing
results of the required quality and reliability, when operated within the MCERTS flow scheme.
Detailed guidance on what is expected can be found in the MCERTS standard “Minimum
requirements for the self-monitoring of effluent flow”, via the Self monitoring of effluent flow
web page. Additional guidance can be found in MCERTS bulletins at the Sira certification
website.
The initial focus of this scheme was our requirements for consent holders under the WRA91 to
measure the flow of final effluents and collect and report the monitoring data. It has now been
extended to most EPR installations with effluent flow monitoring specified in their permits.
9. References
1. The Chemical Analysis of Water – General principles and techniques 2nd edition 1986
D.T.E.Hunt and A.L.Wilson ISBN 0851867979
2. NS30 - A Manual on Analytical Quality Control for the Water Industry R.V.Cheeseman and
A.L.Wilson revised M.J.Gardner June 1989 ISBN 0902 156853
3. ISO TR 13530:1997 Water Quality - A Guide to Analytical Quality Control for Water
Analysis.
4. The Fitness for Purpose of Analytical Methods: A Laboratory Guide to Method Validation
and Related Topics EURACHEM Guide
Monitoring of discharges to water and sewer
Version 5, October 2014 26
5. In-House Method Validation – A Guide for Chemical Laboratories LGC ISBN 094892618X
6. Quality Control Charts in Routine Analysis, WRc Report CO4239, M J Gardner, 1996.
7. ISO 7870:1993 Control charts - General guide and introduction
8. ISO 8258:1991 Shewhart control charts.
9. BS EN ISO/IEC 17043: Conformity assessment- General requirements for proficiency
testing.
10. EURACHEM/EUROLAB/CITAC/Nordtest/AMC Guide: Measurement uncertainty
arising from sampling: a guide to methods and approaches EURACHEM (2007). ISBN 978
0 948926
26 6. M H Ramsey and S L R Ellison (eds.)
11. EURACHEM/CITAC Guide to Quantifying Uncertainty in Analytical Measurement
EURACHEM / CITAC Guide CG 4
12. Vocabulary of metrology —Part 3: Guide to the Expression of Uncertainty in Measurement
(GUM) PD 6461-3: 1995 BSI 2002
13. IPPC Reference Document on the General Principles of Monitoring July 2003 (the
monitoring BREF)
14. BS EN ISO/IEC 17025 General requirements for the competence of testing and calibration
laboratories
15. BS EN ISO 9001Quality management systems - Requirements
16. BS EN ISO 5667-3: Water Quality-Sampling-Part 3: Guidance on the preservation and
handling of samples.
17. ISO 78-2:1999. Layout for Standards - Part 2: Methods of chemical analysis.
18. Handbook for Calculation of Measurement Uncertainty in Environmental Laboratories 2nd
Edition Nordtest ref TR 537:2004
19. BS 1427:2009. Guide to on-site test methods for the analysis of waters
Appendix 1: Glossary of terms
Bias and Recovery Bias is the systematic error of an analytical system and can be expressed as the difference
between the mean of a significant number of determinations and the true or accepted value.
Certified reference materials can be useful here, but are not always available. Sources of bias
include sample instability, interference and matrix effects, calibration, blanks and inability to
recover all forms of the defined determinand.
Recovery tests using real samples are carried out to estimate bias from some sources. A
sample is spiked with a known amount of a determinand, portions of sample and spiked
sample are analysed a number of times (11 batches of 2 duplicates is typically used, which
will guarantee 10 degrees of freedom), and the percentage of spiked determinand recovered
is calculated:
Recovery (spiked samples) = (S(V+W) – UV) x 100 %
CW
where: U = measured conc. in unspiked sample
Monitoring of discharges to water and sewer
Version 5, October 2014 27
S = measured conc. in spiked sample
C = conc. of spiking solution
W = volume of spiking solution added
V = volume of sample to which spike is added
Recovery or bias for general and metals determinations is usually acceptable where the true
mean recovery lies between 95% and 105% with 95% confidence, or 90% to 110% for organic
determinands. Outside of this, it may be necessary to correct results, for example with trace
organic analysis. The correction factors applied should be reported with the results.
Calibration and traceability Calibration is the process that relates the output from an analytical system to the concentration
of the substance being measured. Usually a series of standards of known concentration that
are prepared from or relate to the substance being measured, are subjected to the analytical
procedure. The output from the analytical system can then be related to the concentration of
the substance being measured, for example by use of a calibration curve.
Most laboratory analytical procedures rely at some stage on measurements of such properties
as weight, volume, temperature and time, for example volumetric flasks, analytical balances
that are used to weigh out materials to prepare calibration standards, thermometers, etc. All
such devices should be calibrated.
All calibrations should be documented and traceable to national or international reference
standards, through an unbroken chain of comparisons with known uncertainties.
Linearity Ideally, an analytical system will, within the working range, respond with a test result that is
directly proportional to the concentration of the determinand being measured This is easily
checked by measuring a blank and range of standards (minimum 6) spread evenly across the
calibration range and plotting a calibration curve, which can be inspected for outliers and
general shape. Regression coefficients can then be calculated. If the response is non-linear
then it may be possible to employ a suitable non-linear calibration function.
Limit of Detection (LOD) A key aspect of monitoring is the limit of detection (LOD) of an analytical system, because the
uncertainty associated with a measurement increases the closer the result is to the LOD.
Good analytical practice dictates that the LOD of a method should not exceed 10% of the
concentration of interest, which is usually the emission limit defined in the permit. This should
not be confused with the working range of the method, as an LOD can often be below 1% of
the analytical system’s range of applicability. The estimation of the LOD required provides a
guide for the selection of an appropriate method and helps minimise the uncertainty
associated with a measurement result that is close to the emission limit.
Several methods of calculating the LOD are in use, the most appropriate one for discharges is
a statistically based approach. LOD can be defined as the concentration at which 95%
probability of detection of the determinand occurs, which gives a suitably small probability of
failing to detect.
Precision Precision is the distribution of a number of repeated determinations, expressed as the
standard deviation of results. It estimates errors of a random nature. Total standard deviation
Monitoring of discharges to water and sewer
Version 5, October 2014 28
is calculated from a combination of within analytical batch and between analytical batch
standard deviations and is measured under a number of conditions:
Under repeatability conditions, a sample is analysed by the same method, equipment,
laboratory and analyst within a short time interval. This is precision data that would be
produced during method validation studies, and would be used to derive internal quality
control charts. Typically 11 batches of two duplicates is used, in order to guarantee 10
degrees of freedom. An in-house or intermediate reproducibility condition is where the method
has been put into routine use, has been used by a variety of analysts using different
equipment over a longer time and would reflect variations caused by environmental condition
(for example laboratory temperature).
Precision may vary across the concentration range, and should be tested at a minimum of two
different concentrations, one of these should be at the level of interest, such as the permit
limit. Laboratories often use 20% and 80% of the highest concentration determined by the
method.
Range of applicability (working range) This is the range of concentration that the method has been shown to provide analytical
results of the required accuracy and precision.
Selectivity and interference effects (matrix effects) It must be ensured that the method not only measures the determinand specified, but that the
measurement is not affected by the presence of other chemical species in the sample. This is
achieved by analysing standards with a range of potential interferences added at varying
concentrations, which should include the highest possible concentration that may be found in
the sample. As the extent if interference may depend on determinand concentration, at least
two different concentrations of determinand should be studied in this way.
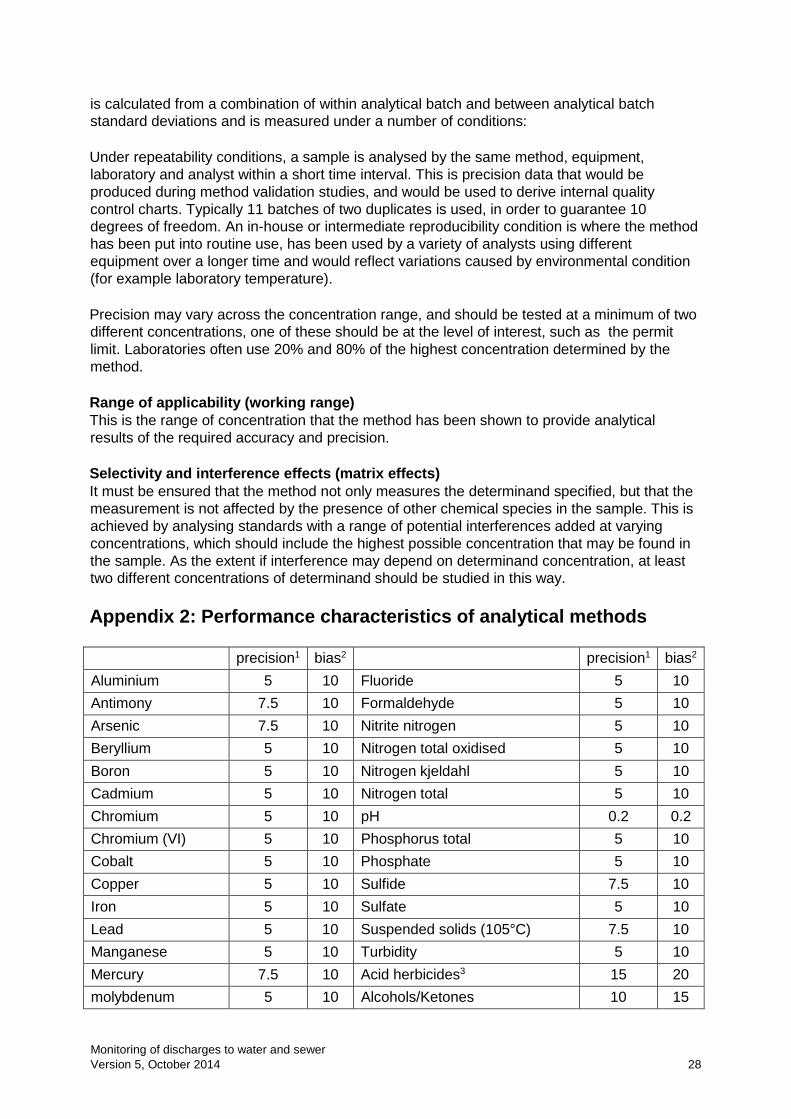
Appendix 2: Performance characteristics of analytical methods
precision1 bias2 precision1 bias2
Aluminium 5 10 Fluoride 5 10
Antimony 7.5 10 Formaldehyde 5 10
Arsenic 7.5 10 Nitrite nitrogen 5 10
Beryllium 5 10 Nitrogen total oxidised 5 10
Boron 5 10 Nitrogen kjeldahl 5 10
Cadmium 5 10 Nitrogen total 5 10
Chromium 5 10 pH 0.2 0.2
Chromium (VI) 5 10 Phosphorus total 5 10
Cobalt 5 10 Phosphate 5 10
Copper 5 10 Sulfide 7.5 10
Iron 5 10 Sulfate 5 10
Lead 5 10 Suspended solids (105°C) 7.5 10
Manganese 5 10 Turbidity 5 10
Mercury 7.5 10 Acid herbicides3 15 20
molybdenum 5 10 Alcohols/Ketones 10 15
Monitoring of discharges to water and sewer
Version 5, October 2014 29
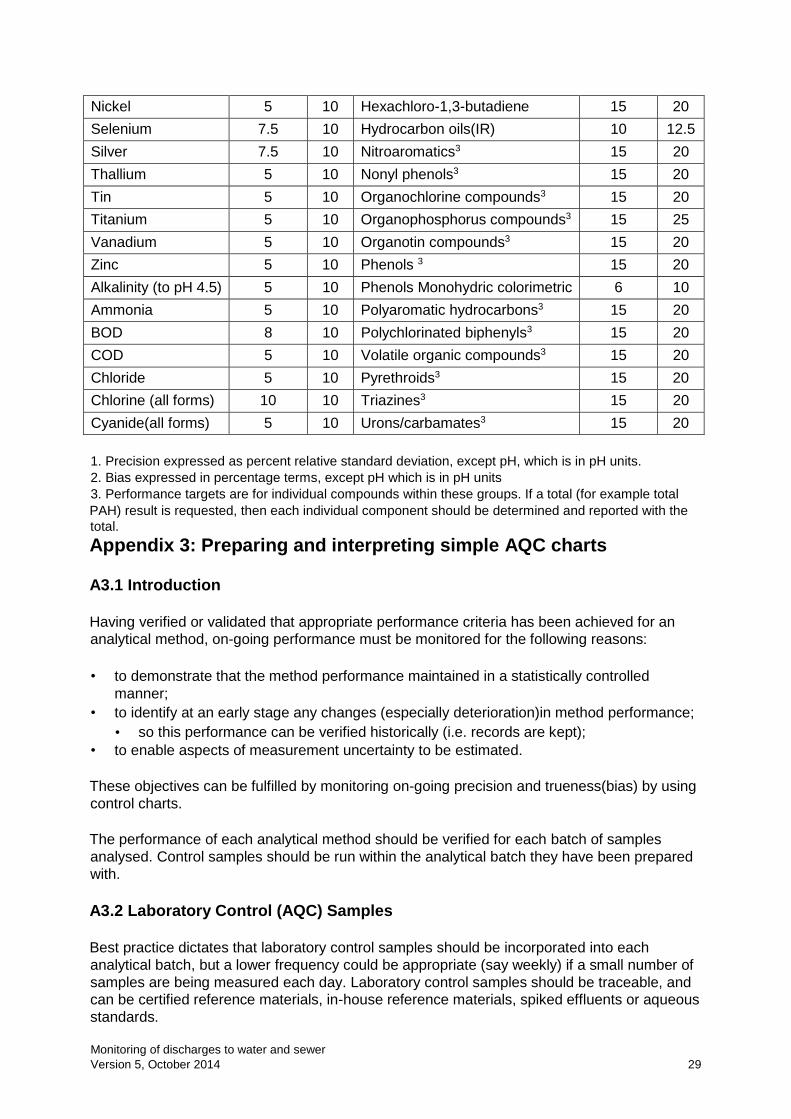
Nickel 5 10 Hexachloro-1,3-butadiene 15 20
Selenium 7.5 10 Hydrocarbon oils(IR) 10 12.5
Silver 7.5 10 Nitroaromatics3 15 20
Thallium 5 10 Nonyl phenols3 15 20
Tin 5 10 Organochlorine compounds3 15 20
Titanium 5 10 Organophosphorus compounds3 15 25
Vanadium 5 10 Organotin compounds3 15 20
Zinc 5 10 Phenols 3 15 20
Alkalinity (to pH 4.5) 5 10 Phenols Monohydric colorimetric 6 10
Ammonia 5 10 Polyaromatic hydrocarbons3 15 20
BOD 8 10 Polychlorinated biphenyls3 15 20
COD 5 10 Volatile organic compounds3 15 20
Chloride 5 10 Pyrethroids3 15 20
Chlorine (all forms) 10 10 Triazines3 15 20
Cyanide(all forms) 5 10 Urons/carbamates3 15 20
1. Precision expressed as percent relative standard deviation, except pH, which is in pH units. 2. Bias expressed in percentage terms, except pH which is in pH units 3. Performance targets are for individual compounds within these groups. If a total (for example total PAH) result is requested, then each individual component should be determined and reported with the
total.
Appendix 3: Preparing and interpreting simple AQC charts
A3.1 Introduction
Having verified or validated that appropriate performance criteria has been achieved for an
analytical method, on-going performance must be monitored for the following reasons:
• to demonstrate that the method performance maintained in a statistically controlled
manner;
• to identify at an early stage any changes (especially deterioration)in method performance;
• so this performance can be verified historically (i.e. records are kept);
• to enable aspects of measurement uncertainty to be estimated.
These objectives can be fulfilled by monitoring on-going precision and trueness(bias) by using
control charts.
The performance of each analytical method should be verified for each batch of samples
analysed. Control samples should be run within the analytical batch they have been prepared
with.
A3.2 Laboratory Control (AQC) Samples
Best practice dictates that laboratory control samples should be incorporated into each
analytical batch, but a lower frequency could be appropriate (say weekly) if a small number of
samples are being measured each day. Laboratory control samples should be traceable, and
can be certified reference materials, in-house reference materials, spiked effluents or aqueous
standards.
Monitoring of discharges to water and sewer
Version 5, October 2014 30
At least one blank sample per batch should be taken through the entire analytical method. A
result above the normal method reporting limit would show evidence of contamination which
should be investigated and may require analysis of the entire batch of samples to be repeated.
Laboratories shall have written procedures that prescribe and justify the way blank samples
are utilised.
A3.3 Treatment of results for Laboratory Control Samples
The interpretation of results from the analysis of internal Laboratory Control Samples is usually
carried out by the use of control charts. They compare the current results against limits set
after estimating the variability of an analytical system, while under statistical control. A method
is said to be in statistical control when the variability within the analytical system arises from a
stable set of what can be considered as sources of random analytical variability. Various
forms of control chart may be appropriate for use:
• Shewhart charts – Probably the most common in use
• Cusum charts – more sensitive to bias detection than Shewhart charts
• zone control chart (J-Chart) – Combines Shewhart and Cusum charts capabilities
As a minimum a Shewhart chart should be used, as described below.
A3.4 Setting Up and Updating Control Charts
Control charts should be set up using estimates of mean (M) and standard deviation (sd)
obtained from results of at least 20 control samples analysed obtained when the analytical
system is under statistical control. This data can initially have been obtained during method
validation procedures. As more data are obtained, it should be incorporated into the estimates
of M and sd, until 60-100 data points have been used, depending on frequency of analysis.
The precision and bias should ideally not be greater than the targets given in Appendix 2 for a
given determinand. As a general rule, the following performance standards should never be
exceeded:
Metals – 5% RSD (relative standard deviation)
Inorganics – 10% RSD Organics
– 15% RSD
If required, statistical significance tests are applied, which are described in the MCERTS
Performance Standard for Organisations Undertaking Sampling and Chemical Testing of
Water.
A senior member of staff should review charts on a regular basis. The timescale will depend
on frequency and nature of analysis, but at least monthly.
At least annually, mean and standard deviation should be estimated from new data. If any of
the data points have breached the control rules and a definite cause can be assigned, then
the data points shall not be used. However, since some results, which are part of the normal
distribution, will breach even the ‘action’ limits, then these should be used where no specific
reason for the breach could be assigned.
The new values should be tested to see if any significant change in precision (expressed as
standard deviation) has occurred, using an F test at the 95% confidence level. A student's t
Monitoring of discharges to water and sewer
Version 5, October 2014 31
test, again at the 95% confidence level, should be used to see if the mean has changed
significantly.
If a statistically significant change has occurred, then the new values are used in the control
rules, and new control lines should be drawn on control charts. If no significant changes are
detected then no changes should be made.
All significant changes should be investigated, even if precision and bias are still within the
targets set.
A3.5 Control Rules and Failure Investigation
Rules should be set to indicate whether the analytical method is in control. A laboratory should
have documented procedures that define loss of statistical control and procedures to specify
actions to be taken when control limits are breached. All breaches should be investigated, and
the findings and actions should be recorded. It is required that samples in an analytical batch
where AQC samples breach the control rules be reanalysed.
The investigation should include at least the following:
• check for changes in concentration of stock standard solutions and reagents and that all
are in date
• check calibration of all instruments used in the analytical process
• check methods were followed as written
• check that system suitability check data meets requirements
• check that no significant drift has occurred for automated runs
• check service/faults log
Records should include:
• identification of control sample and all associated sample results
• control limits in force at time of breach and breach result
• investigation details, conclusions and actions taken
• what happened to the sample results
A3.6 Reporting
Results associated with failed QC samples should not be reported. However In some
circumstances, (for example where it may be impossible to repeat the sampling or analysis),
their may be no alternative. Whenever results associated with failed QC are reported should
only be issued under the direct authority of an appropriate manager, and with agreement with
the Agency.
Any report issued, which contains results associated with failed QC must include a note to
identify the result.
A3.7 Example: Shewhart Chart
The results of repeat analysis of a single sample should be normally distributed around the
mean. In the unlikely event that this is not the case then the Shewhart control chart is not
appropriate.
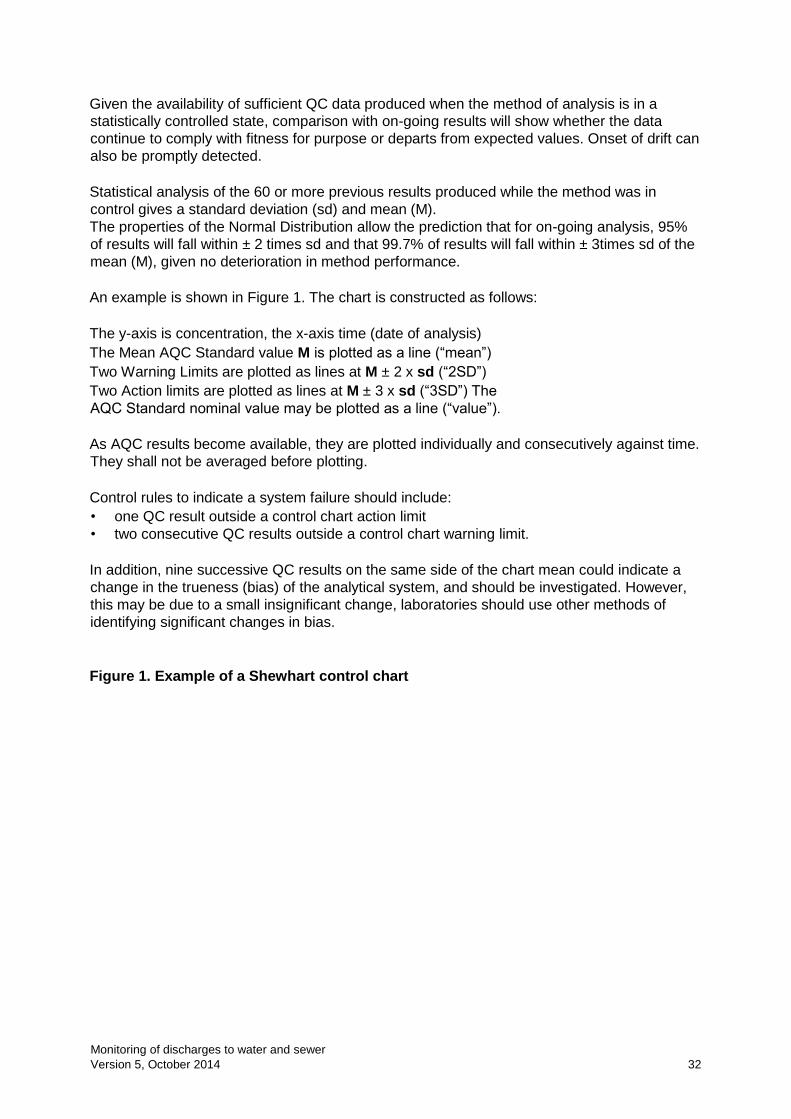
Monitoring of discharges to water and sewer
Version 5, October 2014 32
Given the availability of sufficient QC data produced when the method of analysis is in a
statistically controlled state, comparison with on-going results will show whether the data
continue to comply with fitness for purpose or departs from expected values. Onset of drift can
also be promptly detected.
Statistical analysis of the 60 or more previous results produced while the method was in
control gives a standard deviation (sd) and mean (M).
The properties of the Normal Distribution allow the prediction that for on-going analysis, 95%
of results will fall within ± 2 times sd and that 99.7% of results will fall within ± 3times sd of the
mean (M), given no deterioration in method performance.
An example is shown in Figure 1. The chart is constructed as follows:
The y-axis is concentration, the x-axis time (date of analysis)
The Mean AQC Standard value M is plotted as a line (“mean”)
Two Warning Limits are plotted as lines at M ± 2 x sd (“2SD”)
Two Action limits are plotted as lines at M ± 3 x sd (“3SD”) The
AQC Standard nominal value may be plotted as a line (“value”).
As AQC results become available, they are plotted individually and consecutively against time.
They shall not be averaged before plotting.
Control rules to indicate a system failure should include:
• one QC result outside a control chart action limit
• two consecutive QC results outside a control chart warning limit.
In addition, nine successive QC results on the same side of the chart mean could indicate a
change in the trueness (bias) of the analytical system, and should be investigated. However,
this may be due to a small insignificant change, laboratories should use other methods of
identifying significant changes in bias.
Figure 1. Example of a Shewhart control chart
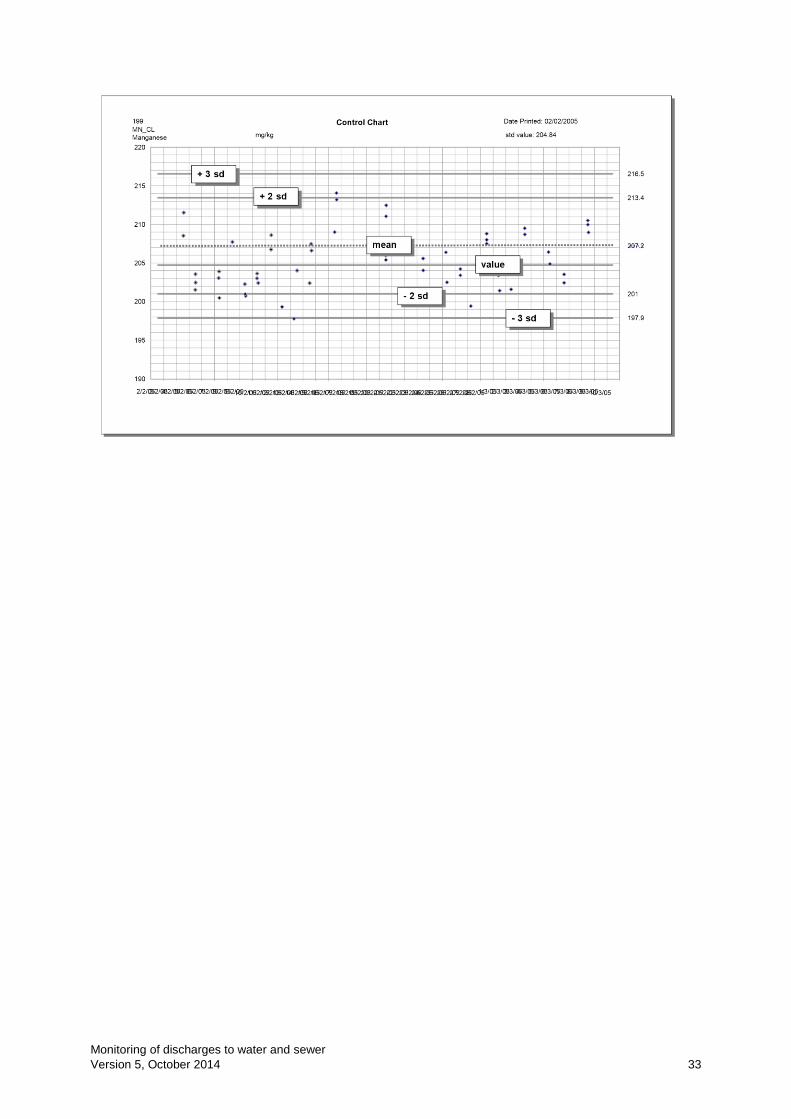
Monitoring of discharges to water and sewer
Version 5, October 2014 33
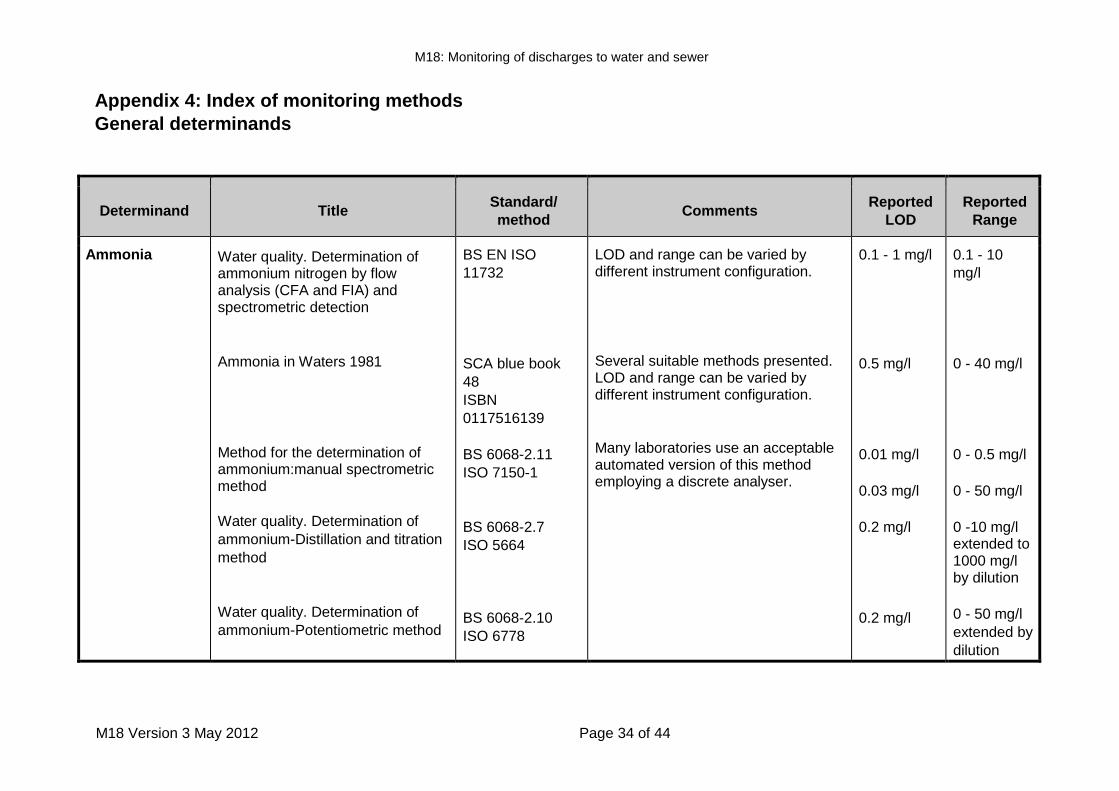
M18: Monitoring of discharges to water and sewer
M18 Version 3 May 2012 Page 34 of 44
Appendix 4: Index of monitoring methods
General determinands
Determinand Title Standard/
method Comments
Reported
LOD
Reported
Range
Ammonia Water quality. Determination of ammonium nitrogen by flow analysis (CFA and FIA) and spectrometric detection
Ammonia in Waters 1981
Method for the determination of ammonium:manual spectrometric method
Water quality. Determination of
ammonium-Distillation and titration
method
Water quality. Determination of
ammonium-Potentiometric method
BS EN ISO
11732
SCA blue book
48
ISBN
0117516139
BS 6068-2.11
ISO 7150-1
BS 6068-2.7
ISO 5664
BS 6068-2.10
ISO 6778
LOD and range can be varied by different instrument configuration.
Several suitable methods presented. LOD and range can be varied by different instrument configuration.
Many laboratories use an acceptable automated version of this method employing a discrete analyser.
0.1 - 1 mg/l
0.5 mg/l
0.01 mg/l
0.03 mg/l
0.2 mg/l
0.2 mg/l
0.1 - 10
mg/l
0 - 40 mg/l
0 - 0.5 mg/l
0 - 50 mg/l
0 -10 mg/l extended to 1000 mg/l by dilution
0 - 50 mg/l
extended by
dilution
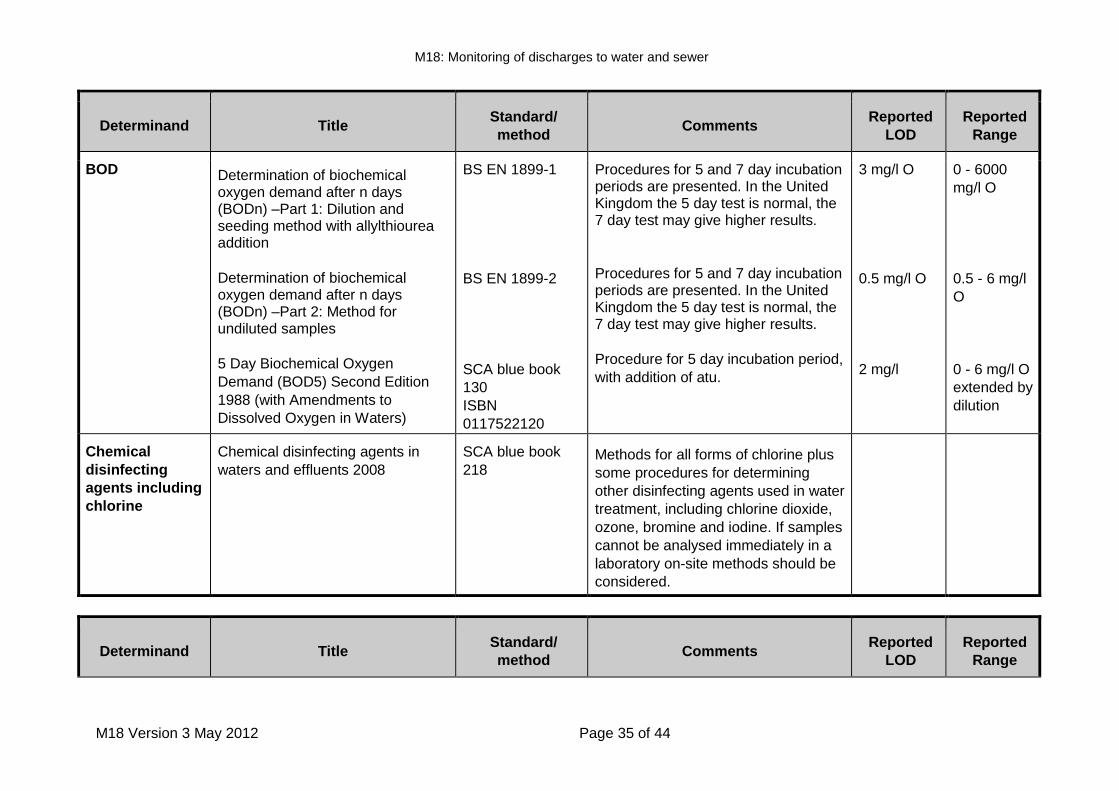
M18: Monitoring of discharges to water and sewer
M18 Version 3 May 2012 Page 35 of 44
Determinand Title Standard/
method Comments
Reported
LOD
Reported
Range
BOD Determination of biochemical oxygen demand after n days (BODn) –Part 1: Dilution and seeding method with allylthiourea addition
Determination of biochemical oxygen demand after n days (BODn) –Part 2: Method for undiluted samples
5 Day Biochemical Oxygen
Demand (BOD5) Second Edition
1988 (with Amendments to
Dissolved Oxygen in Waters)
BS EN 1899-1
BS EN 1899-2
SCA blue book
130
ISBN
0117522120
Procedures for 5 and 7 day incubation periods are presented. In the United Kingdom the 5 day test is normal, the 7 day test may give higher results.
Procedures for 5 and 7 day incubation periods are presented. In the United Kingdom the 5 day test is normal, the 7 day test may give higher results.
Procedure for 5 day incubation period,
with addition of atu.
3 mg/l O
0.5 mg/l O
2 mg/l
0 - 6000
mg/l O
0.5 - 6 mg/l
O
0 - 6 mg/l O
extended by
dilution
Chemical
disinfecting
agents including
chlorine
Chemical disinfecting agents in
waters and effluents 2008
SCA blue book
218 Methods for all forms of chlorine plus
some procedures for determining
other disinfecting agents used in water
treatment, including chlorine dioxide,
ozone, bromine and iodine. If samples
cannot be analysed immediately in a
laboratory on-site methods should be
considered.
Determinand Title Standard/
method Comments
Reported
LOD
Reported
Range
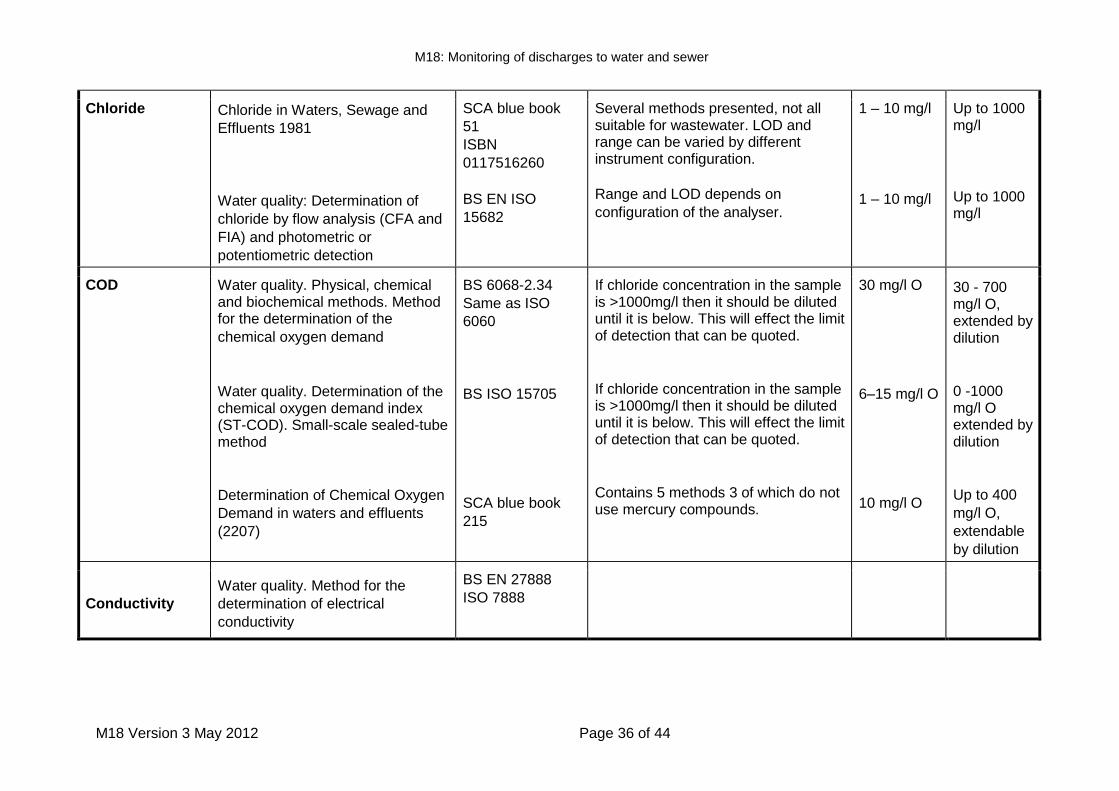
M18: Monitoring of discharges to water and sewer
M18 Version 3 May 2012 Page 36 of 44
Chloride
Chloride in Waters, Sewage and
Effluents 1981
Water quality: Determination of
chloride by flow analysis (CFA and
FIA) and photometric or
potentiometric detection
SCA blue book
51
ISBN
0117516260
BS EN ISO
15682
Several methods presented, not all suitable for wastewater. LOD and range can be varied by different instrument configuration.
Range and LOD depends on
configuration of the analyser.
1 – 10 mg/l
1 – 10 mg/l
Up to 1000 mg/l
Up to 1000 mg/l
COD Water quality. Physical, chemical and biochemical methods. Method for the determination of the
chemical oxygen demand
Water quality. Determination of the chemical oxygen demand index (ST-COD). Small-scale sealed-tube method
Determination of Chemical Oxygen
Demand in waters and effluents
(2207)
BS 6068-2.34
Same as ISO
6060
BS ISO 15705
SCA blue book
215
If chloride concentration in the sample is >1000mg/l then it should be diluted until it is below. This will effect the limit of detection that can be quoted.
If chloride concentration in the sample is >1000mg/l then it should be diluted until it is below. This will effect the limit of detection that can be quoted.
Contains 5 methods 3 of which do not use mercury compounds.
30 mg/l O
6–15 mg/l O
10 mg/l O
30 - 700 mg/l O, extended by dilution
0 -1000 mg/l O extended by dilution
Up to 400
mg/l O,
extendable
by dilution
Conductivity
Water quality. Method for the
determination of electrical
conductivity
BS EN 27888
ISO 7888
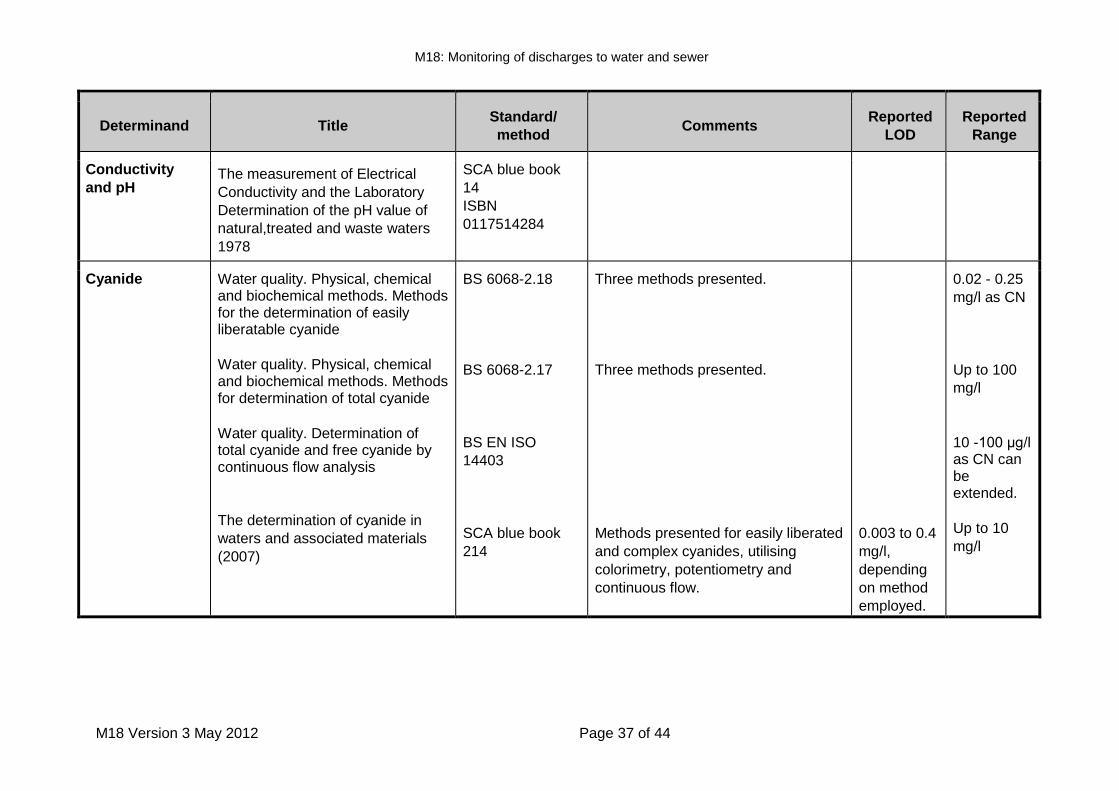
M18: Monitoring of discharges to water and sewer
M18 Version 3 May 2012 Page 37 of 44
Determinand Title Standard/
method Comments
Reported
LOD
Reported
Range
Conductivity
and pH The measurement of Electrical
Conductivity and the Laboratory
Determination of the pH value of
natural,treated and waste waters
1978
SCA blue book
14
ISBN
0117514284
Cyanide Water quality. Physical, chemical and biochemical methods. Methods for the determination of easily liberatable cyanide
Water quality. Physical, chemical and biochemical methods. Methods for determination of total cyanide
Water quality. Determination of total cyanide and free cyanide by continuous flow analysis
The determination of cyanide in
waters and associated materials
(2007)
BS 6068-2.18
BS 6068-2.17
BS EN ISO
14403
SCA blue book
214
Three methods presented.
Three methods presented.
Methods presented for easily liberated
and complex cyanides, utilising
colorimetry, potentiometry and
continuous flow.
0.003 to 0.4
mg/l,
depending
on method
employed.
0.02 - 0.25
mg/l as CN
Up to 100
mg/l
10 -100 μg/l as CN can be extended.
Up to 10
mg/l
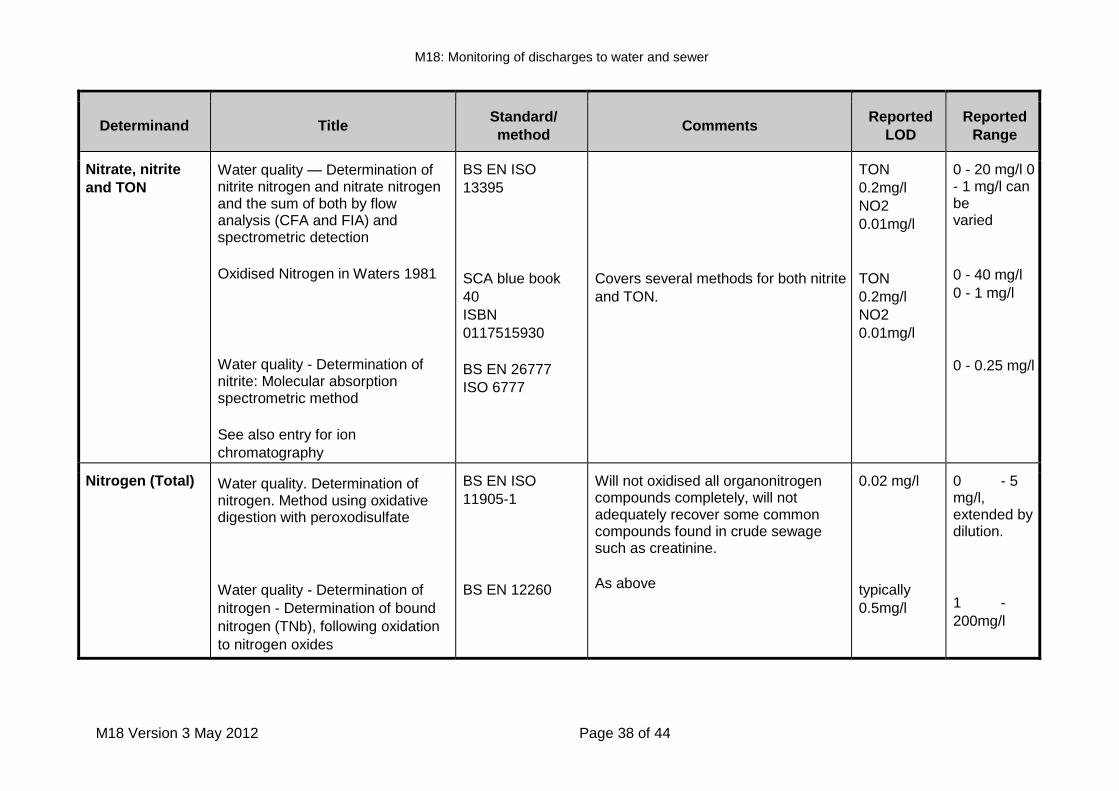
M18: Monitoring of discharges to water and sewer
M18 Version 3 May 2012 Page 38 of 44
Determinand Title Standard/
method Comments
Reported
LOD
Reported
Range
Nitrate, nitrite
and TON
Water quality — Determination of nitrite nitrogen and nitrate nitrogen and the sum of both by flow analysis (CFA and FIA) and spectrometric detection
Oxidised Nitrogen in Waters 1981
Water quality - Determination of nitrite: Molecular absorption spectrometric method
See also entry for ion
chromatography
BS EN ISO
13395
SCA blue book
40
ISBN
0117515930
BS EN 26777
ISO 6777
Covers several methods for both nitrite
and TON.
TON
0.2mg/l
NO2
0.01mg/l
TON
0.2mg/l
NO2
0.01mg/l
0 - 20 mg/l 0 - 1 mg/l can be varied
0 - 40 mg/l
0 - 1 mg/l
0 - 0.25 mg/l
Nitrogen (Total) Water quality. Determination of nitrogen. Method using oxidative digestion with peroxodisulfate
Water quality - Determination of
nitrogen - Determination of bound
nitrogen (TNb), following oxidation
to nitrogen oxides
BS EN ISO
11905-1
BS EN 12260
Will not oxidised all organonitrogen compounds completely, will not adequately recover some common compounds found in crude sewage such as creatinine.
As above
0.02 mg/l
typically
0.5mg/l
0 - 5 mg/l, extended by dilution.
1 -
200mg/l
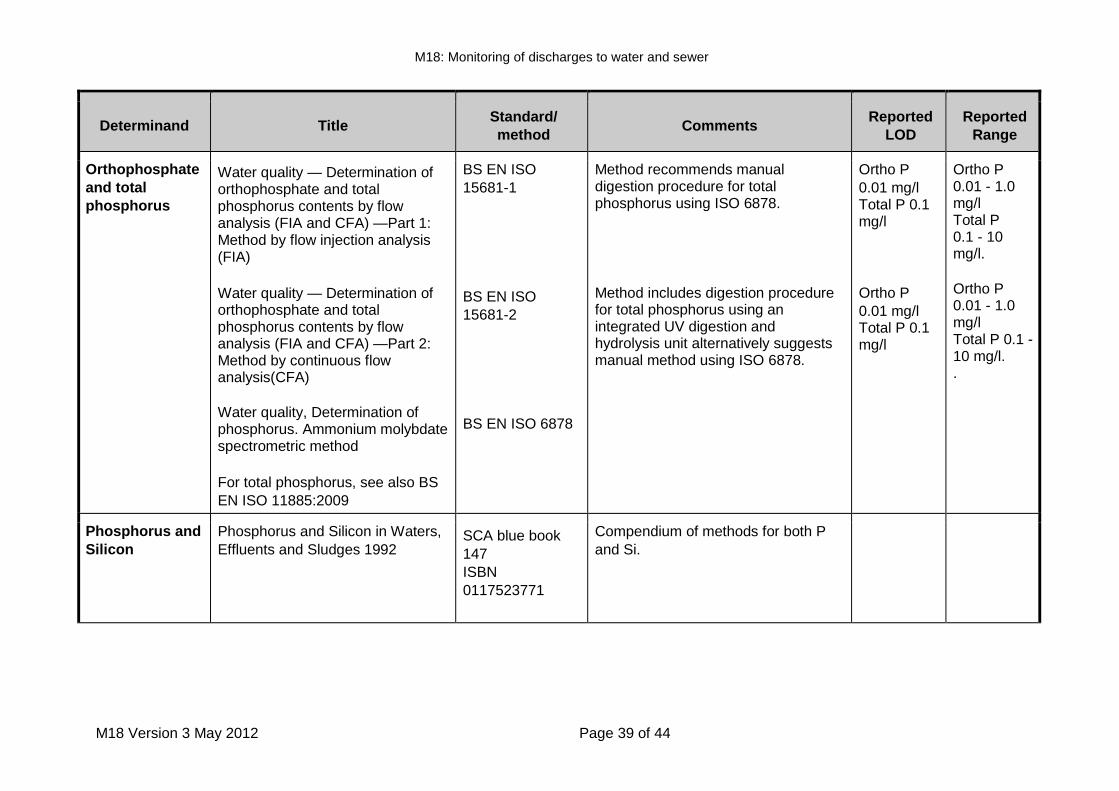
M18: Monitoring of discharges to water and sewer
M18 Version 3 May 2012 Page 39 of 44
Determinand Title Standard/
method Comments
Reported
LOD
Reported
Range
Orthophosphate
and total
phosphorus
Water quality — Determination of orthophosphate and total phosphorus contents by flow analysis (FIA and CFA) —Part 1: Method by flow injection analysis (FIA)
Water quality — Determination of orthophosphate and total phosphorus contents by flow analysis (FIA and CFA) —Part 2: Method by continuous flow analysis(CFA)
Water quality, Determination of phosphorus. Ammonium molybdate spectrometric method
For total phosphorus, see also BS
EN ISO 11885:2009
BS EN ISO
15681-1
BS EN ISO
15681-2
BS EN ISO 6878
Method recommends manual digestion procedure for total phosphorus using ISO 6878.
Method includes digestion procedure for total phosphorus using an integrated UV digestion and hydrolysis unit alternatively suggests manual method using ISO 6878.
Ortho P
0.01 mg/l Total P 0.1 mg/l
Ortho P
0.01 mg/l Total P 0.1 mg/l
Ortho P 0.01 - 1.0 mg/l Total P 0.1 - 10 mg/l.
Ortho P 0.01 - 1.0 mg/l Total P 0.1 - 10 mg/l. .
Phosphorus and
Silicon
Phosphorus and Silicon in Waters,
Effluents and Sludges 1992
SCA blue book
147
ISBN
0117523771
Compendium of methods for both P
and Si.
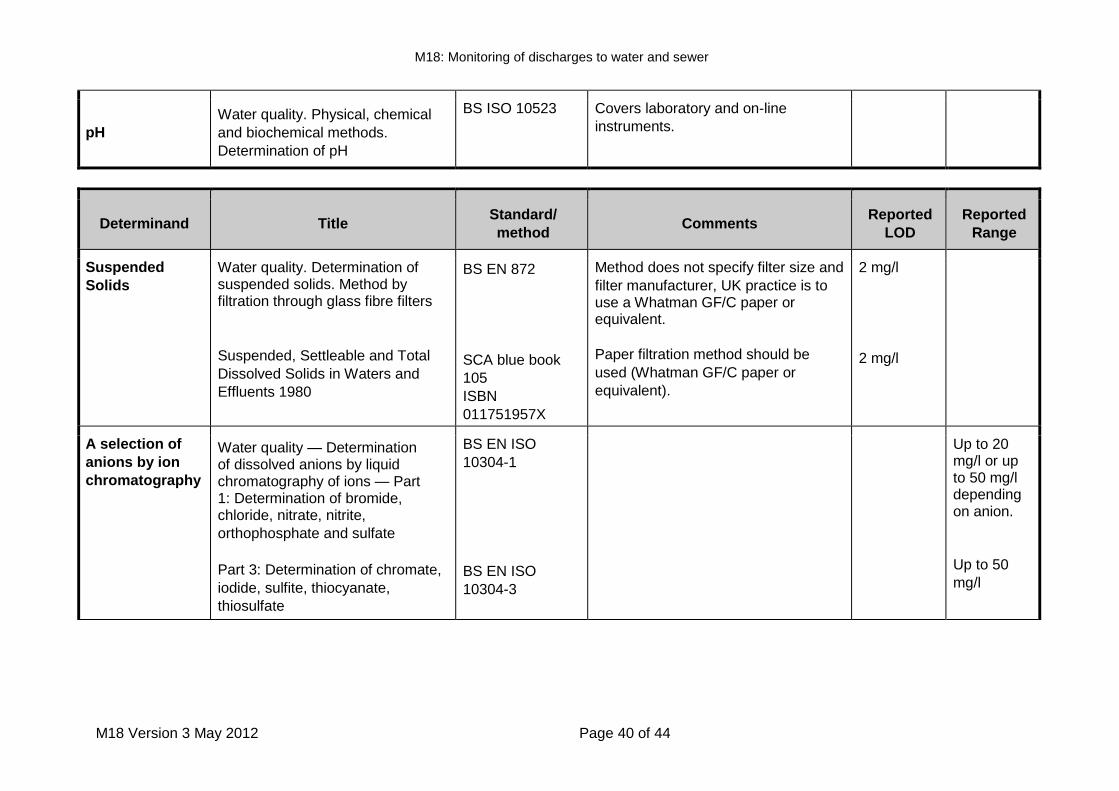
M18: Monitoring of discharges to water and sewer
M18 Version 3 May 2012 Page 40 of 44
pH
Water quality. Physical, chemical
and biochemical methods.
Determination of pH
BS ISO 10523
Covers laboratory and on-line
instruments.
Determinand Title Standard/
method Comments
Reported
LOD
Reported
Range
Suspended
Solids
Water quality. Determination of suspended solids. Method by filtration through glass fibre filters
Suspended, Settleable and Total
Dissolved Solids in Waters and
Effluents 1980
BS EN 872
SCA blue book
105
ISBN
011751957X
Method does not specify filter size and
filter manufacturer, UK practice is to use a Whatman GF/C paper or equivalent.
Paper filtration method should be
used (Whatman GF/C paper or
equivalent).
2 mg/l
2 mg/l
A selection of
anions by ion
chromatography
Water quality — Determination of dissolved anions by liquid chromatography of ions — Part 1: Determination of bromide, chloride, nitrate, nitrite,
orthophosphate and sulfate
Part 3: Determination of chromate,
iodide, sulfite, thiocyanate,
thiosulfate
BS EN ISO
10304-1
BS EN ISO
10304-3
Up to 20 mg/l or up to 50 mg/l depending on anion.
Up to 50
mg/l
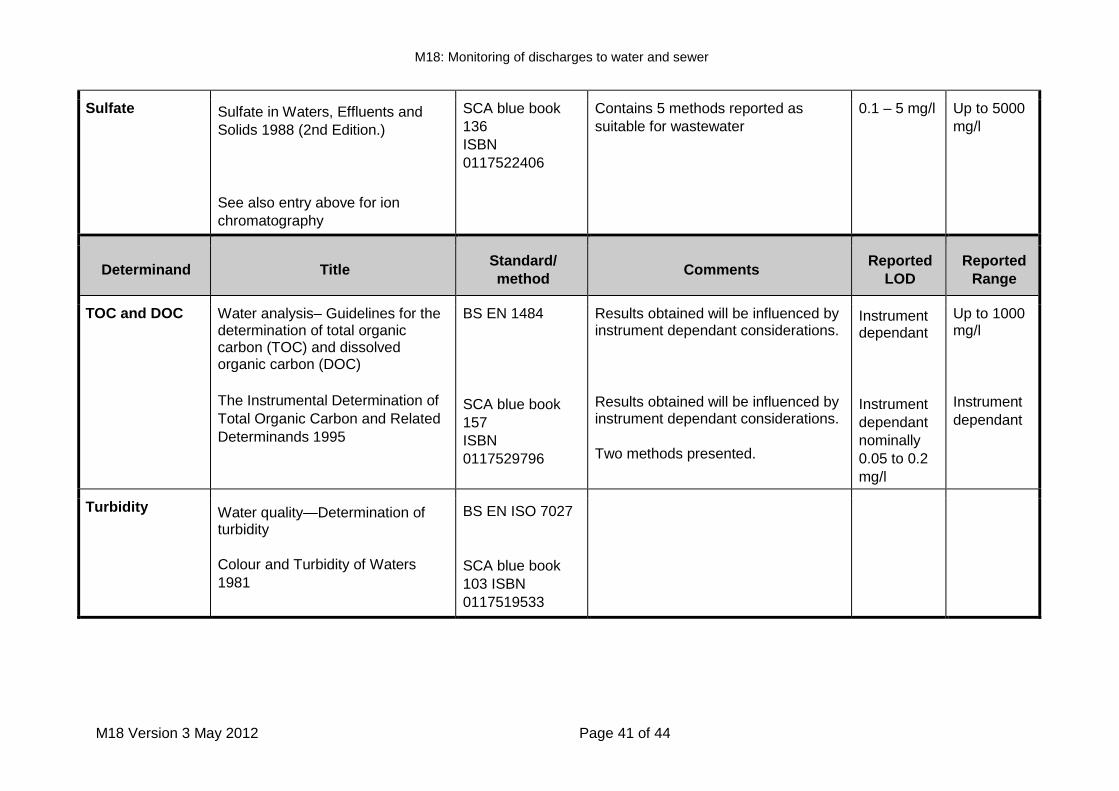
M18: Monitoring of discharges to water and sewer
M18 Version 3 May 2012 Page 41 of 44
Sulfate Sulfate in Waters, Effluents and
Solids 1988 (2nd Edition.)
See also entry above for ion
chromatography
SCA blue book
136
ISBN
0117522406
Contains 5 methods reported as
suitable for wastewater
0.1 – 5 mg/l Up to 5000
mg/l
Determinand Title Standard/
method Comments
Reported
LOD
Reported
Range
TOC and DOC Water analysis– Guidelines for the determination of total organic carbon (TOC) and dissolved organic carbon (DOC)
The Instrumental Determination of
Total Organic Carbon and Related
Determinands 1995
BS EN 1484
SCA blue book
157
ISBN
0117529796
Results obtained will be influenced by instrument dependant considerations.
Results obtained will be influenced by instrument dependant considerations.
Two methods presented.
Instrument dependant
Instrument
dependant
nominally
0.05 to 0.2
mg/l
Up to 1000 mg/l
Instrument
dependant
Turbidity Water quality—Determination of turbidity
Colour and Turbidity of Waters
1981
BS EN ISO 7027
SCA blue book
103 ISBN
0117519533
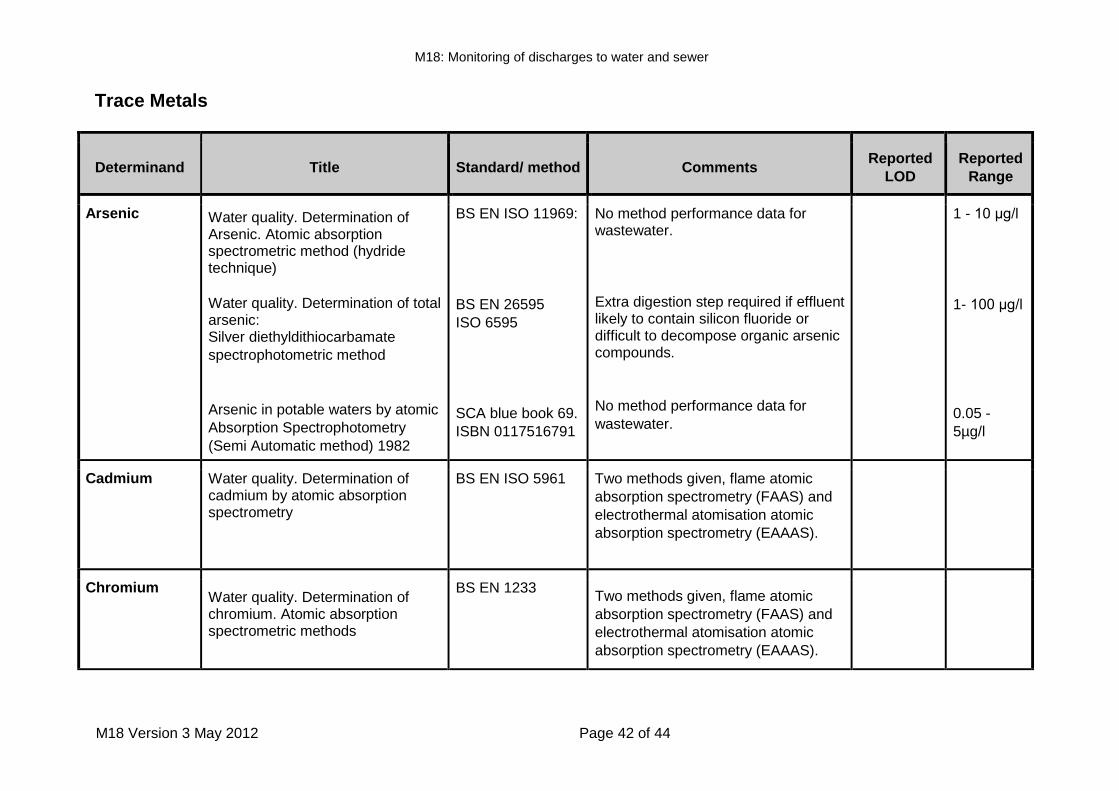
M18: Monitoring of discharges to water and sewer
M18 Version 3 May 2012 Page 42 of 44
Trace Metals
Determinand Title Standard/ method Comments Reported
LOD
Reported
Range
Arsenic Water quality. Determination of Arsenic. Atomic absorption spectrometric method (hydride technique)
Water quality. Determination of total arsenic: Silver diethyldithiocarbamate
spectrophotometric method
Arsenic in potable waters by atomic
Absorption Spectrophotometry
(Semi Automatic method) 1982
BS EN ISO 11969:
BS EN 26595
ISO 6595
SCA blue book 69.
ISBN 0117516791
No method performance data for wastewater.
Extra digestion step required if effluent likely to contain silicon fluoride or difficult to decompose organic arsenic compounds.
No method performance data for
wastewater.
1 - 10 μg/l
1- 100 μg/l
0.05 -
5µg/l
Cadmium Water quality. Determination of cadmium by atomic absorption spectrometry
BS EN ISO 5961 Two methods given, flame atomic
absorption spectrometry (FAAS) and
electrothermal atomisation atomic
absorption spectrometry (EAAAS).
Chromium Water quality. Determination of chromium. Atomic absorption spectrometric methods
BS EN 1233
Two methods given, flame atomic
absorption spectrometry (FAAS) and
electrothermal atomisation atomic
absorption spectrometry (EAAAS).
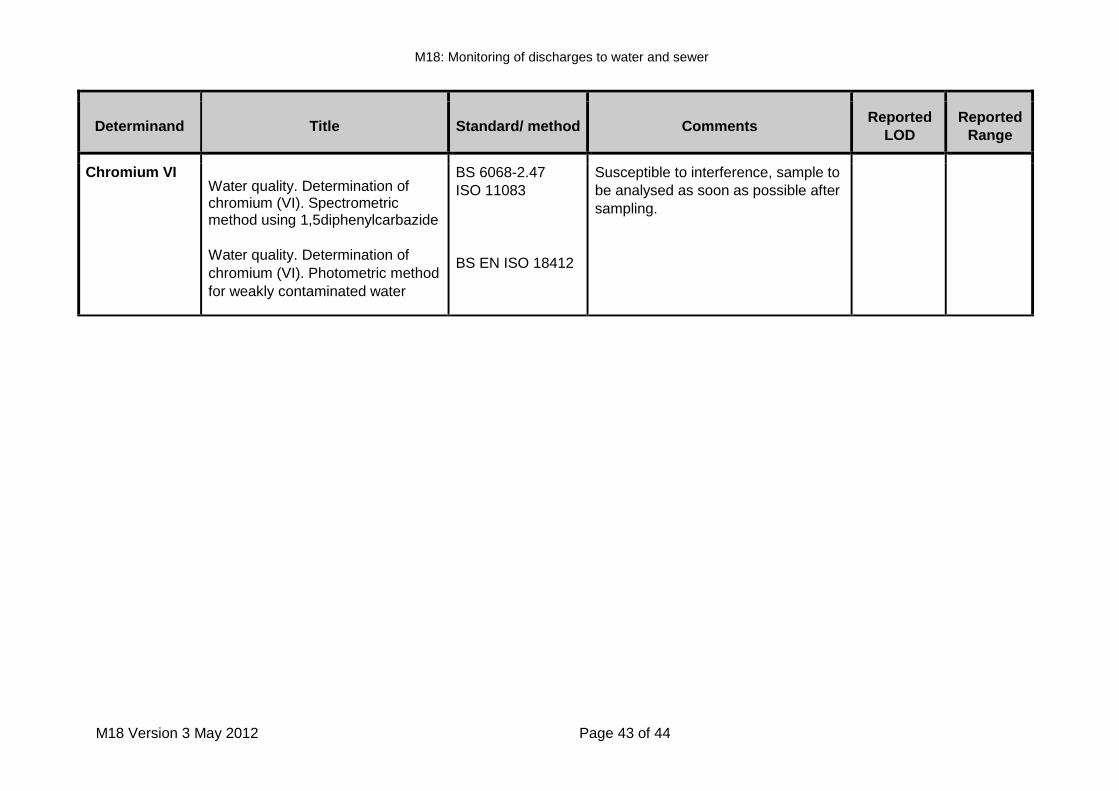
M18: Monitoring of discharges to water and sewer
M18 Version 3 May 2012 Page 43 of 44
Determinand Title Standard/ method Comments Reported
LOD
Reported
Range
Chromium VI Water quality. Determination of chromium (VI). Spectrometric method using 1,5diphenylcarbazide
Water quality. Determination of
chromium (VI). Photometric method
for weakly contaminated water
BS 6068-2.47
ISO 11083
BS EN ISO 18412
Susceptible to interference, sample to
be analysed as soon as possible after
sampling.
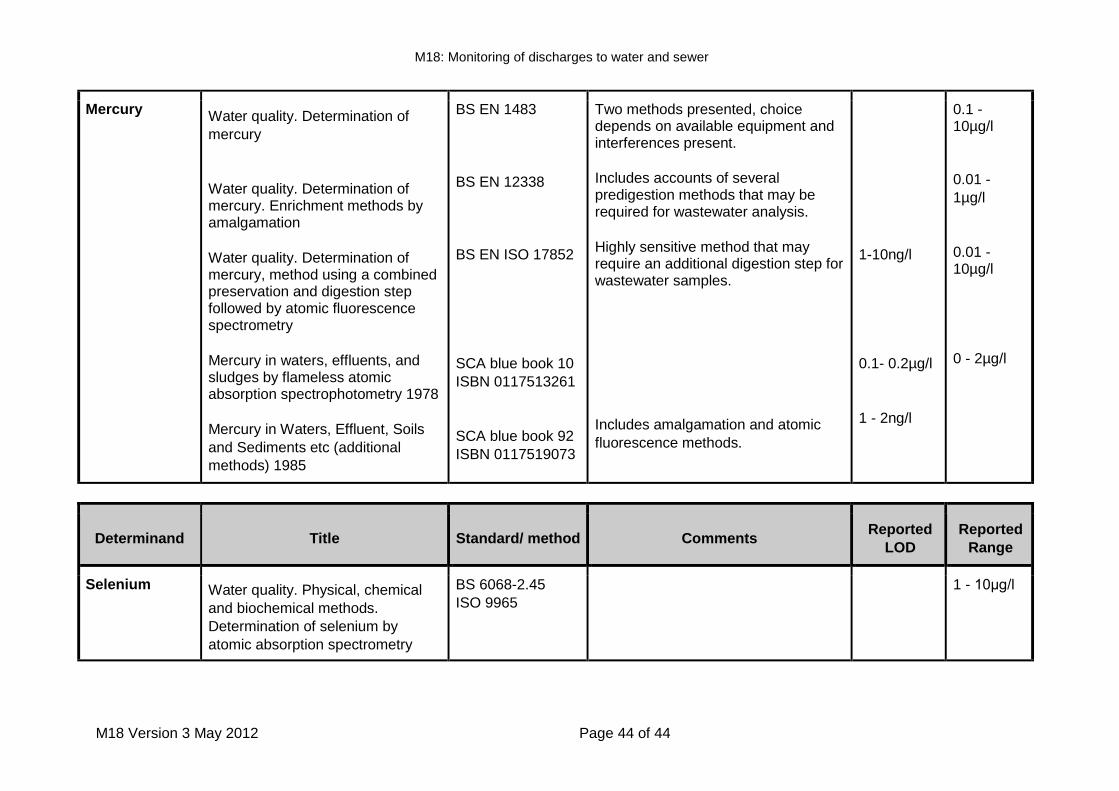
M18: Monitoring of discharges to water and sewer
M18 Version 3 May 2012 Page 44 of 44
Mercury Water quality. Determination of
mercury
Water quality. Determination of mercury. Enrichment methods by amalgamation
Water quality. Determination of mercury, method using a combined preservation and digestion step followed by atomic fluorescence spectrometry
Mercury in waters, effluents, and sludges by flameless atomic absorption spectrophotometry 1978
Mercury in Waters, Effluent, Soils
and Sediments etc (additional
methods) 1985
BS EN 1483
BS EN 12338
BS EN ISO 17852
SCA blue book 10
ISBN 0117513261
SCA blue book 92
ISBN 0117519073
Two methods presented, choice depends on available equipment and interferences present.
Includes accounts of several predigestion methods that may be required for wastewater analysis.
Highly sensitive method that may require an additional digestion step for wastewater samples.
Includes amalgamation and atomic
fluorescence methods.
1-10ng/l
0.1- 0.2µg/l
1 - 2ng/l
0.1 - 10µg/l
0.01 -
1µg/l
0.01 - 10µg/l
0 - 2µg/l
Determinand Title Standard/ method Comments Reported
LOD
Reported
Range
Selenium Water quality. Physical, chemical
and biochemical methods.
Determination of selenium by
atomic absorption spectrometry
BS 6068-2.45
ISO 9965
1 - 10μg/l
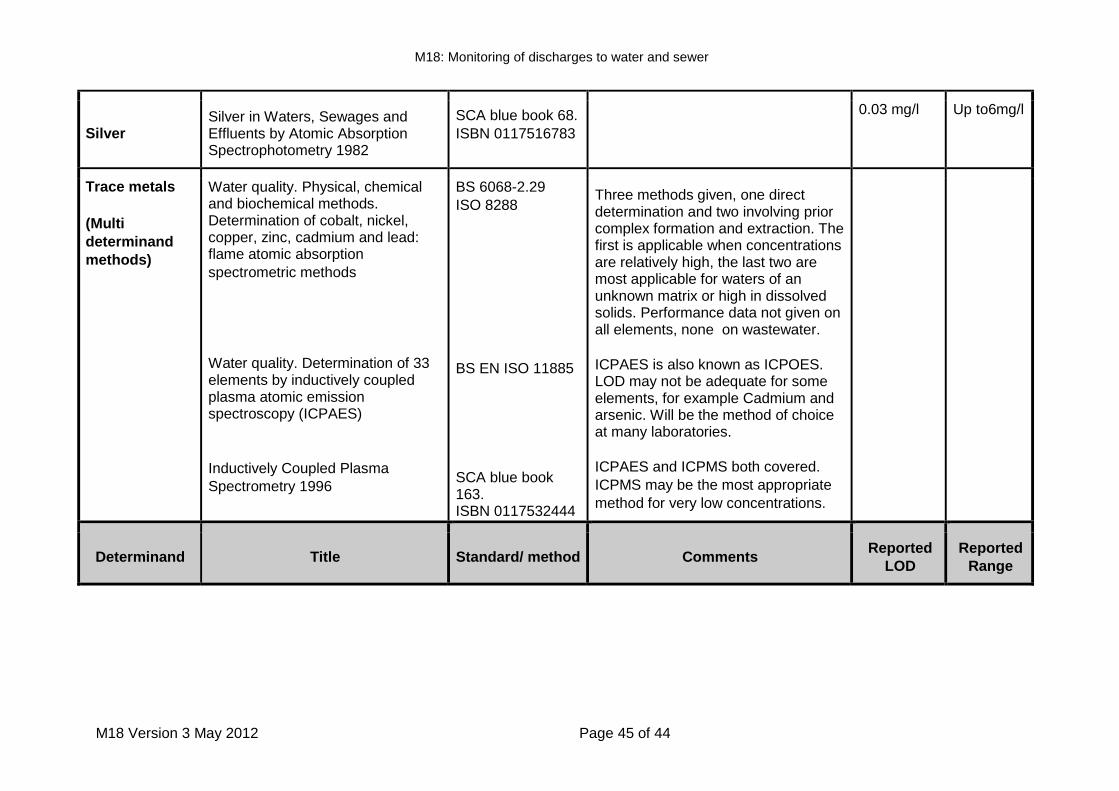
M18: Monitoring of discharges to water and sewer
M18 Version 3 May 2012 Page 45 of 44
Silver Silver in Waters, Sewages and Effluents by Atomic Absorption Spectrophotometry 1982
SCA blue book 68.
ISBN 0117516783
0.03 mg/l Up to6mg/l
Trace metals
(Multi
determinand
methods)
Water quality. Physical, chemical and biochemical methods. Determination of cobalt, nickel, copper, zinc, cadmium and lead: flame atomic absorption
spectrometric methods
Water quality. Determination of 33 elements by inductively coupled plasma atomic emission spectroscopy (ICPAES)
Inductively Coupled Plasma
Spectrometry 1996
BS 6068-2.29
ISO 8288
BS EN ISO 11885
SCA blue book 163. ISBN 0117532444
Three methods given, one direct determination and two involving prior complex formation and extraction. The first is applicable when concentrations are relatively high, the last two are most applicable for waters of an unknown matrix or high in dissolved solids. Performance data not given on all elements, none on wastewater.
ICPAES is also known as ICPOES. LOD may not be adequate for some elements, for example Cadmium and arsenic. Will be the method of choice at many laboratories.
ICPAES and ICPMS both covered.
ICPMS may be the most appropriate
method for very low concentrations.
Determinand Title Standard/ method Comments Reported
LOD
Reported
Range
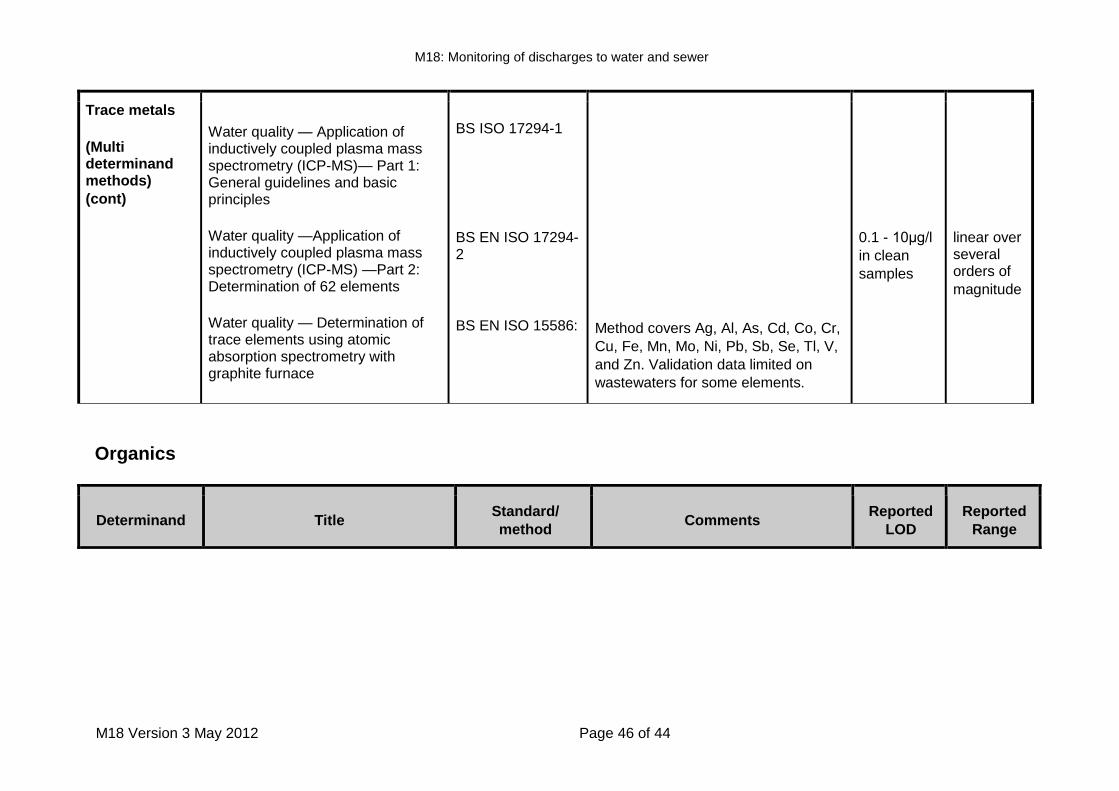
M18: Monitoring of discharges to water and sewer
M18 Version 3 May 2012 Page 46 of 44
Trace metals
(Multi determinand methods)
(cont)
Water quality — Application of inductively coupled plasma mass spectrometry (ICP-MS)— Part 1: General guidelines and basic principles
Water quality —Application of inductively coupled plasma mass spectrometry (ICP-MS) —Part 2: Determination of 62 elements
Water quality — Determination of trace elements using atomic absorption spectrometry with graphite furnace
BS ISO 17294-1
BS EN ISO 17294- 2
BS EN ISO 15586:
Method covers Ag, Al, As, Cd, Co, Cr,
Cu, Fe, Mn, Mo, Ni, Pb, Sb, Se, Tl, V,
and Zn. Validation data limited on
wastewaters for some elements.
0.1 - 10μg/l
in clean
samples
linear over several orders of
magnitude
Organics
Determinand Title Standard/
method Comments
Reported
LOD
Reported
Range
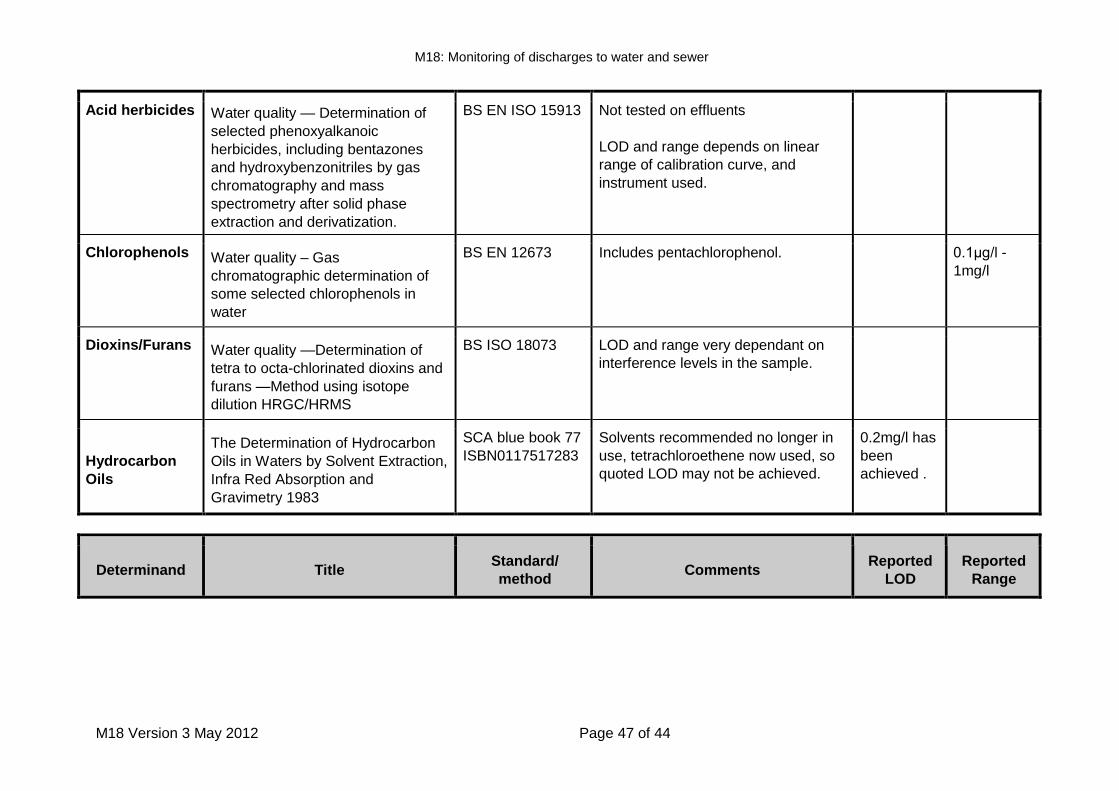
M18: Monitoring of discharges to water and sewer
M18 Version 3 May 2012 Page 47 of 44
Acid herbicides Water quality — Determination of
selected phenoxyalkanoic
herbicides, including bentazones
and hydroxybenzonitriles by gas
chromatography and mass
spectrometry after solid phase
extraction and derivatization.
BS EN ISO 15913
Not tested on effluents
LOD and range depends on linear
range of calibration curve, and
instrument used.
Chlorophenols Water quality – Gas
chromatographic determination of
some selected chlorophenols in
water
BS EN 12673
Includes pentachlorophenol. 0.1μg/l -
1mg/l
Dioxins/Furans Water quality —Determination of
tetra to octa-chlorinated dioxins and
furans —Method using isotope
dilution HRGC/HRMS
BS ISO 18073 LOD and range very dependant on
interference levels in the sample.
Hydrocarbon
Oils
The Determination of Hydrocarbon
Oils in Waters by Solvent Extraction,
Infra Red Absorption and
Gravimetry 1983
SCA blue book 77
ISBN0117517283
Solvents recommended no longer in
use, tetrachloroethene now used, so
quoted LOD may not be achieved.
0.2mg/l has
been
achieved .
Determinand Title Standard/
method Comments
Reported
LOD
Reported
Range
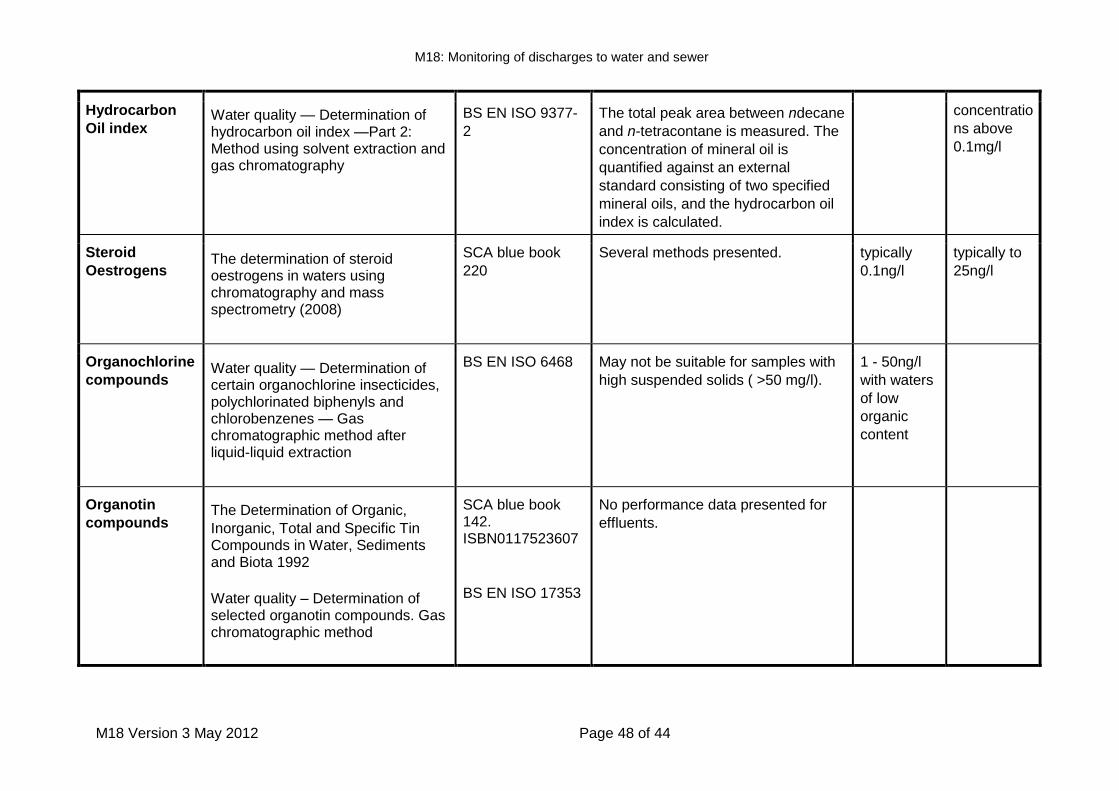
M18: Monitoring of discharges to water and sewer
M18 Version 3 May 2012 Page 48 of 44
Hydrocarbon
Oil index Water quality — Determination of hydrocarbon oil index —Part 2: Method using solvent extraction and gas chromatography
BS EN ISO 9377-
2
The total peak area between ndecane
and n-tetracontane is measured. The
concentration of mineral oil is
quantified against an external
standard consisting of two specified
mineral oils, and the hydrocarbon oil
index is calculated.
concentratio
ns above
0.1mg/l
Steroid
Oestrogens The determination of steroid oestrogens in waters using chromatography and mass spectrometry (2008)
SCA blue book
220
Several methods presented. typically
0.1ng/l
typically to
25ng/l
Organochlorine
compounds Water quality — Determination of certain organochlorine insecticides, polychlorinated biphenyls and chlorobenzenes — Gas chromatographic method after liquid-liquid extraction
BS EN ISO 6468
May not be suitable for samples with
high suspended solids ( >50 mg/l).
1 - 50ng/l
with waters
of low
organic
content
Organotin
compounds The Determination of Organic,
Inorganic, Total and Specific Tin Compounds in Water, Sediments and Biota 1992
Water quality – Determination of selected organotin compounds. Gas chromatographic method
SCA blue book 142. ISBN0117523607
BS EN ISO 17353
No performance data presented for
effluents.
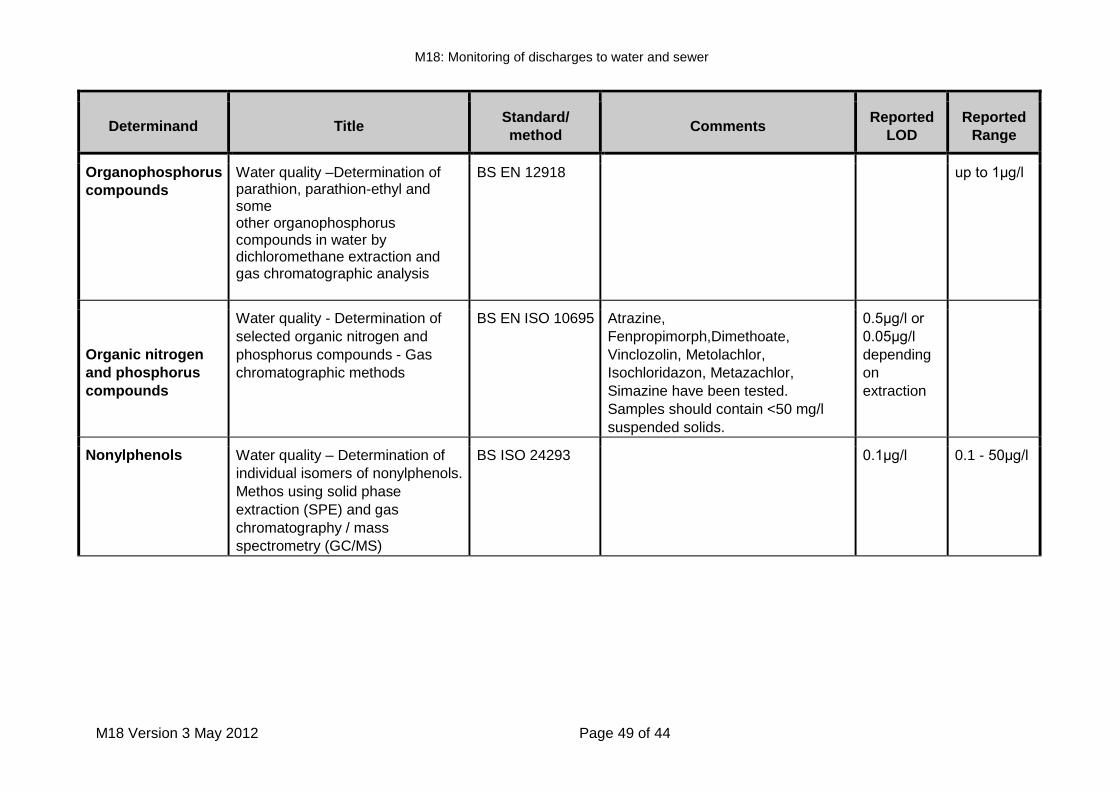
M18: Monitoring of discharges to water and sewer
M18 Version 3 May 2012 Page 49 of 44
Determinand Title Standard/
method Comments
Reported
LOD
Reported
Range
Organophosphorus
compounds
Water quality –Determination of parathion, parathion-ethyl and some other organophosphorus compounds in water by dichloromethane extraction and gas chromatographic analysis
BS EN 12918 up to 1μg/l
Organic nitrogen
and phosphorus
compounds
Water quality - Determination of
selected organic nitrogen and
phosphorus compounds - Gas
chromatographic methods
BS EN ISO 10695 Atrazine,
Fenpropimorph,Dimethoate,
Vinclozolin, Metolachlor,
Isochloridazon, Metazachlor,
Simazine have been tested.
Samples should contain <50 mg/l
suspended solids.
0.5μg/l or
0.05μg/l
depending
on
extraction
Nonylphenols Water quality – Determination of
individual isomers of nonylphenols.
Methos using solid phase
extraction (SPE) and gas
chromatography / mass
spectrometry (GC/MS)
BS ISO 24293 0.1μg/l 0.1 - 50μg/l
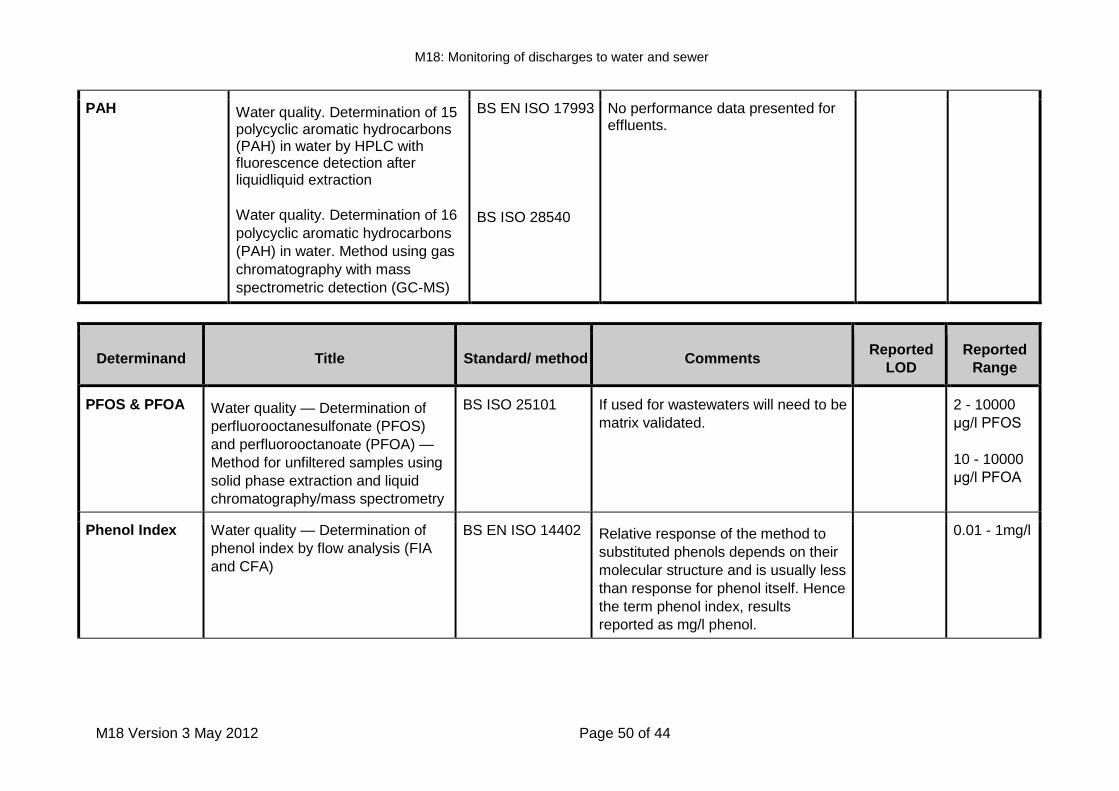
M18: Monitoring of discharges to water and sewer
M18 Version 3 May 2012 Page 50 of 44
PAH Water quality. Determination of 15 polycyclic aromatic hydrocarbons (PAH) in water by HPLC with fluorescence detection after liquidliquid extraction
Water quality. Determination of 16
polycyclic aromatic hydrocarbons
(PAH) in water. Method using gas
chromatography with mass
spectrometric detection (GC-MS)
BS EN ISO 17993
BS ISO 28540
No performance data presented for effluents.
Determinand Title Standard/ method Comments Reported
LOD
Reported
Range
PFOS & PFOA Water quality — Determination of
perfluorooctanesulfonate (PFOS)
and perfluorooctanoate (PFOA) —
Method for unfiltered samples using
solid phase extraction and liquid
chromatography/mass spectrometry
BS ISO 25101 If used for wastewaters will need to be
matrix validated.
2 - 10000
μg/l PFOS
10 - 10000
μg/l PFOA
Phenol Index Water quality — Determination of
phenol index by flow analysis (FIA
and CFA)
BS EN ISO 14402
Relative response of the method to
substituted phenols depends on their
molecular structure and is usually less
than response for phenol itself. Hence
the term phenol index, results
reported as mg/l phenol.
0.01 - 1mg/l
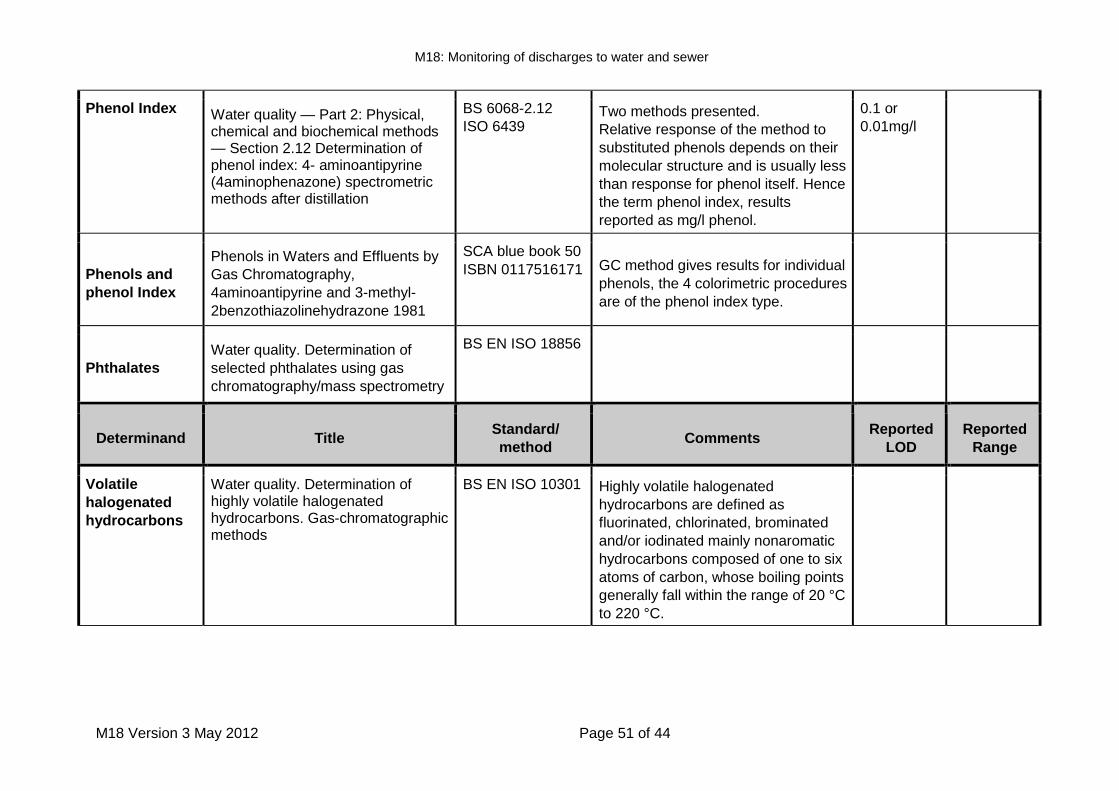
M18: Monitoring of discharges to water and sewer
M18 Version 3 May 2012 Page 51 of 44
Phenol Index Water quality — Part 2: Physical, chemical and biochemical methods — Section 2.12 Determination of phenol index: 4- aminoantipyrine (4aminophenazone) spectrometric methods after distillation
BS 6068-2.12
ISO 6439
Two methods presented.
Relative response of the method to
substituted phenols depends on their
molecular structure and is usually less
than response for phenol itself. Hence
the term phenol index, results
reported as mg/l phenol.
0.1 or
0.01mg/l
Phenols and
phenol Index
Phenols in Waters and Effluents by
Gas Chromatography,
4aminoantipyrine and 3-methyl-
2benzothiazolinehydrazone 1981
SCA blue book 50
ISBN 0117516171 GC method gives results for individual
phenols, the 4 colorimetric procedures
are of the phenol index type.
Phthalates
Water quality. Determination of
selected phthalates using gas
chromatography/mass spectrometry
BS EN ISO 18856
Determinand Title Standard/
method Comments
Reported
LOD
Reported
Range
Volatile
halogenated
hydrocarbons
Water quality. Determination of highly volatile halogenated hydrocarbons. Gas-chromatographic methods
BS EN ISO 10301
Highly volatile halogenated
hydrocarbons are defined as
fluorinated, chlorinated, brominated
and/or iodinated mainly nonaromatic
hydrocarbons composed of one to six
atoms of carbon, whose boiling points
generally fall within the range of 20 °C
to 220 °C.
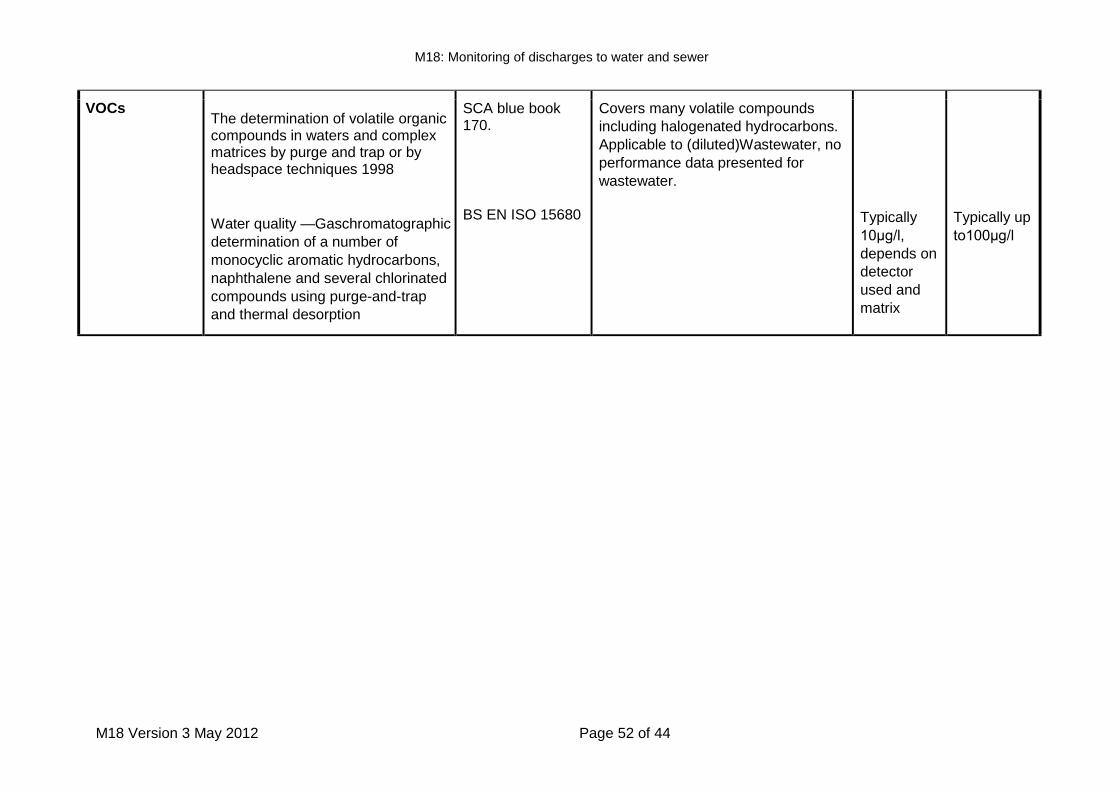
M18: Monitoring of discharges to water and sewer
M18 Version 3 May 2012 Page 52 of 44
VOCs The determination of volatile organic compounds in waters and complex matrices by purge and trap or by headspace techniques 1998
Water quality —Gaschromatographic
determination of a number of
monocyclic aromatic hydrocarbons,
naphthalene and several chlorinated
compounds using purge-and-trap
and thermal desorption
SCA blue book 170.
BS EN ISO 15680
Covers many volatile compounds
including halogenated hydrocarbons.
Applicable to (diluted)Wastewater, no
performance data presented for
wastewater.
Typically
10μg/l,
depends on
detector
used and
matrix
Typically up
to100μg/l


