146
TECHNICAL GUIDELINE FOR MONITORING, EVALUATION AND REPORTING (MER) OF RAD-GRK IMPLEMENTATION Ministry of Naonal Development Planning/ Naonal Development Planning Agency 2013
TECHNICAL GUIDELINE FOR MONITORING, EVALUATION AND REPORTING (MER) OF RAD-GRK IMPLEMENTATION
Ministry of National Development Planning/National Development Planning Agency
2013

TECHNICAL GUIDELINE FOR MONITORING, EVALUATION
AND REPORTING (MER) OF RAD-GRK IMPLEMENTATION
Ministry of National Development Planning/National Development Planning Agency
2013

iiiTECHNICAL GUIDELINE
FOR MONITORING, EVALUATION AND REPORTING (MER) OF RAD-GRK IMPLEMENTATION
Advisor Endah Murniningtyas Deputi Bidang Sumber Daya Alam dan Lingkungan Hidup, Bappenas
Person in Charge Wahyuningsih Darajati Direktur Lingkungan Hidup, Bappenas
Editors Syamsidar Thamrin, Atjeng Kadaryana, Budhi Setiawan, Muchamad Muchtar
Authors Land-Based Sector GroupFahmuddin Agus, Sonya Dewi, Prihasto Setyanto, Iman Santosa, Miranti Ariani, Andree Ekadinata, Feri Johana, Anna Tosiani, Ai Dairiah, Maswar Basri, Ariwibowo, I. Wayan Susi Dharmawan, Febyana Suryaningrum, Yuliana C. Wulan, Putra Agung, Degi Harja, Anggri Hervani, Virni Budi Arifanti.
Energy-Based Sector GroupHarris, Gita Lestari, Fitria Firman, Kunaefi, Ezrom Tapparan, Erick Hutrindo, Agung Feinnudin, Imam Hambali, Karlo Manik, Gitafajar Saptyani, Saifuddin Suaib, Achmad Zacky Ambadar, M. Nanang Prayudyanto, Agustina Martha Kimberly, Trita Katriana, Devin Maeztri, Indira Darmoyono.
Waste SectorKati Andraini Darto, Dida Migfar, Gan Gan Dirgantara, Febrian Hadinata, R.M. Rangga Rajasa Akib, Badariah Yosiyana.
Technical Support TeamAries Kusumawanto, Mulkan A. Gani, Shinta Sirait, Zamsyar Giendhra Fad, Asclepias Rachmi, Soeharwinto, Damantoro, Altami Chrysan Arasty, Citara Nayla Iqbal, Dwiyanti Arimbi Jinca.
Administrative TeamLestira Wattimena, Harliana, Tanti Hariyanti, Septy Haryanny
TEAM OF AUTHORS

ivTECHNICAL GUIDELINE FOR MONITORING, EVALUATION AND REPORTING (MER) OF RAD-GRK IMPLEMENTATION
ACKNOWLEDGEMENT
We would like to extend our gratitude to all staff under the Deputy for Natural Resources and Environment, Ministry of National Development Planning/ Bappenas for the support in the development of the Technical Guideline.
The development of the Technical Guideline for Monitoring, Evaluation and Reporting (MER) of Local Action Plans for Green House Gas Emission Reduction (RAD-GRK) is supported by Deutsche Gesellschaft für Internationale Zusammenarbeit (GIZ) through Policy Advice for Environment and Climate Change (Paklim). The support has been very highly appreciated.
The development process of the Technical Guideline has also been supported through well-fostered partnership of various institutions with high dedication from the following parties:
1. Ministry of Home Affairs2. Ministry of Energy and Mineral Resources3. Ministry of Forestry4. Ministry of Finance 5. Ministry of Environment6. Ministry of Transportation7. Ministry of Public Works8. Ministry of Industry9. Ministry of Agriculture10. GIZ Transport and Climate Change11. ICCTF12. ICED/USAID13. ICRAF (World Agro-forestry)14. JICA
Our deep gratitude is extended to all parties and participants of the workshop on the development of General Guideline and Technical Guideline for MER of RAD-GRK which provided a lot of inputs to the improvement of the Technical Guideline.

vTECHNICAL GUIDELINE
FOR MONITORING, EVALUATION AND REPORTING (MER) OF RAD-GRK IMPLEMENTATION
TEAM OF AUTHORS iiiACKNOWLEDGEMENT ivTABLE OF CONTENTS vLIST OF MER FORMS viLIST OF TABLES viiLIST OF PICTURES viiiGLOSSARY ix
CHAPTER 1INTRODUCTION 1.1 Background 1 1.2 Goal 2 1.3 Scope 2 1.4 Definition 2
CAHPTER 2TECHNICAL GUIDELINE FOR LAND-BASED SECTOR GROUP 2.1 Agricultural Sector 8 2.2 Forestry and Peatland Sector 9
CHAPTER 3TECHNICAL GUIDELINE FOR ENERGY-BASED SECTOR GROUP 3.1 Energy Sector 59 3.2 Transportation Sector 72
CHAPTER 4 TECHNICAL GUIDELINE FOR WASTE MANAGEMENT SECTOR 4.1 Domestic Solid Waste Sub-Sector 95 4.2 Domestic Liquid Waste Sub-Sector 114
BIBLIOGRAPHY 129
TABLE OF CONTENTS

viTECHNICAL GUIDELINE FOR MONITORING, EVALUATION AND REPORTING (MER) OF RAD-GRK IMPLEMENTATION
LIST OF MER FORMS
FORM 2.1.1 Core Activity Form for Agriculture Sector 10FORM 2.1.2a Core Activity Calculation Form for Agriculture Sector in Fertilizing System Category 13FORM 2.1.2b Core Activity Calculation Form for Agriculture Sector of Rice Field Cultivation Category 19FORM 2.1.2c Core Activity Calculation Form for Agriculture Sector of Animal
Husbandry Category 24FORM 2.1.3 Supporting Activity Form for Agriculture Sector 28FORM 2.2.1 Core Activity Form for Forestry and Peatland Sector 37FORM 2.2.2a Calculation Form for Forestry and land Use Change in Mineral Land 41FORM 2.2.2b Calculation Form for Forestry and Land Use Change in Peatland 47FORM 2.2.3 Supporting Activity Form for Forestry and Peatland Sector 56FORM 3.1.1 Core Activity Form for Energy Sector 62FORM 3.1.2 Emission Calculation Form for Energy Sector 65FORM 3.1.3 Supporting Activity Form for Energy Sector 70FORM 3.2.1 Core Activity Form for Transportation Sector 76FORM 3.2.3 Supporting Activity Form for Transportation Sector 91FORM 4.1.1 Core Activity Form for Domestic Solid Waste Sub-Sector 97FORM 4.1.2 Supporting Activity Form for Domestic Solid Waste Sub-Sector 101FORM 4.1.3 District/City GHG Inventory Form for Domestic Solid Waste Sub-
Sector 104FORM 4.1.4 Provincial GHG Inventory Form for Domestic Solid Waste Sub-Sector 109FORM 4.1.5 National GHG Inventory Form for Domestic Solid Waste Sub-Sector 112FORM 4.2.1 Core Activity Form for Domestic Liquid Waste Sub-Sector 115FORM 4.2.2 Supporting Activity Form for Domestic Liquid Waste Sub-Sector 119FORM 4.2.3 District/City GHG Inventory Form for Domestic Liquid Waste Sub-Sector 122FORM 4.2.4 Provincial GHG Inventory Form for Domestic Liquid Waste Sub-Sector 124FORM 4.2.5 National GHG Inventory Form for Domestic Liquid Waste Sub-Sector
126

viiTECHNICAL GUIDELINE
FOR MONITORING, EVALUATION AND REPORTING (MER) OF RAD-GRK IMPLEMENTATION
LIST OF TABLES
TabLe 1 Example of activities in fertilizing activity group 17TabLe 2 Example of activities in rice field cultivation category 23TablE 3 Examples of activities in animal husbandry management activity group 27Table 4 Correction factor (cf ) for various water treatment in Indonesia 31Table 5 Default Ch4 emission SCALING factor for water regime before planting period 31Tabel 6 Default converstion factor for use of various types of organic materials 31Table 7 Correction factor (CF) of various varieties of field rice in Indonesia* 32Tabel 8 Correction factor (CF) for various varieties of tidal rice in Indonesia* 32Table 9 Default N2O emission factor from managed land 33Tabel 10 Default Emission Factor for N2O Indirectly from Volatilization and
Laundering 33TabLe 11 Emission Factor from Utilization of Amelioran in Peat Soil Converted into Rice Field 33Table 12 Peat soil Emission Factor with palm oil Land Use 34Table 13 CH4 emission factor from enteric fermentation 34Table 14 CH4 emission factor from cattle manure management 34Table 15 N2O Emission Factor direclty and indirectly from Cattle Manure in
Indonesia 34Table 16 Carbon stock per land cover type 52Table 17 Emission factor from decomposed Peat 53Table 18 Peat emission matrix of every land use change 54

viiiTECHNICAL GUIDELINE FOR MONITORING, EVALUATION AND REPORTING (MER) OF RAD-GRK IMPLEMENTATION
LIST OF PICTURES
Picture 1 Fuel consumption of each vehicle per kilometer 74

ixTECHNICAL GUIDELINE
FOR MONITORING, EVALUATION AND REPORTING (MER) OF RAD-GRK IMPLEMENTATION
GLOSSARY
APBN : State BudgetAPBD-K : City/District Government BudgetAPBD-P : Provincial Government Budget APL : Other Use Area Bappenas : National Development Planning AgencyBAU : Business As Usual ( condition without any action plans)BBM : Fuel BLH : Environmental AgencyBPS : National Bureau of StatisticsBRT : Bus Rapid TransitC dari Biomassa : Carbon from BiomassCF : Correction FactorCFL : Compact Fluorescent LampDAS : WatershedDBH : Diameter at Breast Height (for trees)DED : Detailed Engineering DesignDIPA : Budget Implementation DocumentsDIPDA : Local Development BudgetEF : Emission FactorEBT : New and Renewable EnergyEBTKE : New Renewable Energy and Energy ConservationESDM : Energy and Mineral Resources (EMR)Gg : Giga gram = 1.000.000.000 gramGRK : Green House Gas (GHG) HD : Village ForestHPT : Limited Production ForestHKm : Social ForestryHR : Community ForestHTI : Industrial Forest PlantationsHTR : Community Plantation ForestIKK : Key Performance Indicators IPAL : Waste Water Treatment PlantIPCC : Intergovernmental Panel on Climate ChangeIPCC GL : Intergovernmental Panel on Climate Change Guidelines for National
Green House Gas InventoriesITS : Intelligent Transport System
xTECHNICAL GUIDELINE FOR MONITORING, EVALUATION AND REPORTING (MER) OF RAD-GRK IMPLEMENTATION
KLHS : Strategic Environmental Assessment KPH : Forest Management Unit KSN : National Strategic AreaLED : Light Emitting Diode LPJ : Accountability Report LPG : Liquid Petroleum GasMCK : Bathing, Washing and Toilet FacilityMRV : Measurement, Reporting, and VerificationMw : Mega WattMwH : Mega Watt hourNAMA : Nationally Appropriate Mitigation ActionNMT : Non-motorised transportPEP : Monitoring, Evaluation, and Reporting (MER)PHLN : Foreign Grants and LoansPJU : Public Street LightingPLN : State-Owned Electricity Company PLTB : Wind Power PlantPLTM : Minihydro Power PlantPLTMH : Micro Hydro Power PlantPLTS : Solar Power PlantPP : Government RegulationPTT : Integrated Crop Management (ICM)RAN-GRK : National Action Plans for Green House Gas Emission Reduction RAD-GRK : Local Action Plans for Green House Gas Emission Reduction REDD+ : Reducing Emissions from Deforestation and Forest Degradation and
the conservation of forests, the sustainable management of forests and the enhancement of forest carbon stocks
RIL : Reduced Impact LoggingRTR : Spatial Plan RTRW : Regional Spatial Plan SDH : Forest ResourceSF : Scaling FactorSITT : Crop-Livestock Integrated SystemSLPTT : Integrated Crop Management Field SchoolSRI : System of Rice IntensificationTIC : Traffic Impact ControlUPPO : Organic Fertilizer Processing UnitVTPI : Victoria Transport Policy Institute
1TECHNICAL GUIDELINE
FOR MONITORING, EVALUATION AND REPORTING (MER) OF RAD-GRK IMPLEMENTATION
1.1 Background
Implementation of National Action Plan and Local Action Plan for Green House Gas Emission Reduction (RAN-GRK and RAD-GRK) conducted by the central government and local governments constitutes a pivotal factor for the realization of Indonesian GHG emission reduction targets by 2020. The implementation effectiveness needs supporting through monitoring, evaluation and reporting (MER) in order to improve the performance of various GHG emission mitigation actions in a sustainable manner. In order to ensure consistent and quality MER implementation it is necessary to have a technical guideline which is expected to be used by all related stakeholders both at the national and sub-national level in accordance with respective authorities.
As an inseparable part of the General Guideline for MER of RAN/RAD-GRK implementation, the Technical Guideline for MER of RAD-GRK Implementation is an instrument for identifying mitigation action achievement and measuring the emission reduction. To accommodate all categories of activities under RAD-GRK, the Technical Guideline is divided into three parts, namely: 1) land-based sector group, including agriculture, forestry and peatland, 2) energy-based sector group including energy, transportation and industry, 3) waste management sector.
In detail, the Technical Guideline contains steps for monitoring the achievement of results and targets set in the planning stage. In addition, various emerging problems and initiatives to handle them can be assessed so that mitigation action performance can be improved in the following years.
CHAPTER 1INTRODUCTION
2TECHNICAL GUIDELINE FOR MONITORING, EVALUATION AND REPORTING (MER) OF RAD-GRK IMPLEMENTATION
1.2 Goal
Goals of the Technical Guideline are: (1) Providing a reference especially for Local Governments and other relevant
parties to identify and collect information related to the implementation of the activities under RAD-GRK;
(2) Providing fill-in instructions for the achievement of mitigation actions and calculation of GHG emission reduction in the RAD-GRK.
1.3 Scope
The scope of the Technical Guideline includes how to fill in mitigation action and GHG emission reduction calculation in: (1) Land-based sector group covering agriculture, forestry and peatland sectors; (2) Energy-based sector group covering energy, transportation and industry
sectors, and (3) Waste management sector.
1.4 Definition
(1) MER of RAD-GRK The intended MER activities include monitoring, evaluation and reporting of
mitigation action achievement and the GHG emission reduction within RAD-GRK consisting of: a) Core activities, namely actions having direct impact on GHG emission
reduction and removal; and b) Supporting Activities, namely actions having indirect impact on GHG
emission reduction, and serve to facilitate the implementation of core activity or serve as conditions which will enable the implementation of core activity.
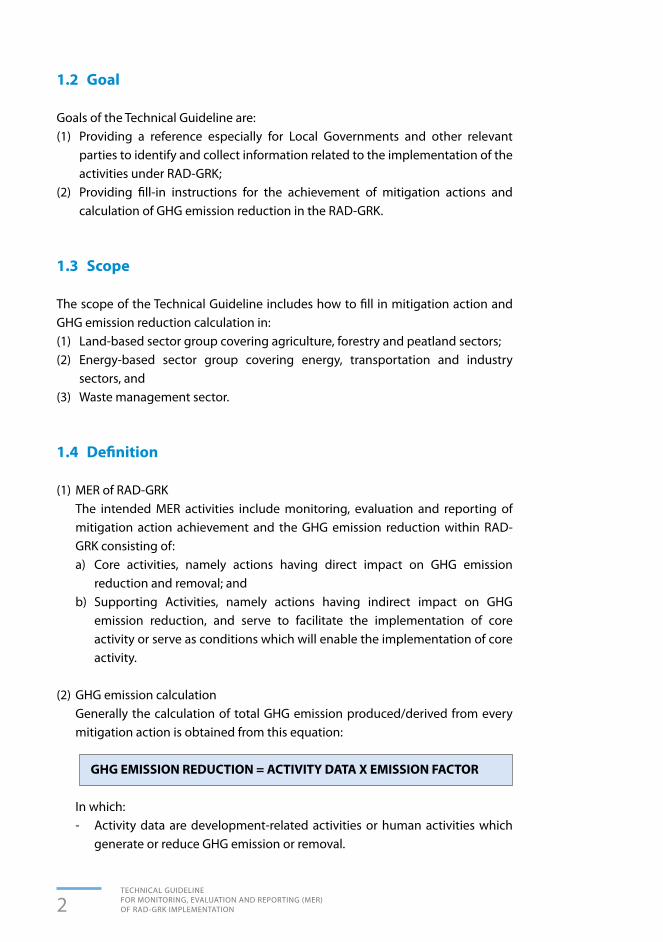
(2) GHG emission calculation Generally the calculation of total GHG emission produced/derived from every
mitigation action is obtained from this equation:
GHG EMISSION REDUCTION = ACTIVITY DATA X EMISSION FACTOR
In which: - Activity data are development-related activities or human activities which
generate or reduce GHG emission or removal.

3TECHNICAL GUIDELINE
FOR MONITORING, EVALUATION AND REPORTING (MER) OF RAD-GRK IMPLEMENTATION
In this MER activity, the activity data which are monitored and evaluated are obtained from main/specific performance indicators different from mitigation actions of each sector within provincial RAD-GRK documents.
- GHG emission or removal factors show the amount of emission/removal per unit of activity done.
If available, emission factor should use local emission factor (based on research). If not available, it is recommended to use local emission factors for other areas or national and regional emission factors based on respective sectors, as being developed by IPCC through Emission Factor Database. To make the reporting easier, the emission factors for every sector will be presented in the next chapters. If not available, the emission factor will be based on the decision of Minister of PPN/BAPPENAS with the Climate Change Coordination Team.
(3) Codification of Mitigation Actions To support the identification and assessment of Mitigation Actions especially
in the RAD-GRK and its relations with RAN-GRK, mitigation action codes have been developed. Qualification coding refers to codification format based on Sectors, Main Categories, Activity Categories in RAN, Province and RAD activities as shown below.
RAD 01 01 01 001
1 2 3 4 5
Local Sector Catagory of Province Mitigation Action Plan Core Activities Number 1-33 activities in or Supporting provincial Activities RAD-GRK
Notes:1) Code 1 is Local Action Plan (RAD)2) The next Two Digits (column 2) are Sector Category, in this case, Land-
Based Sector Group has Code 01, Energy-Based Sector Code 02, and Waste Management Sector Code 03
3) The next Two Digits (column 3) are Core Activity Category or Supporting Activity Category based on the outcomes of RAD-GRK activities.
4) The next Two Digits (column 4) shows the order of Provinces in accordance with the ordinal number in the Indonesian Bureau of Statistics (BPS).
5) The next Two Digits (column 5) shows the order of RAD-GRK activities at the Provincial Level


5TECHNICAL GUIDELINE
FOR MONITORING, EVALUATION AND REPORTING (MER) OF RAD-GRK IMPLEMENTATION
Monitoring, Evaluation and Reporting (MER) of RAD GRK in the Forestry and Peatland sectors are conducted in three phases:1. Monitoring of RAD GRK activities;2. Evaluation of RAD GRK activities;3. Reporting of RAD GRK activities.
The explanation is as follows:1. Monitoring of RAD GRK activities conducted by Local Governments aims to :
a. Monitor Action Plan conducted in the local development process in the reporting year;
b. Monitor outputs from mitigation action implementation in accordance with key performance indicators;
c. Monitor change in activity data from emission reduction action in area unit.
The steps to be done in the monitoring phase are:a. To include a list emission reduction action plans already implemented in
local development in the reporting year. The activity data can be obtained from activity implementation report or local gocernment report or other
CHAPTER 2TECHNICAL GUIDELINE FOR LAND-BASED SECTOR GROUP
6TECHNICAL GUIDELINE FOR MONITORING, EVALUATION AND REPORTING (MER) OF RAD-GRK IMPLEMENTATION
stakeholders’ ones (private sector, central agencies at the local level, as well as the socieity).
b. To categorize such activities into Core Activities and Supporting Activities;c. Categorize Core Activities into sub categories:
• Forestry’s Core Activities in Carbon Stock Reduction Avoidance SubCategory (PPCK) and Increase in Carbon Stock (PCK);
• Agriculture’s Core Activities in Fertilizing, Paddy Field Cultivation andAnimal Husbandry Sub Categories.
d. Include activity implementation achievements in key performance indicator parameters;
e. Include activity implementation achievements in the form of activity data represented by change in activity data area by land cover type.
2. Evaluation of RAD-GRK Activities conducted jointly by the local government and central government aims to: a. Evaluate GHG emission reduction action plan implementation by emission
reduction number/activity parameters;b. Evaluate change in activity data per land cover in the landscape scale in the
province;c. Evaluate implemented RAD GRK activities as recommendations for emission
reduction activities in the following year, including cost rationalization, resource availability, sustainability, etc.
In the evaluation phase, Local Governments are tasked with providing activity data in GHG emission reduction that describe change in ara by green house gas reduction activity resulted by the implemented activities/ budget investment; both with the use of government’s budget and other stakeholders’ including society.
Emission factor data is recommended by the central government and is subject to change in accordance with scientific advances in carbon sector research in Indonesia and across the world. If available, local governments can use local emission factor data which meet scientific requirements.
In the Guideline Book, Core Activity Calculation Form For serves as one of the support tools that can be used to evaluate emission reduction achievements by activity.
3. Reporting of RAD GRK Activities includes activities of:a. Reporting RAD GRK Activitiesb. Verifying RAD GRK Reportsc. Revising RAD GRK Reports;d. Approving RAD GRK Reports.
7TECHNICAL GUIDELINE
FOR MONITORING, EVALUATION AND REPORTING (MER) OF RAD-GRK IMPLEMENTATION
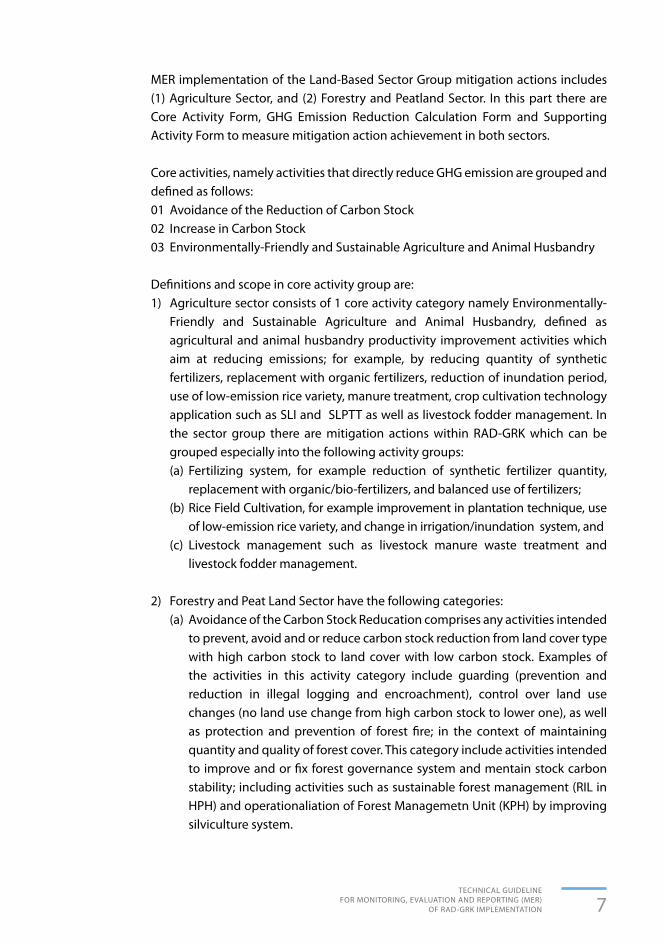
MER implementation of the Land-Based Sector Group mitigation actions includes (1) Agriculture Sector, and (2) Forestry and Peatland Sector. In this part there are Core Activity Form, GHG Emission Reduction Calculation Form and Supporting Activity Form to measure mitigation action achievement in both sectors.
Core activities, namely activities that directly reduce GHG emission are grouped and defined as follows:01 Avoidance of the Reduction of Carbon Stock 02 Increase in Carbon Stock 03 Environmentally-Friendly and Sustainable Agriculture and Animal Husbandry
Definitions and scope in core activity group are:1) Agriculture sector consists of 1 core activity category namely Environmentally-
Friendly and Sustainable Agriculture and Animal Husbandry, defined as agricultural and animal husbandry productivity improvement activities which aim at reducing emissions; for example, by reducing quantity of synthetic fertilizers, replacement with organic fertilizers, reduction of inundation period, use of low-emission rice variety, manure treatment, crop cultivation technology application such as SLI and SLPTT as well as livestock fodder management. In the sector group there are mitigation actions within RAD-GRK which can be grouped especially into the following activity groups:(a) Fertilizing system, for example reduction of synthetic fertilizer quantity,
replacement with organic/bio-fertilizers, and balanced use of fertilizers;(b) Rice Field Cultivation, for example improvement in plantation technique, use
of low-emission rice variety, and change in irrigation/inundation system, and(c) Livestock management such as livestock manure waste treatment and
livestock fodder management.
2) Forestry and Peat Land Sector have the following categories:(a) Avoidance of the Carbon Stock Reducation comprises any activities intended
to prevent, avoid and or reduce carbon stock reduction from land cover type with high carbon stock to land cover with low carbon stock. Examples of the activities in this activity category include guarding (prevention and reduction in illegal logging and encroachment), control over land use changes (no land use change from high carbon stock to lower one), as well as protection and prevention of forest fire; in the context of maintaining quantity and quality of forest cover. This category include activities intended to improve and or fix forest governance system and mentain stock carbon stability; including activities such as sustainable forest management (RIL in HPH) and operationaliation of Forest Managemetn Unit (KPH) by improving silviculture system.

8TECHNICAL GUIDELINE FOR MONITORING, EVALUATION AND REPORTING (MER) OF RAD-GRK IMPLEMENTATION
(b) Increase in Carbon Stock: it is the category of activity aiming to increase carbon sink through improved quality and quantity of stands. Examples of mitigation actions in this category includes planting in forest area or other use area, forest and land rehabilitation, land reclamation after mining activity, mangrove rehabilitation, farming extensification/intensification from land with lower carbon stock.
For the calculation of GHG emission reduction from each mitigation action in the Forestry and Peatland and Agriculture sectors there are GHG Emission Reduction Calculation Form consisting of:
(a) Core Activites for Forestry and Peatland Sector:I. Calculation Form for Forestry and Land Use Change Activities Group in
Mineral LandII. Calculation Form for Forestry and Land Use Change Activities Group in
PeatlandIII. Calculation Form for Fertilizing Activity Group in Peatland
(b) Core activities for Agriculture SectorI. Calculation Form for Fertilizing Activity Group II. Calculation Form for Rice Field Cultivation Activity Group III. Calculation Form for Animal Husbandry Activity Group
Supporting Activities that which have indirect impact on GHG emission reduction, and serve to facilitate the implementation of core activity or serve as conditions which will enable the implementation of core activity. Supporting activities are categorised into:1. Supporting Activities Form for Forestry and Peatland Sector, and2. Supporting Activities Form for Agriculture Sector.
2.1 AGRICULTURE SECTOR
2.1.1 Core Activity Form for Agriculture Sector Core Activity Form for Agriculture is used to monitor and evaluate each mitigation
action of agriculture sector in the Environmentally-friendly and Sustainable Agriculture and Animal Husbandry categories. The activities monitored and evaluated in this form are those included in the core activity category. This form is filled in by Provincial Governments/ District/City Governments according to their respective authorities..

9TECHNICAL GUIDELINE
FOR MONITORING, EVALUATION AND REPORTING (MER) OF RAD-GRK IMPLEMENTATION
2.1.2 Core Activity Calculation Form for Agriculture Sector Core Activity Calculation Form for Agriculture Sector is used to monitor change
in activity data and emission factor in mitigation action implementation in the agriculture sector in order to calculate GHG emission reduction according to the emission sources calculated in BAU Baseline of RAD-GRK. Core Activity Calculation Form for Agriculture Sector consists of:(a) Core Activity Calculation Form for Fertilizing System: is used to measure
emission reduction from low-emission agricultural activities related to fertilizing and organic materials returned to soil, both in rice fields, plantation, as well as other forms of agricultural activities which use fertilizers in improving agricultural production and reducing emissions;
(b) Core activity Calculation Form for Rice Field Cultivation: is used to measure emission reduction from low-emission agricultural activities related to rice field cultivation such as planting technique improvement, low-emission rice variety use, and irrigation/inundation systems;
(c) Core activity Calculation Form for Animal Husbandry Management is used to measure emission reduction from low-emission animal husbandry activities related to cattle manure management and cattle fodder management.
Box 1• Agricultural Activities related to land use change such as farming
intensification with mixed agricultural land/plantation/farming or rubber plantation and cocoa farming extension on abandoned lands, the emission reduction is calculated by using FORM PCK .
2.1.3 Supporting Activity Form for Agriculture Sector Supporting Activity Form for Agriculture Sector is used to monitor and
evaluate each mitigation action included in supporting activities category namely activities which enable conditions for core activities or will reduce emissions indirectly.
2.2 FORESTRY AND PEATLAND SECTOR
Monitoring and evaluation in forestry and peatland sector is used to monitor and evaluate mitigation action implementation in RAD-GRK to reduce emissions according to emission sources calculated in BAU Baseline RAD-GRK. Mitigation actions in forestry and peatland sector are related to land use change, including activities that increase carbon removals through planting and rehabilitation in degraded forests and activities that reduce GHG emissions through forest management improvement.

10TECHNICAL GUIDELINE FOR MONITORING, EVALUATION AND REPORTING (MER) OF RAD-GRK IMPLEMENTATION
FORM
2.1
.1 C
ore
Act
ivit
y Fo
rm fo
r Agr
icul
ture
Sec
tor
SEC
TOR
: AG
RICU
LTU
RE
CATA
GO
RY
:
YEA
R :
REPO
RTER
:
Cent
ral G
over
nmen
t M
inis
try
:
Prov
inci
al G
over
nmen
t Pr
ovin
ce
:
Dis
tric
t/Ci
ty G
over
nmen
t D
istr
ict/
City
:
12a
2b3a
3b4a
14b
15a
4a2
4b2
5b
Code
RAD
LPJ
RAD
LPJ
Qua
ntity
Qua
ntity
Star
tUn
itUn
itEn
d
Miti
gatio
n Ac
tion/
Core
Act
ivity
(2)
Loca
tion
(3)
Targ
et (4
)
RAD
(4a)
LPJ (
4b)
RAN/
RAD
– GR
K Im
plem
enta
tion
Perio
d (5
)

11TECHNICAL GUIDELINE
FOR MONITORING, EVALUATION AND REPORTING (MER) OF RAD-GRK IMPLEMENTATION
FORM
2.1
.1 C
ore
Act
ivit
y Fo
rm fo
r Agr
icul
ture
Sec
tor (
Cont
inua
tion
)
SEC
TOR
: AG
RICU
LTU
RE
CATA
GO
RY
:
YEA
R :
REPO
RTER
:
Cent
ral G
over
nmen
t M
inis
try
:
Prov
inci
al G
over
nmen
t Pr
ovin
ce
:
Dis
tric
t/Ci
ty G
over
nmen
t D
istr
ict/
City
:
6a7a
8a6b
7b8b
6c7c
8c9
10a
10b
1113
1214
156d
7d6e
7e6f
7f
APBN
APBN
APBD-P
APBD-P
APBD-K
APBD-K
PHLN
PHLN
Swasta
Swasta
Jumlah
Jumlah
Narasi
Jumlah
Unit Satuan
Budg
et A
lloca
tion
Plan
bas
ed o
n so
urce
(m
illio
n ru
piah
) (6
)
Budg
et u
se b
ased
on
sour
ce
(mill
ion
rupi
ah)
(7)
Key
perfo
rman
ce
indi
cato
r (8
)Re
alize
d Ac
tiviti
es(%
)
BAU
Emiss
ion
(tCO
2eq)
Actu
al
Emiss
ion
Redu
ctio
n (tC
O2e
q)
GHG
Emss
ions
w
ith
Miti
gatio
n Ac
tions
(tC
O2e
q)
Rem
arks
Co-B
enefi
t
Activ
ity
Impl
emen
ter
(10)
RAD
LPJ

12TECHNICAL GUIDELINE FOR MONITORING, EVALUATION AND REPORTING (MER) OF RAD-GRK IMPLEMENTATION
Instructions to fill in Form 2.1.1
The Core Activity Form is used to monitor and evaluate each mitigation action included in core activity category, namely activities that generate GHG emission reduction directly. Filling in the form can be done as follows:
1. Column 1 is filled with mitigation action code (see the section on category codes of core activities and supporting activities of land-based sector);
2. Column 2 is filled with titles of each mitigation action both based on RAD and LPJ; if RAD activities are already mentioned in LPJ, fill in both columns
3. Column 3 is filled with location of core mitigation action;
4. Column 4 is filled with targets of each mitigation action along with the unit used for the target;
5. Column 5 is filled with the mitigation action implementation period;
6. Column 6 is filled with budget allocation plan for conducting each mitigation action in the relevant year;
7. Column 7 is filled with budget use;
8. Column 8 is filled with key performance indicator;
9. Column 9 is filled with mitigation action implemented.
10. Column 10 is filled with mitigation action implementing institution.
11. Column 11 is filled with the total BAU Baseline GHG emission level (if it is not possible for BAU Baseline by activity, it can be filled by BAU Baseline by sector. The BAU Baseline is pursuant to what is mentioned in the annex of Perpres (Presidential Regulation) No. 61/2011 and RAD-GRK document).
12. Column 12 is filled with GHG emissions generated by each mitigation action.
13. Column 13 is filled with GHG emission reduction from each implemented mitigation action.
14. Column 14 is filled with information on co-benefit resulted in mitigation action.
15. Column 15 is filled with additional information as necessary.
13TECHNICAL GUIDELINE
FOR MONITORING, EVALUATION AND REPORTING (MER) OF RAD-GRK IMPLEMENTATION
15a
6a5b
6b2
73
84
Code
Miti
gatio
n Ac
tion
Dist
rict
Core
Act
ivity
Ca
tego
ryD
escr
iptio
n of
Ac
tivity
Enab
ling
Cond
ition
s
Cood
inat
e (5
)
*ESt
art
°N o
r °S
End
RAD
-GRK
Impl
emen
tatio
n Pe
riod
(6)
FORM
2.1
.2a
Core
Act
ivit
y Ca
lcul
atio
n Fo
rm fo
r Agr
icul
ture
Sec
tor i
n Fe
rtili
zing
Sys
tem
Cat
egor
y
SEC
TOR
: AG
RICU
LTU
RE
CATA
GO
RY
:
YEA
R :
REPO
RTER
:
Cent
ral G
over
nmen
t M
inis
try
:
Prov
inci
al G
over
nmen
t Pr
ovin
ce
:
Dis
tric
t/Ci
ty G
over
nmen
t D
istr
ict/
City
:
14TECHNICAL GUIDELINE FOR MONITORING, EVALUATION AND REPORTING (MER) OF RAD-GRK IMPLEMENTATION
9a10
a10
b10
c9b
9c1
9c2
9c3
9d1
9d2
9d3
Type
of
agric
lutra
l lan
dCo
nten
t of C
Wat
er co
nten
tIn
dire
ct E
miss
ion
fact
or o
f N2O
Ar
ea si
ze (h
a)Ty
pe o
f Fer
tilize
rTy
pe o
f Fer
tilize
rPr
e-ac
tivity
Dos
e (k
g)Pr
e-ac
tivity
Dos
e (k
g)Po
st-A
ctiv
ity D
ose
(kg)
Post
-Act
ivity
Dos
e (k
g)
Use
of O
rgan
ic F
ertil
izer (
9c)
Use
of S
ynth
etic
Fer
tilize
r (9
d)
Activ
ity D
ata
(9)
Emiss
ion
Fact
or (1
0)
FORM
2.1
.2a
Core
Act
ivit
y Ca
lcul
atio
n Fo
rm fo
r Agr
icul
ture
Sec
tor i
n Fe
rtili
zing
Sys
tem
Cat
egor
y (C
onti
nued
)
SEC
TOR
: AG
RICU
LTU
RE
CATA
GO
RY
:
YEA
R :
REPO
RTER
:
Cent
ral G
over
nmen
t M
inis
try
:
Prov
inci
al G
over
nmen
t Pr
ovin
ce
:
Dis
tric
t/Ci
ty G
over
nmen
t D
istr
ict/
City
:
15TECHNICAL GUIDELINE
FOR MONITORING, EVALUATION AND REPORTING (MER) OF RAD-GRK IMPLEMENTATION
FORM
2.1
.2a
Core
Act
ivit
y Ca
lcul
atio
n Fo
rm fo
r Agr
icul
ture
Sec
tor i
n Fe
rtili
zing
Sys
tem
Cat
egor
y (C
onti
nued
)
SEC
TOR
: AG
RICU
LTU
RE
CATA
GO
RY
:
YEA
R :
REPO
RTER
:
Cent
ral G
over
nmen
t M
inis
try
:
Prov
inci
al G
over
nmen
t Pr
ovin
ce
:
Dis
tric
t/Ci
ty G
over
nmen
t D
istr
ict/
City
:
1112
a12
b12
c12
d12
e13
Emiss
ion
Redu
ctio
n Ta
rget
in R
AD-G
RK
GHG
Emiss
ion
Redu
ctio
n (1
2)
BAU
Emiss
ion
(tCO
2eq)
Emiss
ion
Redu
ctio
n (tC
O2e
q)
Perc
enta
ge o
f Ac
hiev
emen
t (%
)
Emiss
ion
Afte
r Miti
gatio
n Im
plem
ente
d (tC
O2e
q)
Cum
ulat
ive
Achi
evem
ent
until
The
Repo
rtin
g Ye
ar(tC
O2e
q)
Rem
arks
16TECHNICAL GUIDELINE FOR MONITORING, EVALUATION AND REPORTING (MER) OF RAD-GRK IMPLEMENTATION
Instructions to fill in Form 2.1.2a
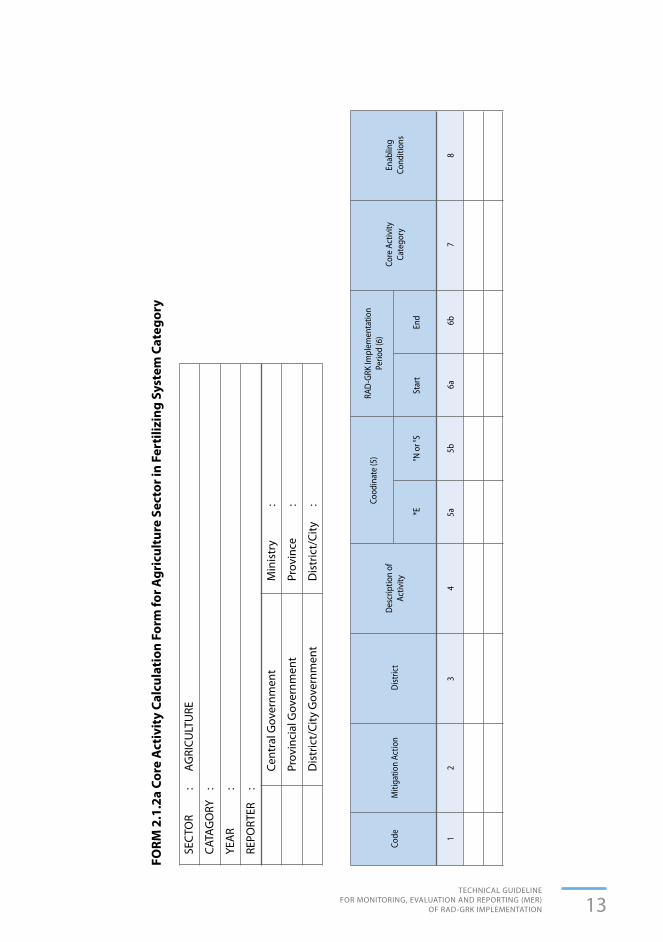
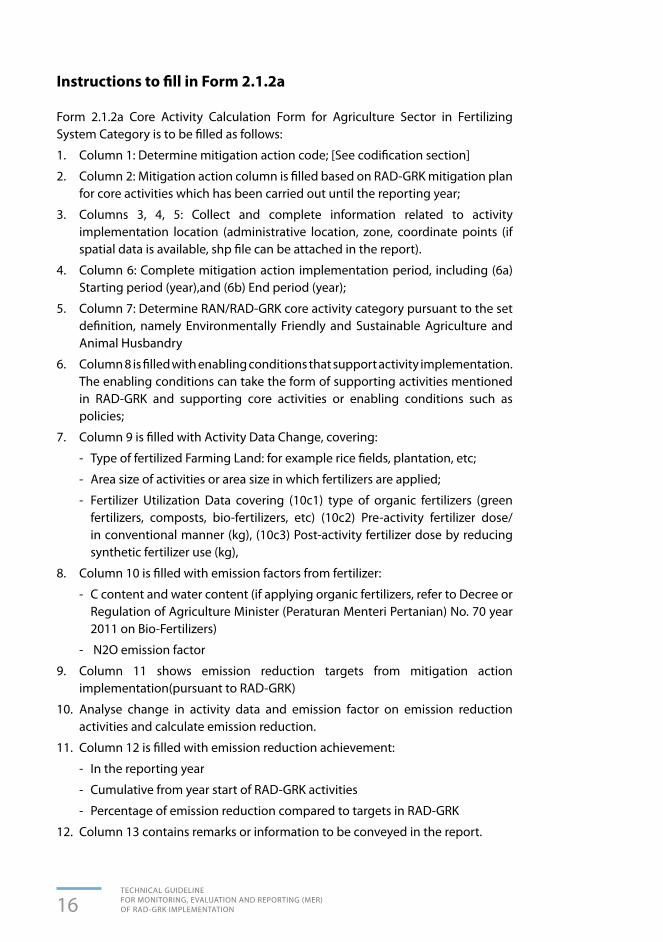
Form 2.1.2a Core Activity Calculation Form for Agriculture Sector in Fertilizing System Category is to be filled as follows:
1. Column 1: Determine mitigation action code; [See codification section]
2. Column 2: Mitigation action column is filled based on RAD-GRK mitigation plan for core activities which has been carried out until the reporting year;
3. Columns 3, 4, 5: Collect and complete information related to activity implementation location (administrative location, zone, coordinate points (if spatial data is available, shp file can be attached in the report).
4. Column 6: Complete mitigation action implementation period, including (6a) Starting period (year),and (6b) End period (year);
5. Column 7: Determine RAN/RAD-GRK core activity category pursuant to the set definition, namely Environmentally Friendly and Sustainable Agriculture and Animal Husbandry
6. Column 8 is filled with enabling conditions that support activity implementation. The enabling conditions can take the form of supporting activities mentioned in RAD-GRK and supporting core activities or enabling conditions such as policies;
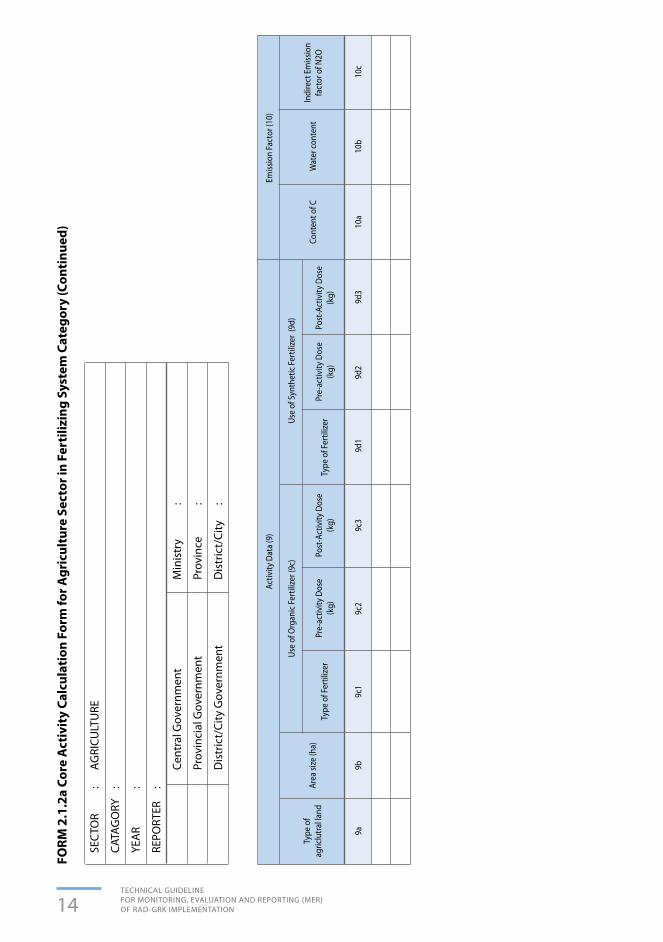
7. Column 9 is filled with Activity Data Change, covering:
- Type of fertilized Farming Land: for example rice fields, plantation, etc;
- Area size of activities or area size in which fertilizers are applied;
- Fertilizer Utilization Data covering (10c1) type of organic fertilizers (green fertilizers, composts, bio-fertilizers, etc) (10c2) Pre-activity fertilizer dose/in conventional manner (kg), (10c3) Post-activity fertilizer dose by reducing synthetic fertilizer use (kg),
8. Column 10 is filled with emission factors from fertilizer:
- C content and water content (if applying organic fertilizers, refer to Decree or Regulation of Agriculture Minister (Peraturan Menteri Pertanian) No. 70 year 2011 on Bio-Fertilizers)
- N2O emission factor
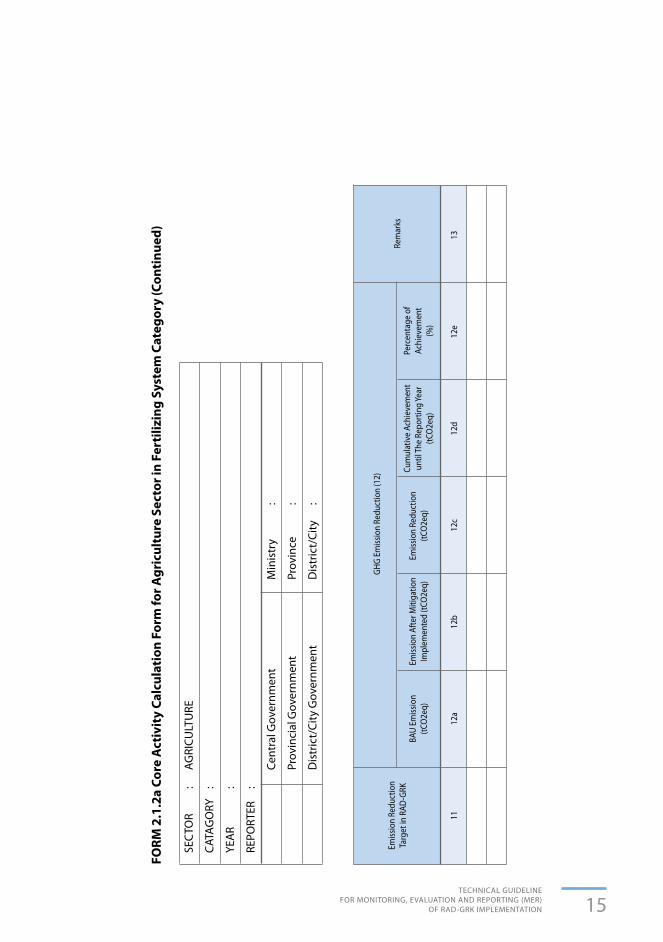
9. Column 11 shows emission reduction targets from mitigation action implementation(pursuant to RAD-GRK)
10. Analyse change in activity data and emission factor on emission reduction activities and calculate emission reduction.
11. Column 12 is filled with emission reduction achievement:
- In the reporting year
- Cumulative from year start of RAD-GRK activities
- Percentage of emission reduction compared to targets in RAD-GRK
12. Column 13 contains remarks or information to be conveyed in the report.

17TECHNICAL GUIDELINE
FOR MONITORING, EVALUATION AND REPORTING (MER) OF RAD-GRK IMPLEMENTATION
Box 2To compare targets with emission reduction results, the activity data and emission factors used must be the same with those used in the development of BAU Baseline of RAD-GRK and those used in PEP of RAD-GRK. Therefore, in the emission reduction calculation, please recheck documentation when RAD-GRK was developed.
Example of Activities
Use of organic fertilizers
Return of organic materials to soil
Optimization of organic and un-organic fertilizers in balanced manner
Urea reduction in plantation of palm oil trees
UPPO (Organic Fertilizer Processing Unit)
Non-burnt straw waste
Description
Use of plant waste or cattle dunk matured (composting process) as organic fertilizers
Use of agricultural waste into organic fertilizers then it is applied to rice fields or dry land/plantation
Balanced use of fertilizers
Reduction in urea dose in palm oil plantation
Installation of agricultural waste treatment to produce organic fertilizers
Optimization of rice straw biomass by returning organic materials into farming lands
Activity Data
Type and number of un-organic fertilizers reduced
Type and number of organic fertilizers used, land area
Type and number of organic fertilizers used. Type and number of un-organic fertilizers reduced
Type and number of un-organic fertilizers reduced
Type and number of organic fertilizers produced (assumption, number produced equal to that applied)
Harvest land area, planted varieties, type of organic materials, plants’ age
Emission Factor
C and water contents
C and water contents
C and N contents
C and N contents
C and water contents
C contents
Table 1. Example of activities in
fertilizing activity group.
18TECHNICAL GUIDELINE FOR MONITORING, EVALUATION AND REPORTING (MER) OF RAD-GRK IMPLEMENTATION
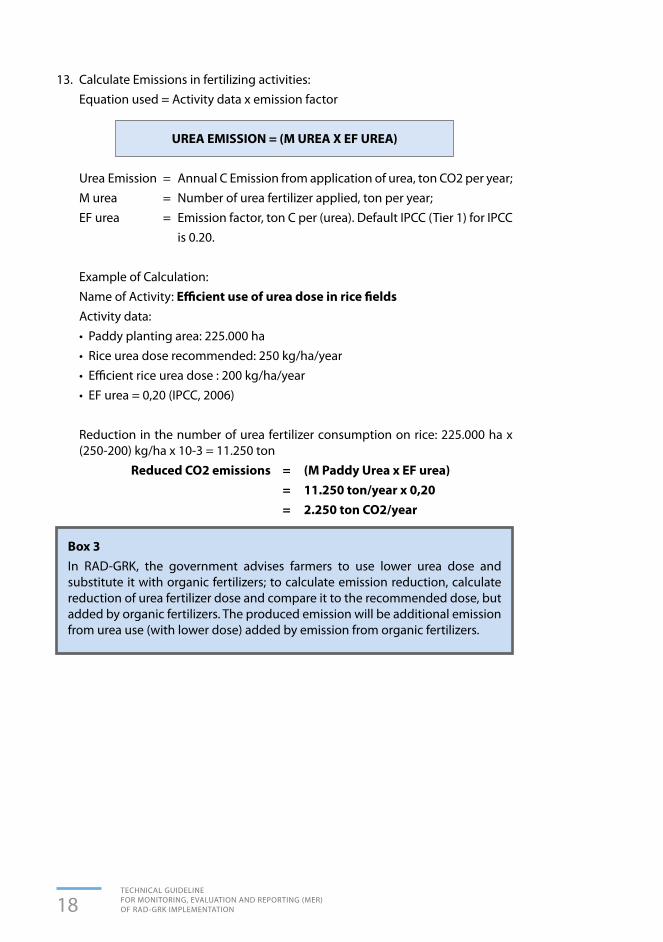
Box 3In RAD-GRK, the government advises farmers to use lower urea dose and substitute it with organic fertilizers; to calculate emission reduction, calculate reduction of urea fertilizer dose and compare it to the recommended dose, but added by organic fertilizers. The produced emission will be additional emission from urea use (with lower dose) added by emission from organic fertilizers.
13. Calculate Emissions in fertilizing activities: Equation used = Activity data x emission factor
UREA EMISSION = (M UREA X EF UREA)
Urea Emission = Annual C Emission from application of urea, ton CO2 per year; M urea = Number of urea fertilizer applied, ton per year; EF urea = Emission factor, ton C per (urea). Default IPCC (Tier 1) for IPCC is 0.20.
Example of Calculation: Name of Activity: Efficient use of urea dose in rice fields Activity data: •Paddyplantingarea:225.000ha •Riceureadoserecommended:250kg/ha/year •Efficientriceureadose:200kg/ha/year •EFurea=0,20(IPCC,2006)
Reduction in the number of urea fertilizer consumption on rice: 225.000 ha x (250-200) kg/ha x 10-3 = 11.250 ton
Reduced CO2 emissions = (M Paddy Urea x EF urea) = 11.250 ton/year x 0,20 = 2.250 ton CO2/year

19TECHNICAL GUIDELINE
FOR MONITORING, EVALUATION AND REPORTING (MER) OF RAD-GRK IMPLEMENTATION
FORM
2.1
.2b
Core
Act
ivit
y Ca
lcul
atio
n Fo
rm fo
r Agr
icul
ture
Sec
tor o
f Ric
e Fi
eld
Cult
ivat
ion
Cate
gory
SEC
TOR
: AG
RICU
LTU
RE
CATA
GO
RY
:
YEA
R :
REPO
RTER
:
Cent
ral G
over
nmen
t M
inis
try
:
Prov
inci
al G
over
nmen
t Pr
ovin
ce
:
Dis
tric
t/Ci
ty G
over
nmen
t D
istr
ict/
City
:
15a
6a5b
6b2
73
84
Code
Miti
gatio
n Ac
tion
Dist
rict
Core
Act
ivity
Ca
tego
ryD
escr
iptio
n of
Ac
tivity
Enab
ling
Cond
ition
s
Cood
inat
e (5
)
*ESt
art
°N o
r °S
End
RAD
-GRK
Impl
emen
tatio
n Pe
riod
(6)

20TECHNICAL GUIDELINE FOR MONITORING, EVALUATION AND REPORTING (MER) OF RAD-GRK IMPLEMENTATION
9a10
a10
b10
c9b
9c1
9c2
9c3
9d1
9d2
9d3
Type
of
agric
lutra
l lan
dCo
nten
t of C
Wat
er co
nten
tIn
dire
ct E
miss
ion
fact
or o
f N2O
Ar
ea si
ze (h
a)Ty
pe o
f Fer
tilize
rTy
pe o
f Fer
tilize
rPr
e-ac
tivity
Dos
e (k
g)Pr
e-ac
tivity
Dos
e (k
g)Po
st-A
ctiv
ity D
ose
(kg)
Post
-Act
ivity
Dos
e (k
g)
Use
of O
rgan
ic F
ertil
izer (
9c)
Use
of S
ynth
etic
Fer
tilize
r (9
d)
Activ
ity D
ata
(9)
Emiss
ion
Fact
or (1
0)
FORM
2.1
.2b
Core
Act
ivit
y Ca
lcul
atio
n Fo
rm fo
r A
gric
ultu
re S
ecto
r of R
ice
Fiel
d Cu
ltiv
atio
n Ca
tego
ry (C
onti
nued
)
SEC
TOR
: AG
RICU
LTU
RE
CATA
GO
RY
:
YEA
R :
REPO
RTER
:
Cent
ral G
over
nmen
t M
inis
try
:
Prov
inci
al G
over
nmen
t Pr
ovin
ce
:
Dis
tric
t/Ci
ty G
over
nmen
t D
istr
ict/
City
:

21TECHNICAL GUIDELINE
FOR MONITORING, EVALUATION AND REPORTING (MER) OF RAD-GRK IMPLEMENTATION
FORM
2.1
.2b
Core
Act
ivit
y Ca
lcul
atio
n Fo
rm fo
r A
gric
ultu
re S
ecto
r of R
ice
Fiel
d Cu
ltiv
atio
n Ca
tego
ry (C
onti
nued
)
SEC
TOR
: AG
RICU
LTU
RE
CATA
GO
RY
:
YEA
R :
REPO
RTER
:
Cent
ral G
over
nmen
t M
inis
try
:
Prov
inci
al G
over
nmen
t Pr
ovin
ce
:
Dis
tric
t/Ci
ty G
over
nmen
t D
istr
ict/
City
:
1112
a12
b12
c12
d12
e13
Emiss
ion
Redu
ctio
n Ta
rget
in R
AD-G
RK
GHG
Emiss
ion
Redu
ctio
n (1
2)
BAU
Emiss
ion
(tCO
2eq)
Emiss
ion
Redu
ctio
n (tC
O2e
q)
Perc
enta
ge o
f Ac
hiev
emen
t (%
)
Emiss
ion
Afte
r Miti
gatio
n Im
plem
ente
d (tC
O2e
q)
Cum
ulat
ive
Achi
evem
ent
until
The
Repo
rtin
g Ye
ar(tC
O2e
q)
Rem
arks

22TECHNICAL GUIDELINE FOR MONITORING, EVALUATION AND REPORTING (MER) OF RAD-GRK IMPLEMENTATION
Instructions to fill in Form 2.1.2b
Steps for numbers 1-8 are similar to those in Core activity Calculation Form for Fertilizing System. The following steps are:
9. Collect activity data related to rice field cultivation, (compare with emission source and activity data used in the BAU Baseline development);
a. Annual harvest area,
b. Type of irrigation,
c. Type of planted plants, plants’ age, production per year;
Note: If spatial data is available, shp file is attached in the report
10. Collect information related to rice field cultivation emission factors, including documentation in the BAU Baseline development.
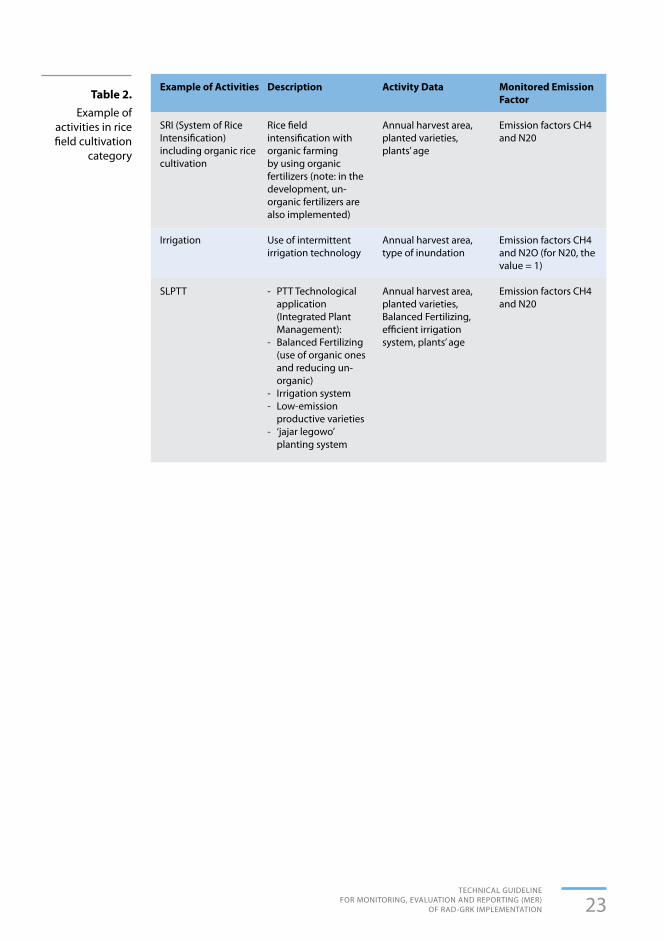
11. Analyze activity data and emission factors which change from Business as usual condition due to activity implementation. Examples of the activities can be seen in Table 2
12. Emission Calculation Method:
Equation used = ACTIVITY DATA X EMISSION FACTOR
For Example: Rice field land area = 60 ha Type of Inundation = intermittent Calculate daily emissions: Emissionrice field cultivation = Activity Data x Emission Factor = Land area x EF ch4 = 60 ha x 160 kg/ha/season x 21 = 201,6 tCO2e
Box 4If other activity data are obtained, for example rice varieties and inundation length; the scaling factor can be added.
23TECHNICAL GUIDELINE
FOR MONITORING, EVALUATION AND REPORTING (MER) OF RAD-GRK IMPLEMENTATION
Example of Activities
SRI (System of Rice Intensification) including organic rice cultivation
Irrigation
SLPTT
Description
Rice field intensification with organic farming by using organic fertilizers (note: in the development, un-organic fertilizers are also implemented)
Use of intermittent irrigation technology
- PTT Technological application (Integrated Plant Management):
- Balanced Fertilizing (use of organic ones and reducing un-organic)
- Irrigation system- Low-emission
productive varieties - ‘jajar legowo’
planting system
Activity Data
Annual harvest area, planted varieties, plants’ age
Annual harvest area, type of inundation
Annual harvest area, planted varieties, Balanced Fertilizing, efficient irrigation system, plants’ age
Monitored Emission Factor
Emission factors CH4 and N20
Emission factors CH4 and N2O (for N20, the value = 1)
Emission factors CH4 and N20
Table 2. Example of
activities in rice field cultivation
category

24TECHNICAL GUIDELINE FOR MONITORING, EVALUATION AND REPORTING (MER) OF RAD-GRK IMPLEMENTATION
FORM
2.1
.2c
Core
Act
ivit
y Ca
lcul
atio
n Fo
rm fo
r Agr
icul
ture
Sec
tor o
f Ani
mal
Hus
band
ry C
ateg
ory
SEC
TOR
: AG
RICU
LTU
RE
CATA
GO
RY
:
YEA
R :
REPO
RTER
:
Cent
ral G
over
nmen
t M
inis
try
:
Prov
inci
al G
over
nmen
t Pr
ovin
ce
:
Dis
tric
t/Ci
ty G
over
nmen
t D
istr
ict/
City
:
15a
6a5b
6b2
73
84
Code
Miti
gatio
n Ac
tion
Dist
rict
Core
Act
ivity
Ca
tego
ryD
escr
iptio
n of
Ac
tivity
Enab
ling
Cond
ition
s
Cood
inat
e (5
)
*ESt
art
°N o
r °S
End
RAD
-GRK
Impl
emen
tatio
n Pe
riod
(6)
25TECHNICAL GUIDELINE
FOR MONITORING, EVALUATION AND REPORTING (MER) OF RAD-GRK IMPLEMENTATION
9a9b
9c9d
9e10
a10
b9d
3
Type
of c
attle
Num
ber o
f cat
tle
Num
ber o
f bio
gas
(uni
t)
Emiss
ion
fact
or C
H4
from
ent
eric
ferm
en-
tatio
n
Volu
me
of b
ioga
s (m
3)
Emiss
ion
fact
or C
H4
from
cattl
e w
aste
tre
atm
ent
Volu
me
of m
anur
e (to
n/ye
ar)
Emiss
ion
fact
or N
2O
from
cattl
e w
aste
tre
atm
ent
Emiss
ion
Fact
or (1
0)Ac
tivity
Dat
a (9
)
FORM
2.1
.2c
Core
Act
ivit
y Ca
lcul
atio
n Fo
rm fo
r Agr
icul
ture
Sec
tor o
f Ani
mal
Hus
band
ry C
ateg
ory
(Con
tinu
ed)
SEC
TOR
: AG
RICU
LTU
RE
CATA
GO
RY
:
YEA
R :
REPO
RTER
:
Cent
ral G
over
nmen
t M
inis
try
:
Prov
inci
al G
over
nmen
t Pr
ovin
ce
:
Dis
tric
t/Ci
ty G
over
nmen
t D
istr
ict/
City
:

26TECHNICAL GUIDELINE FOR MONITORING, EVALUATION AND REPORTING (MER) OF RAD-GRK IMPLEMENTATION
1112
a12
b12
c12
d12
e13
Emiss
ion
Redu
ctio
n Ta
rget
in R
AD-G
RK
GHG
Emiss
ion
Redu
ctio
n (1
2)
BAU
Emiss
ion
(tCO
2eq)
Emiss
ion
Redu
ctio
n (tC
O2e
q)Pe
rcen
tage
of
Achi
evem
ent (
%)
Emiss
ion
afte
r Miti
gatio
n im
plem
ente
d (tC
O2e
q)
Cum
ulat
ive
Achi
evem
ent
until
the
Repo
rtin
g Ye
ar(tC
O2e
q)
Rem
arks
FORM
2.1
.2c
Core
Act
ivit
y Ca
lcul
atio
n Fo
rm fo
r Agr
icul
ture
Sec
tor o
f Ani
mal
Hus
band
ry C
ateg
ory
(Con
tinu
ed)
SEC
TOR
: AG
RICU
LTU
RE
CATA
GO
RY
:
YEA
R :
REPO
RTER
:
Cent
ral G
over
nmen
t M
inis
try
:
Prov
inci
al G
over
nmen
t Pr
ovin
ce
:
Dis
tric
t/Ci
ty G
over
nmen
t D
istr
ict/
City
:
27TECHNICAL GUIDELINE
FOR MONITORING, EVALUATION AND REPORTING (MER) OF RAD-GRK IMPLEMENTATION
Instructions to fill in Form 2.1.2c
Steps for numbers 1-8 are similar to those in Core activity Calculation Form for Fertilizing rice field cultivation. The following steps:
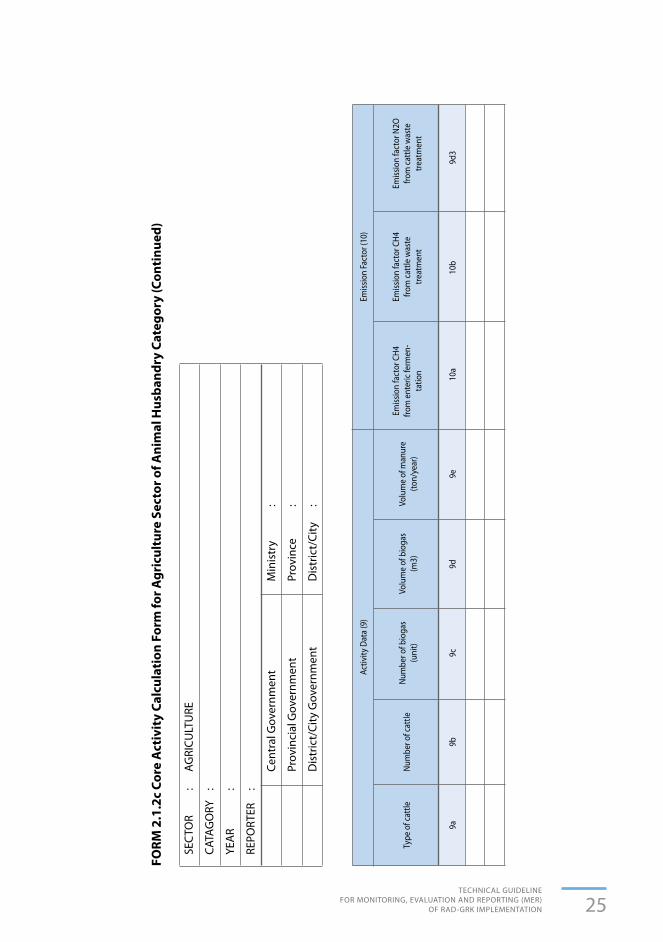
9. Collect information related to cattle management: type and number of cattle;
10. Collect information related to emission factor of cattle management: number of biogas (if available/if number of cattle is not available), volume of biogas, and volume of cattle manure;
11. Collect emission factor data which change from cattle management.
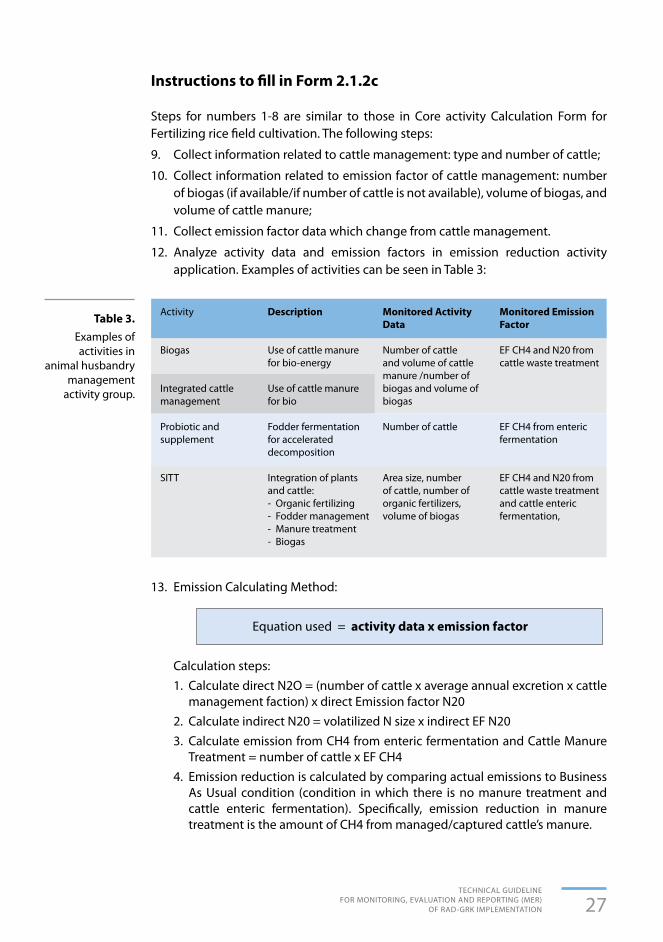
12. Analyze activity data and emission factors in emission reduction activity application. Examples of activities can be seen in Table 3:
13. Emission Calculating Method:
Equation used = activity data x emission factor
Calculation steps: 1. Calculate direct N2O = (number of cattle x average annual excretion x cattle
management faction) x direct Emission factor N20 2. Calculate indirect N20 = volatilized N size x indirect EF N20 3. Calculate emission from CH4 from enteric fermentation and Cattle Manure
Treatment = number of cattle x EF CH4 4. Emission reduction is calculated by comparing actual emissions to Business
As Usual condition (condition in which there is no manure treatment and cattle enteric fermentation). Specifically, emission reduction in manure treatment is the amount of CH4 from managed/captured cattle’s manure.
Table 3. Examples of activities in
animal husbandry management
activity group.
Activity
Biogas
Integrated cattle management
Probiotic and supplement
SITT
Description
Use of cattle manure for bio-energy
Use of cattle manure for bio
Fodder fermentation for accelerated decomposition
Integration of plants and cattle:- Organic fertilizing- Fodder management- Manure treatment- Biogas
Monitored Activity Data
Number of cattle and volume of cattle manure /number of biogas and volume of biogas
Number of cattle
Area size, number of cattle, number of organic fertilizers, volume of biogas
Monitored Emission Factor
EF CH4 and N20 from cattle waste treatment
EF CH4 from enteric fermentation
EF CH4 and N20 from cattle waste treatment and cattle enteric fermentation,

28TECHNICAL GUIDELINE FOR MONITORING, EVALUATION AND REPORTING (MER) OF RAD-GRK IMPLEMENTATION
18a
8b9b
9a9c
2a5a
2b5b
36
47
Code
Dist
rict
Core
act
ivity
su
ppor
ted
Area
Func
tion
or A
PL
Supp
ortin
g Ac
tivity
Ca
tego
ry
Miti
gatio
n Ac
tion
(2)
RAD
-GRK
Im
plem
enta
tion
Perio
d (8
)RA
D-G
RK A
ctiv
ity Ta
rget
(9)
Coor
dina
te(5
)
RAD
ESt
art
Indi
cato
rEn
dQ
uant
ityUn
itLP
JN,
S
FORM
2.1
.3 S
uppo
rtin
g A
ctiv
ity
Form
for A
gric
ultu
re S
ecto
r
SEC
TOR
: AG
RICU
LTU
RE
CATA
GO
RY
: Su
ppor
ting
Activ
ities
YEA
R :
REPO
RTER
:
Cent
ral G
over
nmen
t M
inis
try
:
Prov
inci
al G
over
nmen
t Pr
ovin
ce
:
Dis
tric
t/Ci
ty G
over
nmen
t D
istr
ict/
City
:
29TECHNICAL GUIDELINE
FOR MONITORING, EVALUATION AND REPORTING (MER) OF RAD-GRK IMPLEMENTATION
FORM
2.1
.3 S
uppo
rtin
g A
ctiv
ity
Form
for A
gric
ultu
re S
ecto
r (Co
ntin
ued)
SEC
TOR
: AG
RICU
LTU
RE
CATA
GO
RY
: Su
ppor
ting
Activ
ities
YEA
R :
REPO
RTER
:
Cent
ral G
over
nmen
t M
inis
try
:
Prov
inci
al G
over
nmen
t Pr
ovin
ce
:
Dis
tric
t/Ci
ty G
over
nmen
t D
istr
ict/
City
:
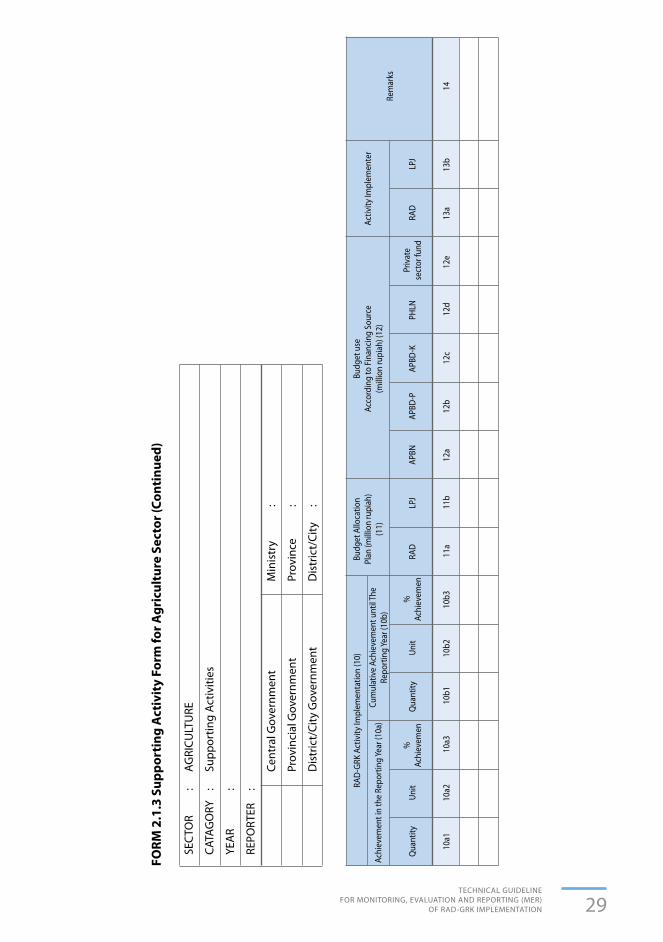
10a1
12a
10b2
12e
10a3
12c
11a
13b
10a2
12b
10b3
13a
10b1
12d
11b
14
Qua
ntity
Unit
APBN
%
Achi
evem
enRA
D
Budg
et A
lloca
tion
Plan
(mill
ion
rupi
ah)
(11)
Activ
ity Im
plem
ente
r
Rem
arks
Budg
et u
seAc
cord
ing
to F
inan
cing
Sou
rce
(mill
ion
rupi
ah) (
12)
APBD
-KRA
DUn
it %
Achi
evem
enAP
BD-P
Priv
ate
sect
or fu
nd
Qua
ntity
LPJ
PHLN
LPJ
Achi
evem
ent i
n th
e Re
port
ing
Year
(10a
)Cu
mul
ativ
e Ac
hiev
emen
t unt
il The
Re
port
ing
Year
(10b
)
RAD
-GRK
Act
ivity
Impl
emen
tatio
n (1
0)

30TECHNICAL GUIDELINE FOR MONITORING, EVALUATION AND REPORTING (MER) OF RAD-GRK IMPLEMENTATION
Instructions to fill in Form 2.1.3
Supporting Activity Form is to be filled in as follows:
1. Column 1: is filled with mitigation action code (see code number for mitigation actions and code number for supporting activities for land-based sector);
2. Column 2: mitigation action column is filled based on mitigation action plans based on RAD-GRK or LPJ implemented until the reporting year. If RAD-GRK actions are mentioned in LPJ, columns 2a and 2b are filled wih the same details.
3. Columns 3,4,5: Collect and complete information related to activity implementation locations (administrative locations, area function /APL, coordinate points (if applicable))
4. Column 6 identifies the relevant core activity which are supported
5. Column 7 complements types of supporting activities based on categories:
(1) Institutional Capacity Building and Quality Improvement;
(2) Research;
(3) Provision of Service Infrastructures and Technology;
(4) Regulation/ Policy Development.
6. Column 8: RAD-GRK activity implementation period
7. Column 9: Determine emission reduction activity targets, including the amount (the target value) and Unit (Unit used)
8. Column 10: overview of achievement of activities implemented in the reporting year and overview of cumulative achievement since activity is commenced. Then, compare them with planned targets
9. Column 11 is filled with budget allocation plan to implement each mitigation action in the reporting year.
10. Column 12 is filled with budget use in the reporting year according to sources (APBN, APBD-P, APBD-K, PHLN, Private Sector fund).
11. Column 13 is filled with relevant institution(s) implementing mitigation action.
12. Column 14 is filled with additional information as necessary.
31TECHNICAL GUIDELINE
FOR MONITORING, EVALUATION AND REPORTING (MER) OF RAD-GRK IMPLEMENTATION
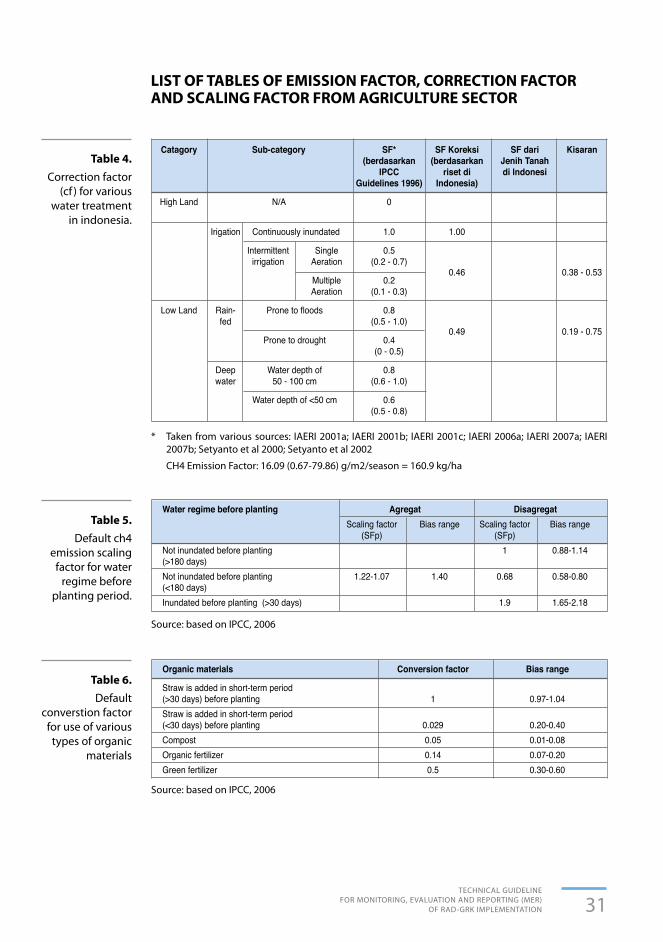
LIST OF TABLES OF EMISSION FACTOR, CORRECTION FACTOR AND SCALING FACTOR FROM AGRICULTURE SECTOR
Catagory Sub-category SF* SF Koreksi SF dari Kisaran (berdasarkan (berdasarkan Jenih Tanah IPCC riset di di Indonesi Guidelines 1996) Indonesia)
High Land N/A 0
Irigation Continuously inundated 1.0 1.00
Intermittent Single 0.5 irrigation Aeration (0.2 - 0.7)
0.46 0.38 - 0.53 Multiple 0.2 Aeration (0.1 - 0.3)
LowLand Rain- Pronetofloods 0.8
0.49 0.19 - 0.75 fed (0.5 - 1.0)
Prone to drought 0.4 (0 - 0.5)
Deep Water depth of 0.8 water 50 - 100 cm (0.6 - 1.0)
Water depth of <50 cm 0.6 (0.5 - 0.8)
Water regime before planting Agregat Disagregat Scaling factor Bias range Scaling factor Bias range (SFp) (SFp)Not inundated before planting 1 0.88-1.14(>180 days)Not inundated before planting 1.22-1.07 1.40 0.68 0.58-0.80(<180 days)Inundated before planting (>30 days) 1.9 1.65-2.18
Organic materials Conversion factor Bias range
Straw is added in short-term period (>30 days) before planting 1 0.97-1.04Straw is added in short-term period (<30 days) before planting 0.029 0.20-0.40Compost 0.05 0.01-0.08Organic fertilizer 0.14 0.07-0.20Green fertilizer 0.5 0.30-0.60
Table 4. Correction factor
(cf ) for various water treatment
in indonesia.
Table 5. Default ch4
emission scaling factor for water
regime before planting period.
Table 6. Default
converstion factor for use of various types of organic
materials
* Taken from various sources: IAERI 2001a; IAERI 2001b; IAERI 2001c; IAERI 2006a; IAERI 2007a; IAERI 2007b; Setyanto et al 2000; Setyanto et al 2002
CH4 Emission Factor: 16.09 (0.67-79.86) g/m2/season = 160.9 kg/ha
Source: based on IPCC, 2006
Source: based on IPCC, 2006

32TECHNICAL GUIDELINE FOR MONITORING, EVALUATION AND REPORTING (MER) OF RAD-GRK IMPLEMENTATION
No Variety Average emissions (kg/ha/season) CF
1 Banyuasin 584.8 2.492 Batanghari 517.8 2.203 Siak Raya 235.2 1.004 Sei Lalan 152.6 0.655 Punggur 144.2 0.616 Indragiri 141.1 0.607 Air Tenggulang 140.0 0.608 Martapura 125.7 0.53
No Variety Average CF No Variety Average CF emissions emissions (kg/ha/season) (kg/ha/season)
1 Gilirang 496.9 2.46 21 Wayrarem 91.6 0.452 Fatmawati 365.9 1.81 22 Maros 73.9 0.373 Aromatic 273.6 1.35 23 Mendawak 255 1.264 Tukad Unda 244.2 1.21 24 Mekongga 234 1.165 IR 72 223.2 1.10 25 Memberamo 286 1.416 Cisadane 204.6 1.01 26 IR42 269 1.337 IR 64** 202.3 1.00 27 Fatmawati 245 1.218 Margasari 187.2 0.93 28 BP360 215 1.069 Cisantana 186.7 0.92 29 BP205 196 0.9710 Tukad Petanu 157.8 0.78 30 Hipa4 197 0.9811 Batang Anai 153.5 0.76 31 Hipa6 219 1.0812 IR 36 147.5 0.73 32 Rokan 308 1.5213 Memberamo 146.2 0.72 33 Hipa 5 Ceva 323 1.6014 Dodokan 145.6 0.72 34 Hipa 6 Jete 301 1.4915 Way Apoburu 145.5 0.72 35 Inpari 1 271 1.3416 Muncul 127.0 0.63 36 Inpari 6 Jete 272 1.3417 Tukad Balian 115.6 0.57 37 Inpari 9 Elo 359 1.7718 Cisanggarung 115.2 0.57 19 Ciherang 114.8 0.57 20 Limboto 99.2 0.49
Table 7. Correction factor (CF) of various varieties of field rice in Indonesia*
Table 8. Correction factor (CF) for various varieties of tidal rice in Indonesia*
* Taken from various sources: IAERI 2004a, IAERI 2003a, IAERI 2003b, IAERI 2002a, IAERI 2002b, IAERI 2002c, IAERI 2001d, IAERI 2001e, IAERI 1999, IAERI 1998a, IAERI 1997, Mulyadi et. al 2004, Setyanto, P 1999; Setyanto, P 2000; Setyanto, P 2004; Setyanto, et al 2008; Setyanto, et al 2000; Suharsih, et al 2004; Husin, Y.A 1994; Konsorsium PI 2009
** Baseline for rice variety is the variety generally planted by farmers in rice fields.
* Taken from various sources: IAERI 2004b; IAERI 2005; IAERI 2006b; IAERI 2006c; IAERI 2007c; IAERI 2007d. Baseline for rice varieties namely the variety generally planted by farmers in tidal rice land.

33TECHNICAL GUIDELINE
FOR MONITORING, EVALUATION AND REPORTING (MER) OF RAD-GRK IMPLEMENTATION
Emission Factor Value Range
From input N to dry land kg N2O-N per N input 0.01 0.003-0.03FrominputNforirrigationfield kgN2O-NperNinput 0.003 0.000-0.006For organic plants and savana in tropical area kg N2O-N per ha 16 5-48For organic forest soil in tropical area kg N2O-N per ha 8 0-24For cows, poultry and pigs kg N2O-N per ha 0.02 0.007-0.06For sheep and other cattle kg N2O-N per ha 0.01 0.003-0.03
Amelioration in peat soil CH4 CO2 N2O kg/ha/day
Control 16.28 53.28 0.00253Dolomite 13.07 48.99 0.00254Zeolit 8.09 17.10 0.00296Steel slag 6.25 24.67 0.00168Straw 6.46 56.76 0.00276Organic fertilizer 14.74 65.96 0.00153Silicate fertilizer 4.20 45.09 0.00220Compost 29.27 57.70 0.00041Organic fertilizer + dolomite 4.92 99.89 Pugam A 3.50 50.09 0.00458Volcanic ash 2.40 23.49 0.00689Fe Fertilizer 3.17 36.51 0.00471NI 3.41 55.54 0.00763
Emission Factor Value Range
From N deposit on soil and water surface kg N2O-N per NH3-N + 0.01 0.002-0.05 NOX-N tervolaltilisasiFrom N deposit on land and water surface kg N2O-N per NH3-N + 0.0075 0.0005-0.025 NOX-N tervolaltilisasiFracGasF volatilization from synthetic fertilizers kg N2O-N per NH3-N + 0.1 0.03-0.3 NOX-N per kg N yang digunakanFracGasF volatilization from all organic N kg N2O-N per NH3-N + 0.2 0.05-0.5fertilizers NOX-N per kg N yang digunakanFracGasF volatilization due to laundering kg N2O-N per NH3-N + 0.3 0.1-0.8 NOX-N per kg N yang digunakan
Table 9. Default N2O emission factor from managed land.
Table 10. Default emission factor for N2O indirectly from volatilization and laundering
Table 11. Emission factor from utilization of amelioran in peat soil converted into rice field.
Default value Urea = 20% from Urea Carbon size (CO(NH2)2) 0.02Source: based on IPCC, 2006
Default value Urea = 20% from Ures Carvon size (CO(NH2)2) 0.02Source: based IPCC, 2006
* Taken from Annual Report IAERI 2007-2011

34TECHNICAL GUIDELINE FOR MONITORING, EVALUATION AND REPORTING (MER) OF RAD-GRK IMPLEMENTATION
Land Use CO2 (kg/ha/day)
New peat opening 70Natural peat 116Plants have yet to produce 77Plants have yet to produce 106Plants produce in 12 years 118Plants produce in 18 years 125
No Type of cattle Emission Factor of Correction factor/ CH4 (kg/cattle/year) K(t)
1 Beef cattle 47 0.722 Dairy cow 61 0.753 Buffalo 55 0.724 Sheep 5 5 Goat 5 6 Pig 1 7 Horse 18
No Cattle manure management system Emission factor for Emission factor for N2O-N direct emission N2O-N indirect emission
1 Savanna - -2 Daily sown 0 0.013 Piled dry 0.02 0.014 Poultry with collecting container 0.01 0.015 Poultry without collecting container 0.01 0.01
No Type of cattle Emission Factor CH4 (kg/ekor/tahun)
1 Beef cattle 12 Dairy cow 313 Buffalo 24 Sheep 0.25 Goat 0.226 Pig 77 Horse 2.198 Native chicken 0.029 Broiler 0.0210 Layer chicken 0.0211 Duck 0.02
Table 12. Peat soil emission factor with palm oil land use.
Table 13. CH4 emission factor from enteric fermentation.
Table 14. CH4 emission factor from cattle manure management.
Table 15. N2O emission factor direclty and indirectly from cattle manure in Indonesia
Reference: Final Report of Balingtan-PPKS-IPB, 2010
Source: based on IPCC 2006
Source: based on IPCC 2006
Source: based on IPCC 2006
35TECHNICAL GUIDELINE
FOR MONITORING, EVALUATION AND REPORTING (MER) OF RAD-GRK IMPLEMENTATION
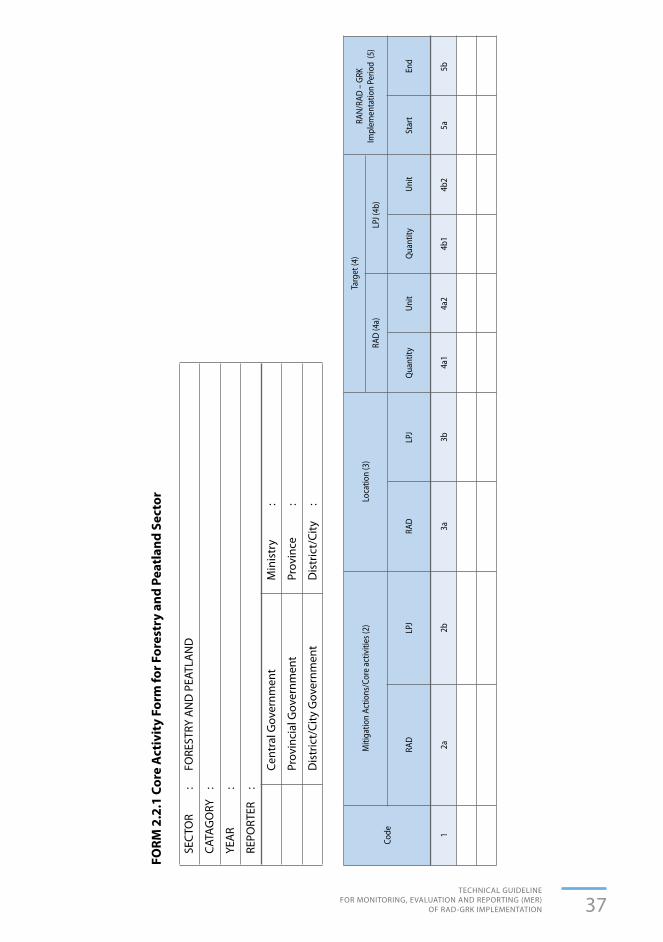
2.2.1 Core Activity Form for Forestry and Peatland Sector
Core Activity Form for Forest and Peatland Sector is used to monitor and evaluate RAD-GRK mitigation actions included in the core activity category. Core activities are the ones with direct impacts on emission reduction and in emission reduction calculation, defined as:- Activity data change compared to BAU scenario, or;- Emission factor change compared to BAU scenario
Activity data in Forestry and Peatland sector is forest/land area in which land use changes occur and result in emissions/ carbon sequestration, while emission factor is the amount of GHG emission or GHG removal from carbon stock change from a land use or land cultivation management system.
Core Activity Form for Forestry and Peatland Sector is categorised as follow:
(a) Avoidance of the Carbon Stock Reducation comprises any activities intended to prevent, avoid and or reduce carbon stock reduction from land cover type with high carbon stock to land cover with low carbon stock. Examples of the activities in this activity category include guarding (prevention and reduction in illegal logging and encroachment), control over land use changes (no land use change from high carbon stock to lower one), as well as protection and prevention of forest fire; in the context of maintaining quantity and quality of forest cover. This category include activities intended to improve and or fix forest governance system and mentain stock carbon stability; including activities such as sustainable forest management (RIL in HPH) and operationaliation of Forest Managemetn Unit (KPH) by improving silviculture system.
(b) Increase in Carbon Stock: is activity category which aims to improve carbon sink through increased quality and quantity of stands. Example of mitigation actions include such activities as: planting in forest area or other use area, forest and land rehabilitation, post-mining land reclamation, mangrove rehabilitation, farming extensification/intensification from land with lower carbon stock.
2.2.2 Calculation Support Form for Forestry and Peatland Sector
Below is Calculation Form for Core activities that serves to support in the evaluation of the MER of RADGRK in terms of the calculation of emission reduction from mitigation actions in the Forestry and Peatland Sector. The Calculation form is categorised as follow:

36TECHNICAL GUIDELINE FOR MONITORING, EVALUATION AND REPORTING (MER) OF RAD-GRK IMPLEMENTATION
2.2.2a Calculation Form for Forestry and Land Use Change in Mineral Land2.2.2b Calculation Form for Forestry and Land Use Change in Peatland.
2.2.3 Supporting Activity Form for Forestry and Peatland Sector
Supporting Activity Form for Forestry and Peatland Sector is used to monitor and evaluate activities in forestry and peatland sector in RAD-GRK which constitute as enabling conditions or which indirectly contribute or important in achieving GHG emission reduction targets.
37TECHNICAL GUIDELINE
FOR MONITORING, EVALUATION AND REPORTING (MER) OF RAD-GRK IMPLEMENTATION
12a
2b3a
3b4a
14b
15a
4a2
4b2
5b
Code
RAD
LPJ
RAD
LPJ
Qua
ntity
Qua
ntity
Star
tUn
itUn
itEn
d
Miti
gatio
n Ac
tions
/Cor
e ac
tiviti
es (2
)Lo
catio
n (3
)Ta
rget
(4)
RAD
(4a)
LPJ (
4b)
RAN/
RAD
– GR
K Im
plem
enta
tion
Perio
d (5
)
FORM
2.2
.1 C
ore
Act
ivit
y Fo
rm fo
r For
estr
y an
d Pe
atla
nd S
ecto
r
SEC
TOR
: FO
REST
RY A
ND
PEA
TLA
ND
CATA
GO
RY
:
YEA
R :
REPO
RTER
:
Cent
ral G
over
nmen
t M
inis
try
:
Prov
inci
al G
over
nmen
t Pr
ovin
ce
:
Dis
tric
t/Ci
ty G
over
nmen
t D
istr
ict/
City
:

38TECHNICAL GUIDELINE FOR MONITORING, EVALUATION AND REPORTING (MER) OF RAD-GRK IMPLEMENTATION
6a7a
8a6b
7b8b
6c7c
8c6d
7d6e
7e6f
7f
APBN
APBN
APBD
-PAP
BD-P
APBD
-KAP
BD-K
PHLN
PHLN
Priv
ate
sect
or fu
ndPr
ivat
e se
ctor
fund
Qua
ntity
Qua
ntity
Det
ails
Qua
ntity
Unit
Budg
et A
lloca
tion
Plan
bas
ed o
n So
urce
s (m
illio
n Ru
piah
) (6)
Budg
et U
se b
ased
on
sour
ces
(mill
ion
Rupi
ah)(7
)Ke
y pe
rform
ance
indi
cato
r (8
)
FORM
2.2
.1 C
ore
Act
ivit
y Fo
rm fo
r For
estr
y an
d Pe
atla
nd S
ecto
r (Co
ntin
ued)
SEC
TOR
: FO
REST
RY A
ND
PEA
TLA
ND
CATA
GO
RY
:
YEA
R :
REPO
RTER
:
Cent
ral G
over
nmen
t M
inis
try
:
Prov
inci
al G
over
nmen
t Pr
ovin
ce
:
Dis
tric
t/Ci
ty G
over
nmen
t D
istr
ict/
City
:
39TECHNICAL GUIDELINE
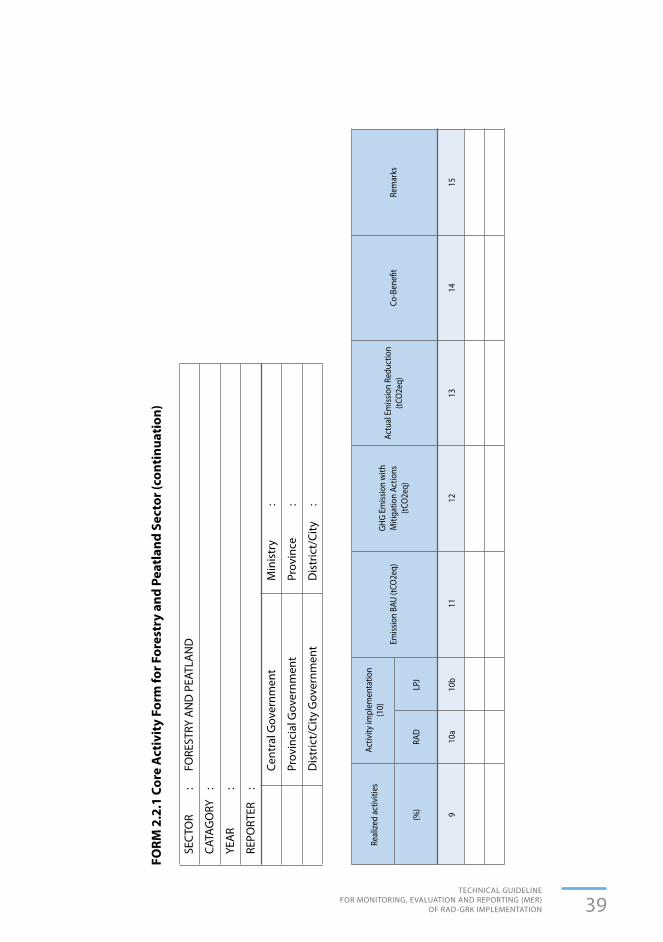
FOR MONITORING, EVALUATION AND REPORTING (MER) OF RAD-GRK IMPLEMENTATION
FORM
2.2
.1 C
ore
Act
ivit
y Fo
rm fo
r For
estr
y an
d Pe
atla
nd S
ecto
r (co
ntin
uati
on)
SEC
TOR
: FO
REST
RY A
ND
PEA
TLA
ND
CATA
GO
RY
:
YEA
R :
REPO
RTER
:
Cent
ral G
over
nmen
t M
inis
try
:
Prov
inci
al G
over
nmen
t Pr
ovin
ce
:
Dis
tric
t/Ci
ty G
over
nmen
t D
istr
ict/
City
:
910
a10
b11
1213
1415
(%)
Real
ized
activ
ities
Activ
ity im
plem
enta
tion
(10)
Emiss
ion
BAU
(tCO
2eq)
GHG
Emiss
ion
with
M
itiga
tion
Actio
ns
(tCO
2eq)
Actu
al E
miss
ion
Redu
ctio
n (tC
O2e
q)Re
mar
ksCo
-Ben
efit
RAD
LPJ
40TECHNICAL GUIDELINE FOR MONITORING, EVALUATION AND REPORTING (MER) OF RAD-GRK IMPLEMENTATION
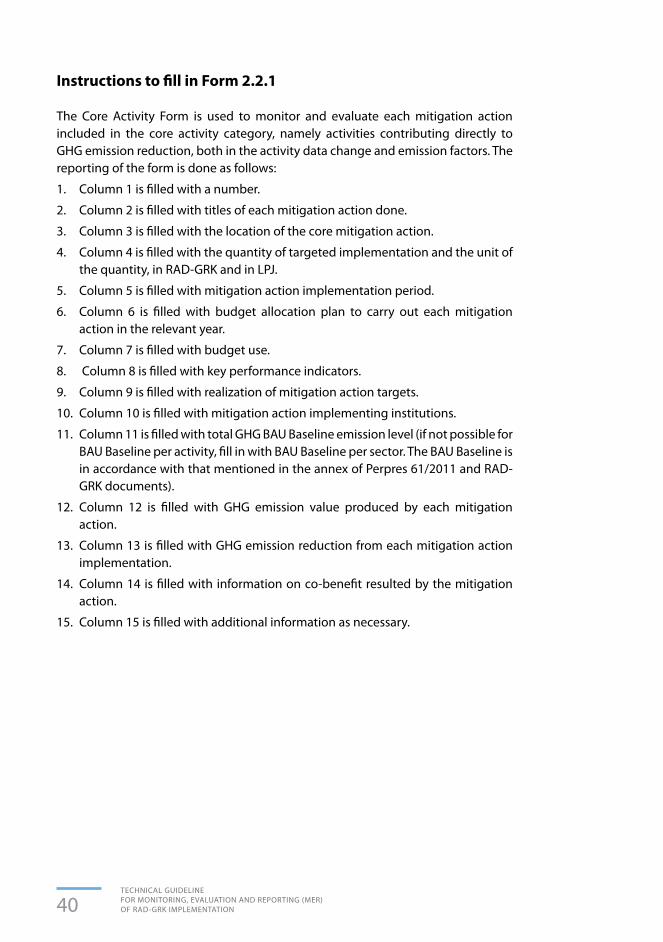
Instructions to fill in Form 2.2.1
The Core Activity Form is used to monitor and evaluate each mitigation action included in the core activity category, namely activities contributing directly to GHG emission reduction, both in the activity data change and emission factors. The reporting of the form is done as follows:
1. Column 1 is filled with a number.
2. Column 2 is filled with titles of each mitigation action done.
3. Column 3 is filled with the location of the core mitigation action.
4. Column 4 is filled with the quantity of targeted implementation and the unit of the quantity, in RAD-GRK and in LPJ.
5. Column 5 is filled with mitigation action implementation period.
6. Column 6 is filled with budget allocation plan to carry out each mitigation action in the relevant year.
7. Column 7 is filled with budget use.
8. Column 8 is filled with key performance indicators.
9. Column 9 is filled with realization of mitigation action targets.
10. Column 10 is filled with mitigation action implementing institutions.
11. Column 11 is filled with total GHG BAU Baseline emission level (if not possible for BAU Baseline per activity, fill in with BAU Baseline per sector. The BAU Baseline is in accordance with that mentioned in the annex of Perpres 61/2011 and RAD-GRK documents).
12. Column 12 is filled with GHG emission value produced by each mitigation action.
13. Column 13 is filled with GHG emission reduction from each mitigation action implementation.
14. Column 14 is filled with information on co-benefit resulted by the mitigation action.
15. Column 15 is filled with additional information as necessary.

41TECHNICAL GUIDELINE
FOR MONITORING, EVALUATION AND REPORTING (MER) OF RAD-GRK IMPLEMENTATION
FORM
2.2
.2a
Calc
ulat
ion
Form
for F
ores
try
and
land
Use
Cha
nge
in M
iner
al L
and
SEC
TOR
: FO
REST
RY A
ND
PEA
TLA
ND
CATA
GO
RY
:
YEA
R :
REPO
RTER
:
Cent
ral G
over
nmen
t M
inis
try
:
Prov
inci
al G
over
nmen
t Pr
ovin
ce
:
Dis
tric
t/Ci
ty G
over
nmen
t D
istr
ict/
City
:
4a5a
4b5b
12
63
Miti
gatio
nAc
tion
Dist
rict
Area
Func
tion/
APL
Enab
ling
cond
ition
Coor
dina
te (4
)
0 ESt
art
0 N, 0 S
End
RAD
– GR
K Im
plem
enta
tion
Perio
d(6
)

42TECHNICAL GUIDELINE FOR MONITORING, EVALUATION AND REPORTING (MER) OF RAD-GRK IMPLEMENTATION
7a1
8a7b
18c
7c1
9b10
7a2
8b7b
29a
7c2
9c
Initi
al C
ondi
tion)
(7a)
Activ
ity D
ata
(7)
Carb
on S
tock
in la
nd co
ver t
ype
(ton
C/ha
) (8
)BA
U RA
D-G
RK (7
b)Ac
hiev
emen
t in
the
Repo
rtin
g Ye
ar (
7c)
GHG
Emiss
ion
Redu
ctio
n (1
5)
Land
cate
gory
fo
r pla
nned
la
nd u
se
Type
of a
ctua
l La
nd U
seAr
ea(H
A)Ar
ea(H
A)Ty
pe o
f Ini
tial
Land
Use
Star
tch
ieve
men
ts
of th
e Re
port
ing
Year
Emiss
ion
Afte
rM
itiga
tion
(tCO
2eq)
Rem
arks
Area
(Ha)
BAU
Emiss
ion
BAU
(tCO
2eq)
Emiss
ion
Redu
ctio
n (tC
O2e
q)
FORM
2.2
.2a
Calc
ulat
ion
Form
for F
ores
try
and
Land
Use
Cha
nge
in M
iner
al L
and
(Con
tinu
ed)
Seco
nd s
ectio
n: A
void
ance
of R
educ
tion
of C
arbo
n St
ock
Cate
gory

43TECHNICAL GUIDELINE
FOR MONITORING, EVALUATION AND REPORTING (MER) OF RAD-GRK IMPLEMENTATION
FORM
2.2
.2a
Calc
ulat
ion
Form
for F
ores
try
and
Land
Use
Cha
nge
in M
iner
al L
and
(Con
tinu
ed)
Seco
nd s
ectio
n: A
void
ance
of R
educ
tion
of C
arbo
n St
ock
Cate
gory
7a1
7a3
7a5
97a
27a
77a
48
7a6
Capa
ian
Pada
Tahu
n Pe
lapo
ran(
7)
Type
of t
rees
Num
ber o
f tre
es/h
a1Pl
antin
g ar
ea
(ha)
Carb
on st
ock
in p
revi
ous l
and
cove
r (to
n C/
ha/y
ear)
Type
of I
nitia
l La
nd U
seAn
nual
Ave
rage
Car
bon
Sink
(to
n C/
ha/y
ear)
Rem
arks
Type
of
plan
ned
land
us
e
Carb
on si
nk in
repo
rtin
g ye
ar
(tCO
2eq)

44TECHNICAL GUIDELINE FOR MONITORING, EVALUATION AND REPORTING (MER) OF RAD-GRK IMPLEMENTATION
Instructions to fill in Form 2.2.2a
Calculation Form is developed with the following colours:
Yellow Data needs to be filled in by user
Red Constant value (user do not need to fill in; data is available or determined/recommended)
Green Automatic calculation (will calculate automatically, user do not need to fill in)
Blue Optional, if data available
The GHG emission reduction calculation Form for forestry and peatland sector group is filled in with the following step:
A. Columns 1 until 6 is the sections with general explanation/details of mitigation action
1. Mitigation action column is filled in based on mitigation action plans in RAD-GRK implemented until the reporting year =column 1 ;
2. Collect and complete information related to activity implementation location (administrative location, area/zone, coordinate points (position of degree of °E as well as °N or °S; if spatial data is available, shp file is attached in the report) = columns 2,3,4.
3. Complete mitigation action implementation period = column 5
For example:
Forest rehabilitation is planned for 10 years starting from 2010 to 2020
4. Identify activities/enabling conditions for core activity. Enabling conditions can be a supporting activity(ies) which have indirect impact on GHG emission reduction, and serve to facilitate the implementation of core activity or serve as conditions which will enable the implementation of core activity = column 6.
B. The following columns explain changes in activity data as a result of mitigation action
1. Category of Avoidance of Reduction of Carbon Stock (PPCK)
a. Identify changes in activity data as a result of mitigation action, in which the changes are measures in the unit of area size, with the following explanation:
• Identificationofinitiallanduse(7a):Typeoflandusetobeintervenedin zone/APL

45TECHNICAL GUIDELINE
FOR MONITORING, EVALUATION AND REPORTING (MER) OF RAD-GRK IMPLEMENTATION
• IdentificationofBusinessasusuallanduse(7b):typeoflandusethatis expected if mitigation is not carried out
• Identificationofactuallanduseinreportingyear(7c):typeoflandusebecause of mitigation actions, which result in changes of BAU land use.
b. Carbon stock on each type of land use (column 8) will be automatically filled in. The carbon stock uses the value recommended by the Working Group on Climate Change of RAN-RADGRK.
c. Emission Reduction (column 9) in PPCK category explains the total of carbon stock that can be retained with mitigation actions. The equation is as follow:
d. Remarks column (column 10) is to be filled with additional information relating to changes of activity data or if provincial working group wants to use local emission factor and data..
2. Category Enhancement of Carbon Stock
a. Identifying change in activity data resulted from mitigation action whose change is explained in unit of area size; with the following explanation:
- Initial Land Use Type (7a1): Targeted Land Use Type as targets from mitigation actions;
- Land use type is expeted to be formed by planting activities and achieved in the reporting year (7a2): Land use type occurs due to implementation of mitigation actions resulting in the change in the initial land use type;
- Type of planted trees (7a3) can be included if data is available;
- Planting area (7a4) is the land cover width formed in the reporting year following the planting activities;
- Number of trees (7a5) describes the number of planted trees (if data is available). In relations to the planting area column (7a4), if the available data is the number of trees, the used assumption is 1 ha of planting = 1000 units of trees;
- Average annual removal (7a7) is average carbon removal per ha of planting. The data has been recommended by the RAN-RAD GRK National Working Group. The local data can be used if regions use more detailed data and in accordance with the methodologies recommended by the National Working Group.
Emission reduction = (Area Width without Mitigation- Area Width with mitigation action) x (Carbon Stock in without mitigation condition-Carbon stock with mitigation action)

46TECHNICAL GUIDELINE FOR MONITORING, EVALUATION AND REPORTING (MER) OF RAD-GRK IMPLEMENTATION
b. Expected carbon sink in the reporting year (column 8) will be automatically filled out according to recommendations Technical Working Group of RAN-RAD GRK. The equation used is:
c. In column 9 include remarks or other information needed to mention as related to the reporting.
Equation of estimation of carbon stock change/removal from land use change is:
EMISSION/REMOVAL = ACTIVITY DATA X EMISSION FACTOR
Activity data = area per each land use change in the monitoring year (ha/year)
Emission factor = average carbon stock in changed land cover (for mineral soil)
Emission reduction = change in number of carbon stock from land cover class before mitigation action to land cover class planned in mitigation action
Box 4Notes for plantation (for example palm oil or rubber)• Inmineralland,missingCarbonStockduetolandusechange,forexample
from forest into palm oil, is monitored in Core Activity Calculation Form for Forestry and land use Change in mineral land;
• Inmineralland,emissionscausedbypalmoilfertilizingismonitoredinCoreactivity Calculation Form for Agriculture of Fertilizing Category;
• Inpeatland,bothemissionfromlandusechangeanddrainageandpalmoilfertilizing is monitored in Calculation Form for Forestry and Land Use Change in Peatland and Fertilizing in Peatland;
Emissions coming from palm oil processing plants are put into industrial sector group, instead of land-based sector group
Emission Reduction = (Planting Area width) x (Carbon stock in initial land use type – Expected average carbon sink in land use type with mitigation actions)

47TECHNICAL GUIDELINE
FOR MONITORING, EVALUATION AND REPORTING (MER) OF RAD-GRK IMPLEMENTATION
FORM
2.2
.2b
Calc
ulat
ion
Form
for F
ores
try
and
Land
Use
Cha
nge
in P
eatl
and
SEC
TOR
: FO
REST
RY A
ND
PEA
TLA
ND
CATA
GO
RY
: Fo
rest
ry a
nd L
and
Use
Cha
nge
in P
eatla
nd
YEA
R :
REPO
RTER
:
Cent
ral G
over
nmen
t M
inis
try
:
Prov
inci
al G
over
nmen
t Pr
ovin
ce
:
Dis
tric
t/Ci
ty G
over
nmen
t D
istr
ict/
City
:
15a
6a5b
6b2
37
4
NoM
itiga
tion
Actio
nDi
stric
tAr
ea Fu
nctio
n /A
PLEn
ablin
g co
nditi
ons
Coor
dina
te (5
)
0 ESt
art
0 N, 0 S
End
RAD
- GRK
Im
plem
enta
tion
Perio
d(6
)

48TECHNICAL GUIDELINE FOR MONITORING, EVALUATION AND REPORTING (MER) OF RAD-GRK IMPLEMENTATION
FORM
2.2
.2b
Calc
ulat
ion
Form
for F
ores
try
and
Land
Use
Cha
nge
in P
eatl
and
(Con
tinu
ed)
Seco
nd s
ectio
n: Id
entifi
catio
n of
cha
nges
in a
ctiv
ity d
ata
afte
r the
impl
emen
tatio
n of
miti
gatio
n ac
tion
8b1
8a1
8c1
8b2
8b3
8a2
8a3
8c2
8c3
Activ
ity D
ata
(11)
Initi
al C
ondi
tion
(8a)
BAU
RAD
- GRK
(8b)
Achi
evem
ent i
n th
e Re
port
ing
Year
(8c)
Type
of I
nitia
l La
nd U
seTy
pe o
f nex
t La
nd U
seTy
pe o
f act
ual
land
use
Area
(Ha)
Drai
nage
(c
m)
Drai
nage
(cm
)Dr
aing
se(c
m)
Area
(Ha)
Area
(Ha)

49TECHNICAL GUIDELINE
FOR MONITORING, EVALUATION AND REPORTING (MER) OF RAD-GRK IMPLEMENTATION
9a1
9b1
10b
9a2
9b2
9a3
9b3
10a
Star
tSt
art
Peat
land
Em
issio
ns (1
2a)
Carb
on S
ink/
Emiss
ion
in th
e Re
port
ing
year
(ton
C/h
a/ye
ar)
(9b)
Emiss
ion
Fact
or (
9)
Plan
ting
Data
(10)
BAU
BAU
Num
ber o
f tre
es/h
aTy
pe o
f tre
esAc
hiev
emen
t of
the
Repo
rtin
g Ye
ar
Annu
al a
vera
ge
carb
on si
nk (t
on C
/ha
/yea
r)2
FORM
2.2
.2b
Calc
ulat
ion
Form
for F
ores
try
and
Land
Use
Cha
nge
in P
eatl
and
(Con
tinu
ed)
Third
sec
tion:
Cha
nges
in E
mis
sion
Fac
tor a
nd C
arbo
n Si
nk

50TECHNICAL GUIDELINE FOR MONITORING, EVALUATION AND REPORTING (MER) OF RAD-GRK IMPLEMENTATION
11a
11b
11c
12
GHG
emiss
ion
Redu
ctio
n in
tCO
2eq
(11)
Tota
l Em
issio
n Re
duct
ion
(tCO
2eq)
Peat
land
em
issio
n af
ter
miti
gatio
n (tC
O2e
q)Ca
rbon
sink
(tC
O2e
q)
Rem
arks
FORM
2.2
.2b
Calc
ulat
ion
Form
for F
ores
try
and
Land
Use
Cha
nge
in P
eatl
and
(Con
tinu
ed)
Four
th s
ectio
n: T
he re
sult
of E
mis
sion
Red
uctio
n ca
lcul
atio
n

51TECHNICAL GUIDELINE
FOR MONITORING, EVALUATION AND REPORTING (MER) OF RAD-GRK IMPLEMENTATION
Instructions to fill in Form 2.2.2b
The filling-in of supporting activity monitoring Form for forestry and peatland sector is as follows:
A. Columns 1 to 6 are parts that contain narrative/ general information on mitigation action
1. Mitigation action column is filled in based on mitigation action plans in RAD-GRK implemented until the reporting year =column 2 ;
2. Collect and complete information related to activity implementation location (administrative location, forest area/land use area, coordinate points (position of degree of °E as well as °N or °S); if spatial data is available, file shp is attached in the report) = columns 3,4 and 5.
3. Complete mitigation action implementationperiod = column 6.
4. Identify enabling conditions for core activity. Enabling conditions can be a supporting activity (ties) which indirectly reduces emission as part of core activities, as well as policies or enabiling conditions for implementation of core activities = column 7.
B. The following columns constitute parts that explain changes in activity data as results of implemented mitigation actions:
1. Identify changes in activity data as result of mitigation actions, in which the changes are explained in unit of area size; with the following explanation:
- Type of Initial Land Use (8a): Type of Land Use intended as targets of mitigation actions.
- Type of Business as usual Land Use (8b): type of land use occurs if mitigation actions are not implemented in target land use type.
- Type of achieved land use in the reporting year (8c): Type of land use resulted from implementation of migiation actions resulting in changes of BAU land use type.
- For land use change, emission calculation in peatland is assumed based on the drainage depth (8 a,b,c 3). In the MER of RAD GRK, drainage assumption has been recommended and will be fitted to supplementary guideline of IPCC 2006 for peatland.
Users only need to identify changes in activity data width on the target land use type after migiation action implementation.
2. Emission factors and stock carbon in each type of land use (kolom 9) will be automatically filled out according to recommendation from RAN-RAD GRK Tehnical Working Group.
3. The planting data (column 10) is filled in with types and number of trees if data is available. If the number of planted trees has been informed while the planting area is unknown, the planting area is assumed based on the assumption 1 ha=1000 units of trees.
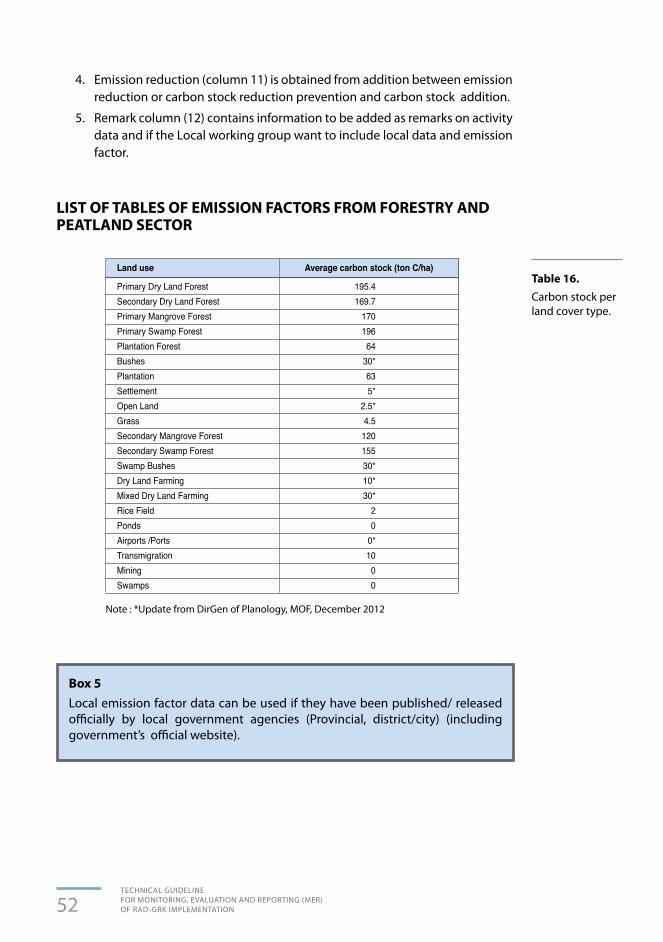
52TECHNICAL GUIDELINE FOR MONITORING, EVALUATION AND REPORTING (MER) OF RAD-GRK IMPLEMENTATION
4. Emission reduction (column 11) is obtained from addition between emission reduction or carbon stock reduction prevention and carbon stock addition.
5. Remark column (12) contains information to be added as remarks on activity data and if the Local working group want to include local data and emission factor.
LIST OF TABLES OF EMISSION FACTORS FROM FORESTRY AND PEATLAND SECTOR
Land use Average carbon stock (ton C/ha)
Primary Dry Land Forest 195.4Secondary Dry Land Forest 169.7Primary Mangrove Forest 170Primary Swamp Forest 196Plantation Forest 64Bushes 30*Plantation 63Settlement 5*Open Land 2.5*Grass 4.5Secondary Mangrove Forest 120Secondary Swamp Forest 155Swamp Bushes 30*Dry Land Farming 10*Mixed Dry Land Farming 30*Rice Field 2Ponds 0Airports /Ports 0*Transmigration 10Mining 0Swamps 0
Table 16. Carbon stock per land cover type.
Note : *Update from DirGen of Planology, MOF, December 2012
Box 5 Local emission factor data can be used if they have been published/ released officially by local government agencies (Provincial, district/city) (including government’s official website).

53TECHNICAL GUIDELINE
FOR MONITORING, EVALUATION AND REPORTING (MER) OF RAD-GRK IMPLEMENTATION
LAND USE Assumed drainage depth (cm) CO2 Emission (t/ha/year)
Primary peat forest 0 0Logged-over peat forest 30 19Community rubber 50 32Palm oil 60 38HTI ((Industrial Forest Plantation) 50 32Mixed crops/ Agro-forestry 50 32Peat Bush 30 19Seasonal crop 30 19Settlement 70 45Grass/ferns 30 19Ricefields 10 6Mining 100 64
Table 17. Emission
factor from decomposed
peat.
Notes:
Emissions t CO2/ha/year = drainage depth (cm) * 0.91 (according to Hooijer 2006, 2010)
Modification for root respiration correction: ~30% (according to Fahmudin, et al. 2010)
Emission t CO2/ha/year = 0.7 * drainage depth (cm) * 0.91 (according to Hooijer 2006, 2010)
Source: Fahmuddin et al, 2013
Box 6Land use class adjustment:1. City forest can take the form of plants forest/ secondary forest, depending on: a. Land covers b. Vegetation type 2. HKm (community forest) and Village Forest or social forestry generally in
secondary forest or in primary forest which provide the community with the right for cultivation; or it can take the form of agro-forestry in degraded forests
3. People’s forest and People Plantation Forest generally take the form of plantation forest.
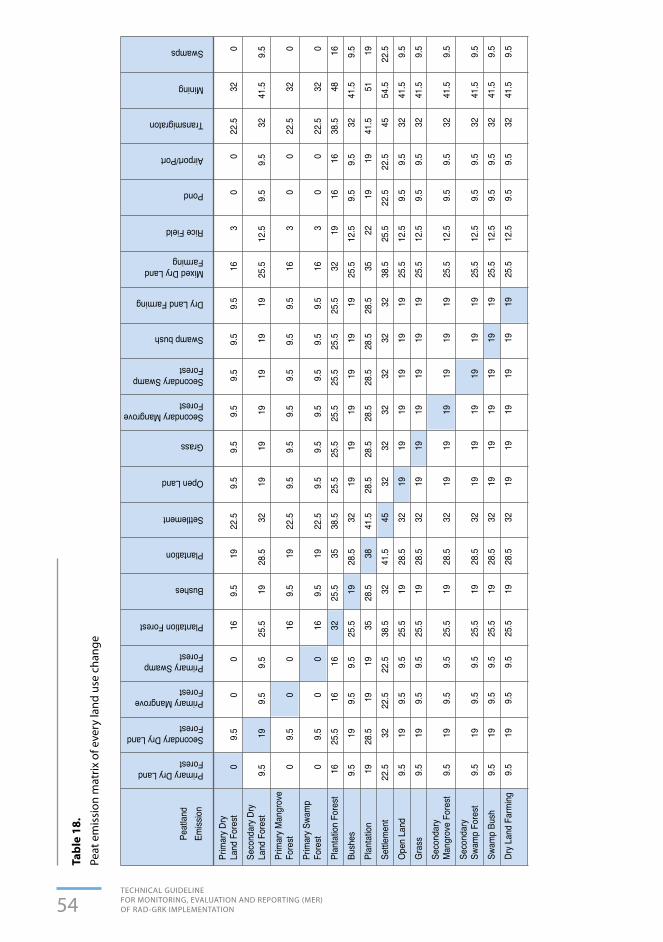
54TECHNICAL GUIDELINE FOR MONITORING, EVALUATION AND REPORTING (MER) OF RAD-GRK IMPLEMENTATION
Prim
ary D
ry
Land
For
est
0 9.
5 0
0 16
9.
5 19
22
.5
9.5
9.5
9.5
9.5
9.5
9.5
16
3 0
0 22
.5
32
0
Seco
ndar
y Dry
La
nd F
ores
t 9.
5 19
9.
5 9.
5 25
.5
19
28.5
32
19
19
19
19
19
19
25
.5
12.5
9.
5 9.
5 32
41
.5
9.5
Prim
ary M
angr
ove
Fore
st 0
9.5
0 0
16
9.5
19
22.5
9.
5 9.
5 9.
5 9.
5 9.
5 9.
5 16
3
0 0
22.5
32
0
Prim
ary S
wam
p Fo
rest
0 9.
5 0
0 16
9.
5 19
22
.5
9.5
9.5
9.5
9.5
9.5
9.5
16
3 0
0 22
.5
32
0
Plan
tatio
n Fo
rest
16
25.5
16
16
32
25
.5
35
38.5
25
.5
25.5
25
.5
25.5
25
.5
25.5
32
19
16
16
38
.5
48
16
Bush
es
9.5
19
9.5
9.5
25.5
19
28
.5
32
19
19
19
19
19
19
25.5
12
.5
9.5
9.5
32
41.5
9.
5
Plan
tatio
n 19
28
.5
19
19
35
28.5
38
41
.5
28.5
28
.5
28.5
28
.5
28.5
28
.5
35
22
19
19
41.5
51
19
Settle
men
t 22
.5
32
22.5
22
.5
38.5
32
41
.5
45
32
32
32
32
32
32
38.5
25
.5
22.5
22
.5
45
54.5
22
.5
Open
Lan
d 9.
5 19
9.
5 9.
5 25
.5
19
28.5
32
19
19
19
19
19
19
25
.5
12.5
9.
5 9.
5 32
41
.5
9.5
Gras
s 9.
5 19
9.
5 9.
5 25
.5
19
28.5
32
19
19
19
19
19
19
25
.5
12.5
9.
5 9.
5 32
41
.5
9.5
Seco
ndar
y M
angr
ove
Fore
st 9.
5 19
9.
5 9.
5 25
.5
19
28.5
32
19
19
19
19
19
19
25
.5
12.5
9.
5 9.
5 32
41
.5
9.5
Seco
ndar
y Sw
amp
Fore
st 9.
5 19
9.
5 9.
5 25
.5
19
28.5
32
19
19
19
19
19
19
25
.5
12.5
9.
5 9.
5 32
41
.5
9.5
Swam
p Bu
sh
9.5
19
9.5
9.5
25.5
19
28
.5
32
19
19
19
19
19
19
25.5
12
.5
9.5
9.5
32
41.5
9.
5
Dry L
and
Farm
ing
9.5
19
9.5
9.5
25.5
19
28
.5
32
19
19
19
19
19
19
25.5
12
.5
9.5
9.5
32
41.5
9.
5
Peat
land
Emiss
ion
Primary Dry Land Forest
Secondary Dry Land Forest
Primary Mangrove Forest
Primary Swamp Forest
Plantation Forest
Bushes
Plantation
Settlement
Open Land
Grass
Secondary Mangrove Forest
Secondary Swamp Forest
Swamp bush
Dry Land Farming
Mixed Dry Land Farming
Rice Field
Pond
Airport/Port
Transmigraton
Mining
Swamps
Tabl
e 18
. Pe
at e
mis
sion
mat
rix o
f eve
ry la
nd u
se c
hang
e

55TECHNICAL GUIDELINE
FOR MONITORING, EVALUATION AND REPORTING (MER) OF RAD-GRK IMPLEMENTATION
Mixe
d Dr
y Lan
d Fa
rming
16
25
.5
16
16
32
25.5
35
38
.5
25.5
25
.5
25.5
25
.5
25.5
25
.5
32
19
16
16
38.5
48
16
Ricefie
ld3
12.5
33
19
12.5
22
25.5
12.5
12.5
12.5
12.5
12.5
12.5
19
63
325.5
35
3
Pond
0
9.5
0 0
16
9.5
19
22.5
9.
5 9.
5 9.
5 9.
5 9.
5 9.
5 16
3
0 0
22.5
32
0
Airp
ort/
Port
0 9.
5 0
0 16
9.
5 19
22
.5
9.5
9.5
9.5
9.5
9.5
9.5
16
3 0
0 22
.5
32
0
Tran
smigr
ation
22
.5
32
22.5
22
.5
38.5
32
41
.5
45
32
32
32
32
32
32
38.5
25
.5
22.5
22
.5
45
54.5
22
.5
Mini
ng
32
41.5
32
32
48
41
.5
51
54.5
41
.5
41.5
41
.5
41.5
41
.5
41.5
48
35
32
32
54
.5
64
32
Swam
p 0
9.5
0 0
16
9.5
19
22.5
9.
5 9.
5 9.
5 9.
5 9.
5 9.
5 16
3
0 0
22.5
32
0
Peat
land
Emiss
ion
Primary Dry Land Forest
Secondary Dry Land Forest
Primary Mangrove Forest
Primary Swamp Forest
Plantation Forest
Bushes
Plantation
Settlement
Open Land
Grass
Secondary Mangrove Forest
Secondary Swamp Forest
Swamp bush
Dry Land Farming
Mixed Dry Land Farming
Rice Field
Pond
Airport/Port
Transmigraton
Mining
Swamps

56TECHNICAL GUIDELINE FOR MONITORING, EVALUATION AND REPORTING (MER) OF RAD-GRK IMPLEMENTATION
18a
8b9b
9a9c
2a5a
2b5b
36
47
Code
Dist
rict
Core
act
ivity
su
ppor
ted
Area
Fu
nctio
n or
APL
Supp
ort-
ing
Activ
ity
Cate
gory
Miti
gatio
nAc
tion
(2)
RAD
-GRK
Impl
emen
tatio
n Pe
riod
(8)
RAD
-GRK
Act
ivity
Targ
et
(9)
Coor
dina
te(5
)
RAD
0 ESt
art
Indi
cato
rEn
dQ
uant
ityUn
itLP
J0 N,
0 S
FORM
2.2
.3 S
uppo
rtin
g A
ctiv
ity
Form
for F
ores
try
and
Peat
land
Sec
tor
SEC
TOR
: FO
REST
RY A
ND
PEA
TLA
ND
CATA
GO
RY
: Su
ppor
ting
Activ
ity
YEA
R :
REPO
RTER
:
Cent
ral G
over
nmen
t M
inis
try
:
Prov
inci
al G
over
nmen
t Pr
ovin
ce
:
Dis
tric
t/Ci
ty G
over
nmen
t D
istr
ict/
City
:

57TECHNICAL GUIDELINE
FOR MONITORING, EVALUATION AND REPORTING (MER) OF RAD-GRK IMPLEMENTATION
FORM
2.2
.3 S
uppo
rtin
g A
ctiv
ity
Form
for F
ores
try
and
Peat
land
Sec
tor (
Cont
inua
tion
)
SEC
TOR
: FO
REST
RY A
ND
PEA
TLA
ND
CATA
GO
RY
: Su
ppor
ting
Activ
ity
YEA
R :
REPO
RTER
:
Cent
ral G
over
nmen
t M
inis
try
:
Prov
inci
al G
over
nmen
t Pr
ovin
ce
:
Dis
tric
t/Ci
ty G
over
nmen
t D
istr
ict/
City
:
10a1
12a
10b2
12e
10a3
12c
11a
13b
10a2
12b
10b3
13a
10b1
12d
11b
14
Qua
ntity
Unit
APBN
%
Achi
eve-
men
tRA
D
Budg
et a
lloca
tion
plan
(mill
ion
rupi
ah)
(11)
Activ
ity Im
plem
ente
r
Rem
arks
Real
ized
Fund
Abs
oprt
ion
acco
rdin
g to
Fi
nanc
ing
Sour
ces (
mill
ion
rupi
ah)
(12)
APBD
-KRA
DUn
it%
Achi
eve-
men
tAP
BD-P
Priv
ate
sect
or fu
ndQ
uant
ityLP
JPH
LNLP
J
Achi
evem
ent i
n th
e Re
port
ing
Year
(1
0a)
Cum
ulat
ive
Achi
evem
ent u
ntil
the
Repo
rtin
g Ye
ar (1
0b)
RAD
-GRK
Act
ivity
Impl
emen
tatio
n (1
0)
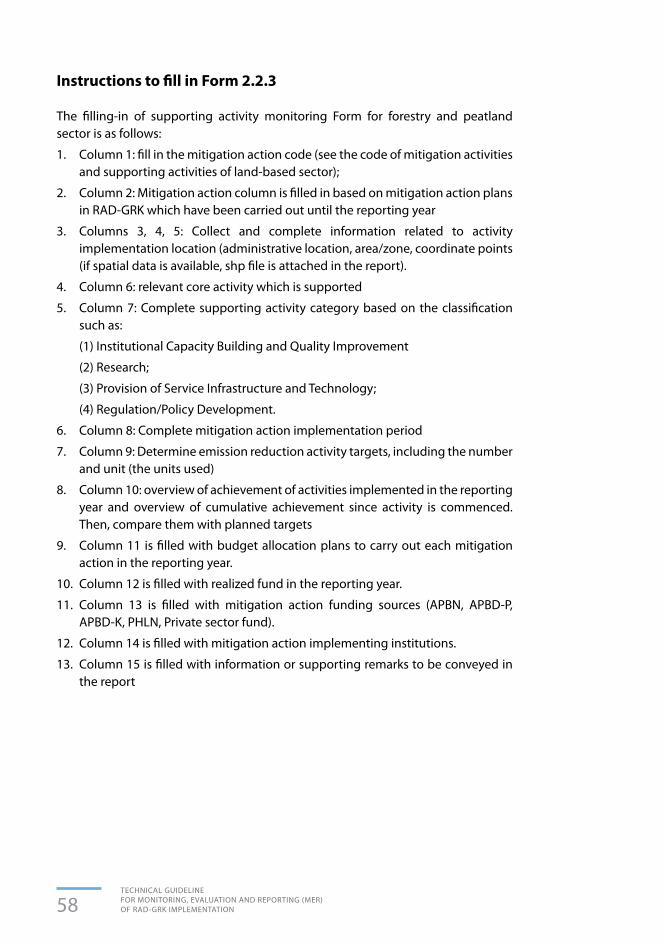
58TECHNICAL GUIDELINE FOR MONITORING, EVALUATION AND REPORTING (MER) OF RAD-GRK IMPLEMENTATION
Instructions to fill in Form 2.2.3
The filling-in of supporting activity monitoring Form for forestry and peatland sector is as follows:
1. Column 1: fill in the mitigation action code (see the code of mitigation activities and supporting activities of land-based sector);
2. Column 2: Mitigation action column is filled in based on mitigation action plans in RAD-GRK which have been carried out until the reporting year
3. Columns 3, 4, 5: Collect and complete information related to activity implementation location (administrative location, area/zone, coordinate points (if spatial data is available, shp file is attached in the report).
4. Column 6: relevant core activity which is supported
5. Column 7: Complete supporting activity category based on the classification such as:
(1) Institutional Capacity Building and Quality Improvement
(2) Research;
(3) Provision of Service Infrastructure and Technology;
(4) Regulation/Policy Development.
6. Column 8: Complete mitigation action implementation period
7. Column 9: Determine emission reduction activity targets, including the number and unit (the units used)
8. Column 10: overview of achievement of activities implemented in the reporting year and overview of cumulative achievement since activity is commenced. Then, compare them with planned targets
9. Column 11 is filled with budget allocation plans to carry out each mitigation action in the reporting year.
10. Column 12 is filled with realized fund in the reporting year.
11. Column 13 is filled with mitigation action funding sources (APBN, APBD-P, APBD-K, PHLN, Private sector fund).
12. Column 14 is filled with mitigation action implementing institutions.
13. Column 15 is filled with information or supporting remarks to be conveyed in the report

59TECHNICAL GUIDELINE
FOR MONITORING, EVALUATION AND REPORTING (MER) OF RAD-GRK IMPLEMENTATION
The implementation of monitoring and evaluation of energy-based sector group mitigation activities consists of two sectors namely: (1) Energy sector, and (2) Transportation sector. In this section Core Activity Form is made available to measure mitigation action achievement in both sectors. For calculation of GHG emission reduction from each mitigation action in energy and transportation sectors there are GHG Emission Reduction Calculation Form containing indicators, parameter, activity data as well as emission factors. Supporting activities which can reduce green house gas emission can indirectly be reported in Supporting Activity Form.
3.1 ENERGY SECTOR
3.1.1 Core Activity Form for Energy Sector
This Core Activity Form is used to monitor and evaluate each mitigation action including in core activity category namely activities that directly generate GHG emission reduction. This form is filled in by Central Government, Provincial Governments/District/City Governments based on their respective authorities.
Calculation table is arranged by using three different colours with the following explanation:
CHAPTER 3TECHNICAL GUIDELINE FOR ENERGY-BASED SECTOR GROUP
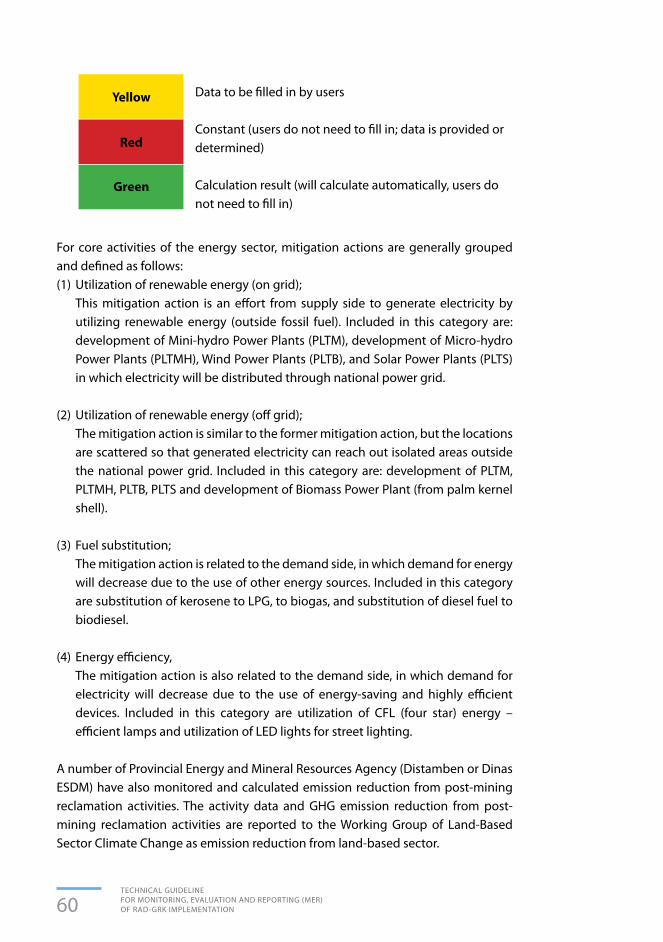
60TECHNICAL GUIDELINE FOR MONITORING, EVALUATION AND REPORTING (MER) OF RAD-GRK IMPLEMENTATION
For core activities of the energy sector, mitigation actions are generally grouped and defined as follows:(1) Utilization of renewable energy (on grid); This mitigation action is an effort from supply side to generate electricity by
utilizing renewable energy (outside fossil fuel). Included in this category are: development of Mini-hydro Power Plants (PLTM), development of Micro-hydro Power Plants (PLTMH), Wind Power Plants (PLTB), and Solar Power Plants (PLTS) in which electricity will be distributed through national power grid.
(2) Utilization of renewable energy (off grid); The mitigation action is similar to the former mitigation action, but the locations
are scattered so that generated electricity can reach out isolated areas outside the national power grid. Included in this category are: development of PLTM, PLTMH, PLTB, PLTS and development of Biomass Power Plant (from palm kernel shell).
(3) Fuel substitution; The mitigation action is related to the demand side, in which demand for energy
will decrease due to the use of other energy sources. Included in this category are substitution of kerosene to LPG, to biogas, and substitution of diesel fuel to biodiesel.
(4) Energy efficiency, The mitigation action is also related to the demand side, in which demand for
electricity will decrease due to the use of energy-saving and highly efficient devices. Included in this category are utilization of CFL (four star) energy –efficient lamps and utilization of LED lights for street lighting.
A number of Provincial Energy and Mineral Resources Agency (Distamben or Dinas ESDM) have also monitored and calculated emission reduction from post-mining reclamation activities. The activity data and GHG emission reduction from post-mining reclamation activities are reported to the Working Group of Land-Based Sector Climate Change as emission reduction from land-based sector.
Data to be filled in by users
Constant (users do not need to fill in; data is provided or determined)
Calculation result (will calculate automatically, users do not need to fill in)
Yellow
Red
Green

61TECHNICAL GUIDELINE
FOR MONITORING, EVALUATION AND REPORTING (MER) OF RAD-GRK IMPLEMENTATION
3.1.2 GHG Emission Reduction Calculation Form for Energy Sector
For GHG emission reduction calculation from each mitigation action in energy sector, there is GHG Emission Reduction Calculation Form for Energy Sector containing indicator, parameter, activity data as well as emission factors needed. The parameters needed for each activity category are: - Renewable energy (on grid), namely production of energy (sold energy) in MWh. - Renewable energy (off grid), namely installed capacity (MW) and number of
operational hours in a year. - Energy conversion from kerosene to LPG, namely the number of unit s of LPH
sold (in kg) and ratio of substitution of LPG for kerosene. - Energy conversion from kerosene to biogas namely volume of total digester
biogas and substitution value of biogas for kerosene . - Energy conversion from diesel fuel to biodiesel, namely biodiesel volume used
and substitution value of biodiesel for diesel fuel.- Energy efficiency from the use of CFL lamps, namely the number of units
installed and energy consumption per unit. - Energy efficiency form the use of LED lamps for Public Street Lighting namely
the number od units installed and energy consumption per unit.
The Working Group on Climate Change in the Energy Sector has calculated the national emission factors used to calculate emission reduction from each mitigation action. The calculation is derived from IPCC Guidelines 2006 based on the type and quality of energy (fuel) or emission factors set beforehand.
3.1.3 Supporting Activity Form for Energy Sector
Supporting Activity Form for Energy Sector is used to monitored and evaluate mitigation activities included in the supporting activity category, namely activities predicted to generate GHG emission reduction indirectly. This form is filled in by the Central Government/ Provincial Governments/ District/City Governments based on their respective authorities.
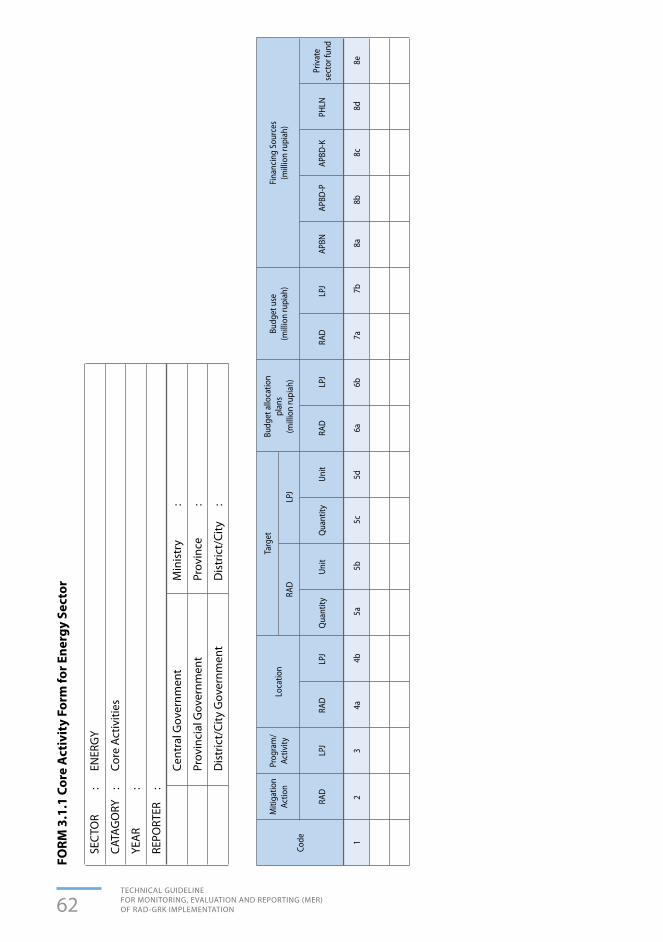
62TECHNICAL GUIDELINE FOR MONITORING, EVALUATION AND REPORTING (MER) OF RAD-GRK IMPLEMENTATION
15c
25d
4b7a
8c3
6a5a
7b8d
4a6b
8b5b
8a8e
Code
Miti
gatio
nAc
tion
Prog
ram
/Ac
tivity
Loca
tion
Budg
et a
lloca
tion
plan
s (m
illio
n ru
piah
)
Budg
et u
se(m
illio
n ru
piah
)Fi
nanc
ing
Sour
ces
(mill
ion
rupi
ah)
Targ
et
RAD
RAD
RAD
RAD
RAD
APBN
APBD
-KQ
uant
ityQ
uant
ityLP
JLP
J
LPJ
LPJ
LPJ
APBD
-PPH
LNPr
ivat
ese
ctor
fund
Unit
Unit
FORM
3.1
.1 C
ore
Act
ivit
y Fo
rm fo
r Ene
rgy
Sect
or
SEC
TOR
: EN
ERG
Y
CATA
GO
RY
: Co
re A
ctiv
ities
YEA
R :
REPO
RTER
:
Cent
ral G
over
nmen
t M
inis
try
:
Prov
inci
al G
over
nmen
t Pr
ovin
ce
:
Dis
tric
t/Ci
ty G
over
nmen
t D
istr
ict/
City
:
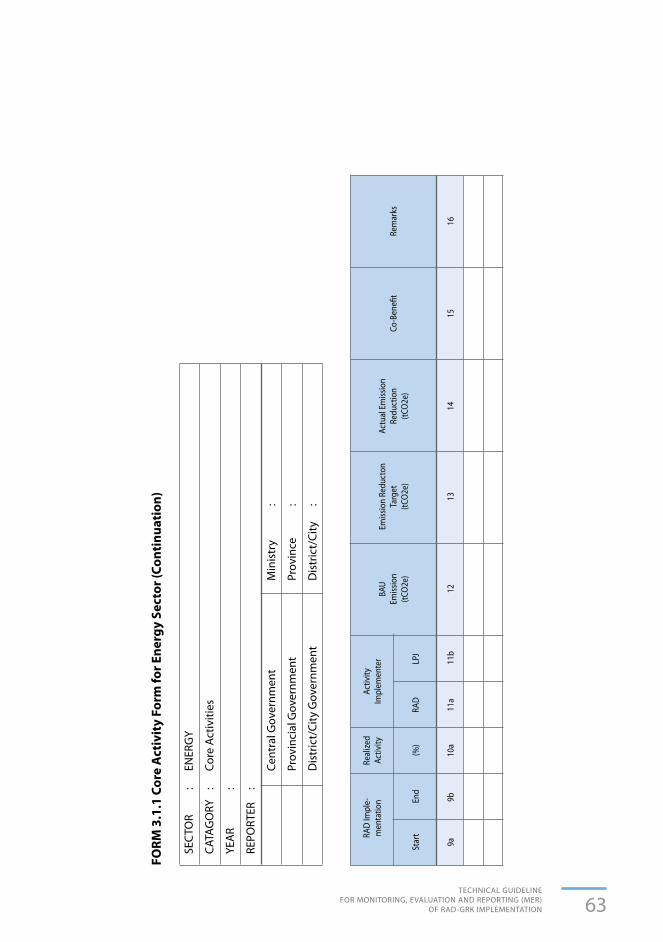
63TECHNICAL GUIDELINE
FOR MONITORING, EVALUATION AND REPORTING (MER) OF RAD-GRK IMPLEMENTATION
9a13
9b11
b10
a14
1211
a15
16
RAD
Impl
e-m
enta
tion
Real
ized
Activ
ity
Activ
ity
Impl
emen
ter
Actu
al E
miss
ion
Redu
ctio
n (tC
O2e
)Co
-Ben
efit
Rem
arks
End
Star
tRA
D
BAU
Emiss
ion
(tCO
2e)
(%)
LPJ
Emiss
ion
Redu
cton
Ta
rget
(tC
O2e
)
FORM
3.1
.1 C
ore
Act
ivit
y Fo
rm fo
r Ene
rgy
Sect
or (C
onti
nuat
ion)
SEC
TOR
: EN
ERG
Y
CATA
GO
RY
: Co
re A
ctiv
ities
YEA
R :
REPO
RTER
:
Cent
ral G
over
nmen
t M
inis
try
:
Prov
inci
al G
over
nmen
t Pr
ovin
ce
:
Dis
tric
t/Ci
ty G
over
nmen
t D
istr
ict/
City
:

64TECHNICAL GUIDELINE FOR MONITORING, EVALUATION AND REPORTING (MER) OF RAD-GRK IMPLEMENTATION
Instructions to fill in Form 3.1.1
The Core activity Form is filled in with the following step:
1. Column 1 is filled with a number.
2. Column 2 is filled with the title of each mitigation action done (based on the authority of each government level).
3. Column 3 is filled with the title of Program/Activity based on LPJ related to mitigation action in column 2.
4. Column 4 is filled with the location of core mitigation action.
5. Column 5 is filled with the quantity of targeted implementation in RAD-GRK and in LPJ, and the unit of the quantity.
6. Column 6 is filled with budget allocation plan to carry out each mitigation action in the reporting year.
7. Column 7 is filled with budget use in the reporting year.
8. Column 8 is filled with mitigation action financing sources (APBN, APBD-P, APBD-K, PHLN, Private sector fund).
9. Column 9 is filled with mitigation action implementation period based on RAD-GRK.
10. Column 10 is filled with realized mitigation actions based on RAD- GRK targets.
11. Column 11 is filled with mitigation action implementing institutions.
12. Column 12 is filled with total BAU Baseline Emissions according to what is mentioned in the annex of Perpres (Presidential Regulation) 61/2011 and RAD-GRK documents. If not possible, it can be filled with BAU Baseline per sector.
13. Column 13 is filled with GHG emission reduction targets generated from each mitigation action (according to what is mentioned in the annex of Perpres 61/2011 and RAD-GRK documents).
14. Column 14 is filled with GHG emission reduction from each mitigation action implementation.
15. Column 15 is filled with information of co-benefits resulted by the mitigation action.
16. Column 16 is filled with additional information as necessary.

65TECHNICAL GUIDELINE
FOR MONITORING, EVALUATION AND REPORTING (MER) OF RAD-GRK IMPLEMENTATION
No.
Actio
n Pl
an
Indi
cato
r Pa
ram
eter
Pa
ram
eter
1
Para
met
er 2
Ac
tivity
Dat
a Em
issi
on F
acto
r Em
issi
on R
educ
tion
RENE
WAB
LE E
NERG
y (O
N GR
ID)
No.
Actio
n Pl
an
Indi
cato
r Pa
ram
eter
In
stal
led
Capa
city
En
ergy
Gen
erat
ed
Activ
ity D
ata
Emis
sion
Fac
tor*
Em
issi
on R
educ
tion
(MW
) in
a y
ear
(tC
O2e/
MW
h)
(tCO2
e)
(MW
h)
1 De
velop
men
t of
PLTM
M
Wh
Ca
pacit
y ins
talle
d &
0
0
En
ergy
gen
erat
ed2
Deve
lopm
ent o
f PL
TMH
M
Wh
Capa
city i
nsta
lled
&
0
0
Ener
gy g
ener
ated
3 De
velop
men
t of
PLTB
M
Wh
Ca
pacit
y ins
talle
d &
0
0
En
ergy
gen
erat
ed
4 De
velop
men
t of P
LTS
MW
h
Capa
city i
nsta
lled
&
0
0
Ener
gy g
ener
ated
ENER
GI T
ERBA
RUKA
N (O
FF G
RID)
No.
Actio
n Pl
an
Indi
cato
r Pa
ram
eter
In
stal
led
Capa
city
Op
erat
ing
Hour
s Ac
tivity
Dat
a Em
issi
on F
acto
r PLT
D Em
issi
on R
educ
tion
(MW
)
(tC
O2e/
MW
h)
(tCO2
e)
1 De
velop
men
t of
PLTM
M
Wh
Ca
pacit
y ins
talle
d &
oper
ating
6132
0
0,8
0
hour
s (70
%X8
760)
2 De
velop
men
t of
PLTM
H
MW
h In
stalle
d ca
pacit
y & O
pera
ting
61
32
0 0,
8 0
ho
urs (
70%
X876
0)3
Deve
lopm
ent o
f PL
TB
MW
h In
stalle
d ca
pacit
y & O
pera
ting
17
52
0 0,
8 0
ho
urs (
20%
X876
0)4
Deve
lopm
ent o
f PLT
S
MW
h In
stalle
d ca
pacit
y & O
pera
ting
17
52
0 0,
8 0
ho
urs (
20%
X876
0)5
Deve
lopm
ent o
f PLT
Biom
assa
M
Wh
Insta
lled
capa
city &
Ope
ratin
g
788
4 0
0,8
0
(palm
kern
el sh
ell)
ho
urs (
90%
X876
0)
FORM
3.1
.2 E
mis
sion
Cal
cula
tion
For
m fo
r Ene
rgy
Sect
or

66TECHNICAL GUIDELINE FOR MONITORING, EVALUATION AND REPORTING (MER) OF RAD-GRK IMPLEMENTATION
FUEL
SUB
STIT
UTIO
N
NO
Actio
n Pl
an
Indi
cato
r Pa
ram
eter
Nu
mbe
r of
Subs
titut
ion
Ratio
Ac
tivity
Dat
a Em
issi
on F
acto
r of
Emis
sion
Red
uctio
n
So
ld U
nit (
kg)
Kero
sene
(kg
CO2e
/lite
r) (tC
O2e)
1 Su
bstitu
tion
of K
eros
ene
to L
PG
Liter
of k
eros
ene
To
tal w
eight
of L
PG d
istrib
uted
1,75
4385
965
0 2,
58
0
and
subs
titutio
n ra
tio
NO
Actio
n Pl
an
Indi
kato
r Pa
ram
eter
Vo
lum
e Di
gest
er
Subs
titut
ion
Ratio
Ac
tivity
Dat
a Em
issi
on F
acto
r of
Emis
sion
Red
uctio
n
(ju
mla
h un
its x
Ke
rose
ne
(tCO2
e)
uk
uran
uni
t)
(k
gCO2
e/lit
er)
2 Su
bstitu
tion
of ke
rose
ne to
Lit
er o
f ker
osen
e Vo
lume
of d
igeste
r and
0,62
0
2,58
0
bio
gas (
only
emiss
ion re
ducti
on
su
bstitu
tion
fro
m fu
el co
nver
sion
is
calcu
lated
)
NO
Actio
n Pl
an
Indi
cato
r Pa
ram
eter
Vo
lum
e bi
odie
sel
Subs
titut
ion
Ratio
Ac
tivity
Dat
a Em
issi
on F
acto
r of
Emis
sion
Red
uctio
n
ya
ng d
igun
akan
(kL)
Ke
rose
ne (t
CO2
e/ki
lolit
er)
(tCO
2e)
3 Su
bstitu
tion
of d
iesel
fuel
to
Liter
of d
iesel
fuel
Volum
e of
biod
iesel
used
and
0,56
0
2,6
0
biodie
sel (
blend
ing b
y
subs
titutio
n ra
tio
PT. P
erta
mina
)
ENER
Gy E
FFIC
IENC
y
NO
Actio
n Pl
an
Indi
cato
r Pa
ram
eter
Ju
mla
h Un
it E
nerg
y us
ed/
Ac
tivity
Dat
a Em
issi
on F
acto
r*
Emis
sion
Red
uctio
n
/ lam
p po
ints
(tCO2
e/M
Wh)
(t
CO2e
)
(kW
h/La
mpu
)
1 Us
e of
CFL
lam
ps (4
star
)
KWh
Num
ber o
f unit
s and
40,8
8 0
0
en
ergy
use
d/ la
mp
point
s2
Use
of L
ED la
mps
for P
ublic
KW
h Nu
mbe
r of u
nits a
nd
0
0
Stre
et L
ightin
g
ener
gy u
sed/
lam
p po
ints
Not
e: *
) Adj
uste
d to
em
issi
on fa
ctor
of t
he lo
cal s
yste
m o
r ele
ctric
ity m
eter
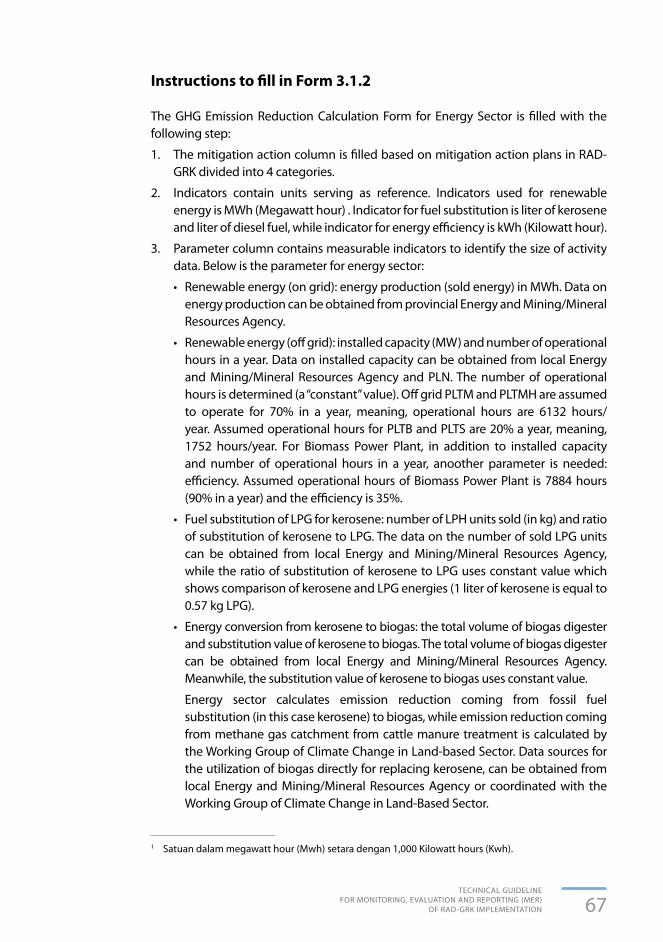
67TECHNICAL GUIDELINE
FOR MONITORING, EVALUATION AND REPORTING (MER) OF RAD-GRK IMPLEMENTATION
Instructions to fill in Form 3.1.2
The GHG Emission Reduction Calculation Form for Energy Sector is filled with the following step:
1. The mitigation action column is filled based on mitigation action plans in RAD-GRK divided into 4 categories.
2. Indicators contain units serving as reference. Indicators used for renewable energy is MWh (Megawatt hour) . Indicator for fuel substitution is liter of kerosene and liter of diesel fuel, while indicator for energy efficiency is kWh (Kilowatt hour).
3. Parameter column contains measurable indicators to identify the size of activity data. Below is the parameter for energy sector:
• Renewableenergy(ongrid):energyproduction(soldenergy)inMWh.Dataonenergy production can be obtained from provincial Energy and Mining/Mineral Resources Agency.
• Renewableenergy(offgrid):installedcapacity(MW)andnumberofoperationalhours in a year. Data on installed capacity can be obtained from local Energy and Mining/Mineral Resources Agency and PLN. The number of operational hours is determined (a “constant” value). Off grid PLTM and PLTMH are assumed to operate for 70% in a year, meaning, operational hours are 6132 hours/year. Assumed operational hours for PLTB and PLTS are 20% a year, meaning, 1752 hours/year. For Biomass Power Plant, in addition to installed capacity and number of operational hours in a year, anoother parameter is needed: efficiency. Assumed operational hours of Biomass Power Plant is 7884 hours (90% in a year) and the efficiency is 35%.
• FuelsubstitutionofLPGforkerosene:numberofLPHunitssold(inkg)andratioof substitution of kerosene to LPG. The data on the number of sold LPG units can be obtained from local Energy and Mining/Mineral Resources Agency, while the ratio of substitution of kerosene to LPG uses constant value which shows comparison of kerosene and LPG energies (1 liter of kerosene is equal to 0.57 kg LPG).
• Energyconversionfromkerosenetobiogas:thetotalvolumeofbiogasdigesterand substitution value of kerosene to biogas. The total volume of biogas digester can be obtained from local Energy and Mining/Mineral Resources Agency. Meanwhile, the substitution value of kerosene to biogas uses constant value.
Energy sector calculates emission reduction coming from fossil fuel substitution (in this case kerosene) to biogas, while emission reduction coming from methane gas catchment from cattle manure treatment is calculated by the Working Group of Climate Change in Land-based Sector. Data sources for the utilization of biogas directly for replacing kerosene, can be obtained from local Energy and Mining/Mineral Resources Agency or coordinated with the Working Group of Climate Change in Land-Based Sector.
1 Satuan dalam megawatt hour (Mwh) setara dengan 1,000 Kilowatt hours (Kwh).

68TECHNICAL GUIDELINE FOR MONITORING, EVALUATION AND REPORTING (MER) OF RAD-GRK IMPLEMENTATION
• Thevolumeofbiodieselused(liter)andsubstitutionratiobetweenbiodieselanddiesel fuel. Use of biodiesel as a substitution from diesel fuel reduces GHG emission by 56% (a study from Indonesian Palm Oil Council). Total volume of biodiesel use can be obtained from local Energy and Mining/Mineral Resources Agency.
• Energy efficiency from CFL lamp use: number of installed units and energyconsumption per unit. Data on the number of installed unit can be obtained from local Energy and Mining/Mineral Resources Agency. Energy consumption per unit is energy consumption of replaced lamps. It is assumed that replaced lamps are 14-watt lamps as they are mostly used and the daily use is only for 8 hours.
• Energy efficiency from LED lamp use for Public Street Lighting: number ofinstalled units and energy consumption per unit. Energy consumption per unit is energy consumption of replaced conventional PJU (Public Street Lighting) lamps. Data on the energy consumption is obtained from monitoring or sampling directly conducted by PJU or obtained from average number of PLN power use for PJU divided by the number of lamp points.
For measuring emission reduction as the result of energy-efficient lamp use (both LED or other types of lamps) for Public Street Lighting, the provinces that conduct this mitigation action are advised to add meter-installing program so that more accurate data can be obtained;
4. Activity data column is obtained from measureable parameters based on the data inserted in the previous columns. • Renewableenergy(ongrid):
ACTIVITY DATA = ENERGY PRODUCTION (SOLD ENERGY)
• Renewableenergy(offgrid): ACTIVITY DATA = INSTALLED CAPACITY X NUMBER OF OPERATIONAL HOURS IN A YEAR
Especially for Biomass Power Plant (PLT) : ACTIVITY DATA = INSTALLED CAPACITY X NUMBER OF OPERATIONAL HOURS IN A YEAR X EFFICIENCY OF BIOMASS POWER PLANT(PLT)
(it is assumed that efficiency of Biomass Power Plant is 35%)• EnergyconversionfromkerosenetoLPG:
EMISSION REDUCTION = TOTAL WEIGHT OF SOLD LPG X RATIO OF SUBSTITUTION OF LPG FROM KEROSENE
• Energyconversionfromkerosenetobiogas:
ACTIVITY DATA = VOLUME OF BIOGAS DIGESTER X RATIO OF SUBSTITUTION OF BIOGAS FROM KEROSENE X DIGESTER EFFICIENCY (it is assumed that the digesters are fixed dome with 30% efficiency value)
• Energyconversionfromdieselfueltobiodiesel:
ACTIVITY DATA = VOLUME OF BIODIESEL USED X RATIO OF SUBSTITUTION OF BIODIESEL FROM DIESEL FUEL
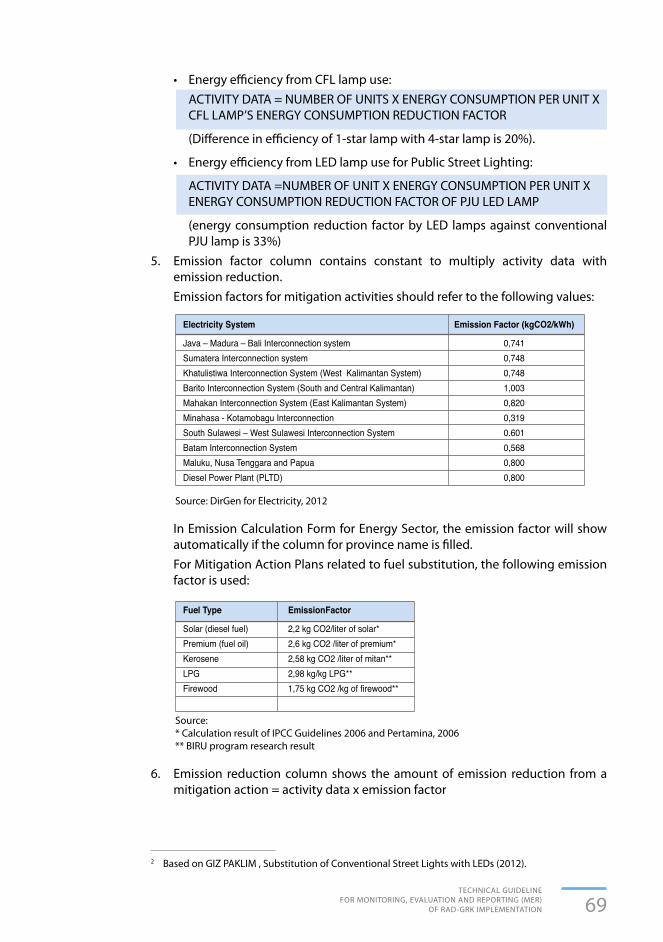
69TECHNICAL GUIDELINE
FOR MONITORING, EVALUATION AND REPORTING (MER) OF RAD-GRK IMPLEMENTATION
• EnergyefficiencyfromCFLlampuse: ACTIVITY DATA = NUMBER OF UNITS X ENERGY CONSUMPTION PER UNIT X
CFL LAMP’S ENERGY CONSUMPTION REDUCTION FACTOR
(Difference in efficiency of 1-star lamp with 4-star lamp is 20%).
• EnergyefficiencyfromLEDlampuseforPublicStreetLighting:
ACTIVITY DATA =NUMBER OF UNIT X ENERGY CONSUMPTION PER UNIT X ENERGY CONSUMPTION REDUCTION FACTOR OF PJU LED LAMP
(energy consumption reduction factor by LED lamps against conventional PJU lamp is 33%)
5. Emission factor column contains constant to multiply activity data with emission reduction.
Emission factors for mitigation activities should refer to the following values:
Fuel Type EmissionFactor
Solar (diesel fuel) 2,2 kg CO2/liter of solar*Premium (fuel oil) 2,6 kg CO2 /liter of premium*Kerosene 2,58 kg CO2 /liter of mitan**LPG 2,98 kg/kg LPG**Firewood 1,75kgCO2/kgoffirewood**
Electricity System Emission Factor (kgCO2/kWh)
Java – Madura – Bali Interconnection system 0,741Sumatera Interconnection system 0,748Khatulistiwa Interconnection System (West Kalimantan System) 0,748Barito Interconnection System (South and Central Kalimantan) 1,003Mahakan Interconnection System (East Kalimantan System) 0,820Minahasa - Kotamobagu Interconnection 0,319South Sulawesi – West Sulawesi Interconnection System 0.601Batam Interconnection System 0,568Maluku, Nusa Tenggara and Papua 0,800Diesel Power Plant (PLTD) 0,800
Source: DirGen for Electricity, 2012
Source: * Calculation result of IPCC Guidelines 2006 and Pertamina, 2006** BIRU program research result
In Emission Calculation Form for Energy Sector, the emission factor will show automatically if the column for province name is filled.
For Mitigation Action Plans related to fuel substitution, the following emission factor is used:
6. Emission reduction column shows the amount of emission reduction from a mitigation action = activity data x emission factor
2 Based on GIZ PAKLIM , Substitution of Conventional Street Lights with LEDs (2012).
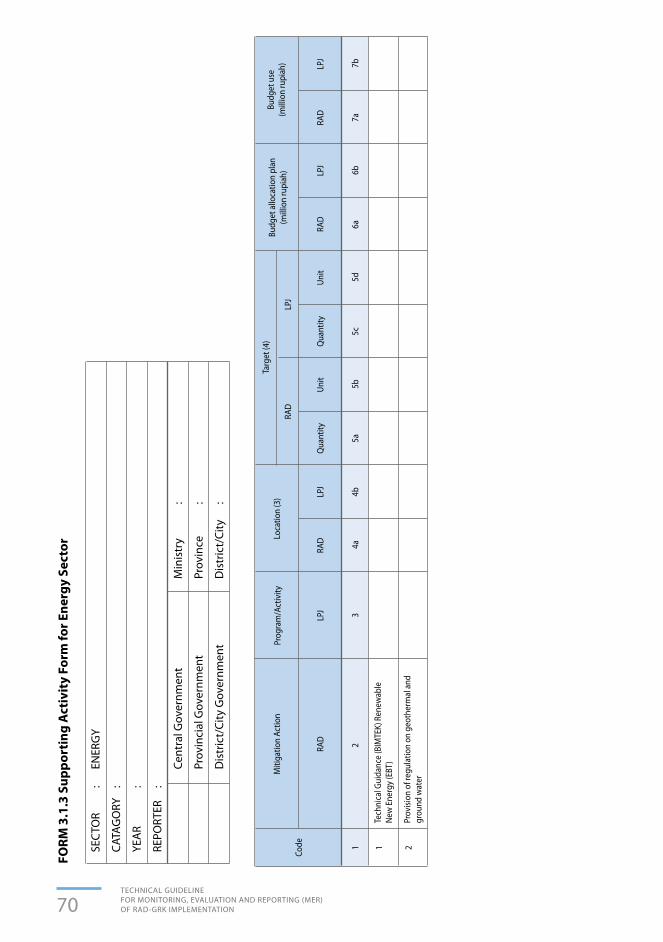
70TECHNICAL GUIDELINE FOR MONITORING, EVALUATION AND REPORTING (MER) OF RAD-GRK IMPLEMENTATION
1 1 2
Tech
nica
l Gui
danc
e (B
IMTE
K) R
enew
able
Ne
w E
nerg
y (E
BT)
Prov
ision
of r
egul
atio
n on
geo
ther
mal
and
gr
ound
wat
er
23
4a4b
5a6a
5c7a
5b6b
5d7b
Code
RAD
LPJ
Prog
ram
/Act
ivity
RAD
LPJ
Qua
ntity
Qua
ntity
RAD
RAD
Unit
Unit
LPJ
LPJ
Miti
gatio
n Ac
tion
Loca
tion
(3)
Targ
et (4
)
RAD
LPJ
Budg
et a
lloca
tion
plan
(m
illio
n ru
piah
)Bu
dget
use
(mill
ion
rupi
ah)
FORM
3.1
.3 S
uppo
rtin
g A
ctiv
ity
Form
for E
nerg
y Se
ctor
SEC
TOR
: EN
ERG
Y
CATA
GO
RY
:
YEA
R :
REPO
RTER
:
Cent
ral G
over
nmen
t M
inis
try
:
Prov
inci
al G
over
nmen
t Pr
ovin
ce
:
Dis
tric
t/Ci
ty G
over
nmen
t D
istr
ict/
City
:
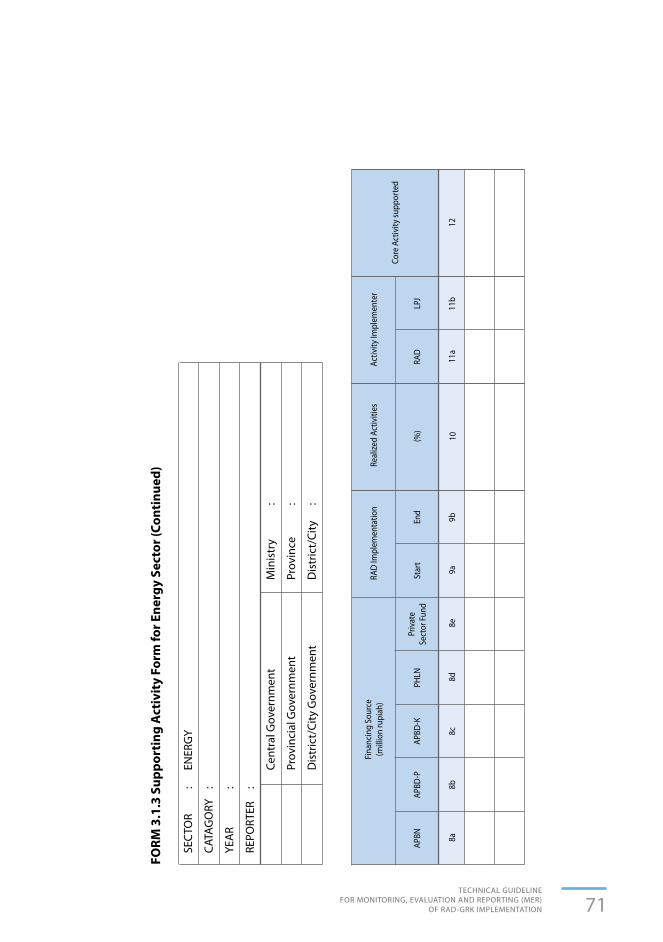
71TECHNICAL GUIDELINE
FOR MONITORING, EVALUATION AND REPORTING (MER) OF RAD-GRK IMPLEMENTATION
8a8b
8c9b
11b
8d8e
9a11
a12
APBN
APBD
-PAP
BD-K
Priv
ate
Sect
or Fu
ndEn
dLP
JPH
LNSt
art
RAD
Fina
ncin
g So
urce
(mill
ion
rupi
ah)
RAD
Impl
emen
tatio
nRe
alize
d Ac
tiviti
es
(%)
10
Activ
ity Im
plem
ente
r
Core
Act
ivity
supp
orte
d
FORM
3.1
.3 S
uppo
rtin
g A
ctiv
ity
Form
for E
nerg
y Se
ctor
(Con
tinu
ed)
SEC
TOR
: EN
ERG
Y
CATA
GO
RY
:
YEA
R :
REPO
RTER
:
Cent
ral G
over
nmen
t M
inis
try
:
Prov
inci
al G
over
nmen
t Pr
ovin
ce
:
Dis
tric
t/Ci
ty G
over
nmen
t D
istr
ict/
City
:

72TECHNICAL GUIDELINE FOR MONITORING, EVALUATION AND REPORTING (MER) OF RAD-GRK IMPLEMENTATION
3.2 TRANSPORTATION SECTOR
3.2.1 Core Activity Form for Transportation Sector
The Core Activity Form for transportation section is intended to monitor and evaluate each mitigation action categorized as core mitigation action and which generate GHG emission reduction directly. The form is filled out by the Central Government/ Provincial/District/City Governments based on their respective authorities.
For Core activities of Transportation Sector, the mitigation actions can be grouped in general and defined as follows:
(1) Avoid; The avoid strategy is conducted by reducing demand trip, especially urban
trip (trip demand management) through land use management, reducing unnecessary trip and trip distance. Mitigation actions included in the strategy is the application of traffic impact control through Traffic Impact Analysis (Andalalin);
(2) Shift; The shift strategy is conducted by shifting from private vehicle (transportation
mode with high energy consumption) to low carbon transportation such as non-motorized means of transportation, public transports, and water transports. The mitigation actions included in this strategy are:a. Development of Intelligent Transport Systemb. Reformed transit system – BRT System c. Rejuvenation of public transport fleetsd. Construction of facilities for pedestrians (pedestrians’ walk) and cyclists
(bicycle lanes)e. Motorized vehicle-free day (car free day)f. Congestion charging and road pricing refer to Government Regulation (PP)
32/2011 on Traffic Management and Engineering, Analysis of Traffic Impacts and Traffic Need Management
g. Parking management application
(3) Improve; The Improve strategy is conducted by improving energy efficiency and carbon
emission reduction on motorized vehicles of the means of transportation. The mitigation actions included in this category are:a. Emission testing on all vehiclesb. Smart driving training (eco-driving).
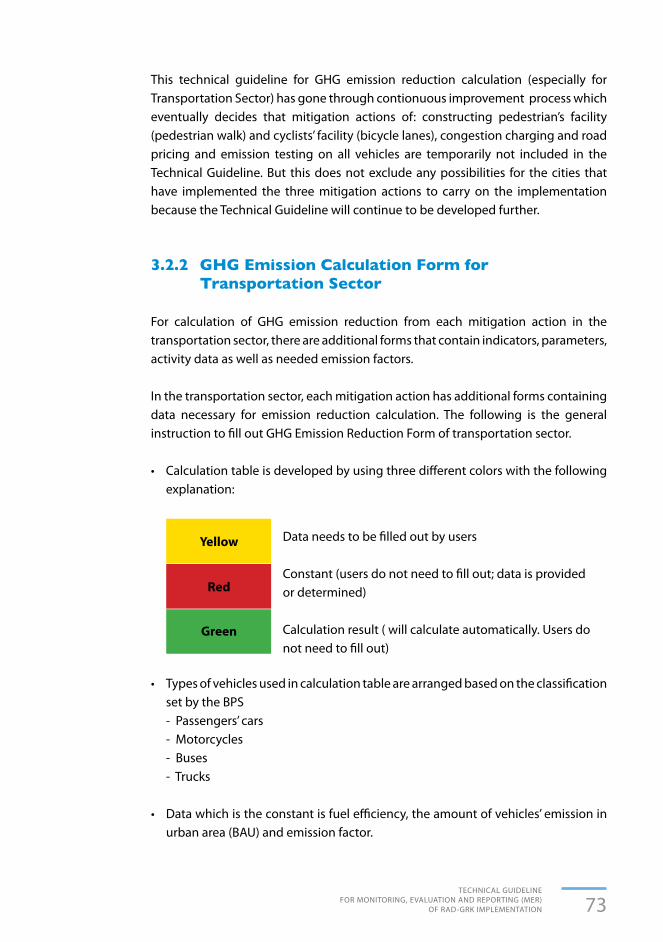
73TECHNICAL GUIDELINE
FOR MONITORING, EVALUATION AND REPORTING (MER) OF RAD-GRK IMPLEMENTATION
Data needs to be filled out by users
Constant (users do not need to fill out; data is provided or determined)
Calculation result ( will calculate automatically. Users do not need to fill out)
Yellow
Red
Green
This technical guideline for GHG emission reduction calculation (especially for Transportation Sector) has gone through contionuous improvement process which eventually decides that mitigation actions of: constructing pedestrian’s facility (pedestrian walk) and cyclists’ facility (bicycle lanes), congestion charging and road pricing and emission testing on all vehicles are temporarily not included in the Technical Guideline. But this does not exclude any possibilities for the cities that have implemented the three mitigation actions to carry on the implementation because the Technical Guideline will continue to be developed further.
3.2.2 GHG Emission Calculation Form for Transportation Sector
For calculation of GHG emission reduction from each mitigation action in the transportation sector, there are additional forms that contain indicators, parameters, activity data as well as needed emission factors.
In the transportation sector, each mitigation action has additional forms containing data necessary for emission reduction calculation. The following is the general instruction to fill out GHG Emission Reduction Form of transportation sector.
• Calculationtableisdevelopedbyusingthreedifferentcolorswiththefollowingexplanation:
• Typesofvehiclesusedincalculationtablearearrangedbasedontheclassificationset by the BPS
- Passengers’ cars - Motorcycles - Buses - Trucks
• Datawhichistheconstantisfuelefficiency,theamountofvehicles’emissioninurban area (BAU) and emission factor.
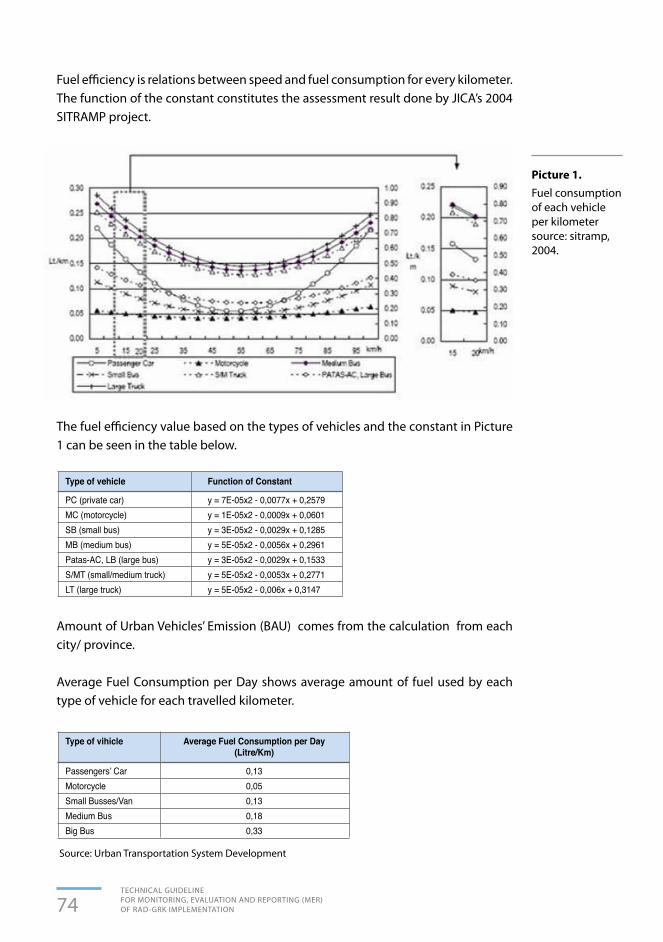
74TECHNICAL GUIDELINE FOR MONITORING, EVALUATION AND REPORTING (MER) OF RAD-GRK IMPLEMENTATION
Amount of Urban Vehicles’ Emission (BAU) comes from the calculation from each city/ province.
Average Fuel Consumption per Day shows average amount of fuel used by each type of vehicle for each travelled kilometer.
Fuel efficiency is relations between speed and fuel consumption for every kilometer. The function of the constant constitutes the assessment result done by JICA’s 2004 SITRAMP project.
Picture 1. Fuel consumption of each vehicle per kilometersource: sitramp, 2004.
The fuel efficiency value based on the types of vehicles and the constant in Picture 1 can be seen in the table below.
Type of vehicle Function of Constant
PC (private car) y = 7E-05x2 - 0,0077x + 0,2579MC (motorcycle) y = 1E-05x2 - 0,0009x + 0,0601SB (small bus) y = 3E-05x2 - 0,0029x + 0,1285MB (medium bus) y = 5E-05x2 - 0,0056x + 0,2961Patas-AC, LB (large bus) y = 3E-05x2 - 0,0029x + 0,1533S/MT (small/medium truck) y = 5E-05x2 - 0,0053x + 0,2771LT (large truck) y = 5E-05x2 - 0,006x + 0,3147
Type of vihicle Average Fuel Consumption per Day (Litre/Km)
Passengers’Car 0,13Motorcycle 0,05Small Busses/Van 0,13Medium Bus 0,18Big Bus 0,33
Source: Urban Transportation System Development

75TECHNICAL GUIDELINE
FOR MONITORING, EVALUATION AND REPORTING (MER) OF RAD-GRK IMPLEMENTATION
GHG emission factor or removals shows the amount of emission/removal per unit of activity done. Emission factor used is the one issued by PERTAMINA (2006) based on carbon content in fuel type.
Fuel Emission Factor
Petrol 2,6 kg CO2/litreDiesel Fuel 2,2 kg CO2/litre
3.2.3 Supporting Activity Form for Transportation Sector
The Supporting Activity Form for Transportation Sector is used to monitor and evaluate each mitigation action included in the supporting activity category, namely any activity predicted to generate GHG emission reduction indirectly. This form is filled out by the Central Government/ Provincial Governments/ City/District Governments based on their respective authorities.

76TECHNICAL GUIDELINE FOR MONITORING, EVALUATION AND REPORTING (MER) OF RAD-GRK IMPLEMENTATION
1 1 2
23
4a4b
5a6a
8b5c
7a8d
5b6b
8c5d
8a7b
8e
Code
RAD
LPJ
Prog
ram
/Act
ivity
RAD
LPJ
Qua
ntity
Qua
ntity
RAD
APBD
-PRA
DPH
LNUn
itUn
itAP
BNLP
JAP
BD-K
LPJ
Priv
ate
Sect
or
Fund
Miti
gatio
n Ac
tion
Loca
tion
(3)
Targ
et (4
)
RAD
LPJ
Budg
et
allo
catio
n pl
an(m
illio
n ru
piah
)
Budg
et
allo
catio
n pl
an(m
illio
n ru
piah
)
Fina
ncin
g So
urce
(mill
ion
rupi
ah)
FORM
3.2
.1 C
ore
Act
ivit
y Fo
rm fo
r Tra
nspo
rtat
ion
Sect
or
SEC
TOR
: TR
AN
SPO
RTAT
ION
CATA
GO
RY
:
YEA
R :
REPO
RTER
:
Cent
ral G
over
nmen
t M
inis
try
:
Prov
inci
al G
over
nmen
t Pr
ovin
ce
:
Dis
tric
t/Ci
ty G
over
nmen
t D
istr
ict/
City
:
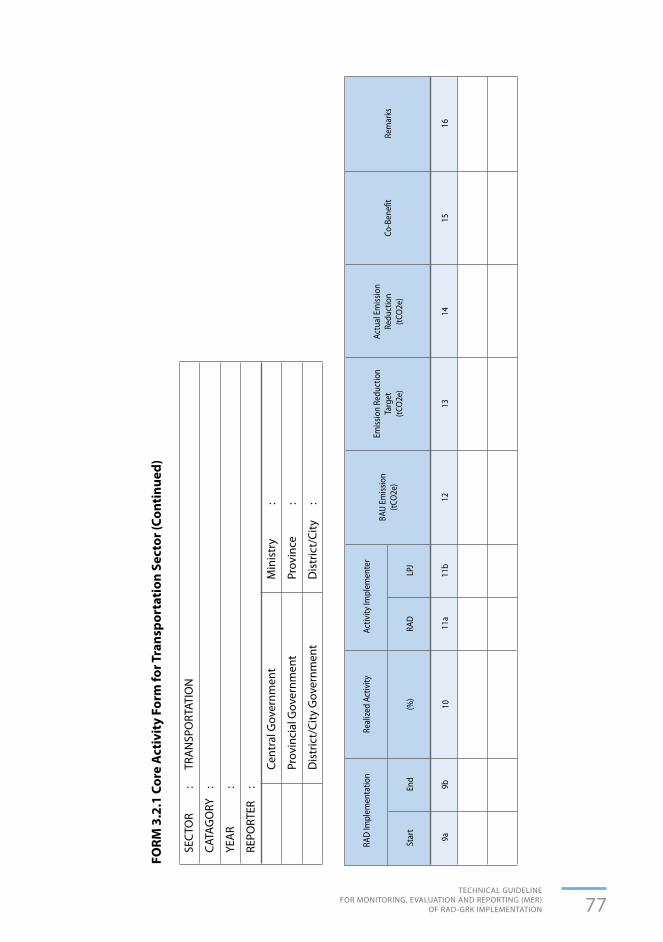
77TECHNICAL GUIDELINE
FOR MONITORING, EVALUATION AND REPORTING (MER) OF RAD-GRK IMPLEMENTATION
9b11
b9a
11a
1516
1314
12
End
LPJ
Star
tRA
D
RAD
Impl
emen
tatio
nRe
alize
d Ac
tivity
(%)
10
Activ
ity Im
plem
ente
r
BAU
Emiss
ion
(tC
O2e
)
Actu
al E
miss
ion
Redu
ctio
n (tC
O2e
)
Emiss
ion
Redu
ctio
n Ta
rget
(tCO
2e)
Co-B
enefi
tRe
mar
ks
FORM
3.2
.1 C
ore
Act
ivit
y Fo
rm fo
r Tra
nspo
rtat
ion
Sect
or (C
onti
nued
)
SEC
TOR
: TR
AN
SPO
RTAT
ION
CATA
GO
RY
:
YEA
R :
REPO
RTER
:
Cent
ral G
over
nmen
t M
inis
try
:
Prov
inci
al G
over
nmen
t Pr
ovin
ce
:
Dis
tric
t/Ci
ty G
over
nmen
t D
istr
ict/
City
:
78TECHNICAL GUIDELINE FOR MONITORING, EVALUATION AND REPORTING (MER) OF RAD-GRK IMPLEMENTATION
Instructions to fill in Form 3.2.1
The filling in of the form is conducted as follows:
1. Column 1 is filled with a number.
2. Column 2 is filled with the title of each mitigation action done (based on the authorities of each governmental level).
3. Column 3 is filled with the title of Program/Actvity based on LPJ related to the mitigation action in column 2.
4. Column 4 is filled with the location of the core mitigation action.
5. Column 5 is filled with the quantity of targeted implementation in RAD-GRK and in LPJ, and the unit of the quantity.
6. Column 6 is filled with budget allocation plan to carry out each mitigation action in the reporting year.
7. Column 7 is filled with budget use in the reporting year.
8. Column 8 is filled with financing source of mitigation action (APBN, Provincial APBD, District/City APBD, PHLN, Private sector fund).
9. Column 9 is filled with the implementation period of core mitigation action based on RAD-GRK.
10. Column 10 is filled with realization of mitigation action target based on RAD-GRK.
11. Column 11 is filled with the mitigation action implementing institution.
12. Column 12 is filled with total level of BAU Baseline GHG Emission pursuant to what is mentioned in the annex of Presidential Regulation (Perpres) 61/2011 and RAD-GRK document. If not possible, it should be filled with BAU Baseline by sector.
13. Column 13 is filled with GHG emission reduction target generated from each mitigation action (pursuant to what is mentioned in Presidential Regulation (Perpres) 61/2011 and RAD-GRK document).
14. Column 14 is filled with GHG emission reduction from the implementation of each mitigation action.
15. Column 15 is filled with information on co-benefit resulted by the mitigation action.
16. Column 16 is filled with other information or remarks deemed necessary to convey.

79TECHNICAL GUIDELINE
FOR MONITORING, EVALUATION AND REPORTING (MER) OF RAD-GRK IMPLEMENTATION
3.2.4 EMISSION CALCULATION FORM FOR TRANSPORTATION SECTOR
1. ITS (Intelligent Transportation Systems)
ITS is the technological use and its adjustment to engineering system concept in order to develop and improve all types of transportation systems. The GHG Reduction Calculation Form for the mitigation action below includes all parameters used and being within the corridor context where the ITS program is applied..
* Table on GHG emission reduction calculation form can be multiplied according to the number of ITS application locations.
** 2006 Pertamina Emission Factor is used by cities that have not developed BaU properly yet; the cities that have developed BaU can use the Emission Factor that was previously used.
INSTRUCTION TO FILL IN ITS MITIGATION ACTION DATA - Column 1, contains data on vehicle type.- Column 2, is filled with fuel type pursuant to the vehicle type (Petrol/Diesel Fuel).- Column 3 (P1), is filled with the average number of vehicles passing through ITS
application lane (unit/hour).- Column 4 (P2), contains the average number of operating days per year, namely
300 days.- Column 5 (P3), is filled with the average number of trips per day.- Column 6 (P4), is filled with the length of ITS application corridor (km).- Column 7 (P5), is filled with the average vehicle speed before ITS application (km/
hour).- Column 8 (P6), is filled with the average vehicle speed after ITS application (km/
hour).

80TECHNICAL GUIDELINE FOR MONITORING, EVALUATION AND REPORTING (MER) OF RAD-GRK IMPLEMENTATION
- Column 9 (P7), contains information on the average fuel consumption before ITS application based on vehicle speed and refers to Picture 1, Fuel Consumption of Each Vehicle per Kilometer (Liter/km). The column will be filled out automatically.
- Column 10 (P8), contains information on the average fuel consumption after ITS application based on vehicle speed and refers to Picture 1, Fuel Consumption of Each Vehicle per Kilometer (Liter/km). The column will be filled out automatically.
- Column 11 (P9), contains Emission Factor that shows the amount of CO2 emission according to the fuel type used (kgCO2/liter). The column will be filled out automatically if Column 2 has been completed.
- Column 12 (P10), contains total trip per year (Km). The column will be filled out automatically.
TOTAL TRIP PER YEAR (KM) = P1 X P2 X P3 X P4
- Column 13 (P11), contains CO2 emission per year before ITS application (TCO2e). The column will be filled out automatically.
CO2 EMISSION PER YEAR BEFORE APPLICATION = [P7 X P9 X P10]/1000 (TCO2e)
- Column 14 (P12), contains CO2 emission per year after ITS application (TCO2e). The column will be filled out automatically.
CO2 EMISSION PER YEAR AFTER APPLICATION = [P8 X P9 X P10]/1000 (TCO2e)
- Column 15, contains total CO2 emission reduction per year (TCO2e). The column will be filled out automatically.
EMISSION REDUCTION (TCO2e) = P11 – P12

81TECHNICAL GUIDELINE
FOR MONITORING, EVALUATION AND REPORTING (MER) OF RAD-GRK IMPLEMENTATION
2. MitigationActionofTrafficImpactControl Application (Andalalin)
Andalalin is an activity conducted to analyze traffic impacts caused by constructions of activity centers, settlement and other facilities which potentially bring about generation. The activity should be done before the constructions so that it can keep traffic condition safe, in order and running smoothly. However, Andalalin mitigation action aims to calculate reduced CO2 from the Andalalin application. Without Andalalin application, traffic congestion and disorder will result in the increase in CO2 emission from vehicle’s fuel combustion. The table in the GHG emission reduction calculation form can be multiplied according to the number of Andalalin application locations. The GHG emission reduction calculation form for Andalalin application’s mitigation action is as follows:
* The following table can be multiplied according to the number of Andalalin application zones (in reference to the exisiting Andalalin document)
** 2006 Pertamina Emission Factor is used by the cities that have not developed BaU properly
yet; the cities that have developed BaU can use the Emission Factor used previously.
INSTRUCTION TO FILL IN DATA ON MITIGATION ACTION OF TRAFFIC IMPACT CONTROL APPLICATION (ANDALALIN)- Column 1, is filled with the vehicle type.- Column 2, is filled with the fuel type according to the vehicle type.
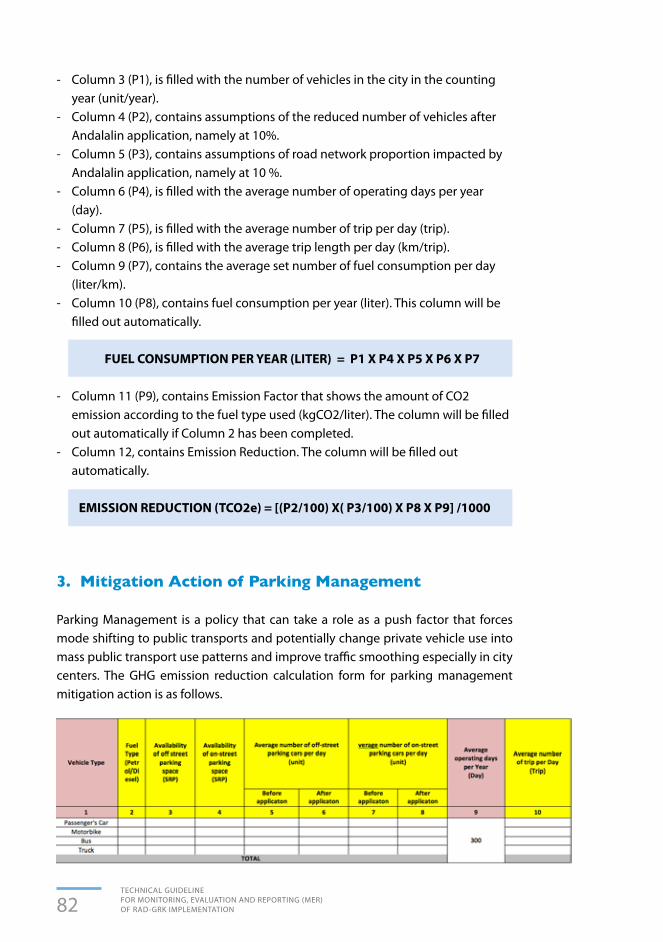
82TECHNICAL GUIDELINE FOR MONITORING, EVALUATION AND REPORTING (MER) OF RAD-GRK IMPLEMENTATION
- Column 3 (P1), is filled with the number of vehicles in the city in the counting year (unit/year).
- Column 4 (P2), contains assumptions of the reduced number of vehicles after Andalalin application, namely at 10%.
- Column 5 (P3), contains assumptions of road network proportion impacted by Andalalin application, namely at 10 %.
- Column 6 (P4), is filled with the average number of operating days per year (day).
- Column 7 (P5), is filled with the average number of trip per day (trip).- Column 8 (P6), is filled with the average trip length per day (km/trip).- Column 9 (P7), contains the average set number of fuel consumption per day
(liter/km).- Column 10 (P8), contains fuel consumption per year (liter). This column will be
filled out automatically.
FUEL CONSUMPTION PER YEAR (LITER) = P1 X P4 X P5 X P6 X P7
- Column 11 (P9), contains Emission Factor that shows the amount of CO2 emission according to the fuel type used (kgCO2/liter). The column will be filled out automatically if Column 2 has been completed.
- Column 12, contains Emission Reduction. The column will be filled out automatically.
EMISSION REDUCTION (TCO2e) = [(P2/100) X( P3/100) X P8 X P9] /1000
3. Mitigation Action of Parking Management
Parking Management is a policy that can take a role as a push factor that forces mode shifting to public transports and potentially change private vehicle use into mass public transport use patterns and improve traffic smoothing especially in city centers. The GHG emission reduction calculation form for parking management mitigation action is as follows.

83TECHNICAL GUIDELINE
FOR MONITORING, EVALUATION AND REPORTING (MER) OF RAD-GRK IMPLEMENTATION
* 2006 Pertamina Emission Factor is used by the cities that have not developed BaU properly yet; the cities that have developed BaU can use the Emission Factor used previously.
INSTRUCTION TO FILL IN DATA ON PARKING MANAGEMENT MITIGATION ACTION- Column 1, is filled with the vehicle type.- Column 2, is filled with the fuel type, namely petrol or diesel fuel. - Column 3 (P1), is filled with the availability of off-street parking space (parking
space unit).- column 4 (P2), is filled with the availability of on-street parking space (parking
space unit).- Column 5 (P3), is filled with the average number of vehicles do off street parking
per day before parking management application (unit)- Column 6 (P4), is filled with the average number of vehicles do off street parking
per day after parking management application (unit).- Column 7 (P5), is filled with the average number of vehicles do on street parking
per day before parking management application (unit).- Column 8 (P6), is filled with the average number of vehicles do on street parking
per day after parking management application (unit).- Column 9 (P7), contains the average number of operating days per year, namely
300 days.- Column 10 (P8), is filled with the average number of trips per day (trip).- Column 11 (P9), is filled with the average trip length per day (km/trip).- Column 12 (P10), contains the average set number of fuel consumption per day
(liter/km).- Column 13 (P11), contains off street fuel consumption per year before parking
management application (liter). The column will be filled out automatically.
OFF STREET FUEL CONSUMPTION PER YEAR BEFORE APPLICATION = P1 X P3 X P7 X P8 X P9 X P10 (LITER)
- Column 14 (P12), contains off street fuel consumption per year after parking management application (liter). The column will be filled out automatically.
OFF STREET FUEL CONSUMPTION PER YEAR AFTER APPLICATION = P1 X P4 X P7 X P8 X P9 X P10 (LITER)

84TECHNICAL GUIDELINE FOR MONITORING, EVALUATION AND REPORTING (MER) OF RAD-GRK IMPLEMENTATION
- Column 15 (P13), contains on street fuel consumption per year before parking management application (liter). The column will be filled out automatically.
ON STREET FUEL CONSUMPTION PER YEAR BEFORE APPLICATION = P2 X P5 X P7 X P8 X P9 X P10 (LITER)
- Column 16 (P14), contains on street fuel consumption per year after parking management application (liter). The column will be filled out automatically.
ON STREET FUEL CONSUMPTION PER YEAR AFTER APPLICATION = P2 X P6 X P7 X P8 X P9 X P10 (LITER)
- Column 17 (P15), contains Emission Factor that shows amount of CO2 emission according to the fuel type used (kgCO2/liter). The column will be filled out automatically if Column 2 has been completed.
- Column 18 (P16), contains off street emission per year. The column will be filled out automatically.
OFF STREET EMISSION REDUCTION (TCO2e) = [(P11-P12) X P15] /1000
- Column 19 (P17), contains on street emission per year. The column will be filled out automatically.
ON STREET EMISSION REDUCTION (TCO2e) = [(P13-P14) X P15] /1000
- Column 20, contains total emission reduction per year. This column will be filled out automatically.
TOTAL EMISSION REDUCTION (TCO2e) = P16+P17
4. Mitigation Action of Reformed Transit System – BRT System
Transit System is part of urban mass transports and is one of the transitional phases towards Bus Rapid Transit (BRT). The mitigation action aims to calculate CO2 emission reduction resulted from transport pattern change from private vehicles to mass public transports, in this case namely shifting to Transit System. The table on GHG emission reduction calculation form can be multiplied according to the number of corridors of Transit System- BRT System application. The GHG reduction calculation form for mitigation action of reformed transit system- BRT System is as follows:

85TECHNICAL GUIDELINE
FOR MONITORING, EVALUATION AND REPORTING (MER) OF RAD-GRK IMPLEMENTATION
* Table on GHG emission reduction calculation form can be multiplied according to the number of Transit System- BRT System application locations.
** 2006 Pertamina Emission Factor is used by the cities that have not developed BaU properly yet; the cities that have developed BaU can use the Emission Factor used previously.
*** Non-Bus Public Transports such as Water Bus, Bentor, Bajaj (if data is available).
INSTRUCTION TO FILL IN DATA ON MITIGATION ACTION OF REFORMED TRANSIT SYSTEM –BRT SYSTEM- Column 1 (P1), is filled with the number of transit system buses (unit).- Column 2 (P2), is filled with bus capacity (passengers).- Column 3 (P3), is filled with bus’ operations per day (return).- Column 4, contains type of private vehicle, namely car or motorcycle.- Column 5, contains the fuel type generally used by car and motorcycle, namely
petrol.- Column 6 (P4), is filled with modal shift (%). Modal Shift is obtained from direct survey result with respondents from users of
private vehicles, public transports and/or transit system buses.- Column 6A (P5), is filled with level of occupancy from each vehicle category. The
value is obtained from survey

86TECHNICAL GUIDELINE FOR MONITORING, EVALUATION AND REPORTING (MER) OF RAD-GRK IMPLEMENTATION
- Column 7 (P6), contains number of private vehicles shifting to public transports (unit).
NUMBER OF PRIVATE VEHICLES SHIFTING TO PUBLIC TRANSPORTS = (P1 X P2 X P3 X (P4/100))/P5
- Column 8 (P7), contains with average set number of operating days per year namely 300 days.
- Column 9 (P8), is filled with average trip per day (trip).- Column 10 (P9), is filled with average trip length per day (km/trip).- Column 11 (P10), contains average set number of fuel consumption per day
(liter/km).- Column 12 (P11), contains fuel consumption per year (liter). The column will be
filled out automatically.
FUEL CONSUMPTION PER YEAR (LITER) = P6 X P7 X P8 X P9 X P10
- Column 13 (P12), contains Emission Factor that shows the amount of CO2 emission according to fuel type used (kgCO2/liter). The column will be filled out automatically if Column 2 has been completed.
- Column 14 (P13), contains Emission reduction from shifting of motorized vehicles to BRT. The column will be filled out automatically.
EMISSION REDUCTION FROM SHIFTING OF MOTORIZED VEHICLES TO BRT (TCO2e) = [P1 X P3 X (P11/P4) X P12] /1000
- Column 15 (P14), contain BRT corridor’s length.- Column 16, contains fuel type used by BRT- Column 17 (P15), contains the economy of BRT’s filled fuel based on the
constant.- Column 18 (P16), contains total fuel consumption of operating BRT. The column
will be filled out automatically
TOTAL FUEL CONSUMPTION OF BRT (LITER) = (P1 X P3 X P7 X P14) X P15
- Column 19 (P17), contains emission factor (kg/L), constitutes the constant- Column 20 (P18), contains total CO2 from operational BRT. The column will be
filled out automatically
TOTAL CO2 OF OPERATIONAL BRT (TCO2) = (P16 X P17)/1000
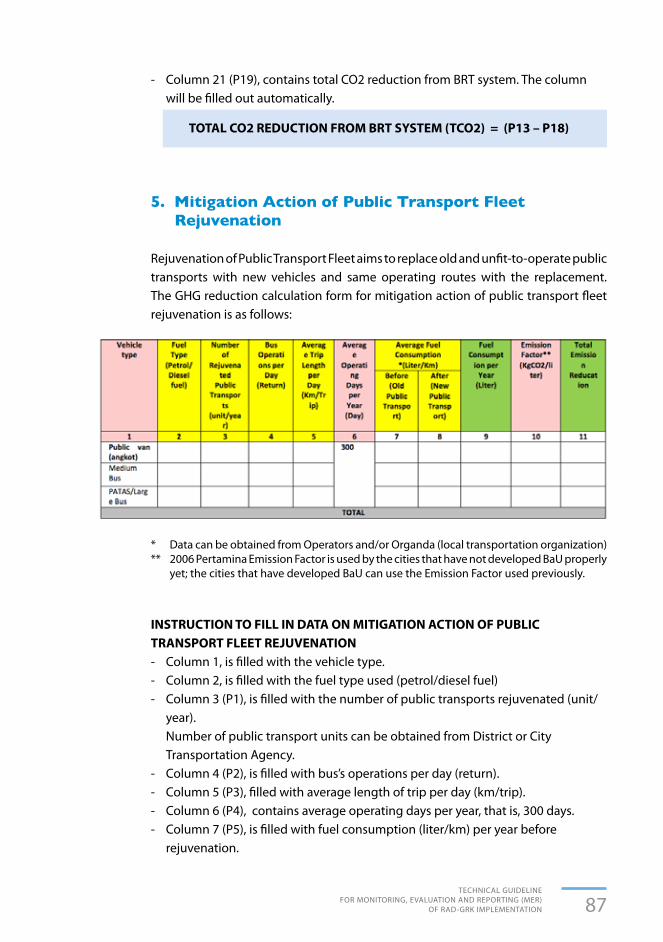
87TECHNICAL GUIDELINE
FOR MONITORING, EVALUATION AND REPORTING (MER) OF RAD-GRK IMPLEMENTATION
- Column 21 (P19), contains total CO2 reduction from BRT system. The column will be filled out automatically.
TOTAL CO2 REDUCTION FROM BRT SYSTEM (TCO2) = (P13 – P18)
5. Mitigation Action of Public Transport Fleet Rejuvenation
Rejuvenation of Public Transport Fleet aims to replace old and unfit-to-operate public transports with new vehicles and same operating routes with the replacement. The GHG reduction calculation form for mitigation action of public transport fleet rejuvenation is as follows:
* Data can be obtained from Operators and/or Organda (local transportation organization)** 2006 Pertamina Emission Factor is used by the cities that have not developed BaU properly
yet; the cities that have developed BaU can use the Emission Factor used previously.
INSTRUCTION TO FILL IN DATA ON MITIGATION ACTION OF PUBLIC TRANSPORT FLEET REJUVENATION- Column 1, is filled with the vehicle type.- Column 2, is filled with the fuel type used (petrol/diesel fuel)- Column 3 (P1), is filled with the number of public transports rejuvenated (unit/
year). Number of public transport units can be obtained from District or City
Transportation Agency. - Column 4 (P2), is filled with bus’s operations per day (return).- Column 5 (P3), filled with average length of trip per day (km/trip).- Column 6 (P4), contains average operating days per year, that is, 300 days.- Column 7 (P5), is filled with fuel consumption (liter/km) per year before
rejuvenation.

88TECHNICAL GUIDELINE FOR MONITORING, EVALUATION AND REPORTING (MER) OF RAD-GRK IMPLEMENTATION
- Column 8 (P6), is filled with fuel consumption (liter/km) per year after rejuvenation.
Fuel consumption data (liter/km) for public transports can be obtained from local Organda or public transport’s operator.
- Column 9 (P7), contains fuel consumption (liter).
FUEL CONSUMPTION REDUCTION (LITER) = P1 X P2 X P3 X P4 X (P5 - P6)
- Column 10 (P8), contains Emission Factor that shows the amount of CO2 emission according to the fuel type used (kgCO2/liter). The column will be filled out automatically if Column 2 has been completed.
- Column 11, contains Emission Reduction. The column will be filled out automatically.
EMISSION REDUCTION (TCO2e) = (P7 X P8)/1000
6. Mitigation Action of Motorized Vehicle Free Day (Car Free Day)
Car Free Day refers to activity that aims to reduce the number of vehicles on the set lanes and particular time. The GHG emission calculation form for mitigation action of motorized vehicle free day (Car Free Day) is as follows.

89TECHNICAL GUIDELINE
FOR MONITORING, EVALUATION AND REPORTING (MER) OF RAD-GRK IMPLEMENTATION
* 2006 Pertamina Emission Factor is used by the cities that have not developed BaU properly yet; the cities that have developed BaU can use the Emission Factor used previously.
INSTRUCTION TO FILL IN DATA ON MITIGATION ACTION OF MOTORIZED VEHICLE FREE DAY (CAR FREE DAY)- Column 1, is filled with the vehicle type.- Column 2, is filled with the fuel type.- Column 3 (P1), is filled with the average number of vehicles passing through
car-free day application lanes (unit/day).- Column 4 (P2), is filled with duration of car-free day implementation per day
(hour).- Column 5 (P3), is filled with the duration of car-free day implementation per
year (day).- Column 6 (P4), contains the average number of operating days per year, namely
300 days.- Column 7 (P5), is filled with the average number of trips per day (trip).- Column 8 (P6), is filled with the average trip length per day (km/trip).- Column 9 (P7), is filled with the average fuel consumption (liter/km) The average fuel consumption is obtained from the Organda or manual book
from vehicle’s dealer- Column 10 (P8), contains fuel consumption (liter)
FUEL CONSUMPTION (LITER) = P1 X [(P2 X P3)/24] X P4 X P5 X P6 X P7
- Column 11 (P9), contains Emission Factors that shows the amount of CO2 emission according to the fuel type used (kgCO2/liter). The column will be filled out automatically if Column 2 has been completed.
- Column 12, contains total CO2 emission reduction per year (TCO2e). The column will be filled out automatically.
EMISSION REDUCTION (TCO2e) = (P8 X P9)/1000
7. Smart Driving Mitigation Action(Eco- Driving)
Smart driving (eco-driving) aims to provide training on energy-efficient, environmentally-friendly, safe and comfortable driving behaviours to reach the most efficient fuel consumption. The GHG calculation form for smart driving mitigation action (eco-driving) is as follows:
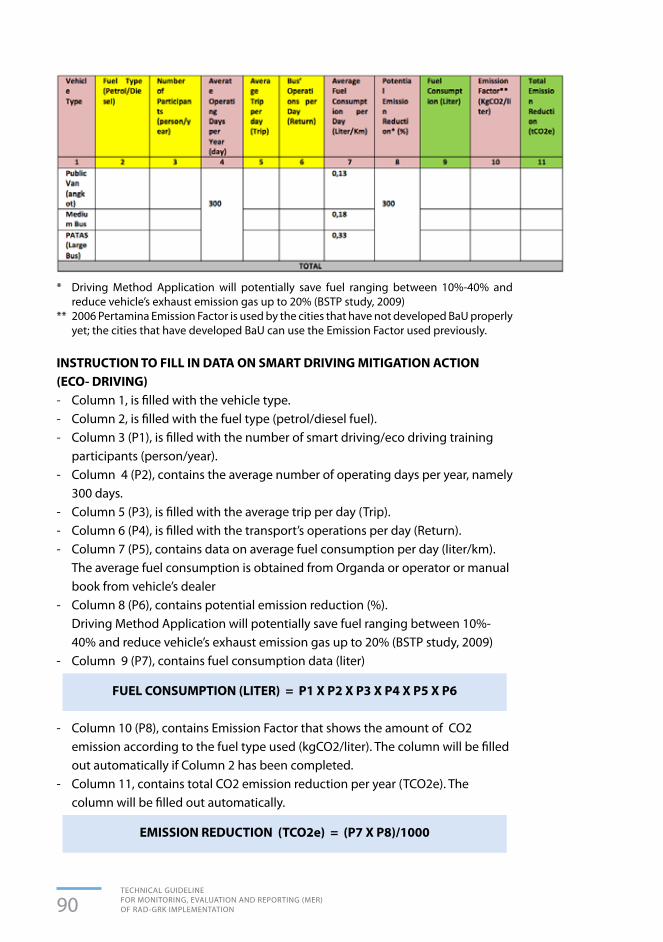
90TECHNICAL GUIDELINE FOR MONITORING, EVALUATION AND REPORTING (MER) OF RAD-GRK IMPLEMENTATION
* Driving Method Application will potentially save fuel ranging between 10%-40% and reduce vehicle’s exhaust emission gas up to 20% (BSTP study, 2009)
** 2006 Pertamina Emission Factor is used by the cities that have not developed BaU properly yet; the cities that have developed BaU can use the Emission Factor used previously.
INSTRUCTION TO FILL IN DATA ON SMART DRIVING MITIGATION ACTION (ECO- DRIVING)- Column 1, is filled with the vehicle type.- Column 2, is filled with the fuel type (petrol/diesel fuel).- Column 3 (P1), is filled with the number of smart driving/eco driving training
participants (person/year).- Column 4 (P2), contains the average number of operating days per year, namely
300 days.- Column 5 (P3), is filled with the average trip per day (Trip).- Column 6 (P4), is filled with the transport’s operations per day (Return).- Column 7 (P5), contains data on average fuel consumption per day (liter/km). The average fuel consumption is obtained from Organda or operator or manual
book from vehicle’s dealer- Column 8 (P6), contains potential emission reduction (%). Driving Method Application will potentially save fuel ranging between 10%-
40% and reduce vehicle’s exhaust emission gas up to 20% (BSTP study, 2009)- Column 9 (P7), contains fuel consumption data (liter)
FUEL CONSUMPTION (LITER) = P1 X P2 X P3 X P4 X P5 X P6
- Column 10 (P8), contains Emission Factor that shows the amount of CO2 emission according to the fuel type used (kgCO2/liter). The column will be filled out automatically if Column 2 has been completed.
- Column 11, contains total CO2 emission reduction per year (TCO2e). The column will be filled out automatically.
EMISSION REDUCTION (TCO2e) = (P7 X P8)/1000

91TECHNICAL GUIDELINE
FOR MONITORING, EVALUATION AND REPORTING (MER) OF RAD-GRK IMPLEMENTATION
1 1 2
Spee
d lim
it on
toll
road
Tree
pla
ntin
g
23
4a4b
5a6a
5c7a
5b6b
5d7b
Code
RAD
LPJ
Prog
ram
/Act
ivity
RAD
LPJ
Qua
ntity
Qua
ntity
RAD
RAD
Unit
Unit
LPJ
LPJ
Miti
gatio
n Ac
tion
Loca
tion
(3)
Targ
et (4
)
RAD
LPJ
Budg
et a
lloca
tion
plan
(m
illio
n ru
piah
)Bu
dget
use
(mill
ion
rupi
ah)
FORM
3.2
.3 S
uppo
rtin
g A
ctiv
ity
Form
for T
rans
port
atio
n Se
ctor
SEC
TOR
: TR
AN
SPO
RTAT
ION
CATA
GO
RY
:
YEA
R :
REPO
RTER
:
Cent
ral G
over
nmen
t M
inis
try
:
Prov
inci
al G
over
nmen
t Pr
ovin
ce
:
Dis
tric
t/Ci
ty G
over
nmen
t D
istr
ict/
City
:

92TECHNICAL GUIDELINE FOR MONITORING, EVALUATION AND REPORTING (MER) OF RAD-GRK IMPLEMENTATION
8a8b
8c9b
11b
8d8e
9a11
a12
APBN
APBD
-PAP
BD-K
Priv
ate
Sect
or Fu
ndEn
dLP
JPH
LNSt
art
RAD
Fina
ncin
g So
urce
(mill
ion
rupi
ah)
RAD
Impl
emen
tatio
nRe
alize
d Ac
tivity
(%)
10
Activ
ity Im
plem
ente
r
Core
Act
ivity
supp
orte
d
FORM
3.2
.3 S
uppo
rtin
g A
ctiv
ity
Form
for T
rans
port
atio
n Se
ctor
(Con
tinu
atio
n)
SEC
TOR
: TR
AN
SPO
RTAT
ION
CATA
GO
RY
:
YEA
R :
REPO
RTER
:
Cent
ral G
over
nmen
t M
inis
try
:
Prov
inci
al G
over
nmen
t Pr
ovin
ce
:
Dis
tric
t/Ci
ty G
over
nmen
t D
istr
ict/
City
:
93TECHNICAL GUIDELINE
FOR MONITORING, EVALUATION AND REPORTING (MER) OF RAD-GRK IMPLEMENTATION
Instructions to fill in Form 3.2.3
The form should be filled in with the following step:
i. Column 1 is filled with the number of each mitigation action.
ii. Column 2 is filled with the title of each mitigation action done (based on the authorities of each governmental level).
iii. Column 3 is filled with the title of Program/Actvity based on LPJ related to the mitigation action in column 2.
iv. Column 4 is filled with the location of supporting mitigation action.
v. Column 5 is filled with the quantity of targeted implementation in RAD-GRK and in LPJ, and the unit of the quantity.
vi. Column 6 is filled with budget allocation plan to carry out each mitigation action in the reporting year.
vii. Column 7 is filled with budget use in the reporting year.
viii. Column 8 is filled with financing source of mitigation action (APBN, Provincial APBD, District/District APBD, PHLN, Private sector fund).
ix. Column 9 is filled with the implementation period of supporting mitigation action based on RAD-GRK.
x. Column 10 is filled with realization of the achievement of supporting mitigation action target, based on RAD-GRK.
xi. Column 11 is filled with the mitigation action implementing institution.
xii. Column 12 is filled with relevant core activity which is supported.

94TECHNICAL GUIDELINE FOR MONITORING, EVALUATION AND REPORTING (MER) OF RAD-GRK IMPLEMENTATION

95TECHNICAL GUIDELINE
FOR MONITORING, EVALUATION AND REPORTING (MER) OF RAD-GRK IMPLEMENTATION
Reporting implementation is conducted by filling in MER forms presented in this Chapter. For filling in the forms, it is absolutely necessary to have the newest document of Accountability Report (LPJ) on provincial/city/district APBD (local government budget). The LPJ is absolutely required to identify activities at the provincial/city/district levels. Without the LPJ, the completed activities cannot be identified, so that it is not possible to fill in the Reporting forms.
MER Implementation of the waste management sector GHG mitigation actions consists of two parts: (1) domestic solid waste sub-sector, and (2) domestic liquid waste sub-sector. Mitigation actions in each sector can be classified into: 1) Core activity Group, namely activities with directly impact on GHG emission
reduction, and2) Supporting Activity Group, namely activities with indirect impact on emission
reduction; however this group serves as constitutes important element for successful implementation of core activities in the waste management sector emission reduction efforts.
4.1 DOMESTIC SOLID WASTE SUB-SECTOR
Based on the RAN and RAD-GRK documents, domestic solid waste sub-sector core activities are generally grouped into two:(1) Improvement in landfill facilities;(2) 3 R activity implementation (Reduce, Reuse, Recycle)
CHAPTER 4TECHNICAL GUIDELINEFOR WASTE MANAGEMENT SECTOR

96TECHNICAL GUIDELINE FOR MONITORING, EVALUATION AND REPORTING (MER) OF RAD-GRK IMPLEMENTATION
Meanwhile, the supporting mitigation activities of domestic solid waste subsector, based on RAN and RAD-GRK can be categorized into three: (1) Institutional and regulation development, (2) Human resources capacity development, and (3) Incentive and disincentive system development.
Besides MER forms for Core activities and Supporting Activities there are GHG Inventory Forms that function as additional forms for supporting GHG inventory in the waste sector. The indicators used in the GHG inventory forms of domestic waste sub-sector include:- Number of population, population composition based on income, produced
waste, waste composition, waste management method and facilities;- Daily garbage piles produced in each district/city and annual garbage piles;- Composition and contents of garbage dry materials in each district/city areas
take the form of food garbage, paper, diapers, wood, park garbage, textile products, rubber, plastic, metal, glass and other types of garbage.
- Quantity of garbage treated with various methods: garbage transported to Landfill (TPA), composted garbage, recycled garbage, burned garbage and unmanaged garbage (dumped in any place);
- Information on the number and type of Landfills (TPA) in district/city consisting of Unmanaged Shallow (US), Unmanaged Deep (UD), Managed Anaerobic (MA), and Managed Semi Aerobic (MS).
Notes on Landfill (TPA) types based on the 2006 IPCC GL, namely:a) US = Un-managed Shallow = the height of garbage pile in TPA is less than 5
meters and deep ground water surface.b) UN = Un-managed Deep = the height of garbage pile in TPA is more than 5
meters or shallow ground water surface.c) MA = Anaerobic – Managed TPA = There is arrangement of pile location, at
least has one of the following (a) covering layer, (b) mechanic compaction, (c) garbage pile height limit.
d) MS = Semi-aerobic TPA = there is pile location arrangement, has structures that enable air to pass through garbage pile, namely (a) permeable covering layer, (b) leaching system, (c) regulating pond age and (d) gas ventilation system.
- Number of 3R facilities and composting facilities available in district/city.
Inventory conducted at the District/City level will then be compiled at the Provincial and National Levels by using different Inventory Forms.

97TECHNICAL GUIDELINE
FOR MONITORING, EVALUATION AND REPORTING (MER) OF RAD-GRK IMPLEMENTATION
18
29
511
143
106
154
137
1216
No.
Title
of M
itiga
tion
Actio
n/ C
ore
Activ
ityLo
catio
nBu
dget
allo
catio
n in
RAD
-GRK
(rupi
ah)
Impl
emen
ter
Budg
et u
se b
ased
on
Sour
ces (
Rupi
ah)
Targ
et
RAD
-GRK
RAD
-GRK
RAD
-GRK
APBN
City
/ Di
stric
t AP
BDQ
uant
ityQ
uant
ityLP
JLP
J
LPJ
Prov
inci
al
APBD
PH
LNPr
ivat
eSe
ctor
Fund
Unit
Unit
FORM
4.1
.1 C
ore
Act
ivit
y Fo
rm fo
r Dom
esti
c So
lid W
aste
Sub
-Sec
tor
SEC
TOR
: W
AST
E M
AN
AG
EMEN
T
CATA
GO
RY
: D
omes
tic S
olid
Was
te
YEA
R :
REPO
RTER
:
Cent
ral G
over
nmen
t M
inis
try
:
Prov
inci
al G
over
nmen
t Pr
ovin
ce
:
Dis
tric
t/Ci
ty G
over
nmen
t D
istr
ict/
City
:

98TECHNICAL GUIDELINE FOR MONITORING, EVALUATION AND REPORTING (MER) OF RAD-GRK IMPLEMENTATION
1722
1819
2324
2120
Key
perfo
rman
ce
indi
cato
r
Co-B
enefi
tSu
ppor
ting
Info
rmat
ion
GHG
Emiss
ion
Redu
ctio
n(to
n CO
2e)
Qua
ntity
Det
ails
BAU
Base
line
GHG
Emiss
ions
(ton
CO2e
)Un
it
GHG
Emiss
ions
with
M
itiga
tion
Actio
n(to
n CO
2e)
FORM
4.1
.1 C
ore
Act
ivit
y Fo
rm fo
r Dom
esti
c So
lid W
aste
Sub
-Sec
tor (
Cont
inua
tion
)
SEC
TOR
: W
AST
E M
AN
AG
EMEN
T
CATA
GO
RY
: D
omes
tic S
olid
Was
te
YEA
R :
REPO
RTER
:
Cent
ral G
over
nmen
t M
inis
try
:
Prov
inci
al G
over
nmen
t Pr
ovin
ce
:
Dis
tric
t/Ci
ty G
over
nmen
t D
istr
ict/
City
:

99TECHNICAL GUIDELINE
FOR MONITORING, EVALUATION AND REPORTING (MER) OF RAD-GRK IMPLEMENTATION
Instructions to fill in Form 4.1.1
This core activity form is used for monitoring and evaluating each mitigation action categorized as core activities that produce GHG emission reduction directly. The form is filled by The Central Government/ Provincial Governments/ District/City Governments twice a year based on their respective authorities. The form should be filled in with the following step:
1. Column 1 is filled with a number.
2. Column 2 is filled with the title of each of the completed mitigation actions/ activities in provincial RAD-GRK document.
3. Column 3 is filled with the title of each of the completed mitigation actions/ activities in the LPJ of provincial/ city-district local budget (APBD).
4. Column 4 is filled with location of mitigation action/activity in RAD-GRK document.
5. Column 5 is filled with location of mitigation action/activity in LPJ document.
6. Column 6 is filled with the quantity of targeted implementation in RAD-GRK.
7. Column 7 is filled with the unit of the quantity of targeted implementation, corresponding column no.6.
8. Column 8 is filled with the quantity of targeted implementation in LPJ.
9. Column 9 is filled with the unit of the quantity of targeted implementation, corresponding column no.8.
10. Column 10 is filled with budget allocation in RAD-GRK to carry out the mitigation activities.
11. Column 11 is filled with activity implementing institutions.
12. Column 12 is filled with budget use with the State Budget (APBN) fund source.
13. Column 13 is filled with budget use with Provincial Local Government Budget (APBD) fund source.
14. Column 14 is filled with budget use with District/City Local Government Budget (APBD) fund source.
15. Column 15 is filled with budget use from Foreign Grant and Loan (PHLN) fund source.
16. Column 16 is filled with budget use from Private fund source.
17. Column 17 is filled with key performance indicator explanation on each mitigation action.
18. Column 18 is filled with the quantity of key performance indicator on each mitigation action.
19. Column 19 is filled with Unit of Key performance indicator on each mitigation action.
20. Column 20 is filled with GHG emission reduction produced from each mitigation action.
100TECHNICAL GUIDELINE FOR MONITORING, EVALUATION AND REPORTING (MER) OF RAD-GRK IMPLEMENTATION
21. Column 21 is filled with BAU baseline emission status for waste sector in the reporting year. See provincial RAD-GRK document to get this data.
22. Column 22 is filled with estimated GHG emission for waste sector in the reporting year, if mitigation actions are implemented. The 2006 IPCC GL Spreadsheet is used in conducting estimation of GHG emission reduction from outcome/IKK (key performance indicator) of each completed activity.
23. Column 23 is filled with information on co-benefits resulted by mitigation action.
24. Column 24 is filled with other various information deemed necessary to convey as related to mitigation action implementation.
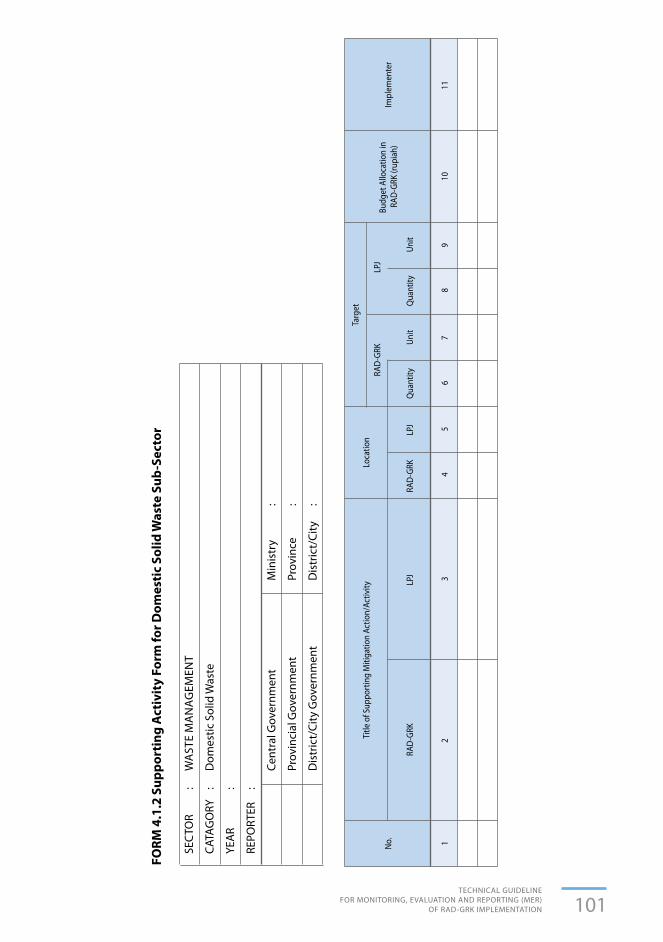
101TECHNICAL GUIDELINE
FOR MONITORING, EVALUATION AND REPORTING (MER) OF RAD-GRK IMPLEMENTATION
16
82
79
311
104
5
No.
Title
of S
uppo
rtin
g M
itiga
tion
Actio
n/Ac
tivity
Budg
et A
lloca
tion
in R
AD-G
RK (r
upia
h)Im
plem
ente
r
Targ
et
RAD
-GRK
Loca
tion
RAD
-GRK
Qua
ntity
Qua
ntity
LPJ
RAD
-GRK
LPJ
LPJ
Unit
Unit
FORM
4.1
.2 S
uppo
rtin
g A
ctiv
ity
Form
for D
omes
tic
Solid
Was
te S
ub-S
ecto
r
SEC
TOR
: W
AST
E M
AN
AG
EMEN
T
CATA
GO
RY
: D
omes
tic S
olid
Was
te
YEA
R :
REPO
RTER
:
Cent
ral G
over
nmen
t M
inis
try
:
Prov
inci
al G
over
nmen
t Pr
ovin
ce
:
Dis
tric
t/Ci
ty G
over
nmen
t D
istr
ict/
City
:
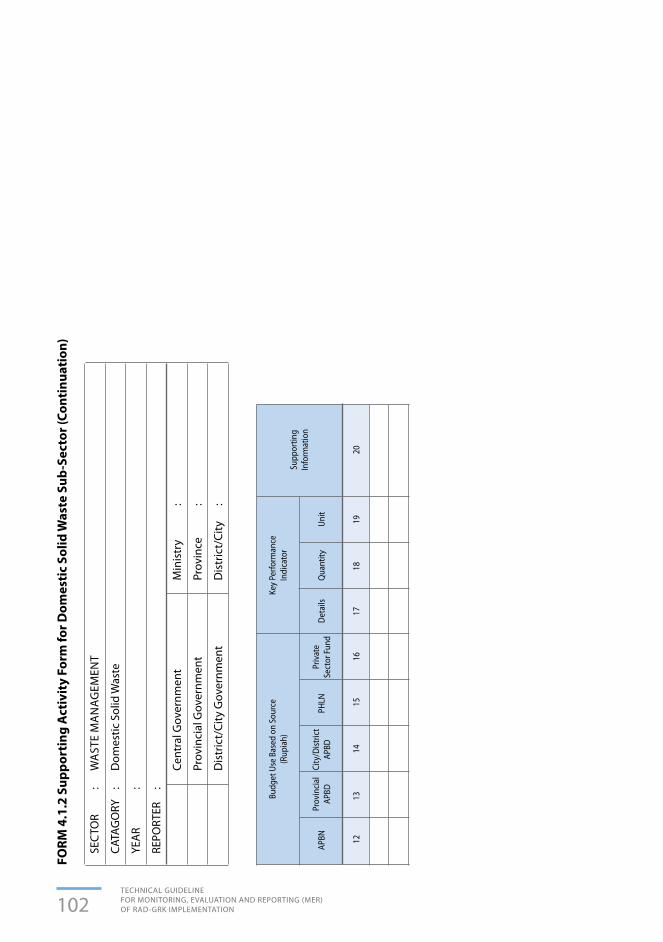
102TECHNICAL GUIDELINE FOR MONITORING, EVALUATION AND REPORTING (MER) OF RAD-GRK IMPLEMENTATION
1415
1312
16
Budg
et U
se B
ased
on
Sour
ce
(Rup
iah)
APBN
City
/Dist
rict
APBD
Prov
inci
al
APBD
PHLN
Priv
ate
Sect
or Fu
nd
1718
1920
Key
Perfo
rman
ce
Indi
cato
rSu
ppor
ting
Info
rmat
ion
Qua
ntity
Det
ails
Unit
FORM
4.1
.2 S
uppo
rtin
g A
ctiv
ity
Form
for D
omes
tic
Solid
Was
te S
ub-S
ecto
r (Co
ntin
uati
on)
SEC
TOR
: W
AST
E M
AN
AG
EMEN
T
CATA
GO
RY
: D
omes
tic S
olid
Was
te
YEA
R :
REPO
RTER
:
Cent
ral G
over
nmen
t M
inis
try
:
Prov
inci
al G
over
nmen
t Pr
ovin
ce
:
Dis
tric
t/Ci
ty G
over
nmen
t D
istr
ict/
City
:
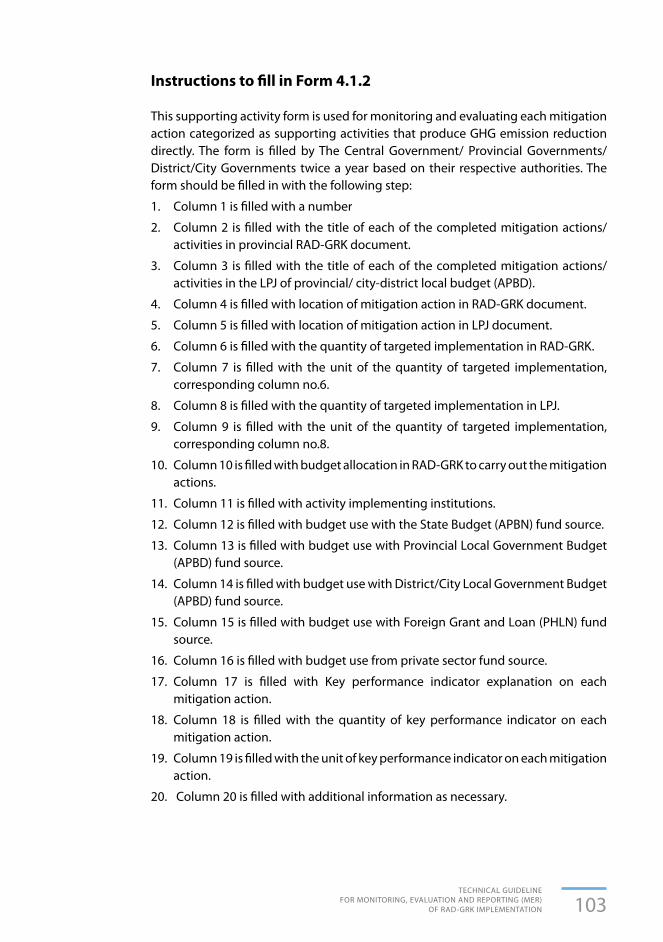
103TECHNICAL GUIDELINE
FOR MONITORING, EVALUATION AND REPORTING (MER) OF RAD-GRK IMPLEMENTATION
Instructions to fill in Form 4.1.2
This supporting activity form is used for monitoring and evaluating each mitigation action categorized as supporting activities that produce GHG emission reduction directly. The form is filled by The Central Government/ Provincial Governments/ District/City Governments twice a year based on their respective authorities. The form should be filled in with the following step:
1. Column 1 is filled with a number
2. Column 2 is filled with the title of each of the completed mitigation actions/ activities in provincial RAD-GRK document.
3. Column 3 is filled with the title of each of the completed mitigation actions/ activities in the LPJ of provincial/ city-district local budget (APBD).
4. Column 4 is filled with location of mitigation action in RAD-GRK document.
5. Column 5 is filled with location of mitigation action in LPJ document.
6. Column 6 is filled with the quantity of targeted implementation in RAD-GRK.
7. Column 7 is filled with the unit of the quantity of targeted implementation, corresponding column no.6.
8. Column 8 is filled with the quantity of targeted implementation in LPJ.
9. Column 9 is filled with the unit of the quantity of targeted implementation, corresponding column no.8.
10. Column 10 is filled with budget allocation in RAD-GRK to carry out the mitigation actions.
11. Column 11 is filled with activity implementing institutions.
12. Column 12 is filled with budget use with the State Budget (APBN) fund source.
13. Column 13 is filled with budget use with Provincial Local Government Budget (APBD) fund source.
14. Column 14 is filled with budget use with District/City Local Government Budget (APBD) fund source.
15. Column 15 is filled with budget use with Foreign Grant and Loan (PHLN) fund source.
16. Column 16 is filled with budget use from private sector fund source.
17. Column 17 is filled with Key performance indicator explanation on each mitigation action.
18. Column 18 is filled with the quantity of key performance indicator on each mitigation action.
19. Column 19 is filled with the unit of key performance indicator on each mitigation action.
20. Column 20 is filled with additional information as necessary.
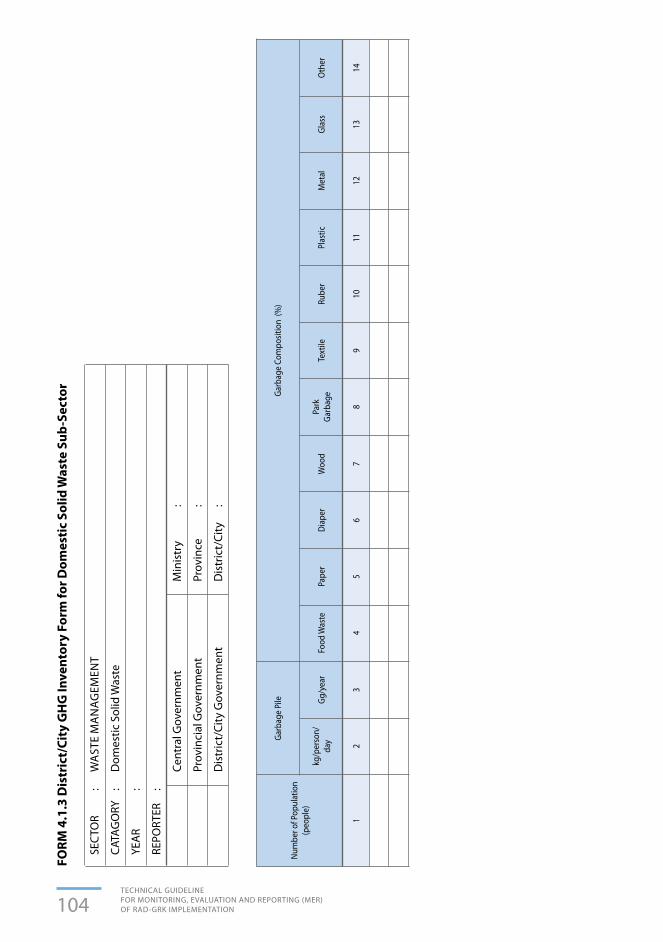
104TECHNICAL GUIDELINE FOR MONITORING, EVALUATION AND REPORTING (MER) OF RAD-GRK IMPLEMENTATION
12
610
48
123
711
59
1314
Num
ber o
f Pop
ulat
ion
(peo
ple)
Garb
age
Pile
kg/p
erso
n/da
yDi
aper
Rube
rFo
od W
aste
Park
Ga
rbag
eM
etal
Gg/y
ear
Woo
dPl
astic
Pape
rTe
xtile
Glas
sO
ther
Garb
age
Com
posit
ion
(%)
FORM
4.1
.3 D
istr
ict/
City
GH
G In
vent
ory
Form
for D
omes
tic
Solid
Was
te S
ub-S
ecto
r
SEC
TOR
: W
AST
E M
AN
AG
EMEN
T
CATA
GO
RY
: D
omes
tic S
olid
Was
te
YEA
R :
REPO
RTER
:
Cent
ral G
over
nmen
t M
inis
try
:
Prov
inci
al G
over
nmen
t Pr
ovin
ce
:
Dis
tric
t/Ci
ty G
over
nmen
t D
istr
ict/
City
:
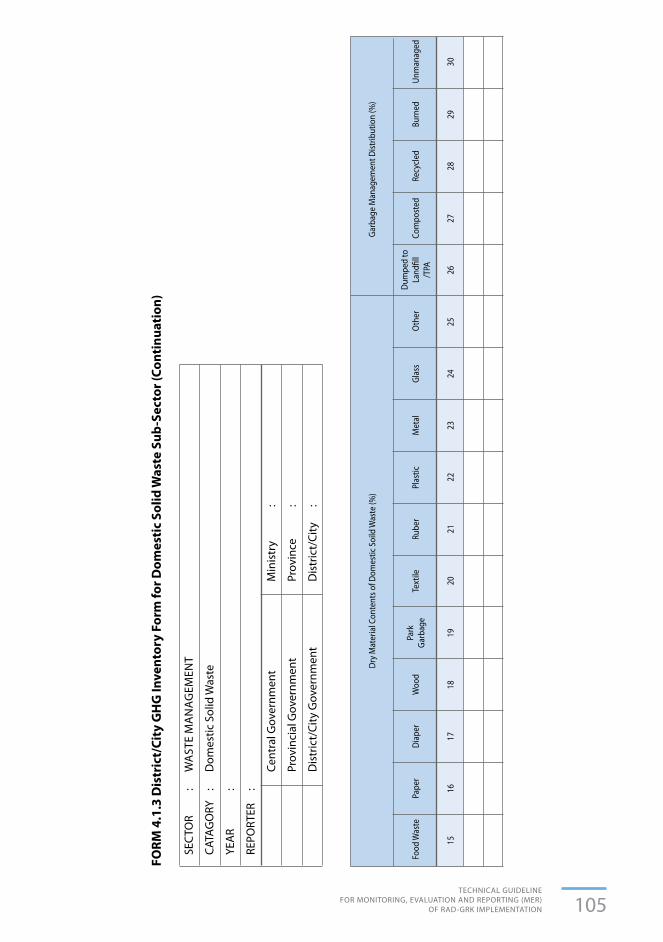
105TECHNICAL GUIDELINE
FOR MONITORING, EVALUATION AND REPORTING (MER) OF RAD-GRK IMPLEMENTATION
1815
2226
2017
2428
1916
2327
2125
2930
Dry
Mat
eria
l Con
tent
s of D
omes
tic S
oild
Was
te (%
)
Food
Was
teDi
aper
Rube
rD
umpe
d to
La
ndfil
l/T
PA
Park
Garb
age
Met
alRe
cycl
edPa
per
Woo
dPl
astic
Com
post
edTe
xtile
Glas
sBu
rned
Oth
erUn
man
aged
Garb
age
Man
agem
ent D
istrib
utio
n (%
)
FORM
4.1
.3 D
istr
ict/
City
GH
G In
vent
ory
Form
for D
omes
tic
Solid
Was
te S
ub-S
ecto
r (Co
ntin
uati
on)
SEC
TOR
: W
AST
E M
AN
AG
EMEN
T
CATA
GO
RY
: D
omes
tic S
olid
Was
te
YEA
R :
REPO
RTER
:
Cent
ral G
over
nmen
t M
inis
try
:
Prov
inci
al G
over
nmen
t Pr
ovin
ce
:
Dis
tric
t/Ci
ty G
over
nmen
t D
istr
ict/
City
:

106TECHNICAL GUIDELINE FOR MONITORING, EVALUATION AND REPORTING (MER) OF RAD-GRK IMPLEMENTATION
3331
3741
3532
3934
3836
40
Garb
age
Man
agem
ent F
acili
ty
Nam
e of
La
ndfil
l(T
PA)
m3/
day
MA
USQ
uant
ity(U
nit)
Qua
ntity
(Uni
t)To
nM
SUD
Land
fill (
TPA)
Di
strib
utio
n ba
sed
on
Type
(%)
Tota
l M
anag
emen
t Ca
paci
ty
(ton/
year
)
Aver
age
garb
age
volu
me
to L
andfi
ll (T
PA)
3R Fa
cilit
yCo
mpo
stin
g Fa
cilit
yLa
ndfil
l (TP
A) D
istrib
utio
n ba
sed
on Ty
pe (%
)
FORM
4.1
.3 D
istr
ict/
City
GH
G In
vent
ory
Form
for D
omes
tic
Solid
Was
te S
ub-S
ecto
r (Co
ntin
uati
on)
SEC
TOR
: W
AST
E M
AN
AG
EMEN
T
CATA
GO
RY
: D
omes
tic S
olid
Was
te
YEA
R :
REPO
RTER
:
Cent
ral G
over
nmen
t M
inis
try
:
Prov
inci
al G
over
nmen
t Pr
ovin
ce
:
Dis
tric
t/Ci
ty G
over
nmen
t D
istr
ict/
City
:

107TECHNICAL GUIDELINE
FOR MONITORING, EVALUATION AND REPORTING (MER) OF RAD-GRK IMPLEMENTATION
Instructions to fill in Form 4.1.3
This District/City Indicator Form for domestic solid waste sub-sector is earmarked for monitoring and evaluating indicators related to GHG emission from domestic solid waste at the District/City level each year. The form is filled by The District/City Governments under supervision of Provincial Governments. The form should be filled in with the following step:
1. Column 1 is filled with the population number in each District/City every year. The number of population can use the data from local BPS (Local Bureau of Statistics).
2. Columns 2 and 3 are filled with garbage pile average daily produced in each district/ city as well as yearly garbage pile. Ideally, the number is obtained from surveys in each district/city areas, but if it is not available average data in related province can be used.
3. Columns 4 through 14 are filled with waste composition in each district/city areas like food waste, paper, diapers, wood, park garbage, textile products, rubber, plastic, metal, glass and other.
4. Columns 15 through 25 are filled with garbage dry material content in each district/city area such as garbage, food waste, paper, diaper, wood, park garbage, textile product, rubber, plastic, metal, glass, etc.
5. Ideally, composition number and dry material contents are obtained from surveys done in each district/city. But in the initial phase average number in related provinces can be used.
6. Columns 26, 27, 28, 29 and 30 are filled with the number of garbage managed by various methods such as garbage transported to Landfill (TPA), garbage that is composted, garbage that is recycled, garbage that is burned as well as garbage that is not managed yet (dumped in any place).
7. Columns 31, 32, 33 are filled with information on name and average volume of garbage entering Landfill (TPA) in district/city.
8. Columns 34, 35, 36, and 37 are filled with information on the number of Landfills in district/city whose type consists from Unmanaged Shallow (US), Unmanaged Deep (UD), Managed Anaerobic (MA) and Managed Semi Aerobic (MS).
9. Columns 38 and 39 are filled with information on the total number and capacity from 3R facilities available in district/city. These facilities can take the form of Integrated 3R Waste Management Facilities, Garbage Bank, or the others.
10. Columns 40 and 41 are filled with the total number and capacity of composting facilities available in district/city.
The data to be filled in the indicator form can be obtained from:
a. Provincial RAD-GRK Reports.
b. Provincial GHG Inventory Reports.

108TECHNICAL GUIDELINE FOR MONITORING, EVALUATION AND REPORTING (MER) OF RAD-GRK IMPLEMENTATION
c. Susenas (National Social Economic Survey) Result on Sanitation Data from Central Bureau of Statistics (BPS).
d. Waste Water & Waste Study (EHRA) by Bappeda (local development planning agency) for the development of City/District White Book .
e. Garbage Management Performance Data from BLH (Environmental Agency) for Adipura scoring.
f. Performance Data/ Annual Report/Profiles of District/City Dinas/Agency/UPTD(Regional Technical Implementing Unit)/City Cleanliness Division.
g. Performance Data/Annual Report/Profiles of City/District Environmental Agency.
h. Waste Master Plan/Outline Plan
i. Waste Water Master Plan/Outline Plan.
j. White Book K/K available in Working Unit of Environmental and Settlement Sanitation/ Bappeda’s PPSP (Housing Sanitation Development Acceleration) Working Group.
k. City Sanitation Strategy in Environmental and Settlement Sanitation Working Group/ Bappeda’s PPSP (Housing Sanitation Development Acceleration) Working Group
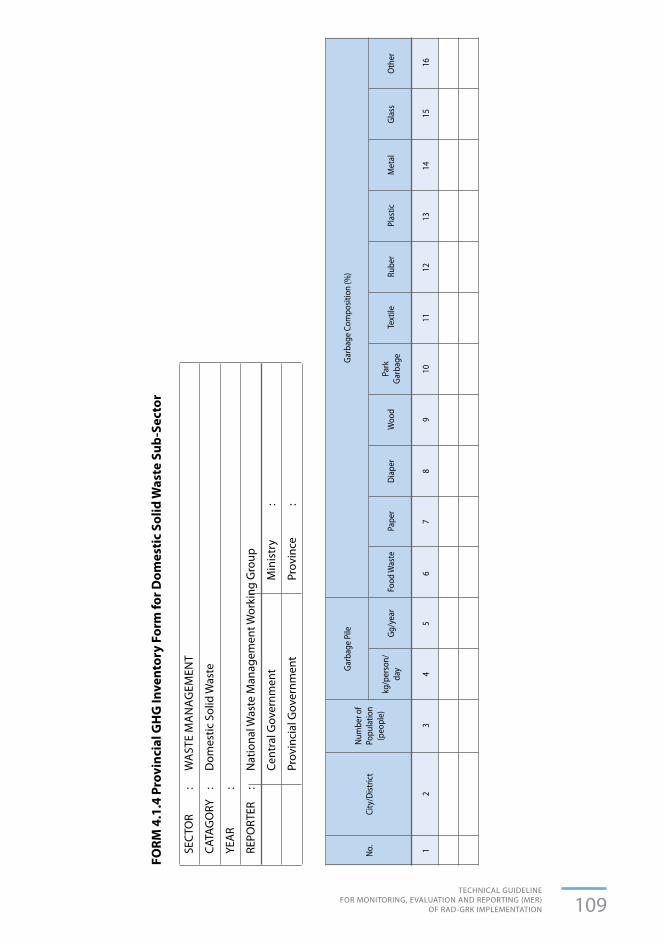
109TECHNICAL GUIDELINE
FOR MONITORING, EVALUATION AND REPORTING (MER) OF RAD-GRK IMPLEMENTATION
1No.
26
104
812
37
115
913
1514
16
City
/Dist
rict
Num
ber o
f Po
pula
tion
(peo
ple)
Garb
age
Pile
kg/p
erso
n/da
yDi
aper
Rube
rFo
od W
aste
Park
Ga
rbag
eM
etal
Gg/y
ear
Woo
dPl
astic
Pape
rTe
xtile
Glas
sO
ther
Garb
age
Com
posit
ion
(%)
FORM
4.1
.4 P
rovi
ncia
l GH
G In
vent
ory
Form
for D
omes
tic
Solid
Was
te S
ub-S
ecto
r
SEC
TOR
: W
AST
E M
AN
AG
EMEN
T
CATA
GO
RY
: D
omes
tic S
olid
Was
te
YEA
R :
REPO
RTER
:
Nat
iona
l Was
te M
anag
emen
t Wor
king
Gro
up
Cent
ral G
over
nmen
t M
inis
try
:
Prov
inci
al G
over
nmen
t Pr
ovin
ce
:
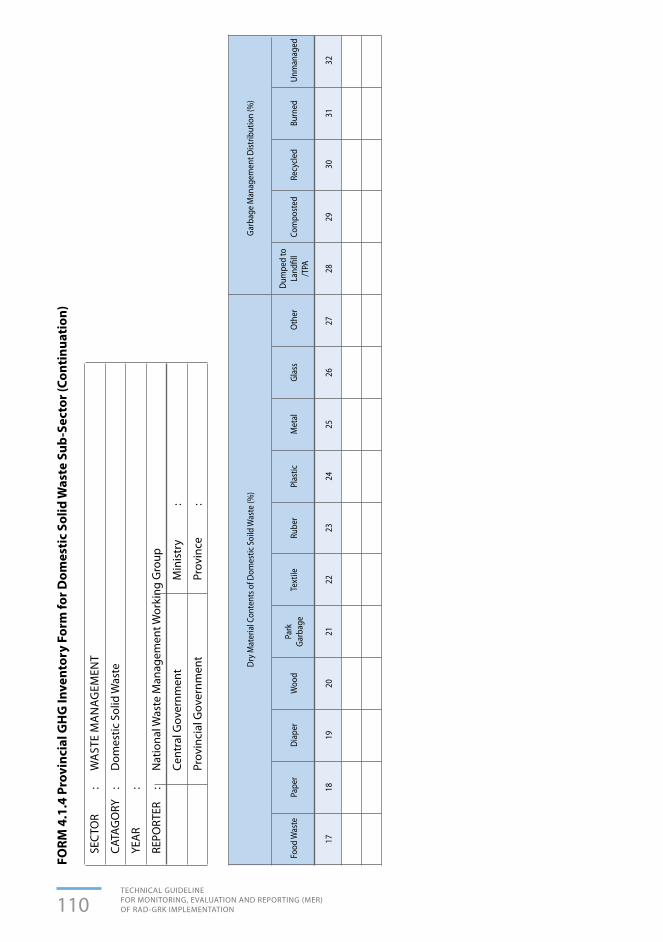
110TECHNICAL GUIDELINE FOR MONITORING, EVALUATION AND REPORTING (MER) OF RAD-GRK IMPLEMENTATION
2017
2226
1924
2818
2327
2125
2931
3032
Dry
Mat
eria
l Con
tent
s of D
omes
tic S
oild
Was
te (%
)
Food
Was
teDi
aper
Rube
rD
umpe
d to
La
ndfil
l/T
PA
Park
Garb
age
Met
alRe
cycl
edPa
per
Woo
dPl
astic
Com
post
edTe
xtile
Glas
sBu
rned
Oth
erUn
man
aged
Garb
age
Man
agem
ent D
istrib
utio
n (%
)
FORM
4.1
.4 P
rovi
ncia
l GH
G In
vent
ory
Form
for D
omes
tic
Solid
Was
te S
ub-S
ecto
r (Co
ntin
uati
on)
SEC
TOR
: W
AST
E M
AN
AG
EMEN
T
CATA
GO
RY
: D
omes
tic S
olid
Was
te
YEA
R :
REPO
RTER
:
Nat
iona
l Was
te M
anag
emen
t Wor
king
Gro
up
Cent
ral G
over
nmen
t M
inis
try
:
Prov
inci
al G
over
nmen
t Pr
ovin
ce
:

111TECHNICAL GUIDELINE
FOR MONITORING, EVALUATION AND REPORTING (MER) OF RAD-GRK IMPLEMENTATION
3342
3741
3543
3934
3836
40
Garb
age
Man
agem
ent F
acili
ty
Nam
e of
La
ndfil
l(T
PA)
m3/
day
MA
USQ
uant
ity(U
nit)
Qua
ntity
(Uni
t)To
nM
SUD
Land
fill (
TPA)
Di
strib
utio
n ba
sed
on
Type
(%)
Tota
l M
anag
emen
t Ca
paci
ty
(ton/
year
)
Aver
age
garb
age
volu
me
to L
andfi
ll (T
PA)
3R Fa
cilit
yCo
mpo
stin
g Fa
cilit
yLa
ndfil
l (TP
A) D
istrib
utio
n ba
sed
on Ty
pe (%
)
FORM
4.1
.4 P
rovi
ncia
l GH
G In
vent
ory
Form
for D
omes
tic
Solid
Was
te S
ub-S
ecto
r (Co
ntin
uati
on)
SEC
TOR
: W
AST
E M
AN
AG
EMEN
T
CATA
GO
RY
: D
omes
tic S
olid
Was
te
YEA
R :
REPO
RTER
:
Nat
iona
l Was
te M
anag
emen
t Wor
king
Gro
up
Cent
ral G
over
nmen
t M
inis
try
:
Prov
inci
al G
over
nmen
t Pr
ovin
ce
:

112TECHNICAL GUIDELINE FOR MONITORING, EVALUATION AND REPORTING (MER) OF RAD-GRK IMPLEMENTATION
1 2 ...3 33No.
26
104
812
37
115
913
1514
16
City
/Dist
rict
Num
ber o
f Po
pula
tion
(peo
ple)
Was
te M
anag
emen
t Dist
ribut
ion
(%)
Dum
ped
to la
ndfil
l (T
PA)
Unm
anag
edM
SRe
cycl
edUD
Tota
l Man
-ag
emen
t Ca
paci
ty
(ton/
year
)
Tota
l Man
-ag
emen
t Ca
paci
ty
(ton/
year
)Co
mpo
sted
USQ
uant
ity(U
nit)
Qua
ntity
(Uni
t)Bu
rned
MA
Num
ber o
f Was
te M
anag
emen
t Fac
ility
Land
fill B
ased
on
Type
3R Fa
cilit
yCo
mpo
stin
g Fa
cilit
y
FORM
4.1
.5 N
atio
nal G
HG
Inve
ntor
y Fo
rm fo
r Dom
esti
c So
lid W
aste
Sub
-Sec
tor
SEC
TOR
: W
AST
E/D
OM
ESTI
C SO
LID
WA
STE
MA
NA
GEM
ENT
CATA
GO
RY
: N
atio
nal
YEA
R :
REPO
RTER
:
Nat
iona
l Was
te M
anag
emen
t Wor
king
Gro
up
Cent
ral G
over
nmen
t M
inis
try
:

113TECHNICAL GUIDELINE
FOR MONITORING, EVALUATION AND REPORTING (MER) OF RAD-GRK IMPLEMENTATION
Instructions to fill in Form 4.1.4 and 4.1.5
Provincial Indicator Forms for domestic solid waste and domestic liquid waste sub-sectors constitute a compilation of information collected at the district/city levels. These forms are earmarked for monitoring and evaluating indicators related to GHG emissions from domestic solid waste and liquid solid waste sub-sectors in a province every year.
National Indicator Form for domestic solid waste and domestic liquid waste sub-sectors constitutes a compilation of information collected at the provincial level. The form is earmarked for monitoring and evaluating indicators related to GHG emission form domestic solid waste and domestic liquid waste sub-sectors at the national level every year.

114TECHNICAL GUIDELINE FOR MONITORING, EVALUATION AND REPORTING (MER) OF RAD-GRK IMPLEMENTATION
4.2 DOMESTIC LIQUID WASTE SUB-SECTOR
Core mitigation actions of domestic liquid waste sub-sector are generally divided into 2 parts: (1) Off-site liquid waste management facility development, and(2) On-site liquid waste management facility development
The supporting mitigation activities of the domestic liquid waste sub-sector are divided into two big parts: (1) Institutional and regulation development, (2) Human resources capacity development.
In the domestic liquid waste sub-sector GHG inventory is conducted. Its indicators include: - Social grouping based on the level of income, living in rural areas, urban
communities with middle to high income, as well as urban communities with medium to low income;
- Proportion of domestic liquid waste management facilities used by the people in rural areas which are divided into septic tanks, pit latrines, centralized management (sewerage system), other types as well as without management (dumped into rivers or water body).
- Proportion of domestic liquid waste management facilities used by urban communities with medium to high income level which are divided into septic tanks, pit latrines, centralized management (sewerage system), other types as well as without management (dumped into rivers or water body);
- Proportion of domestic liquid waste management facilities used by urban communities with medium to low income level which are divided into septic tanks, pit latrines, centralized management (sewerage system), other types as well as without management (dumped into rivers or water body);
GHG Inventory in domestic liquid waste sub-sector is conducted at the district/city level and then compiled at the provincial and national level

115TECHNICAL GUIDELINE
FOR MONITORING, EVALUATION AND REPORTING (MER) OF RAD-GRK IMPLEMENTATION
16
82
79
311
104
5
No.
Title
of S
uppo
rtin
g M
itiga
tion
Actio
n/Ac
tivity
Budg
et A
lloca
tion
in R
AD-G
RK (r
upia
h)Im
plem
ente
r
Targ
et
RAD
-GRK
Loca
tion
RAD
-GRK
Qua
ntity
Qua
ntity
LPJ
RAD
-GRK
LPJ
LPJ
Unit
Unit
FORM
4.2
.1 C
ore
Act
ivit
y Fo
rm fo
r Dom
esti
c Li
quid
Was
te S
ub-S
ecto
r
SEC
TOR
: W
AST
E M
AN
AG
EMEN
T
CATA
GO
RY
: D
omes
tic L
iqui
d W
aste
YEA
R :
REPO
RTER
:
Cent
ral G
over
nmen
t M
inis
try
:
Prov
inci
al G
over
nmen
t Pr
ovin
ce
:
Dis
tric
t/Ci
ty G
over
nmen
t D
istr
ict/
City
:

116TECHNICAL GUIDELINE FOR MONITORING, EVALUATION AND REPORTING (MER) OF RAD-GRK IMPLEMENTATION
1213
1415
1617
1819
2021
2223
24
Qua
rter
IV
Budg
et u
se b
ased
on
Sour
ce (R
upia
h)Ke
y pe
rform
ance
indi
cato
r
APBN
Qua
rter
IV
Prov
inci
alAP
BD
Qua
rter
IV
City
/Di
stric
tAP
BD
Qua
rter
IV
PHLN
Qua
rter
IV
Priv
ate
Sect
or Fu
ndD
etai
lsQ
uant
ityUn
it
GHG
Emiss
ion
Redu
ctio
n(to
n CO
2e)
GHG
Emis-
sion
with
m
itiga
tion
actio
n(to
n CO
2e)
BAU
Base
line
GHG
Emis-
sion
(ton
CO2e
)
Co-B
enefi
tSu
ppor
ting
info
rmat
ion
FORM
4.2
.1 C
ore
acti
vity
For
m fo
r Dom
esti
c Li
quid
Was
te S
ub-S
ecto
r (Co
ntin
uati
on)
SEC
TOR
: W
AST
E M
AN
AG
EMEN
T
CATA
GO
RY
: D
omes
tic L
iqui
d W
aste
YEA
R :
REPO
RTER
:
Cent
ral G
over
nmen
t M
inis
try
:
Prov
inci
al G
over
nmen
t Pr
ovin
ce
:
Dis
tric
t/Ci
ty G
over
nmen
t D
istr
ict/
City
:
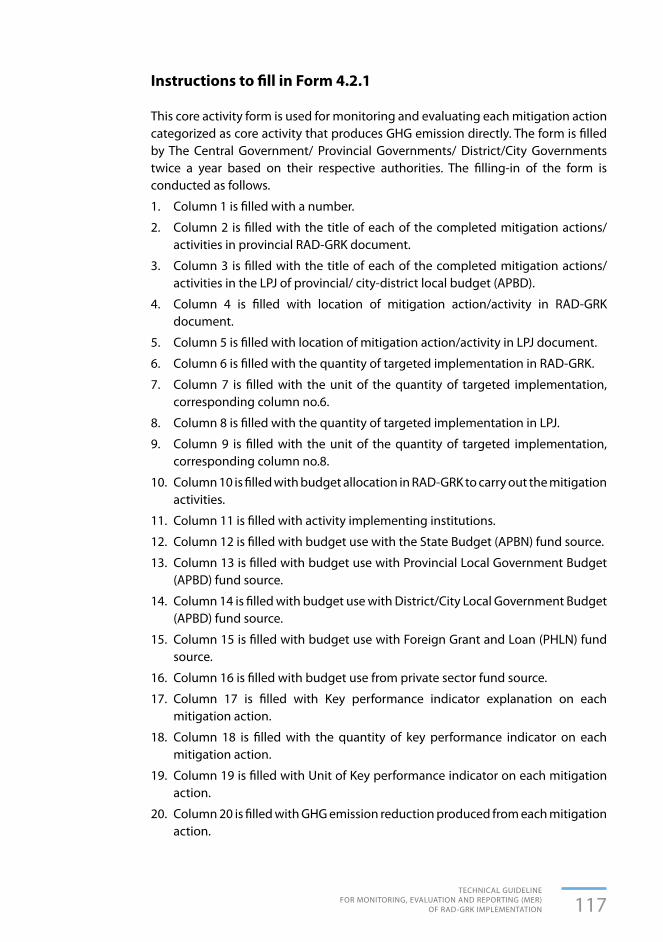
117TECHNICAL GUIDELINE
FOR MONITORING, EVALUATION AND REPORTING (MER) OF RAD-GRK IMPLEMENTATION
Instructions to fill in Form 4.2.1
This core activity form is used for monitoring and evaluating each mitigation action categorized as core activity that produces GHG emission directly. The form is filled by The Central Government/ Provincial Governments/ District/City Governments twice a year based on their respective authorities. The filling-in of the form is conducted as follows.
1. Column 1 is filled with a number.
2. Column 2 is filled with the title of each of the completed mitigation actions/ activities in provincial RAD-GRK document.
3. Column 3 is filled with the title of each of the completed mitigation actions/ activities in the LPJ of provincial/ city-district local budget (APBD).
4. Column 4 is filled with location of mitigation action/activity in RAD-GRK document.
5. Column 5 is filled with location of mitigation action/activity in LPJ document.
6. Column 6 is filled with the quantity of targeted implementation in RAD-GRK.
7. Column 7 is filled with the unit of the quantity of targeted implementation, corresponding column no.6.
8. Column 8 is filled with the quantity of targeted implementation in LPJ.
9. Column 9 is filled with the unit of the quantity of targeted implementation, corresponding column no.8.
10. Column 10 is filled with budget allocation in RAD-GRK to carry out the mitigation activities.
11. Column 11 is filled with activity implementing institutions.
12. Column 12 is filled with budget use with the State Budget (APBN) fund source.
13. Column 13 is filled with budget use with Provincial Local Government Budget (APBD) fund source.
14. Column 14 is filled with budget use with District/City Local Government Budget (APBD) fund source.
15. Column 15 is filled with budget use with Foreign Grant and Loan (PHLN) fund source.
16. Column 16 is filled with budget use from private sector fund source.
17. Column 17 is filled with Key performance indicator explanation on each mitigation action.
18. Column 18 is filled with the quantity of key performance indicator on each mitigation action.
19. Column 19 is filled with Unit of Key performance indicator on each mitigation action.
20. Column 20 is filled with GHG emission reduction produced from each mitigation action.

118TECHNICAL GUIDELINE FOR MONITORING, EVALUATION AND REPORTING (MER) OF RAD-GRK IMPLEMENTATION
21. Column 21 is filled with BAU baseline emission status for waste sector in the reporting year. See provincial RAD-GRK document to get this data.
22. Column 22 is filled with estimated GHG emission for waste sector in the reporting year, if mitigation activities are implemented. The 2006 IPCC GL Spreadsheet is used in conducting estimation of GHG emission reduction from outcome/IKK (key performance indicator) of each completed activity.
23. Column 23 is filled with other various information deemed necessary to convey as related to mitigation action implementation

119TECHNICAL GUIDELINE
FOR MONITORING, EVALUATION AND REPORTING (MER) OF RAD-GRK IMPLEMENTATION
16
82
79
311
104
5
No.
Title
of S
uppo
rtin
g M
itiga
tion
Actio
n/Ac
tivity
Budg
et A
lloca
tion
in R
AD-G
RK (r
upia
h)Im
plem
ente
r
Targ
et
RAD
-GRK
Loca
tion
RAD
-GRK
Qua
ntity
Qua
ntity
LPJ
RAD
-GRK
LPJ
LPJ
Unit
Unit
FORM
4.2
.2 S
uppo
rtin
g A
ctiv
ity
Form
for D
omes
tic
Liqu
id W
aste
Sub
-Sec
tor
SEC
TOR
: W
AST
E M
AN
AG
EMEN
T
CATA
GO
RY
: D
omes
tic L
iqui
d W
aste
YEA
R :
REPO
RTER
:
Cent
ral G
over
nmen
t M
inis
try
:
Prov
inci
al G
over
nmen
t Pr
ovin
ce
:
Dis
tric
t/Ci
ty G
over
nmen
t D
istr
ict/
City
:

120TECHNICAL GUIDELINE FOR MONITORING, EVALUATION AND REPORTING (MER) OF RAD-GRK IMPLEMENTATION
1213
1415
1617
1819
20
Qua
rter
IV
Budg
et u
se B
ased
on
Sour
ce (R
upia
h)Ke
y pe
rform
ance
indi
cato
r
APBN
Qua
rter
IV
Prov
inci
alAP
BD
Qua
rter
IV
City
/Dist
rict
APBD
Qua
rter
IV
PHLN
Qua
rter
IV
Priv
ate
Sect
or Fu
ndD
etai
lsQ
uant
ityUn
it
Supp
ort
Info
rmat
ion
FORM
4.2
.2 S
uppo
rtin
g A
ctiv
ity
Form
for D
omes
tic
Liqu
id W
aste
Sub
-Sec
tor (
Cont
inua
tion
)
SEC
TOR
: W
AST
E M
AN
AG
EMEN
T
CATA
GO
RY
: D
omes
tic L
iqui
d W
aste
YEA
R :
REPO
RTER
:
Cent
ral G
over
nmen
t M
inis
try
:
Prov
inci
al G
over
nmen
t Pr
ovin
ce
:
Dis
tric
t/Ci
ty G
over
nmen
t D
istr
ict/
City
:

121TECHNICAL GUIDELINE
FOR MONITORING, EVALUATION AND REPORTING (MER) OF RAD-GRK IMPLEMENTATION
Instructions to fill in Form 4.2.2
This supporting activity form is used for monitoring and evaluating each mitigation action categorized as supporting activities that produce GHG emission reduction directly. The form is filled by The Central Government/ Provincial Governments/ District/City Governments twice a year based on their respective authorities. The filling-in of the form is conducted as follows.
1. Column 1 is filled with a number.
2. Column 2 is filled with the title of each of the completed mitigation actions/ activities in provincial RAD-GRK document.
3. Column 3 is filled with the title of each of the completed mitigation actions/activities in the LPJ of provincial/ city-district local budget (APBD).
4. Column 4 is filled with location of mitigation action in RAD-GRK document.
5. Column 5 is filled with location of mitigation action in LPJ document.
6. Column 6 is filled with the number of target activities in RAD-GRK.
7. Column 7 is filled with activity unit in LPJ document.
8. Column 8 is filled with the number of target activities in LPJ document.
9. Column 9 is filled with activity target unit in LPJ Document.
10. Column 10 is filled with budget allocation in RAD-GRK to carry out the mitigation activities.
11. Column 11 is filled with activity implementing institutions.
12. Column 12 is filled with budget use with the State Budget (APBN) fund source.
13. Column 13 is filled with budget use with Provincial Local Government Budget (APBD) fund source.
14. Column 14 is filled with budget use with District/City Local Government Budget (APBD) fund source.
15. Column 15 is filled with budget use with Foreign Grant and Loan (PHLN) fund source.
16. Column 16 is filled with budget use from private sector fund source.
17. Column 17 is filled with Key performance indicator explanation on each mitigation action.
18. Column 18 is filled with the quantity of key performance indicator on each mitigation action.
19. Column 19 is filled with Unit of Key performance indicator on each mitigation action.
20. Column 20 is filled with other various information deemed necessary to convey as related to mitigation action implementation.

122TECHNICAL GUIDELINE FOR MONITORING, EVALUATION AND REPORTING (MER) OF RAD-GRK IMPLEMENTATION
1 1 2 3
Rura
l
Urba
n –
Med
ium
to
High
Urba
n –
Med
ium
to
Low
26
124
108
143
713
511
915
No.
Latri
ne5)
Dist
ribut
ion
of D
omes
tic L
iqui
d W
aste
Man
agem
ent a
nd D
ispos
al S
yste
m U
tiliza
tion
(%)
Inco
me
Grou
p
Popu
latio
n Pr
opor
tion
(%)
Dire
ct
Disp
osal
to
river
s, sw
amps
, an
d se
a
Cent
raliz
ed
aero
bic I
PAL
(poo
rly m
ain-
tain
ed)
Sept
ic Ta
nkFl
owin
g se
wer
2)
Anae
robi
c sh
allo
w
lago
on 3)
Com
mun
al
Dry
Latri
neSt
agna
nt
sew
er 1)
Anae
robi
c di
gest
er
for m
ud
Indi
vidu
al D
ry
Latri
ne
(3-5
peo
ple)
Cent
raliz
ed
Aero
bic I
PAL
(wel
l mai
n-ta
ined
)
Anae
robi
c de
ep la
goon
4)W
et L
atrin
e
Not
e1)
Sta
gnan
t sew
er is
a ty
pe o
f was
te w
ater
dis
posa
l sys
tem
whe
re th
ere
is n
o w
ater
flow
, for
exa
mpl
e po
nd a
nd th
e lik
e.2)
Flo
win
g se
wer
is a
type
of w
aste
wat
er d
ispo
sal s
yste
m w
here
ther
e is
wat
er fl
ow, f
or e
xam
ple
river
s, di
tche
s (o
pen
and
clos
ed)
3) A
naer
obic
was
te w
ater
trea
tmen
t pon
d w
ith le
ss-t
han-
2 m
eter
dep
th4)
Ana
erob
ic w
aste
wat
er tr
eatm
ent p
ond
with
mor
e-th
an-2
met
er d
epth
5)
- L
atrin
e is
a s
impl
e M
CK (b
athi
ng, w
ashi
ng a
nd to
ilet)
faci
lity
with
out w
aste
wat
er tr
eatm
ent s
yste
m, f
or e
xam
ple
pit l
atrin
e an
d la
trin
e w
ithou
t sep
tic ta
nk.
-
Dry
latr
ine:
latr
ine
whi
ch is
loca
ted
in d
ry c
limat
e ar
ea w
ith g
roun
d w
ater
sur
face
pos
ition
und
er th
e la
trin
e’s
bott
om.
-
Wet
latr
ine:
latr
ine
whi
ch is
loca
ted
in w
et c
limat
e ar
ea o
r gro
und
wat
er s
urfa
ce p
ositi
on a
bove
latr
ine’
s bo
ttom
.
FORM
4.2
.3 D
istr
ict/
City
GH
G In
vent
ory
Form
for D
omes
tic
Liqu
id W
aste
Sub
-Sec
tor
SEC
TOR
: W
AST
E M
AN
AG
EMEN
T
CATA
GO
RY
: D
omes
tic L
iqui
d W
aste
YEA
R :
REPO
RTER
:
Cent
ral G
over
nmen
t M
inis
try
:
Prov
inci
al G
over
nmen
t Pr
ovin
ce
:
Dis
tric
t/Ci
ty G
over
nmen
t D
istr
ict/
City
:

123TECHNICAL GUIDELINE
FOR MONITORING, EVALUATION AND REPORTING (MER) OF RAD-GRK IMPLEMENTATION
Instructions to fill in Form 4.2.3
The District/City GHG Inventory Form for Domestic Liquid Waste sub-sector is earmarked for monitoring and evaluating indicators related to GHG emissions from domestic liquid waste sub-sector in district/city levels every year. The form is filled by District/City Governments with supervision from Provincial Governments. The form should be filled in with the following step:
1. Column 3 is filled with proportion/fraction of population in rural and urban areas with medium to high income and urban communities with medium to low income. The data can probably be obtained from the local Centre of Statistics Agency (BPS). The total amount for column 3 must be 100%.
2. In line 1, columns 4 through 15 are filled with proportion/fraction of distribution of rural domestic liquid waste disposal and treatment types. The total amount of columns 4 through 15 in line 1 must be similar to 100.
3. In line 2, columns 4 through 15 are filled with proportion/fraction of distribution of urban domestic liquid waste disposal and treatment types with the population of medium to high income. The amount of columns 4 through 15 in line 2 must be similar to 100%.
4. In line 3, columns 4 through 15 are filled with proportion/fraction of distribution of urban domestic liquid waste disposal and treatment types with the population of medium to low income. The amount of columns 4 to 15 in line 3 must be similar to 100%.
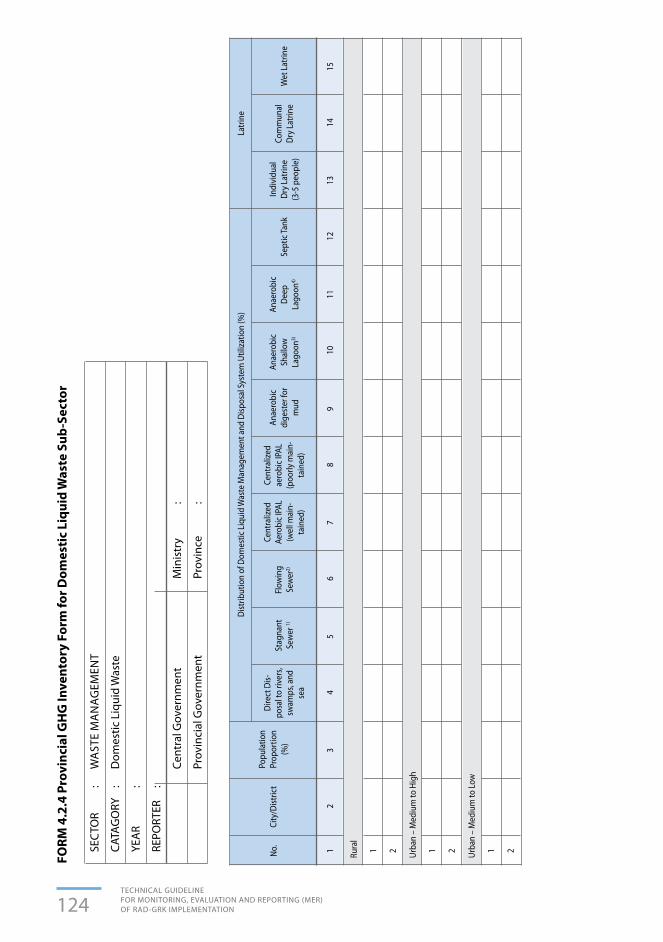
124TECHNICAL GUIDELINE FOR MONITORING, EVALUATION AND REPORTING (MER) OF RAD-GRK IMPLEMENTATION
1 1 1 12 2 2Rura
l
Urba
n –
Med
ium
to H
igh
Urba
n –
Med
ium
to L
ow
26
124
108
143
713
511
915
No.
Latri
neDi
strib
utio
n of
Dom
estic
Liq
uid
Was
te M
anag
emen
t and
Disp
osal
Sys
tem
Util
izatio
n (%
)
City
/Dist
rict
Popu
latio
n Pr
opor
tion
(%)
Dire
ct D
is-po
sal t
o riv
ers,
swam
ps, a
nd
sea
Cent
raliz
ed
aero
bic I
PAL
(poo
rly m
ain-
tain
ed)
Sept
ic Ta
nkFl
owin
gSe
wer
2)
Anae
robi
c Sh
allo
wLa
goon
3)
Com
mun
al
Dry
Latri
neSt
agna
ntSe
wer
1)
Anae
robi
c di
gest
er fo
r m
ud
Indi
vidu
al
Dry
Latri
ne
(3-5
peo
ple)
Cent
raliz
ed
Aero
bic I
PAL
(wel
l mai
n-ta
ined
)
Anae
robi
cD
eep
Lago
on4)
Wet
Lat
rine
FORM
4.2
.4 P
rovi
ncia
l GH
G In
vent
ory
Form
for D
omes
tic
Liqu
id W
aste
Sub
-Sec
tor
SEC
TOR
: W
AST
E M
AN
AG
EMEN
T
CATA
GO
RY
: D
omes
tic L
iqui
d W
aste
YEA
R :
REPO
RTER
:
Cent
ral G
over
nmen
t M
inis
try
:
Prov
inci
al G
over
nmen
t Pr
ovin
ce
:

125TECHNICAL GUIDELINE
FOR MONITORING, EVALUATION AND REPORTING (MER) OF RAD-GRK IMPLEMENTATION
Note1) Stagnant sewer is a type of waste water disposal system where there is no water flow, for example
pond and the like.2) Flowing sewer is a type of waste water disposal system where there is water flow, for example rivers,
ditches (open and closed)3) Anaerobic waste water treatment pond with less-than-2 meter depth4) Anaerobic waste water treatment pond with more-than-2 meter depth 5) - Latrine is a simple MCK (bathing, washing and toilet) facility without waste water treatment system,
for example pit latrine and latrine without septic tank.
- Dry latrine : latrine which is located in dry climate area with ground water surface position under the latrine’s bottom.
- Wet latrine : latrine which is located in wet climate area or ground water surface position above latrine’s bottom.
Instructions to fill in Form 4.2.4
Compile each type of domestic liquid waste management and disposal in every city/district, then the result is put into the provincial-level indicator form in the form 4.2.4.
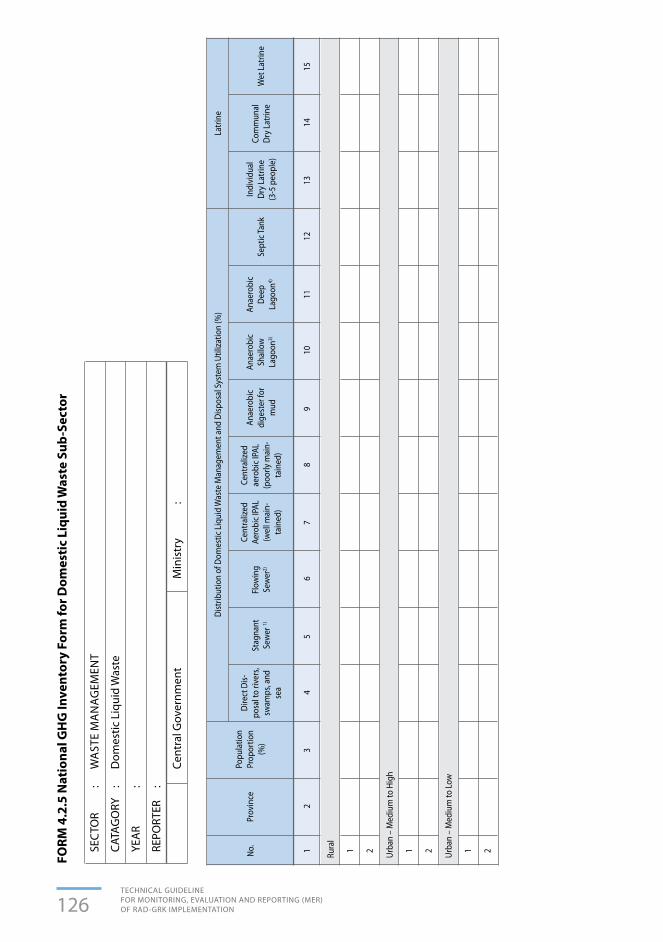
126TECHNICAL GUIDELINE FOR MONITORING, EVALUATION AND REPORTING (MER) OF RAD-GRK IMPLEMENTATION
1 1 1 12 2 2Rura
l
Urba
n –
Med
ium
to H
igh
Urba
n –
Med
ium
to L
ow
26
124
108
143
713
511
915
No.
Latri
neDi
strib
utio
n of
Dom
estic
Liq
uid
Was
te M
anag
emen
t and
Disp
osal
Sys
tem
Util
izatio
n (%
)
Prov
ince
Popu
latio
n Pr
opor
tion
(%)
Dire
ct D
is-po
sal t
o riv
ers,
swam
ps, a
nd
sea
Cent
raliz
ed
aero
bic I
PAL
(poo
rly m
ain-
tain
ed)
Sept
ic Ta
nkFl
owin
gSe
wer
2)
Anae
robi
c Sh
allo
wLa
goon
3)
Com
mun
al
Dry
Latri
neSt
agna
ntSe
wer
1)
Anae
robi
c di
gest
er fo
r m
ud
Indi
vidu
al
Dry
Latri
ne
(3-5
peo
ple)
Cent
raliz
ed
Aero
bic I
PAL
(wel
l mai
n-ta
ined
)
Anae
robi
cD
eep
Lago
on4)
Wet
Lat
rine
FORM
4.2
.5 N
atio
nal G
HG
Inve
ntor
y Fo
rm fo
r Dom
esti
c Li
quid
Was
te S
ub-S
ecto
r
SEC
TOR
: W
AST
E M
AN
AG
EMEN
T
CATA
GO
RY
: D
omes
tic L
iqui
d W
aste
YEA
R :
REPO
RTER
:
Cent
ral G
over
nmen
t M
inis
try
:
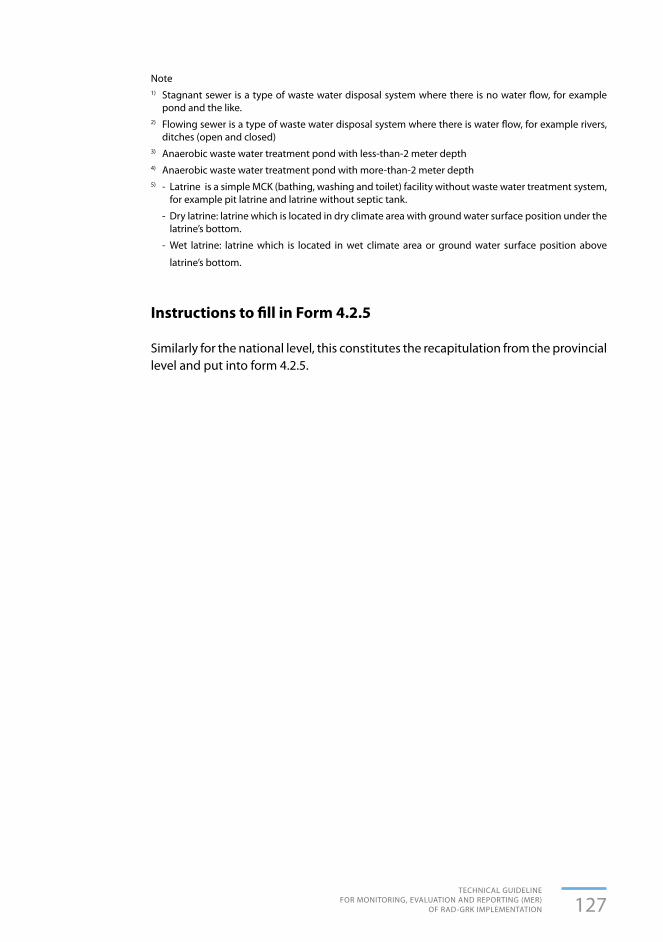
127TECHNICAL GUIDELINE
FOR MONITORING, EVALUATION AND REPORTING (MER) OF RAD-GRK IMPLEMENTATION
Note1) Stagnant sewer is a type of waste water disposal system where there is no water flow, for example
pond and the like.2) Flowing sewer is a type of waste water disposal system where there is water flow, for example rivers,
ditches (open and closed)3) Anaerobic waste water treatment pond with less-than-2 meter depth4) Anaerobic waste water treatment pond with more-than-2 meter depth5) - Latrine is a simple MCK (bathing, washing and toilet) facility without waste water treatment system,
for example pit latrine and latrine without septic tank.
- Dry latrine: latrine which is located in dry climate area with ground water surface position under the latrine’s bottom.
- Wet latrine: latrine which is located in wet climate area or ground water surface position above
latrine’s bottom.
Instructions to fill in Form 4.2.5
Similarly for the national level, this constitutes the recapitulation from the provincial level and put into form 4.2.5.

128TECHNICAL GUIDELINE FOR MONITORING, EVALUATION AND REPORTING (MER) OF RAD-GRK IMPLEMENTATION

129TECHNICAL GUIDELINE
FOR MONITORING, EVALUATION AND REPORTING (MER) OF RAD-GRK IMPLEMENTATION
BIBLIOGRAPHY
Agus, F., Wahyunto, A. Dariah, E. Runtunuwu, E. Susanti and W. Supriatna. 2012. Emission Reduction Options for Peatland in Kubu Raya and Pontianak Districts, West Kalimantan, Indonesia. Journal of Oil Palm Research 24:1378-1387.
Agus F, Hairiah K, Mulyani A. 2011. Pengukuran Cadangan Karbon Tanah Gambut. Petunjuk Praktis. World Agroforestry Centre-ICRAF, SEA Regional Office dan Balai Besar Penelitian dan Pengembangan Sumberdaya Lahan Pertanian (BBSDLP), Bogor, Indonesia. 58 p.
Agus, F., Wahyunto, Dariah, A., Setyanto, P., Subiksa, I. M., Runtunuwu, E., et al, 2010. Carbon Budget and Management Strategies for Conserving Carbon in Peatland: Case Study in Kubu Raya and Pontianak Districts, West kalimantan, Indonesia. Proceedings Of International Workshop of Evaluation and Sustainable Management of Soil Carbon Sequestration in Asia Countries (pp. 217-234). Bogor: Indonesian Soil Research Institute.
Agus, F., E. Handayani, M. Van Noordwijk, K. Idris dan S. Sabiham, 2010a. Root respiration interferes with peat CO2 emission measurement. pp. 50-53 In Proceedings 2010 19th World Congress of Soil Science, 1–6 August 2010, Brisbane, Australia. Published on DVD.
Dharmawan, I. W., Arifanti, V. B., Lugina, M., & Naito, R. 2013. Enhanced Approaches to Estimate Net Emission Reductions from Deforestation and Degradation of Undrained Peat Swamp Forests in Central Kalimantan, Indonesia. Bogor: Forestry Research and Development Agency Ministry of Forestry,METI Japan and ITTO.
Direktorat Jenderal Ketenagalistrikan, KESDM. 2012. Surat Nomor 1281/05/600.4/2012 perihal Penyampaian Perhitungan Faktor Emisi Proyek Clean Development Mechanism, 8 Februari 2012.
Hooijer A, Page S, Canadell JG, Silvius M, Kwadijk J, Wösten H, Jauhiainen J. 2010. Current and future CO2 emissions from drained peatlands in Southeast Asia. Biogeosciences, 7, pp 1505–1514.
Hooijer A, Silvius M, Wösten H Page S. 2006. PEAT-CO2, Assessment of CO2 emissions from drained peatlands in SE Asia. Delft Hydraulics report Q3943.
Husin, Y.A, 1994. Methane flux from Indonesia wetland rice: the effects of water management and rice variety. [Disertasi]
IAERI Annual Report 2007-2011IAERI 2007a, Identifikasi emisi GRK pada sistem pengelolaan padi terpadu di lahan
sawah irigasi. Final reportIAERI 2007b,Pengaruh Pengelolaan Pertanian Padi Sawah Terhadap Emisi GRK di
Tanah Gambut. Final report.IAERI 2007c. Indentifikasi emisi GRK pada sistem pengelolaan padi terpadu di lahan
sawah irigasi.Final report.IAERI 2007d. Pengaruh Pengelolaan Pertanian Padi Sawah Terhadap Emisi GRK di
Tanah Gambut.Final report

130TECHNICAL GUIDELINE FOR MONITORING, EVALUATION AND REPORTING (MER) OF RAD-GRK IMPLEMENTATION
IAERI 2006a. Final report :Pengaruh varietas padi pasang surut terhadap emisi GRK di lahan sawah pasang surut
IAERI 2006b. Pengaruh varietas padi pasang surut terhadap emisi GRK di lahan sawah pasang surut.Final report
IAERI 2006c. Pengaruh varietas padi pasang surut terhadap emisi GRK di lahan sawah pasang surut.Final report
IAERI 2005. Pengaruh varietas padi pasang surut terhadap emisi gas rumah kaca di lahan sawah pasang surut. Final report
IAERI 2004a,Penelitian validasi model CH4 di lahan sawah, Final reportIAERI 2004b. Mitigasi GRK pada lahan sulfat masam tipe luapan B di Kalimantan
selatan.Final reportIAERI 2003a,Pengolahan tanah dan sumber pupuk N untuk menekan emisi gas CH4
di lahan sawah vertisol,Annual reportIAERI 2003b, Validasi model simulasi untuk mengukur potensi dan emisi gas CH4
pada lahan sawah irigasi,Annual reportIAERI 2002a Emisi dan mitigasi gas CH4 dan N2O pada berbagai model pola tanam
di lahan sawah tadah hujan.Annual report.IAERI 2002b Kuantifikasi emisi gas-gas rumah kaca pada lahan sawah di Jawa,
Annual report. IAERI 2002c Pengaruh takaran azolla pada sistem minapadi terhadap produktivitas
dan emisi GRK di lahan sawah, Annual report.IAERI 2001a.Annual report:Emisi dan mitigasi gas CH4 dan N2O dari pengolahan
tanah, varietas dan pemberian bahan organik dalam pola tanam padi-palawija pada lahan sawah tadah hujan
IAERI 2001b.Annual report:Pengaruh dosis dan jenis pupuk N terhadap besarnya emisi CH4 dan N2O pada lahan sawah irigasi Vertisol
IAERI 2001c.Annual report:Pengaruh varietas padi terhadap besarnya emisi gas CH4 pada lahan sawah irigasi vertisol
IAERI 2001dEmisi dan mitigasi gas CH4 dan N2O dari pengolahan tanah, varietas dan pemberian bahan organik dalam pola tanam padi-palawija pada lahan sawah tadah hujan. Annual Report.
IAERI 2001e. Pengaruh varietas padi terhadap besarnya emisi gas CH4 pada lahan sawah irigasi vertisol. Annual report
IAERI 1999,Emisi gas CH4 dari Berbagai Varietas Padi,Annual Report 1998/99 IAERI 1998a,Emisi metan dari berbagai sistem pengaturan air pada lahan
sawah,Annual report 1997/1998IAERI 1998b,Pengaruh beberapa varietas padi terhadap emisi gas metana pada
lahan sawah, Annual Report 1997/1998IAERI 1997, Annual Report 1996/97 JICA. 2004. Study of Integrated Transportation Master Plan for Jabodetabek (SITRAM
Phase II). Kementerian Lingkungan Hidup, 2012. Metodologi penghitungan tingkat emisi
GRK kegiatan pengadaan dan penggunaan energi. Volume 1. Jakarta: KLH.

131TECHNICAL GUIDELINE
FOR MONITORING, EVALUATION AND REPORTING (MER) OF RAD-GRK IMPLEMENTATION
Kementerian Lingkungan Hidup, 2012. Metodologi penghitungan tingkat emisi GRK kegiatan proses industri dan penggunaan produk. Volume 2. Jakarta: KLH.
Kementerian Lingkungan Hidup, 2012. Metodologi penghitungan tingkat emisi GRK kegiatan pertanian, kehutanan, dan penggunaan lahan lainnya. Volume 3. Jakarta: KLH.
Kementerian Lingkungan Hidup, 2012. Metodologi penghitungan tingkat emisi GRK kegiatan pengelolaan limbah. Volume 4. Jakarta: KLH.
Kementerian Lingkungan Hidup, 2012. Pedoman penyelenggaraan inventarisasi gas rumah kaca nasional. Buku I Pedoman Umum. Jakarta: KLH.
Kementerian PPN/Bappenas, 2011. Pedoman pelaksanaan Rencana Aksi Penurunan emisi GRK. Jakarta: Bappenas.
Kementerian PPN/Bappenas. 2011. Pedoman penyusunan Rencana Aksi Daerah Penurunan emisi GRK (RAD-GRK). Jakarta: Bappenas.
Konsorsium PI 2009, Identifikasi dan Pengujian Varietas Padi Rendah Emisi Gas Rumah Kaca. Report 2008-2009.
Masripatin, N, Dharmawan, IWSD dan Gintings, ANg. 2009. Indonesia Climate Change Sectoral Roadmap: Forestry Sector. Kerjasama antara Bappenas dan FORDA.
Mulyadi, A. Pramono, Poniman dan A. Wihadjaka. 2004. Pengaruh Pupuk Kandang Terhadap Hasil Padi Gogo Rancah dan Emisi Gas CH4 di Lahan sawah Tadah Hujan. Seminar nasional pengelolaan lingkungan pertanian. 479-485.
Planologi, D. I. (2012). Sosialisasi REL (Reference Emission Level) Sektor Kehutanan Tingkat Nasional. Materi Presentasi Sosisalisasi REL Sektor Kehutanan. Bogor: Dirjen Planologi Kementerian Kehutanan.
Presiden Republik Indonesia, Peraturan Presiden Republik Indonesia Nomor 61 Tahun 2011 tentang Rencana Aksi Nasional Penurunan Emisi GRK.
Setyanto, P, 2004, Methane emission from rice field under different crop establishments and rice cultivars.[Disertasi]
Setyanto, P,2000, Methane emission from three soil types planted with flooded rice (Thesis)
Setyanto, P, Methane emission in different water regimes. [Disertasi] Setyanto, P, Burhan, H, Jatmiko, S.Y, 2008. Effectiveness of water regime and soil
management on methane emission reduction from rice field. Prosiding seminar Nasional pencemaran lingkungan pertanian melalui pendekatan pengelolaan daerah aliran sungai (DAS) secara terpadu. 219-233
Setyanto, P, Makarim, A, K., Fagi, A, M., Wassmann, R, Buendia, L, V. 2000. Crop management affecting methane emission from irrigated and rainfed rice in central Java. N.C.E. 58 : 85-124
Setyanto, P, Makarim, A, K., Fagi, A, M., Wassmann, R, Buendia, L, V. 2000. Crop management affecting methane emission from irrigated and rainfed rice in central Java. N.C.E. 58 : 85-93
Setyanto, P, Suharsih, A. Wihardjaka, A. K Makarim. 1999. Pengaruh pemberian pupuk anorganik terhadap emisi gas metan pada lahan sawah. Risalah Seminar hasil penelitian emisi gas rumah kaca dan peningkatan produktifitas padi di lahan sawah. 36-43.

132TECHNICAL GUIDELINE FOR MONITORING, EVALUATION AND REPORTING (MER) OF RAD-GRK IMPLEMENTATION
Suharsih, P. Setyanto, A.K. Makarim. 2004. “Emisi gas metan pada lahan sawah irigasi inceptisol akibat pemupukan nitrogen pada tanaman padi.”PP Tanaman Pangan 22 (2) : 43-47
Setyanto et al. 2002. Influence of soil properties on CH4 emission from rice field, IJAS. Assume to be the same as Oxisol.


