1 Technical Justification for Vapor Intrusion Media‐Specific Criteria (Final 03‐21‐2012) 1 EXECUTIVE SUMMARY For petroleum‐related volatile organic compounds (VOCs), current risk‐based screening levels (such as the California Human Health Screening Levels [CHHSLs]) for evaluating risk from vapor intrusion at underground storage tank (UST) sites are conservative. This conservatism is caused by not considering biodegradation in site screening which generally drives further unnecessary site evaluation. Recent models and field studies show that bioattenuation of petroleum hydrocarbons at UST sites is significant (Abreu et al., 2009; API, 2009; Davis, 2009; Lahvis, 2011). Petroleum hydrocarbon VOCs (such as, benzene, toluene, ethylbenzene and xylenes ‐BTEX) concentrations have been shown to attenuate by several orders of magnitude within short vertical distances (e.g., < 2‐3 m) in the unsaturated zone due to biodegradation. The hydrocarbon VOC attenuation generally increases by an additional order of magnitude (or more) when transport across a building foundation to indoor air is also considered (U.S. EPA, 2008). The characteristic occurrence of rapid hydrocarbon attenuation in the unsaturated zone is amenable to a site‐screening methodology for vapor intrusion based on exclusion distances. Exclusion distances are defined as VOC source‐receptor (building) separation distances beyond which the risk of vapor intrusion is assumed negligible. Note the source may be located in soil and/or groundwater. Exclusion distances can be broadly defined for two types of sources: low‐concentration (e.g., dissolved‐ phase) and high‐concentration (e.g., light non‐aqueous‐phase liquid – LNAPL) sources which differ substantially in chemical vapor composition and are unique with respect to their vapor intrusion risk potential. Recent modeling studies and evaluations of field (soil‐gas) data from numerous UST sites and sampling locations demonstrate that biodegradation is sufficient to limit the potential for vapor intrusion at sites with “low‐concentration” (dissolved‐phase) hydrocarbon sources (Abreu et al., 2009; Davis, 2009; Davis, 2010; Lahvis, 2012). For example, there is less than a 5% probability that benzene concentrations in soil gas would exceed a low screening‐level for vapor intrusion (30 μg/m 3 ) at distances of 5 ft (~2 m) or more above a dissolved‐phase benzene concentration in groundwater < 1,000 μg/L. (Note, for comparison, the CHHSL for benzene in soil gas is 83 μg/m 3 for buildings on engineered fill.) Additional attenuation (i.e., a shorter exclusion distance) is predicted to occur by transport modeling for dissolved‐phase sources displaced laterally from the building foundation (Abreu and Johnson, 2005). Vapor intrusion risks are thus expected to be rare to non‐existent at sites with low‐concentration sources. At sites with “high concentration” hydrocarbon sources (un‐weathered residual light non‐aqueous phase liquid (LNAPL) in soil and/or un‐weathered free‐phase LNAPL on groundwater), transport modeling shows that hydrocarbon VOCs will attenuate below levels of concern in the unsaturated zone within a distance of approximately 20 ft (~7 m) of the source. The transport modeling is based on assuming reasonable approximations of source concentration and transport within the unsaturated zone
Transcript
1
Technical Justification for Vapor Intrusion Media‐Specific Criteria
(Final 03‐21‐2012)
1 EXECUTIVE SUMMARY
For petroleum‐related volatile organic compounds (VOCs), current risk‐based screening levels (such as
the California Human Health Screening Levels [CHHSLs]) for evaluating risk from vapor intrusion at
underground storage tank (UST) sites are conservative. This conservatism is caused by not considering
biodegradation in site screening which generally drives further unnecessary site evaluation. Recent
models and field studies show that bioattenuation of petroleum hydrocarbons at UST sites is significant
benzene, toluene, ethylbenzene and xylenes ‐BTEX) concentrations have been shown to attenuate by
several orders of magnitude within short vertical distances (e.g., < 2‐3 m) in the unsaturated zone due to
biodegradation. The hydrocarbon VOC attenuation generally increases by an additional order of
magnitude (or more) when transport across a building foundation to indoor air is also considered (U.S.
EPA, 2008). The characteristic occurrence of rapid hydrocarbon attenuation in the unsaturated zone is
amenable to a site‐screening methodology for vapor intrusion based on exclusion distances. Exclusion
distances are defined as VOC source‐receptor (building) separation distances beyond which the risk of
vapor intrusion is assumed negligible. Note the source may be located in soil and/or groundwater.
Exclusion distances can be broadly defined for two types of sources: low‐concentration (e.g., dissolved‐
phase) and high‐concentration (e.g., light non‐aqueous‐phase liquid – LNAPL) sources which differ
substantially in chemical vapor composition and are unique with respect to their vapor intrusion risk
potential.
Recent modeling studies and evaluations of field (soil‐gas) data from numerous UST sites and sampling
locations demonstrate that biodegradation is sufficient to limit the potential for vapor intrusion at sites
with “low‐concentration” (dissolved‐phase) hydrocarbon sources (Abreu et al., 2009; Davis, 2009; Davis,
2010; Lahvis, 2012). For example, there is less than a 5% probability that benzene concentrations in soil
gas would exceed a low screening‐level for vapor intrusion (30 µg/m3) at distances of 5 ft (~2 m) or more
above a dissolved‐phase benzene concentration in groundwater < 1,000 µg/L. (Note, for comparison,
the CHHSL for benzene in soil gas is 83 µg/m3 for buildings on engineered fill.) Additional attenuation
(i.e., a shorter exclusion distance) is predicted to occur by transport modeling for dissolved‐phase
sources displaced laterally from the building foundation (Abreu and Johnson, 2005). Vapor intrusion
risks are thus expected to be rare to non‐existent at sites with low‐concentration sources.
At sites with “high concentration” hydrocarbon sources (un‐weathered residual light non‐aqueous phase
liquid (LNAPL) in soil and/or un‐weathered free‐phase LNAPL on groundwater), transport modeling
shows that hydrocarbon VOCs will attenuate below levels of concern in the unsaturated zone within a
distance of approximately 20 ft (~7 m) of the source. The transport modeling is based on assuming
reasonable approximations of source concentration and transport within the unsaturated zone
2
(including biodegradation rate). Soil‐gas data collected at numerous UST, terminal, and manufacturing
sites with LNAPL sources would suggest that the model predicted attenuation above LNAPL sources is
conservative. Analysis of the field data at these types of sites shows that hydrocarbon VOCs are
attenuated below screening‐level concentrations within 8 – 13 ft (~3 ‐ 4 m). Biodegradation accounts
for more than 1,000x additional attenuation within 5 ft vertical distances of benzene sources in soil‐gas
up to 10,000,000 µg/m3. Again, the attenuation is predicted to increase further for high (e.g., LNAPL)
sources displaced laterally from building foundations (i.e. the soil gas concentrations would attenuate in
even shorter distances).
The purpose of this document is to provide a technical justification for the proposed low‐threat vapor
intrusion scenarios. The justification is based on current, state‐of‐the‐art science on separation
distances between source and receptor that are human‐health protective. A few of the most recent
studies cited below are awaiting publication (but are available for review). All cited studies should be
considered in the development of a rational, technically defensible approach to vapor intrusion
screening.
The four scenarios presented in the Low‐Threat UST Closure Policy are:
Scenario 1: Un‐weathered LNAPL on groundwater
30 ft vertical source/building separation (exclusion) distance for un‐weathered (residual or free‐phase) LNAPL on groundwater
Scenario 2: Un‐weathered LNAPL in soil
30 ft lateral and vertical separation (exclusion) distance between a building foundation and an un‐weathered LNAPL (residual or free‐phase) source in soil.
Scenario 3: Dissolved phase benzene concentrations in groundwater
5 ft. vertical separation distance between a dissolved‐phase source < 100 µg/L benzene and a building foundation (no oxygen (O2) measurement)
10 ft. vertical exclusion distance for a dissolved‐phase source < 1,000 µg/L benzene (no O2 measurement)
5 ft. vertical separation distance between a dissolved‐phase source < 1,000 µg/L and a building foundation (measured O2 in soil gas ≥ 4%)
Scenario 4: Direct measurement of soil gas concentrations
Application of an additional attenuation factor of 1000x to risk‐based soil‐gas criteria (i.e. vapor sources) located 5 ft. from a building foundation
For each of these scenarios, screening criteria have been proposed that if met will identify the site as
posing a low human health threat resulting from the vapor intrusion pathway. The screening criteria
and low‐risk scenarios are based on the science presented in this document; additional safety factors
were incorporated as a policy decision. For the two un‐weathered LNAPL scenarios (Scenarios 1 and 2),
the current science indicates that soil vapors above an LNAPL source will attenuate within a distance of
20 feet or less. However the two LNAPL scenarios include an additional safety factor of 10 feet so that
the exclusion criteria for these cases are set to 30 feet. This buffer distance should take into account
any uncertainties with respect to water‐table fluctuation. Likewise, in Scenario 3, the scientific studies
3
and field data indicate that the risk of vapor intrusion is negligible for building foundations located more
than 5 feet above plumes with much higher benzene concentrations (up to 15,000 µg/L in groundwater).
Again, the proposed screening criteria incorporate additional safety factors which account for
uncertainties in the water‐table elevation. Management strategies to monitor and prevent groundwater
from coming in contact with building foundations should, however, be considered in cases where the
vertical separation distance between the building foundation and the dissolved‐phase hydrocarbon
source is < 5 ft. In Scenario 4, research indicates that soil gas concentrations will attenuate by more
than 3 orders of magnitude within a vertical distance of 5 feet. However, the “bioattenuation factor”
applied in Scenario 4 is conservatively defined at 3 orders of magnitude (1000‐fold attenuation). The
proposed bioattenuation factor (in Scenarios 3 and 4) also requires that measured O2 concentrations in
soil gas are greater than or equal to 4%. The practitioner should refer to local regulatory guidance for
information on how to collect these measurements. Biodegradation has been shown to be significant at
concentrations between 1 and 4 % (DeVaull, 2007). In conclusion, each of the scenarios, by design, had
safety factors included and therefore the exclusion criteria will appear to be more conservative than
would be otherwise indicated if only basing the results on the modeling results and field data presented
in this document.
2 INTRODUCTION
It is well recognized that petroleum hydrocarbons rapidly biodegrade in the presence of O2 (i.e., when
conditions in the unsaturated zone are aerobic). The degree of biodegradation depends mainly on O2
availability of and the O2 demand created by the biodegradation reaction. The latter is largely a function
of hydrocarbon source type (e.g., LNAPL or dissolved phase). Biodegradation can also be affected at soil
moisture content, however, especially if less than the wilting point (i.e., a level sufficient to support
plant growth) (Guyman 1997). Unsaturated‐zone soils are seldom drier than the wilting point; however,
with the exception of near surface soil layers under arid conditions (DeVaull, 1997).
Various researchers (Fischer et al., 1996; Lahvis et al., 1999; DeVaull, 2007; Davis, 2009; and Hartman,
(2010) have shown that conditions in the unsaturated zone are aerobic, and that for “low‐
concentration” sources (weathered residual in soil and/or dissolved concentrations in groundwater), the
degree of biodegradation is significant. At these sites, the demand for O2 resulting from biodegradation
generally exceeds O2 availability. The hydrocarbon concentrations (mainly BTEX) decrease by several
orders of magnitude over relatively short (e.g. <2 m) vertical distances. For low concentration
hydrocarbon sources, the attenuation will tend to be significant very near the water table (i.e., capillary
zone). These assertions are supported both by theory (modeling) (DeVaull, 2007, Abreu et. al. 2009, API,
2009) and by field observation (Lahvis and Baehr, 1996; API, 2009; Davis, 2009). Work by Abreu and
Johnson (2005) predicts a greater degree of vapor attenuation at sites where the source is displaced
laterally from the building foundation.
Researchers have also documented rapid biodegradation of petroleum vapors at sites underlain by
LNAPL sources. At such UST sites, exclusion distances determined by analyzing benzene concentrations
in soil gas have been estimated to be in the range of 8 to 15 feet (Davis, 2009; Hartman, 2010; Lahvis,
2011). The greater exclusion distance for LNAPL sources compared to dissolved‐phase sources is largely
related to the additional demand for O2 (noted above) created by LNAPL sources and the tendency for
4
LNAPL sources to be distributed above the capillary zone. Lahvis and Baehr (1996) showed the capillary
zone to be an active zone of biodegradation and hydrocarbon attenuation). The presence of residual‐
phase LNAPL can, however, be difficult to identify because LNAPL may not readily appear in
groundwater monitoring wells. In such cases, one may rely on general LNAPL indicator “rules of
thumb”, including:
Presence of LNAPL
Direct evidence:
current or historical evidence of LNAPL in soil (known release area) or at the water table
(visible/reported in nearby groundwater monitoring wells)
Indirect evidence:
hydrocarbon VOC concentrations in groundwater approaching (> 0.2) effective solubilities
(Bruce et al., 1991) (e.g., benzene > 3 mg/L; BTEX or TPH gasoline range organics (GRO) > 20
mg/L; TPH diesel range organics (DRO) > 5 mg/L)
total hydrocarbon VOC concentrations in soil of TPH GRO > 100 ‐ 200 mg/kg(1); TPH DRO > 10
‐ 50 mg/kg) (see ASTM, 2006, Alaska DEC, 2011)2
TPH vapor readings from a photo‐ionization detector (PID) of > 1,000 ppm (recent gasoline
releases) (Alaska DEC, 2011). Note that weathered LNAPL typically has a significantly
reduced VOC content and therefore represents a lesser vapor intrusion risk than un‐
weathered NAPL.
proximity (e.g., < 20 ft to a known release area)
It is important to note that although hydrocarbon VOC concentrations approaching effective solubility
limits in groundwater can be used as an indirect indicator of residual‐phase LNAPL, dissolved‐phase
hydrocarbon concentrations are not necessarily good metrics for the development of screening criteria
(i.e., separation distances) or assessing the vapor intrusion risk potential. Benzene concentrations in
soil‐gas have shown to be poorly correlated with benzene concentrations in shallow groundwater
(Lahvis, 2012). The poor correlation can be attributed to 1) the inability to accurately measure the
dissolved‐phase source (water‐table) concentration (i.e., the actual hydrocarbon vapor source) using
conventional ground‐water monitoring wells screened across the water table, and 2) hydrocarbon
biodegradation between the water table (dissolved‐phase source) and the lowermost soil‐gas sampling
location. Soil‐gas and ground‐water concentrations are also expected to be poorly correlated in the
presence of residual‐phase LNAPL sources (Zemo, 2006). Screening (exclusion) distances should
therefore be defined on the basis of source type (LNAPL and groundwater) rather than source
1 TPH (GRO) between 100 to 200 mg/kg may indicate may indicate the presence of LNAPL. TPH (GRO) less than 100 mg/kg is a good indication that there is no LNAPL present. The practitioner should refer to local regulatory guidance for TPH sampling and analysis.
2 The primary driver for vapor intrusion is benzene. For petroleum‐based fuels other than gasoline, benzene is not found at levels that would cause a vapor intrusion problem.
5
(groundwater) concentration. LNAPL and dissolved‐phase hydrocarbon sources are unique with respect
to their vapor intrusion risk potential for the following reasons:
1) Differences in hydrocarbon vapor diffusion and O2 demand: hydrocarbon vapor diffusion (mass
flux) in the unsaturated zone will be higher for LNAPL sources than dissolved‐phase sources
because LNAPL contains a higher source mass and is invariably distributed (by water‐table
fluctuations) above the capillary zone in lower moisture‐saturated soil less resistant to vapor
transport. The vapor mass flux for LNAPL source zones will also tend to be sustained for longer‐
periods of time given the larger contaminant mass compared to dissolved sources. The higher
rates of vapor diffusion from LNAPL sources will be coupled with greater metabolic demand for
O2 associated with aerobic biodegradation.
2) Differences in vapor composition: vapors emanating from dissolved‐phase sources are primarily
BTEX and other aromatic hydrocarbons and fractionally water‐soluble petroleum VOCs. Vapors
emanating directly from LNAPL sources contain these constituents and a sizeable fraction of
aliphatic and relatively insoluble VOCs, especially if the source is large or un‐weathered.
The exclusion distances proposed in policy focus primarily on benzene, which is the primary risk driver
for petroleum UST sites. Ethylbenzene and total petroleum hydrocarbon (TPH) data are included in this
technical justification only for comparative purposes. Naphthalene is not considered. Rather, the
exclusion criteria derived for benzene are assumed to be conservative for naphthalene, which is
relatively less volatile than benzene (i.e., has a much lower solubility value and Henry’s Law coefficient
than benzene) and similarly susceptible to biodegradation (Anderson et al., 2008). Methyl tert‐butyl
ether (MTBE), which may be considered another potential VOC of concern for vapor intrusion in some
regulatory jurisdictions, is also not considered. The exclusion of MTBE can be justified on the basis that
no reports of MTBE as a constituent of concern for vapor intrusion are documented in the literature
even though MTBE is routinely measured as part of soil‐gas sampling (TO‐15 air analyses). In addition,
long‐term (30‐yr exposure duration) chronic inhalation risks from MTBE are not expected to occur a
because of rapid attenuation of MTBE in source areas. In particular, McHugh et al. (2012) shows MTBE
concentrations have decreased in ground water by an average of 85% from 2001 to 2011 in California
post the phase out of MTBE as an oxygenate in gasoline in 2000 and its elimination on January 1, 2004.
3 TECHNICAL BACKGROUND – Discussion of Biodegradation Effects
This section presents the results of model studies and field data that support the proposed vapor
intrusion exclusion criteria. The results are discussed first for “low‐concentration” source cases followed
by “high‐concentration” sources cases.
3.1 Low‐Concentration Sources (weathered residual in soil and/or dissolved
concentrations in groundwater)
For purposes of this technical justification, low concentration sources at petroleum UST sites are defined
as dissolved‐phase hydrocarbon concentrations. Low concentration sources are therefore composed
primarily of the more soluble (aromatic) VOC LNAPL constituents, benzene, toluene, ethylbenzene,
xylenes, and naphthalene. Of these constituents, benzene is the primary risk driver for vapor intrusion
6
because of its relatively higher toxicity and vapor migration potential. Note: weathered LNAPL is
analogous to low‐concentration sources in cases where the LNAPL is depleted of VOCs.
3.1.1 Model Studies
Results from numerical (3‐dimensional) models (see Figures 3, 4 and 10 below[ Abreu et al.,
2009])indicate essentially complete attenuation of benzene soil gas concentrations (between 7 and 14
orders of magnitude – expressed as attenuation factors � < 1E‐07) within 2 m to 3 m away from a
relatively low (< 10 mg/L or 10,000,000 µg/m3) benzene source concentration in an unsaturated sand.3
The simulations also assumed biodegradation occurred only in the aerobic portion of the unsaturated
zone (i.e., where O2 concentrations exceed 1%). An aerobic biodegradation rate of 0.79 hr‐1 was
assumed for benzene, which is consistent with the geometric mean of published rates defined by
DeVaull (2007). Note that while this degradation rate may seem high, the model only simulates
biodegradation in the portion of the unsaturated zone where there is sufficient O2 (> 1 %) to support
biodegradation. The modeled hydrocarbon vapor source concentration, < 10 mg/L, is assumed to be
consistent with a dissolved‐phase source (see Abreu et al. [2009] – Figure 10). Lastly, the attenuation is
expected to increase for a similar range of source concentrations and degradation rates in lower
permeability soils (e.g., silty clay) (see Figure 19 from API, 2009) and for sources displaced laterally from
building foundations (see Figure 9 from Abreu and Johnson, 2005). The attenuation increases for the
latter scenario because hydrocarbon transport tends to be vertically upwards (toward the soil surface)
rather than laterally towards the receptor. Hence, there is little potential for vapor intrusion to occur at
sites where the dissolved‐phase source is separated laterally from a building foundation.
The following figures show the results of the modeling studies:
The figures from Abreu et al. (2009) (Figures 3 and 4) show benzene and O2 profiles predicted by
transport modeling for low‐concentration vapor sources and two different foundation
configurations (basement and slab, respectively) in a sand unsaturated zone for a reasonable
approximation of the hydrocarbon biodegradation rate (� = 0.79 hr‐1).
3 A 10 mg/L hydrocarbon soil gas source would equate to a ~40 mg/L source of BTEX in groundwater assuming a vapor/aqueous phase partition coefficient of around 0.25 (Morrison, 1999).
7
Figure 3 from Abreu et al (2009).
Figure 4 (Abreu et al., 2009)
8
Figure 10 from Abreu et al. (2009) is a plot of the hydrocarbon (benzene) attenuation factor in
the unsaturated zone versus source vapor concentration for a range of source/building
foundation separation distances assuming a representative biodegradation rate (� = 0.79 hr‐1)
and a sand unsaturated zone:
Figure 10 from Abreu et al. (2009)
Figure 19 from API (2009) is a plot of the hydrocarbon (TPH‐gasoline) attenuation factor in
the unsaturated zone versus source vapor concentration for a range of source/building
foundation separation distances assuming a representative biodegradation rate and two soil
types, sand and silty clay:
9
Figure 19 from API (2009)
Figure 9 from Abreu and Johnson (2005) is a plot of the attenuation factor in the
unsaturated zone versus source edge‐building separation distance predicted in a sand
unsaturated zone for a slab‐on‐grade building foundation. Biodegradation was not
considered in the model analysis.
Figure 9 from Abreu and Johnson (2005)
10
3.1.2 Field Data Two hydrocarbon soil‐gas databases were used to support the development of exclusion distance
criteria. One was compiled by Davis (2009) and the other by Wright (2011). The cited databases are
publically available upon request. Davis (2009) compiled the database from measurements at 58 UST,
terminal, and manufacturing sites across several states, including California. The Wright (2011)
database includes soil‐gas data collected from 124 additional UST, terminal, and manufacturing sites in
Australia. Both databases include soil‐gas data collected from on and off‐site locations. Approximately
16% of the soil‐gas data are measurements taken directly below building foundations (i.e., sub‐slab). The
field data support the model results discussed in the previous section. An analysis by Davis (2009)
indicates that benzene concentrations in soil gas are completely attenuated within 5 feet or less of
groundwater containing up to 6 mg/L (or ~1,500,000 µg/m3 vapor phase equivalent4) benzene (see
Figure 5 below from Davis, 2009). The analysis includes data from “non‐UST” locations.
It is important to note in Figure 5, that the exclusion distance (and vapor intrusion risk potential) is
relatively independent of the benzene source concentration over the approximate range of dissolved
phase concentrations up to 6,000 µg/L. The development of more conservative groundwater
4 Assuming equilibrium partitioning between soil-gas and groundwater and a Henry’s Law coefficient of 0.25 m3/m3 for benzene. The Henry’s Law constant for benzene is only expected to only vary by a factor of 2 (0.09 - 0.18) for anticipated soil temperatures ranging from at 5oC to 20oC (Baehr et al., 1999).
11
concentration‐based exclusion distances (e.g., specific exclusion distance criteria for 100 µg/L and 1,000
µg/L sources) was a policy decision.
Davis (2009) did not screen out sites with potential residual LNAPL sources above the water table (i.e.
LNAPL in soil). Note that residual LNAPL in soil and free‐phase LNAPL on groundwater will pose similar
vapor‐intrusion risks. The latter are sites where LNAPL is observed in groundwater monitoring wells
located in the source area. However, Davis (2009) found that the thickness of “clean” soil required to
fully attenuate vapors to health‐protective concentrations (i.e., the exclusion distance) decreased from
~15 feet (Figure 5) to 8 feet when accounting for residual‐phase LNAPL sources above the water table
(Davis 2010 – see Figure from Davis in Section 3.2.2).
Lahvis (2012) analyzed soil‐gas data collected above dissolved‐phase sources where efforts were taken
to identify and screen out sites with LNAPL above the water table (i.e LNAPL in soil). The analysis
filtered out sites with either direct evidence of LNAPL (current, historical) or indirect evidence of LNAPL
(soil‐gas measurements collected near potential sources (i.e., locations within 20 ft of USTs and
dispensers). The analysis did, however, include soil‐gas data from sites with dissolved‐phase (source)
concentrations up to 15 mg/L benzene. Lahvis (2012) included these additional data to assess an “upper
bound” on exclusion distances for dissolved‐phase sources, realizing that dissolved‐phase
concentrations greater than 3 mg/L benzene and 20 mg/L BTEX may potentially indicate the presence of
a residual‐phase LNAPL source (Bruce et al. , 1991). In other words, Lahvis (2012) included soil‐gas data
from sites with potential LNAPL sources to be conservative in estimating the exclusion distances for
dissolved‐phase sources. The Lahvis (2012) study included soil‐gas data from both Davis (2009) and
Wright (2011). Lahvis (2012) shows that benzene in soil vapor is attenuated below a relatively
conservative soil‐gas screening level of 30 µg/m3 for dissolved benzene sources located 5 vertical feet or
greater from the receptor. Note that more than half of the soil‐gas measurements were taken from
sites with source concentrations of benzene dissolved in groundwater ranging from 1 to 15 mg/L.
12
Figure from Lahvis (2012)
0.01
0.050.10.50.7
0.90.95
0.99
0.1
1
10
100
1000
10000
100000
1000000
0 10 20 30 40 50
BEN
ZENE CONCEN
TRATION
IN SOIL GAS (g/m
3)
DISTANCE ABOVE SOURCE ‐WATER TABLE (ft)
Detect (108 samples)
Non Detect (153 samples)
11% 13%
30%
45%
2%0%
10%20%30%40%50%
PER
CEN
TAGE OF SITES
BENZENE CONCENTRATION IN GROUND
WATER (Cw) (g/L)
DISTRIBUTION OFGROUND‐WATERCONCENTRATIONS
BENZENE
CUMULA
TIVEFR
ACTIO
N OF SO
IL‐GAS
CONCEN
TRATION DATA
(dim
ensio
nless)
The results shown in the figure from Lahvis (2012) were then used to define exclusion distance criteria based on the probability5 of the measured soil gas concentration being less than specified (vapor intrusion) screening level concentrations for benzene in soil gas of 30, 50 and 100 µg/m3. These values are consistent with current U.S. state regulatory soil‐gas screening limits for benzene which range from approximately 3 to 300 µg/m3 (see EnviroGroup Limited ‐ http://www.envirogroup.com/links.php). The data were then sorted in a cumulative distribution of specified vertical separation distances from the source (e.g., ≥ 0, ≥ 2, … ≥ 10 ft). The results are shown in the following figure:
5 Probability estimated from the concentration distribution calculated by non‐parametric Kaplan‐Meier method (Kaplan and Meier, 1958)
13
Figure from Lahvis (2012)
80
85
90
95
100
0 2 4 6 8 10
PROBABILITY (%
)
DISTANCE ABOVE SOURCE ‐WATER TABLE (ft)
BENZENE
soil‐gas concentration < 30 ug/m3
soil‐gas concentration < 50 ug/m3
soil‐gas concentration < 100 ug/m3
The results indicate that the probability of observing benzene vapor concentrations in excess of a
conservative screening level (e.g., 30 µg/m3) at distances greater than 5 ft above the dissolved phase
source at UST sites is less than 5%. The water table would have to be essentially in contact with a
building foundation for there to be a potential concern for vapor intrusion for this class of low
concentration sites. Note there is limited sensitivity to the benzene soil‐gas screening limit over the
specified range (30 – 100 µg/m3).
The data from which the vertical exclusion distances were derived encompass a broad range of
environmental site conditions, geographic retail markets, and a 14‐year time span of sample collection
(from 1997 to 2011). The exclusion distances (0 ft for dissolved‐phase sources and 13 ft for LNAPL) are
thus deemed applicable for the vast majority of petroleum UST sites, including those with differing soil
types, land‐surface covers (including sub‐slab and pavement), subsurface temperatures, and fuel
types/compositions. Approximately 67% of the soil‐gas samples in the Lahvis (2012) database were
collected at UST sites in Utah and Australia where relatively low soil‐moisture conditions are likely to
have been present. The empirical study comprised data collected throughout the year at UST sites in
Utah, Maine, Minnesota, Canada, Australia and California suspected of having highly variable subsurface
soil temperatures. The soil conditions at these sites are thus assumed to represent soil conditions
encountered at the vast majority of relatively arid UST sites in California.
Additional validation may, however, be warranted at certain unusual sites not statistically captured in
the database or by the Lahvis (2012) analysis. These sites include those with high organic matter soils
(e.g., peat), a really extensive building foundations at land surface (e.g., large commercial facilities or
apartment complexes), and high (85%) ethanol content fuel (e.g., E85) releases.
14
3.1.3 Summary of Low Concentration Sources
In summary, model and field data from UST petroleum release sites shows minimal vapor‐intrusion‐to‐
indoor air risk above dissolved‐phase only hydrocarbon sources. At low‐concentration sites, benzene,
the primary risk driver for vapor intrusion, will be attenuated below conservative soil‐gas screening
limits within 5 feet above the water table.
3.2 High‐Concentration Sources (un‐weathered residual in soil and/or free‐phase LNAPL
on groundwater)
3.2.1 Model Studies
As shown in the attached figures (Figures 5 and 7 from Abreu et al. [2009]), benzene is predicted to
completely attenuate in the unsaturated zone above an LNAPL source within ~ 7m (20 ft) of the source6.
Abreu et al (2009) used benzene to represent the greatest potential risk posed by soil vapor from an un‐
weathered LNAPL vapor source. This LNAPL source will primarily consist of aliphatic hydrocarbons. The
model is assumed to be conservative when considering benzene biodegradation assumptions (see note
7 below).
Dep
th b
gs
(m)
7 m
7 m
Depth bgs(m
)
7 m
Figure 7 (modified) fromAbreuet al. (2009)
Figure 5 (modified) fromAbreuet al. (2009)
6 Note Figures 5 and 7 from Abreu et al. (2009) were slightly modified to highlight the technical justification.
Hydrocarbon
Hydrocarbon
Oxygen
Oxygen
15
Vapor attenuation is predicted to increase for LNAPL sources displaced laterally from the basement
foundation (Abreu and Johnson, 2005).
3.2.2 Field Data
A recent analysis of a soil‐gas database by Davis (2010) indicates that the model‐predicted attenuation
cited above is conservative. Davis (2010) found source‐receptor separation distances of only 8 ft.
attenuated soil‐gas vapors associated with benzene and TPH from LNAPL sources to below health‐risk
screening criteria (see the following figure from Davis [2010]). The Davis (2010) analysis accounts for
residual LNAPL sources in the unsaturated zone.
In addition, Lahvis (2012) demonstrates in the following figure that benzene concentrations in soil gas
generally decrease by more than 4 orders of magnitude at source‐receptor separation distances of > 13
feet at LNAPL sites:
Near-Slab Multi-Depth, Sub-Slab
0
1
2
3
4
5
6
7
8
9
10
Th
ickn
ess o
f C
lean
So
il O
verl
yin
g L
NA
PL
Req
uir
ed
to
Att
en
uate
Vap
ors
, fe
et
TPH SV Sample Event over LNAPL & Soil Sources
Near-Slab Multi-Depth, Sub-Slab
0
1
2
3
4
5
6
7
8
9
10
Th
ickn
ess o
f C
lean
So
il O
verl
yin
g L
NA
PL
Req
uir
ed
to
Att
en
uate
Vap
ors
, fe
et
Benzene SV Sample Event over LNAPL & Soil Sources
Method 2 Results for LNAPL & Soil Sources
Benzene: 48 exterior/near-slab + 22 sub-slab = 70 total
TPH: 17 exterior/near-slab + 18 sub-slab = 35 total
~8 ft CLEAN overlying soil attenuates vapors associated with LNAPL/Soil Sources
Figure from Davis (2010)
Near-Slab Multi-Depth, Sub-Slab
0
1
2
3
4
5
6
7
8
9
10
Th
ickn
ess o
f C
lean
So
il O
verl
yin
g L
NA
PL
Req
uir
ed
to
Att
en
uate
Vap
ors
, fe
et
TPH SV Sample Event over LNAPL & Soil Sources
Near-Slab Multi-Depth, Sub-Slab
0
1
2
3
4
5
6
7
8
9
10
Th
ickn
ess o
f C
lean
So
il O
verl
yin
g L
NA
PL
Req
uir
ed
to
Att
en
uate
Vap
ors
, fe
et
Benzene SV Sample Event over LNAPL & Soil Sources
Method 2 Results for LNAPL & Soil Sources
Benzene: 48 exterior/near-slab + 22 sub-slab = 70 total
TPH: 17 exterior/near-slab + 18 sub-slab = 35 total
~8 ft CLEAN overlying soil attenuates vapors associated with LNAPL/Soil Sources
Figure from Davis (2010)
16
Figure from Lahvis (2012)
0.010.050.10.20.30.4
0.5
0.6
0.7
0.80.90.950.99
0.1
1
10
100
1000
10000
100000
1000000
10000000
0 10 20 30 40 50
BEN
ZENE CONCEN
TRATION IN
SOIL GAS (g/m
3)
DISTANCE ABOVE SOURCE ‐TOP OF RESIDUAL‐PHASE LNAPL (ft)
BENZENE
Detect (272 samples)
Non Detect (195 samples) CUMULA
TIVEFR
ACTIO
N OF SO
IL‐GAS
CONCEN
TRATIO
N DATA
(dim
ensio
nless)
From a conditional probability standpoint, benzene concentrations in soil gas will attenuate below 30
µg/m3 at distances of >~ 13 ft above the source in greater than 95% of cases.
Figure from Lahvis (2012)
0
20
40
60
80
100
0 5 10 15 20 25
PROBABILITY (%
)
DISTANCE ABOVE SOURCE ‐TOP OF RESIDUAL‐PHASE LNAPL (ft)
BENZENE
soil‐gas concentration < 30 ug/m3
soil‐gas concentration < 50 ug/m3
soil‐gas concentration < 100 ug/m3
Again, lateral separation exclusion distances would be expected to be less than the vertical exclusion
distances for the reasons previously presented. As noted in Lahvis (2012), the exclusion distance
estimate is also relatively insensitive to the presence/absence of a building foundation at land surface.
17
This is an important observation with respect to managing risks associated with future building
construction.
3.2.2 Summary
Most recent field data analyses indicate 8 to 13 feet of clean soil (soil with no LNAPL present) between
source and receptor is sufficient to reduce soil‐vapor concentrations to below health‐protective levels
for the vapor‐intrusion‐to‐indoor air pathway at sites with LNAPL sources in either soil or groundwater.
3.3 Technical Background Conclusions
Researchers have demonstrated that soil‐vapor benzene concentrations above low‐concentration
sources attenuate up to 6 orders of magnitude in the unsaturated zone within short vertical distances
(e.g., < 5 ft) due to biodegradation. Biodegradation is sufficient to essentially eliminate these sites from
further vapor intrusion consideration.
At sites with high concentration sources (e.g., un‐weathered LNAPL sources), 8 to 13 feet of clean soil
(i.e. TPH <100 mg/kg) are required to fully attenuate hydrocarbon vapors to health‐protective
concentrations for the vapor‐intrusion‐to‐indoor air pathway. The attenuation due to biodegradation
would be equally or more significant for LNAPL sources separated laterally from building foundations
(i.e. a shorter distance would be required for attenuation to health‐protective concentrations).
The use of soil‐gas data to support the development of vapor intrusion guidance for petroleum
hydrocarbon site screening is relatively new. Consequently, the technical justification includes several
references to non‐peer‐reviewed literature. The work of Lahvis (2012) has recently been documented
and is intended for publication in peer‐reviewed literature. The study is being used to support the
development of vapor intrusion guidance for US EPA Office of Underground Storage Tanks. Although
the analyses are subject to change as a consequence of the peer review, the non peer‐reviewed
attachments are based on sound scientific knowledge and fundamental to the validation of model
theory and development of vapor intrusion guidance. It is important to consider these “state of the
science” results in the development of rational, technically defensible, approaches to vapor intrusion
risk assessment. Please note that the Stakeholder Group that developed the Low‐Threat UST Policy
Petroleum considered the cited technical sources when developing the vapor‐intrusion scenarios and
associated risk criteria presented in the Low‐Threat Policy. In addition, as a statewide policy
consideration, the Stakeholder Group applied source‐to‐receptor separation distance and source
concentration safety factors that make the proposed vapor‐intrusion‐to‐indoor‐air screening criteria
more conservative than they would otherwise be if considering the scientific literature alone. These
safety factors include greater separation distances and lower threshold concentrations than those found
by researchers to be health protective.
4 THE FOUR LOW‐THREAT VAPOR INTRUSION SCREENING SCENARIOS
The Stakeholder Group convened by the SWRCB considered the available current and relevant scientific
studies when developing the following low‐threat vapor‐intrusion‐to‐indoor air criteria. The four basic
vapor‐intrusion scenarios are:
18
Scenario 1: Un‐weathered LNAPL on groundwater 30 ft vertical source/building separation (exclusion) distance for un‐weathered (residual or free‐phase) LNAPL on groundwater
Scenario 2: Un‐weathered LNAPL in soil
30 ft lateral and vertical source/building separation (exclusion) distance for an un‐weathered LNAPL (residual or free‐phase) LNAPL source in soil and a building foundation
Scenario 3: Dissolved phase benzene concentrations in groundwater
5 feet vertical separation distance between a dissolved‐phase source < 100 µg/L benzene and a building foundation (no oxygen (O2) measurement)
10 feet vertical exclusion distance for a dissolved‐phase source < 1,000 µg/L benzene (no O2 measurement)
5 ft. vertical separation distance between a dissolved‐phase source < 1,000 µg/L and a building foundation (measured O2 in soil gas > 4%
7)
Scenario 4: Direct measurement of soil gas concentrations Application of an additional thousand‐fold biodegradation attenuation factor to risk‐based soil‐gas concentration criteria (CHHSLs) when the source is located more than 5 feet from a building foundation
Scenarios 1 and 2 are will usually be associated with “high”‐concentration sources. Scenario 3 is
associated with a “low” concentration source, and Scenario 4 may be associated with either “low” or
“high” concentration sources. The following section details the technical justification(s) for each of the
sets of low‐threat exclusion criteria expressed in the four scenarios.
The vapor‐intrusion exclusion distance criteria determined for benzene are assumed to be health‐
protective for other potential hydrocarbon VOCs, such as ethylbenzene and naphthalene. For
ethylbenzene, this assumption is based on 1) ethylbenzene having similar source concentrations and
fate and transport properties as benzene (Abreu et al., 2009), and 2) a strong correlation between
benzene and ethylbenzene concentrations in soil‐gas measured concurrently from the same soil‐gas
probe (see following figure from Lahvis [2012]):
7 4% refers to 40,000 ppmv. O2 concentrations in soil gas sufficient to support aerobic mineralization are reported to be in the range of 1 to 4 % (DeVaull, 2007).
The exclusion distance criteria determined for benzene are assumed to be conservative for naphthalene
because 1) naphthalene is typically present in gasoline at lower fractions as benzene, 2) naphthalene is
likely present at very low concentrations (mass fraction of 0.0026) in diesel (Potter and Simmons, 1998),
and 3) naphthalene is less volatile, and has similar (if not, higher) degradation rates as benzene (GSI,
2010).
4.1 Scenario 1: Un‐weathered LNAPL on Groundwater
30 ft vertical source/building separation (exclusion) distance for un‐weathered (residual or free‐phase) LNAPL on groundwater
The proposed 30 feet exclusion distance8 is conservative based on:
Model theory shows full attenuation within 7 m (~ 20 ft) of a high concentration LNAPL source
assuming reasonable approximations of the biodegradation rate (see Figures 5 and 7 below
from Abreu et al., 2009)9. The use of benzene to represent an un‐weathered LNAPL vapor
source (which will primarily consist of aliphatic hydrocarbons) is assumed to be conservative
with respect to benzene biodegradation assumptions (linked to O2 availability)10.
8 The top of the residual‐phase source can generally be assumed to be consistent with the historic high water‐table elevation.
9 Note Figures 5 and 7 from Abreu et al. (2009) were slightly modified to highlight the technical justification 10 In this model, biodegradation is linked to O2 availability. Biodegradation is not simulated when O2 concentrations in the unsaturated zone fall below 1%. Relative to benzene, aliphatic hydrocarbons are less susceptible to biodegradation because they partition less to the aqueous phase (pore water) where biodegradation takes place. Simulating LNAPL with a single benzene source will thus be conservative with respect to O2 demand (and benzene biodegradation) compared to simulating LNAPL using a primarily aliphatic hydrocarbons.
20
Dep
th b
gs
(m)
7 m
7 m
Depth bgs(m
)
7 m
Figure 7 (modified) fromAbreuet al. (2009)
Figure 5 (modified) fromAbreuet al. (2009)
For LNAPL and residual sources, field (soil‐gas) data show full attenuation within 8 ft of the
source (see figure, below, from R. Davis [2010] – also published in Hartman [2010]).
Near-Slab Multi-Depth, Sub-Slab
0
1
2
3
4
5
6
7
8
9
10
Th
ickn
ess o
f C
lean
So
il O
verl
yin
g L
NA
PL
Req
uir
ed
to
Att
en
uate
Vap
ors
, fe
et
TPH SV Sample Event over LNAPL & Soil Sources
Near-Slab Multi-Depth, Sub-Slab
0
1
2
3
4
5
6
7
8
9
10
Th
ickn
ess o
f C
lean
So
il O
verl
yin
g L
NA
PL
Req
uir
ed
to
Att
en
uate
Vap
ors
, fe
et
Benzene SV Sample Event over LNAPL & Soil Sources
Method 2 Results for LNAPL & Soil Sources
Benzene: 48 exterior/near-slab + 22 sub-slab = 70 total
TPH: 17 exterior/near-slab + 18 sub-slab = 35 total
~8 ft CLEAN overlying soil attenuates vapors associated with LNAPL/Soil Sources
Figure from Davis (2010)
Near-Slab Multi-Depth, Sub-Slab
0
1
2
3
4
5
6
7
8
9
10
Th
ickn
ess o
f C
lean
So
il O
verl
yin
g L
NA
PL
Req
uir
ed
to
Att
en
uate
Vap
ors
, fe
et
TPH SV Sample Event over LNAPL & Soil Sources
Near-Slab Multi-Depth, Sub-Slab
0
1
2
3
4
5
6
7
8
9
10
Th
ickn
ess o
f C
lean
So
il O
verl
yin
g L
NA
PL
Req
uir
ed
to
Att
en
uate
Vap
ors
, fe
et
Benzene SV Sample Event over LNAPL & Soil Sources
Method 2 Results for LNAPL & Soil Sources
Benzene: 48 exterior/near-slab + 22 sub-slab = 70 total
TPH: 17 exterior/near-slab + 18 sub-slab = 35 total
~8 ft CLEAN overlying soil attenuates vapors associated with LNAPL/Soil Sources
Figure from Davis (2010)
Hydrocarbon Oxygen
OxygenHydrocarbon
21
The following figure from Lahvis (2012) shows a greater than 95% probability that benzene
concentrations in soil gas will attenuate below a conservative screening level for benzene in soil gas of
30 µg/m3 (alternatively, a < 5 % probability of observing benzene concentrations > 30 µg/m3) at
distances of > ~13 ft from a LNAPL (residual or free‐phase) source.
Figure from Lahvis (2012)
0
20
40
60
80
100
0 5 10 15 20 25
PROBABILITY (%
)
DISTANCE ABOVE SOURCE ‐TOP OF RESIDUAL‐PHASE LNAPL (ft)
BENZENE
soil‐gas concentration < 30 ug/m3
soil‐gas concentration < 50 ug/m3
soil‐gas concentration < 100 ug/m3
4.2 Scenario 2: Un‐weathered LNAPL in Soil
30 ft lateral and vertical source/building separation (exclusion) distance for an un‐weathered LNAPL (residual or free‐phase) LNAPL source in soil and a building foundation
The same technical justification provided for Scenario 1 applies to Scenario 2. The proposed 30 feet
lateral off‐set distance is even more conservative for sources displaced laterally as indicated in the
following figure from Abreu and Johnson (2005). For example, an additional order of magnitude of
attenuation is predicted for plume centerlines displaced 10 m (~30 ft).
22
Figure 9 from Abreu and Johnson (2005)
As discussed in the technical background section 3.2.2, 13 feet is more than adequate to fully attenuate
vapors derived from LNAPL sources in soil and groundwater; therefore providing a 30‐ft lateral distance
screening criteria provides an additional safety factor.
4.3 Scenario 3: Dissolved Phase Benzene Concentrations in Groundwater
5 ft. vertical separation distance between a dissolved‐phase source < 100 µg/L benzene and a building foundation (no oxygen (O2) measurement)
10 ft. vertical exclusion distance for a dissolved‐phase source < 1,000 µg/L benzene (no O2 measurement)
5 ft. vertical separation distance between a dissolved‐phase source < 1,000 µg/L and a building foundation (measured O2 in soil gas ≥ 4% or 40,000 ppmv)
These separation distances are conservative with respect to protecting human health based on the
following:
Complete attenuation (~ 1E‐07) is predicted within 2 m (6 ft.) of a soil gas source of benzene <
10 mg/L (or or 10,000,000 µg/m3) (assumes an approximate 40 mg/L dissolved phase benzene
concentration, based on an approximation of benzene partitioning between soil gas and
groundwater [dimensionless Henry’s Law constant = 0.25] ‐ see attached Figure 10 from Abreu
23
et al. [2009]11). Even greater hydrocarbon attenuation (lesser exclusion distances) is predicted
for dissolved‐phase sources in other less permeable (e.g., silty clay) unsaturated zone systems
(Abreu et al, 2009). The attenuation is complete for the entire vapor (dissolved‐phase)
concentration range. The dissolved phase concentrations (especially) (i.e., 100 µg/L) and
proposed exclusion distance specified in this scenario are therefore assumed to be very
conservative. Note: in the figure below, “L” is the distance to the foundation from the source.
Figure 10 from Abreu et al. (2009)
Model theory shows > 9 orders of magnitude (i.e. complete) attenuation (for reasonable
approximations of the biodegradation rate � = 0.79 hr‐1) within a source/building separation
distance of L=3 m (10 ft) in a sand unsaturated zone (Abreu et al. (2009)). This magnitude of
attenuation is applicable for a benzene vapor source < ~10 mg/L (10,000,000 µg/m3)(or ~40
mg/L dissolved phase source in groundwater assuming reasonable approximations for benzene
partitioning between soil gas and groundwater (i.e., a dimensionless Henry’s Law constant =
0.25). Even greater hydrocarbon attenuation (lesser exclusion distances) is predicted for
dissolved‐phase sources in other less permeable (e.g., silty clay) unsaturated zone systems
11 Note figure from Abreu et al. (2009) was slightly modified to highlight the technical justification
24
(Abreu et al, 2009). The attenuation is complete for the entire vapor (dissolved‐phase)
concentration range. The dissolved phase concentrations (especially) (1,000 µg/L) and proposed
exclusion distance specified in this scenario are therefore assumed to be very conservative.
Note: in the figure below, “D” is the overall source depth and “L” is the distance to the
foundation from the source.
Figure 6 from Abreu et al. (2009)
Field soil‐gas data show complete soil‐gas attenuation within 5 feet above benzene
concentrations in groundwater of up to 6 mg/L (Davis, 2009).
25
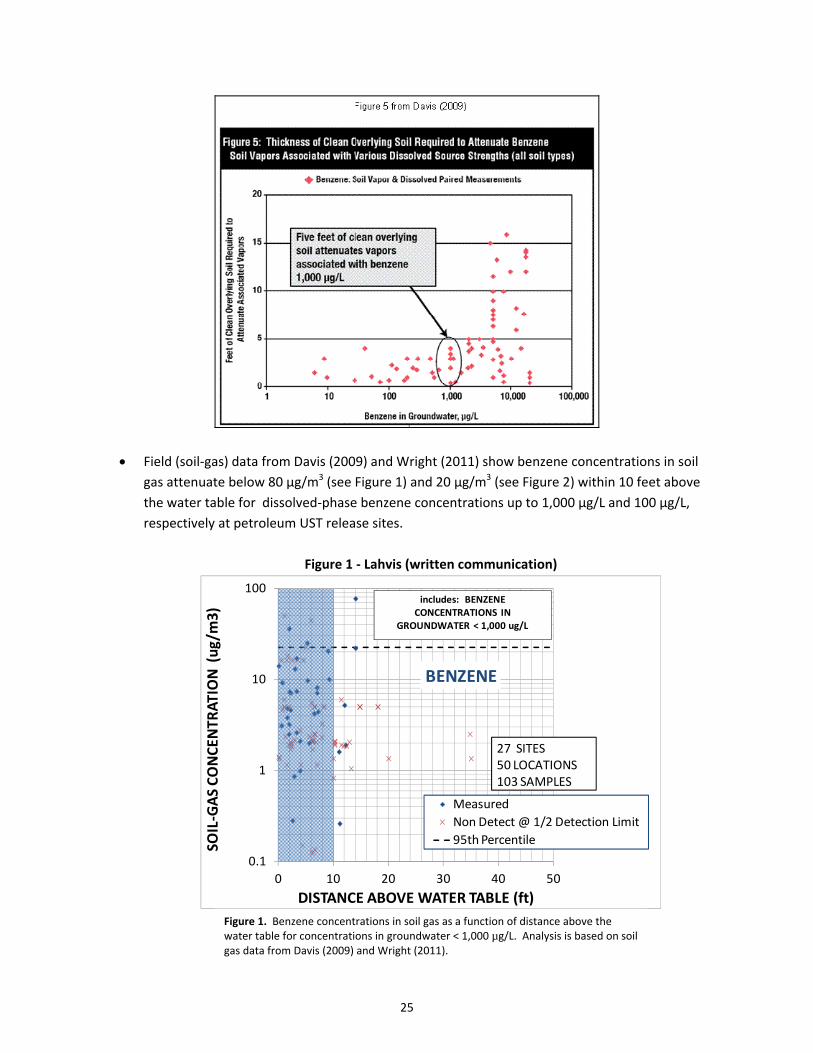
Field (soil‐gas) data from Davis (2009) and Wright (2011) show benzene concentrations in soil
gas attenuate below 80 µg/m3 (see Figure 1) and 20 µg/m3 (see Figure 2) within 10 feet above
the water table for dissolved‐phase benzene concentrations up to 1,000 µg/L and 100 µg/L,
respectively at petroleum UST release sites.
Figure 1 ‐ Lahvis (written communication)
0.1
1
10
100
0 10 20 30 40 50
SOIL‐GAS CONCEN
TRATION (ug/m3)
DISTANCE ABOVE WATER TABLE (ft)
Measured
Non Detect @ 1/2 Detection Limit
95th Percentile
27 SITES50 LOCATIONS103 SAMPLES
BENZENE
includes: BENZENECONCENTRATIONS IN
GROUNDWATER < 1,000 ug/L
Figure 1. Benzene concentrations in soil gas as a function of distance above the water table for concentrations in groundwater < 1,000 µg/L. Analysis is based on soil gas data from Davis (2009) and Wright (2011).
The probability of benzene vapor concentrations near the receptor exceeding a conservative
screening level of 50 µg/m3 is less than 5% at petroleum‐UST release sites with benzene
concentrations in groundwater < 1,000 µg/L. The probability is less than 5% regardless of
the source‐receptor separation distance (see Figure 3 – Lahvis [written communication]).
The water table would have to be essentially in contact with a building foundation to create
a potential concern for vapor intrusion at low concentration sites.
Figure 2. Benzene concentrations in soil gas as a function of distance above the water table for concentrations in groundwater < 100 µg/L. Analysis is based on soil gas data from Davis (2009) and Wright (2011).
27
Figure 3 from Lahvis (written communication)
80%
82%
84%
86%
88%
90%
92%
94%
96%
98%
100%
0 5 10 15 20 25
PROBABILITY (%
)
DISTANCE ABOVE WATER TABLE (ft)
includes non detects at 0.5 detection limit
< 10 ug/m3
< 50 ug/m3
< 100 ug/m3
BENZENE
includes: BENZENE CONCENTRATIONS IN GROUNDWATER < 1,000 ug/L
The probability of benzene vapor concentrations near the receptor exceeding a (very)
conservative screening level (i.e., 10 µg/m3) at petroleum‐UST release sites with benzene
concentrations in groundwater < 100 µg/L is less than 5% regardless of the source‐receptor
separation distance (see Figure 4 from Lahvis [written communication]). The water table
would have to essentially be in contact with a building foundation to create a potential
concern for vapor intrusion at low concentration sites.
Figure 3. Probability of encountering benzene concentrations in soil gas above conservative screening‐level concentrations of 10, 50, and 100 µg/m3 at various distances above the water table at UST‐only locations. The data are associated benzene (source) concentrations in groundwater < 1,000 µg/L and are taken from the databases reported in Davis (2009) and Wright (2011).
28
Figure 4 from Lahvis (written communication)
90%
91%
92%
93%
94%
95%
96%
97%
98%
99%
100%
0 5 10 15 20 25
PROBABILITY (%)
DISTANCE ABOVE WATER TABLE (ft)
includes non detects at 0.5 detection limit
< 10 ug/m3
< 50 ug/m3
< 100 ug/m3
BENZENE
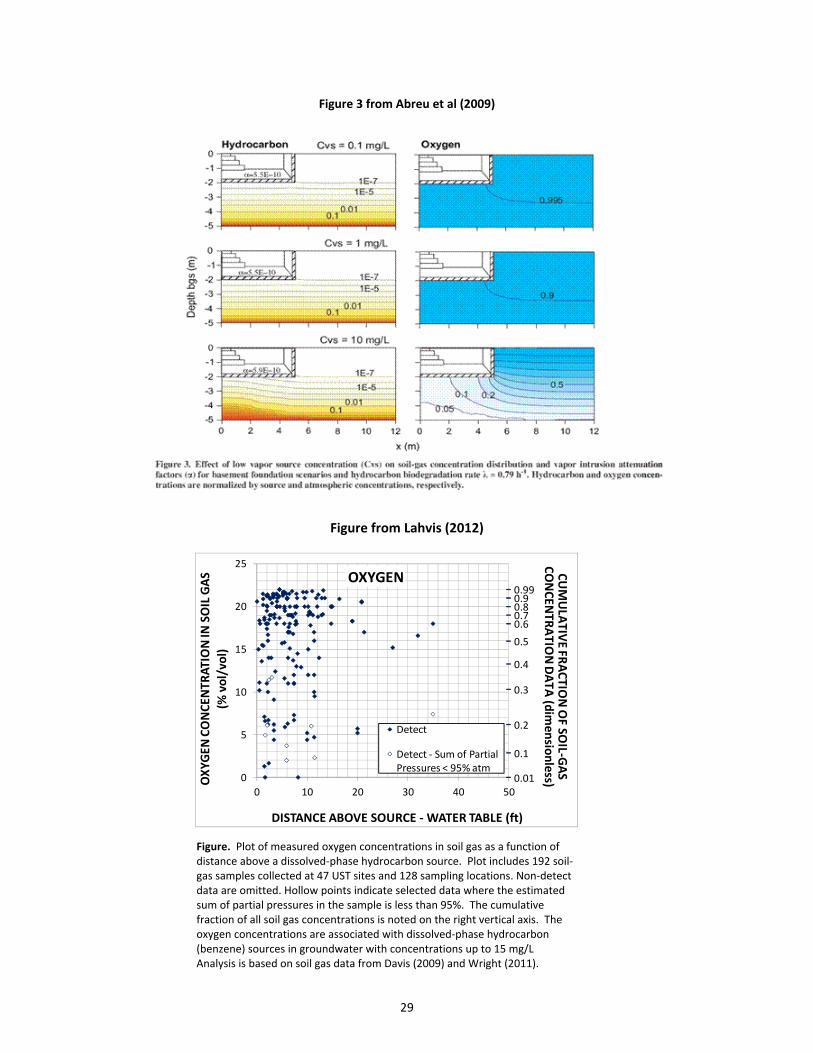
The model results from Abreu et al. (2009) (see Figure 3 below) show O2 concentrations in
excess of ~17% (0.8 * 21%) for a hydrocarbon (benzene) vapor source concentration of 1
mg/L (1,000 µg/L) (see plots in middle of the figure). This benzene (or BTEX) vapor source
concentration is roughly equivalent to a dissolved phase source concentration of ~4,000
µg/L, which is > the maximum dissolved‐phase benzene concentration “1,000µg/L” defined
for Scenario 3. This calculation assumes:
a) the dissolved‐phase source is primarily BTEX (the most soluble hydrocarbon
fraction)
b) vapor/aqueous partitioning occurs according to Henry’s law, and
c) a dimensionless Henry’s Law partition coefficient for benzene (or BTEX) of 0.25.
Analyses of soil‐gas data from Davis (2010) and Wright (2011) show that O2 concentrations
in soil gas are > 4% (40,000 ppmv) at sites with dissolved‐phase sources of benzene in
groundwater up to 15 mg/L (see Figure from Lahvis [2012]).
Figure 4. Probability of encountering benzene concentrations in soil gas
above conservative screening‐level concentrations of 10, 50, and 100 g/m3 at various distances above the water table at UST‐only locations. The data are
associated benzene (source) concentrations in groundwater < 100 g/L and are taken from the databases reported in Davis (2009) and Wright (2011).
29
Figure 3 from Abreu et al (2009)
Figure from Lahvis (2012)
0.01
0.1
0.2
0.3
0.4
0.5
0.60.70.80.90.99
0
5
10
15
20
25
0 10 20 30 40 50
OXYG
EN CONCEN
TRATION IN
SOIL GAS
(% vol/vol)
DISTANCE ABOVE SOURCE ‐WATER TABLE (ft)
OXYGEN
Detect
Detect ‐ Sum of Partial Pressures < 95% atm
CUMULA
TIVEFR
ACTIO
N OF SO
IL‐GAS
CONCEN
TRATIO
N DATA
(dim
ensio
nless)
Figure. Plot of measured oxygen concentrations in soil gas as a function of distance above a dissolved‐phase hydrocarbon source. Plot includes 192 soil‐gas samples collected at 47 UST sites and 128 sampling locations. Non‐detect data are omitted. Hollow points indicate selected data where the estimated sum of partial pressures in the sample is less than 95%. The cumulative fraction of all soil gas concentrations is noted on the right vertical axis. The oxygen concentrations are associated with dissolved‐phase hydrocarbon (benzene) sources in groundwater with concentrations up to 15 mg/L Analysis is based on soil gas data from Davis (2009) and Wright (2011).
30
4.3 Scenario 4: Direct Measurement of Soil Gas Concentrations
Application of a thousand‐fold attenuation factor to risk‐based soil‐gas criteria (i.e. CHSSLs) for sources located more than 5 vertical feet from a building foundation.
Model results (see Figure 10 from Abreu et al., 2009) show that biodegradation produces an
approximate 10,000‐fold attenuation of benzene concentrations in soil‐gas up to ~10 mg/L or
10,000,000 µg/m3 within 2 m (5 ft) of a building foundation for reasonable approximations of
the degradation rate in a sand unsaturated zone12. The proposed 1,000‐fold additional
attenuation for benzene concentrations in soil gas up to 85,000 and 280,000 µg/m3 located
more than vertical 5 feet from a building foundation is thus deemed conservative for residential
and commercial settings, respectively.
Modified Figure 10 from Abreu et al. (2009)
No Biodegradation L = 2m (approximate)
additional attenuation = ~1.E‐04 related to biodegradation
Measured field soil‐gas (benzene) concentrations from Davis (2009) and Wright (2011)
collected from vertically nested vapor probes support the model theory (see Figure below
12 Figure modified to show ‘No Biodegradation L = 2m (approximate)’ and additional attenuation to highlight technical justification.
31
from Lahvis [written communication]). More specifically, these data show that benzene
attenuation in the unsaturated zone generally exceeds 1000‐fold within a 5 feet vertical
distance of a benzene (source) soil‐gas concentration range between 10,000 and 100,000
µg/m3 (see Figure 5 – middle box). Similar attenuation is observed for benzene soil gas
(source) concentrations ranging between 100,000 and 1,000,000 µg/m3 (see Figure 5 – left
hand box). Less attenuation is observed for benzene soil gas (source) concentrations
ranging between 1,000 and 10,000 µg/m3 (see Figure 5 – right hand box). The statistics for
this concentration range are affected, however, by non‐detect values reported at ½ the
detection limit. The soil‐gas data are from the databases described by Davis (2009) and
Wright (2011) for petroleum‐UST release locations. This finding supports the model theory
of Abreu et al. (2009) and the proposed use of a 1000‐fold soil‐gas bioattenuation factor.
Figure from Lahvis (written communication)
10-7
10-6
10-5
10-4
10-3
10-2
10-1
100
SOIL GAS ATTENUATION FACTORS (BENZENE)FOR DISTANCES <= 5 FT
n = 15n = 7
n = 7
SOURCE CONCENTRATION IN SOIL GAS (CSG) (ug/m3)
affected by non detects
AT
TE
NU
AT
ION
FA
CT
OR
(D
IME
NS
ION
LES
S)
Each box encloses 50% of the data with the median value of the variable displayed as a line. The top and bottom of the box mark the limits of ± 25% of the variable population. The lines extending from the top and bottom of each box mark the minimum and maximum values within the data set that fall within an acceptable range defined by the software. Any value outside of this range, called an outlier, is displayed as an individual point.
7 sites10 locations
3 sites5 locations
6 sites6 locations
Figure 5. Box plots based on statistical analysis of benzene soil‐gas data collected concurrently from vertically nested probe locations separated by distances ≤ 5 ft. The soil‐gas data are taken from the databases reported in Davis (2009) and Wright (2011).
32
5 REFERENCES
Abreu, L.D., Ettinger, R. and T. McAlary , 2009, Simulated soil vapor intrusion attenuation factors including biodegradation for petroleum hydrocarbons. Ground Water Mont. Rem. 29, 105–177.
Abreu, L.D. and P.C. Johnson, 2005, Effect of vapor source, building separation and building construction on soil vapor intrusion as studied with a three‐dimensional numerical model, Environ. Sci. and Technol., 39, 4550‐4561.
Alaska DEC, 2011, Hydrocarbon Risk Calculator User Manual, prepared for Alaska Department of Environmental Conservation by Lawrence Acomb Geosphere, Inc., January 4, 2011 (http://www.dec.state.ak.us/spar/csp/guidance/hrc/HRC%20User%20Manual.pdf)
Andersen, R. G., Booth, E. C., Marr, Widdowson, M.A., Novak, J.T., 2008, Volatilization and biodegradation of naphthalene in the vadose zone impacted by phytoremediation, Environ. Sci. Technol., 42, 2575–2581.
API, 2009, Simulating the Effect of Aerobic Biodegradation on Soil Vapor Intrusion into Buildings—Evaluation of Low Strength Sources Associated with Dissolved Gasoline Plumes, Publication No. 4775; American Petroleum Institute: Washington, D.C., April 2009, pp. 37.
ASTM E‐2531–06, 2006, Standard Guide for Development of Conceptual Site Models and Remediation Strategies for Light Nonaqueous‐Phase Liquids Released to the Subsurface, ASTM International, West Conshohocken, PA, 19428‐2959 USA
Baehr, A.L., Stackelberg, P.E., and R.J. Baker, 1999, Evaluation of the atmosphere as a source of volatile organic compounds in shallow groundwater. Water Resources Research 35: 127‐136.
Bruce, L., Miller, T., and B. Hockman, 1991, Solubility versus equilibrium saturation of gasoline compounds: A method to estimate fuel/water partition coefficient using solubility or Koc, proceedings of National Ground Water Association Petroleum Hydrocarbons and Organic Chemicals in Ground Water: Prevention, Detection, and Restoration, November 20‐22, 1991, Houston, Tx, 571 ‐582.
Davis, R.V., 2009, Bioattenuation of petroleum hydrocarbon vapors in the subsurface update on recent studies and proposed screening criteria for the vapor‐intrusion pathway, LUSTLine Report 61, May 2009, New England Interstate Water Pollution Control Commission (NEIWPCC), pp. 11‐14. (http://www.neiwpcc.org).
Davis, R., 2010, Evaluating the vapor intrusion pathway: Subsurface petroleum hydrocarbons and recommended screening criteria, 22nd Annual US EPA National Tanks Conference, Boston, Massachusetts, September 20‐22, 2010.
DeVaull, G. E., R. A. Ettinger, J.P. Salinitro, and J. B. Gustafson, 1997, Benzene, toluene, ethylbenzene, and xylenes (BTEX) degradation in vadose zone soils during vapor transport: First order rate constants, paper presented at NWWA/API Conference on Petroleum Hydrocarbons and Organic Chemicals in Ground Water: Prevention, Detection, and Remediation, National Water Well Association, Houston, Texas, November 12‐14 1997.
DeVaull, 2007, Indoor vapor intrusion with oxygen‐limited biodegradation for a subsurface gasoline source, Environ. Sci. Technol., 41, 3241‐3248.
33
DeVaull, G. E. 2011. Biodegradation rates for petroleum hydrocarbons in aerobic soils: A summary of measured data. International Symposium on Bioremediation and Sustainable Environmental Technologies, Reno, Nevada, USA, June 27‐30.
Fischer, D. and C. G. Uchrin, 1996, Laboratory simulation of VOC entry into residence basements from soil gas, Environ. Sci. Technol., 30, 2598‐2603.
GSI Environmental Inc., 2010, BioVapor, A 1‐D Vapor Intrusion Model with Oxygen‐Limited Aerobic Biodegradation, User’s Manual, Published by American Petroleum Institute: Washington, D.C., April 2010.
Guymon, G. L., 1994, Unsaturated Zone Hydrology. Prentice Hall, Englewood Cliffs, NJ.
Hartman, B., 2010, The vapor‐intrusion pathway: Petroleum hydrocarbon issues, LUSTLine Report 66, December 2010, New England Interstate Water Pollution Control Commission (NEIWPCC), pp. 11‐14. (http://www.neiwpcc.org).
Kaplan, E.L. and P. Meier, 1958, Nonparametric estimation from incomplete observations. Journal of the American Statistical Association 53: 457‐481.
Lahvis, M.A., 2011, Significance of biodegradation at petroleum hydrocarbon sites: Implications for vapor intrusion guidance, presentation at 23nd Annual US EPA National Tanks Conference and Expo, St Louis, Missouri, March 19‐21, 2012.
Lahvis, M.A., and A.L. Baehr, 1996, Estimating rates of aerobic hydrocarbon biodegradation by simulation of gas transport in the unsaturated zone: Water Resources Res., 32, 2231‐2249.
McHugh, T.E., Kamath, R., Kilkarni, P.R., Newell, C.J., Connor, J.A., and S. Garg 2012. Remediation progress at California LUFT sites: Insights from the Geotracker database. American Petroleum Institute Soil and Groundwater Research Bulletin, No. 25. American Petroleum Institute, Washington, D.C.
Morrison, R.D., 1999, Environmental Forensics: Principles and Applications, CRC Press.
Potter, T. and K.E. Simmons, 1998, Total Petroleum Hydrocarbon Criteria Working Group Series, Volume 2: Composition of Petroleum Mixtures.
U.S. EPA, 2008, U.S. EPA’s vapor intrusion database: Preliminary evaluation of attenuation factors, Draft document, Office of Solid Waste U.S. Environmental Protection Agency, Washington, DC, March 4. 2008, pp. 37. http://www.envirogroup.com/publications/oswer_database_report_combined_3‐4‐08_(2).pdf
Wright, J. 2011, Establishing exclusion criteria from empirical data for assessing petroleum hydrocarbon vapour intrusion, Program and Proceedings of the 4th International Contaminated Site Remediation Conference ‐ 2011 CleanUP, Adelaide, South Australia, September 11 – 15, 2011, pp. 195‐19.
Zemo, D. 2006, Sampling in the Smear Zone: Evaluation of Nondissolved Bias and Associated BTEX, MTBE, and TPH Concentrations in Ground Water Samples. Ground Water Monitoring and Remediation 26: 125‐133.