ANL-08/26 Technical Letter Report on Validation of the Equivalent Rectangular Crack Method August 2008 Prepared by Saurin Majumdar, Chi Bum Bahn, Ken Kasza, and Sasan Bakhtiari Argonne National Laboratory 9700 South Cass Avenue Argonne, IL 60439 M. Stambaugh, NRC Project Manager Prepared for Division of Engineering Office of Nuclear Regulatory Research U.S. Nuclear Regulatory Commission Washington, DC 20555–0001 NRC Job Code N6583
Transcript
ANL-08/26
Technical Letter Report on Validation of the Equivalent Rectangular Crack Method
August 2008
Prepared by Saurin Majumdar, Chi Bum Bahn, Ken Kasza, and Sasan Bakhtiari
Argonne National Laboratory 9700 South Cass Avenue Argonne, IL 60439
M. Stambaugh, NRC Project Manager
Prepared for Division of Engineering Office of Nuclear Regulatory Research U.S. Nuclear Regulatory Commission Washington, DC 20555–0001 NRC Job Code N6583
Contents
List of Figures ................................................................................................................... iii
List of Tables .................................................................................................................... iv
Executive Summary.......................................................................................................... v
Acronyms and Abbreviations............................................................................................. vi
Symbols............................................................................................................................ vi
1. Determination of equivalent rectangular crack length and depth. ............................. 2
2. Crack depth profiles of specimens as determined from NDE signal.......................... 5
3. Pressure and leak rate variation as a function of time for SGL-489 during the ligament rupture test. Note time-dependent leakage at constant pressure............... 7
4. Pressure and leak rate variation as a function of time for SGL-121 during the ligament rupture test................................................................................................ 7
5. Pressure and leak rate variation as a function of time for SGL-443 during the ligament rupture test................................................................................................ 8
6. Pressure and leak rate variation as a function of time for SGL-302 during the ligament rupture test................................................................................................ 8
7. Flow rate variation as a function of pressure for SGL-302. ....................................... 9
8. Pressure variation as a function of time for SGL-447 during the ligament rupture test........................................................................................................................... 9
9. Pressure variation as a function of time for SGL-735 during the ligament rupture test........................................................................................................................... 10
10. Crack depth profiles as measured by NDE and fractography for specimens (a) SGL-489 and (b) SGL-302. ....................................................................................... 11
11. Crack depth profiles as measured by NDE and fractography for specimen SGL-735 .......................................................................................................................... 11
12. Photographs of OD crack opening area after ligament tearing tests (in photo, one graduation is equal to 1 mm).................................................................................... 14
iii
List of Tables
1. NDE characteristics of the selected SCC specimens.................................................. 3
2. Test ligament rupture pressures, leak rates at initial leakage, and burst pressures. ................................................................................................................ 6
3. Predicted and observed ligament rupture pressures, equivalent throughwall rectangular crack lengths (predicted and estimated from measured leak rates), and unstable burst pressures. All specimens except SGL-735 were subjected to high temperature annealing treatment. .................................................................... 15
iv
Executive Summary
There is a considerable body of literature available for rupture tests on pipes and tubes with throughwall and part-throughwall notches and correlations to predict the rupture pressures based on pipe and tube dimensions and material properties. However, stress corrosion cracks are much too complex for these correlations to apply directly. The equivalent rectangular crack method is a way of developing a rectangular part-throughwall notch that has the same ligament rupture pressure as the original stress corrosion crack. The approach has been validated by rupture tests on a variety of machined notches and to a limited extent by tests on stress corrosion cracks. However, most of these stress corrosion cracks were deep with short throughwall segments. In many cases they leaked when tested with 30 psi nitrogen, although they did not leak when tested with water until much higher pressures. The present study was initiated to try to validate the equivalent rectangular approach for stress corrosion cracks that are less deep and do not have throughwall segments, i.e., do not leak when tested with 30 psi nitrogen.
Six specimens with stress corrosion cracks were selected for rupture and leak test. Five of the six specimens were grown in the laboratory on tubes that were subjected to a heat treatment that included high temperature annealing prior to thermal aging which resulted in a reduction of flow stress by approximately 20% compared to that of the sixth specimen. Of all the tests, only one test showed evidence of a sudden ligament rupture without immediate unstable burst. The rupture pressure and the leak rate for this test were predicted reasonably well by the equivalent rectangular crack method using the reduced flow stress properties. Two other tests (which included the specimen without the high temperature annealing treatment) experienced sudden simultaneous ligament rupture and unstable burst and the ligament rupture pressures (which equaled the unstable burst pressures for both tests) were predicted reasonably well by the equivalent rectangular crack method. In the remaining tests, leakage started as a small leak rate, which increased with time during constant pressure hold, indicating that the throughwall crack lengths increased with time due to ligament tearing. The pressures at the onset of first leakage of these tests were underestimated by the equivalent rectangular crack method significantly and the throughwall crack lengths estimated from the initial measured leak rate were significantly shorter than those predicted by the equivalent rectangular crack method.
All but one of the specimens tested had cracks that were either too long (>18 mm) or were too deep (≥85%) and were subjected to high temperature annealing treatment. To fully validate the equivalent rectangular crack method, more tests are needed on specimens without the annealing treatment and with stress corrosion cracks that are shallower and shorter.
v
Acronyms and Abbreviations
ANL Argonne National Laboratory
EPRI Electric Power Research Institute
LWR Light Water Reactor
MA Mill Annealed
NRC Nuclear Regulatory Commission
PWR Pressurized Water Reactor
SCC Stress Corrosion Cracking
SG Steam Generator
SGT Steam Generator Tube
Symbols
a Crack depth
c Semi crack length
E Elastic modulus
h Tube wall thickness
k Flow stress factor
m Bulging factor
mp Stress magnification factor
Su Ultimate stress
Sy Yield stress
Factors for defining mp
Hoop stress
Flow stress
cr Unstable burst pressure
lig Average ligament stress
vi
1 Introduction
Most analytical methods for predicting ligament rupture and unstable burst pressures of cracks were developed for perfect rectangular cracks. On the other hand, stress corrosion cracks (SCCs) are complex and irregular-shaped for which the current analytical methods are not directly applicable. The equivalent rectangular crack method is a way of defining a rectangular part-throughwall notch that has the same ligament rupture pressure as the original SCC. The approach has been validated by rupture tests on a variety of machined notches and to a limited extent by tests on SCCs. However, most of these SCCs were deep with short throughwall segments. In many cases, they leaked when tested with 30 psi nitrogen, although they did not leak when tested with water until much higher pressures. The present study was initiated to try to validate the equivalent rectangular approach for SCCs that are less deep and do not have throughwall segments, i.e., do not leak when tested with 30 psi nitrogen.
2 Background
The unstable burst pressure (cr) of a thin-walled tube made of ductile isotropic material with a throughwall axial crack of length 2c is given by1
cr /m (1)
where flow stress = k(S
y S
u) with k = 0.5 - 0.61, and Sy and Su are the yield and ultimate
tensile strengths, respectively, and m is a bulging factor that depends on crack length and tube dimensions.
For rectangular cracks that are part-throughwall, a general failure criterion for predicting rupture of the crack tip ligament can be expressed as follows:1
lig , (2a)
where lig is the average ligament stress, which, for the axial crack is given by
lig m
p , (2b)
where mpis the ligament stress magnification factor (which depends on the axial crack length and depth), and is the nominal hoop stress.
An expression for mp of rectangular part-throughwall axial cracks was presented in Ref. 1 and is reproduced below:
mp
1 a
mh
1ah
(3a)
1
1
ah
2
1 1m
,
(3b)
where a is crack depth and h is tube wall thickness. The validity of Eqs. 2-3 was demonstrated by a series of pressure tests on steam generator tubes with part-throughwall rectangular notches and the results were reported in Refs. 2 and 3.
Although Eqs. 2a-b and 3a-b can be used to estimate the ligament rupture pressure of rectangular part-throughwall cracks, they are not directly applicable to SCCs, which are irregular in shape and have variable depth along their length. The equivalent rectangular crack approach was developed for ductile materials to predict the ligament rupture pressure of such cracks with complex shapes.
Because the tube material is highly ductile, the tubes fail plastically with relatively large local deformations. From a plastic analysis or limit load viewpoint, it can be argued that the collapse behavior of a crack tip radial ligament with an irregular point-by-point variation of crack depth should be similar to that of a crack with a smoothed-out "average" crack depth profile. We assume that the average profile as determined by the analysis of eddy current (EC) plus point or rotating pancake coil (RPC) data is appropriate for applying limit analysis of plasticity theory. With this assumption, although the real crack may have short throughwall segments at a number of locations, from the viewpoint of plastic collapse of the ligament, the tube behaves as if it has a smoothly varying average ligament thickness (or crack depth) profile.
Even dealing directly with the smoothed profile is difficult because the length over which the average depth is determined can be varied. In the equivalent rectangular crack approach, the actual smoothed crack depth profile is replaced by that of a series of "candidate" equivalent rectangular cracks, as shown in Fig. 1. The equivalent rectangular crack with the lowest ligament rupture pressure, as calculated by Eqs. 2a-b and 3a-b, is used for assessing the integrity of the tube.
-20
0
20
40
60
80
100
-10 -5 0 5 10
Cra
ck D
epth
(%
TW
)
Relative Axial Position (mm)
Candidateequivalent rectangularcrack
EC/NDE orfractographydepth profile
Figure 1. Determination of equivalent rectangular crack length and depth.
During pressurization of a SCC specimen with no throughwall segments, the leak rate is zero until the ligament rupture pressure is reached at which point the leak rate surges from zero to a
2
high value. If the ligament rupture pressure is greater than the unstable burst pressure corresponding to a throughwall crack with a length equal to the equivalent crack length, the specimen is predicted to burst immediately after ligament rupture. For cracks that do not unstably burst at the ligament rupture pressure, the length of the equivalent rectangular crack can be used to predict the leak rate following ligament rupture. For deep SCCs that have a number of throughwall segments separated by ligaments, distinct ligament rupture events may not occur. Instead, the leak rate may increase gradually with increasing pressure as a consequence of stable tearing of axial ligaments separating various crack segments or stable tearing of tapered radial ligaments.
The equivalent rectangular crack approach has been validated with rupture tests on machined notches with a variety of shapes such as single trapezoidal and triangular notches, and multiple rectangular notches (both electro-discharge machined and laser cut)3. The success of the method for the prediction of ligament rupture pressures of stress corrosion cracks has been less consistent.3 This has been partly because the SCCs that were used in the studies were relatively deep and long with one or more throughwall segments. Such cracks could fail by stable ligament tearing rather than ligament rupture as assumed by the equivalent rectangular crack model.
Five SCC specimens that were available from previous studies were used in assessing the equivalent rectangular crack method.
3 Objectives
The objective of the present study is to validate the equivalent rectangular crack approach with tests on SCCs that are less deep than those tested earlier.
4 Specimens
The first five SCC specimens (Table 1) were made from tubes that were solution annealed at 1100 C for 10 min., which reduced their yield strength from 41 ksi to 26 ksi and thus reduce their rupture pressures compared to those without the solution annealing treatment. Therefore, a sixth specimen (SGL 735), which had not been subjected to the same high temperature annealing treatment (yield strength=41 ksi), was added to the list. However, no NDE was performed on the specimen.
Table 1. NDE characteristics of the selected SCC specimens.
Specimen ID Bobbin Coil Volt (V)
Bobbin Coil Phase (Deg)
Maximum Depth (%)
Length (mm)
SGL 447 0.63 46 60 30.0
SGL 302 2.3 91 83 7.8
SGL 489 6.2 61 99 18.6
SGL 121 3.1 53 83 21.1
SGL 443 1.8 68 87 35.6
SGL 735 — — — —
3
4.1 Pre-test NDE Characteristics of Specimens
The crack depth profiles of the selected specimens, as determined from the RPC signals are given in Figs. 2a-e. Note that SGL-447 (Fig. 2a) had two parallel axial cracks of unequal size separated circumferentially by 60°. Previous testing had indicated that parallel axial cracks do not interact even when the circumferential ligament separating the two is as thin as 0.005 in.3 The longer crack geometry, which, as confirmed by subsequent test, was the more severe of the two, was used for ligament rupture prediction. Specimen SGL-121 (Fig. 2d) had two collinear axial cracks separated by a very narrow ligament. The crack in specimen SGL-443 (Fig. 2e) was neither truly axial nor circumferential, but was predominantly axial. The axial projection of the crack depth profile was used for ligament rupture prediction.
0.621.66
14
1
12
9
11
7
10
6 94 82 70 59
0
10
20
30
40
50
60
70
Dep
th (
%)
Circumferential Location (°)
0.0
4
0.1
8
0.3
1
0.4
4
0.5
7
0.7
1
0.8
4
0.9
7
1.1
0
1.2
4
0
10
20
30
40
50
60
70
80
90
Dep
th (
%)
Axial Location (in.)
(a) SGL 447 (b) SGL 302
4
0.0
4
0.2
6
0.4
9
0.7
1
0.9
3
1.1
5
1.3
7
1.5
9
1.8
1
2.0
3
0
10
20
30
40
50
60
70
80
90
100
Dep
th (
%)
Axial Location (in.)
0.0
3
0.1
0
0.1
7
0.2
4
0.3
1
0.3
8
0.4
5
0.5
2
0.5
9
0.6
6
0.7
3
0.8
0
0.8
7
0
10
20
30
40
50
60
70
80
90
100
Dep
th (
%)
Axial Location (in.)
(c) SGL 489 (d) SGL 121
0.8
3
0.9
3
1.0
3
1.1
3
1.2
3
1.3
3
1.4
3 219
1880
20
40
60
80
100
Dep
th (
%)
Axial Location (in.)
(e) SGL 443
Figure 2. Crack depth profiles of specimens as determined from NDE.
5 Test Procedure
Before high pressure testing, each specimen was pressurized with nitrogen to 30 psi to identify throughwall penetration of flaws, if any. One of the six specimens, SGL-489, had a thru-wall pin hole as evidenced by gas bubbling into a pool of water. All the tests were conducted at the
5
ANL high pressure test facility with room temperature water and were conducted in two stages. The first stage was the ligament rupture test, which was performed on tubes without inserting a bladder or foil with a pressure ramp rate of approximately 100 psi/s. The Stage 1 testing was stopped as soon as stable leak rates could be measured. Pressures were not held for long enough times that significant time-dependent increases of leak rate could occur. For the second stage tests, a bladder and foil were inserted inside the tube and the specimen pressurized at approximately 1000 psi/s until unstable burst occurred.
6 Test Results
A summary of the test results is given in Table 2. Specimens SGL 447 and SGL 735 were only subjected to stage 1 testing because ligament rupture and unstable burst occurred simultaneously for these specimens. Figures 3-9 show the variations of pressure and leak rate with time for all the tests. Note that only three specimens (SGL-302, SGL-447, and SGL-735) showed ligament rupture events, as indicated by zero leakage with increasing pressure until at a critical pressure a sudden increase of leakage from zero to a high leak rate occurred. Two specimens (SGL-489 and SGL-121) showed time-dependent leak rate growth behavior at constant pressure condition. The leak rate in specimen SGL-443 increased with increasing pressure during pressurization but did not show time-dependent leak rate growth behavior during the constant pressure hold period.
Table 2. Test ligament rupture pressures, leak rates at initial leakage, and burst pressures.
Specimen ID(Heat #)
Additional Heat Treatment
Ligament Rupture Pressure
(psig)
Leak Rate (gpm) @ Constant
Pressure(psig)
Burst Pressure
(psig)
Comment*
SGL-489 (NX8527)
10min @1100 C, 48hr @600 C
1300 0.3-0.7 @1300 2480 Thru-wall pin hole
SGL-121 (NX8527)
10min @1100 C, 48hr @600 C
1860 0.2–0.3 @1860 3290 Non thru- wall
SGL-443 (NX8527)
10min @1100 C, 48hr @600 C
1650 0.15 @1650 2680 Non thru- wall
SGL-302 (NX8527)
10min @1100 C, 48hr @600 C
2850 1.5 @3250 5660 Non thru- wall
SGL-447 (NX8527)
10min @1100 C, 48hr @600 C
4650 > 12 N/A Non thru- wall
SGL-735 (NX8520LT)
48hr @ 600 C 5200 > 12 N/A Non thru- wall
* The specimen was pressurized at 30 psig using nitrogen gas and immersed in water bath to determine if any gas bubble comes out. If gas bubbles were observed, it was considered as ‘thru-wall pinhole’ and if not, it was considered as ‘non thru-wall’.
6
Figure 3. Pressure and leak rate variation as a function of time for SGL-489 during the ligament rupture test. Note time-dependent leakage at constant pressure beyond 30 s. The scatter in the leakage data for ≤10s represent noise in the signal at zero leakage.
Figure 4. Pressure and leak rate variation as a function of time for SGL-121 during the ligament rupture test. The scatter in the leakage data for ≤30s represent noise in the signal at zero leakage.
7
Figure 5. Pressure and leak rate variation as a function of time for SGL-443 during the ligament rupture test. The scatter in the leakage data for ≤10s represent noise in the signal at zero leakage.
Figure 6. Pressure and leak rate variation as a function of time for SGL-302 during the ligament rupture test. The scatter in the leakage data for ≤36s represent noise in the signal at zero leakage.
8
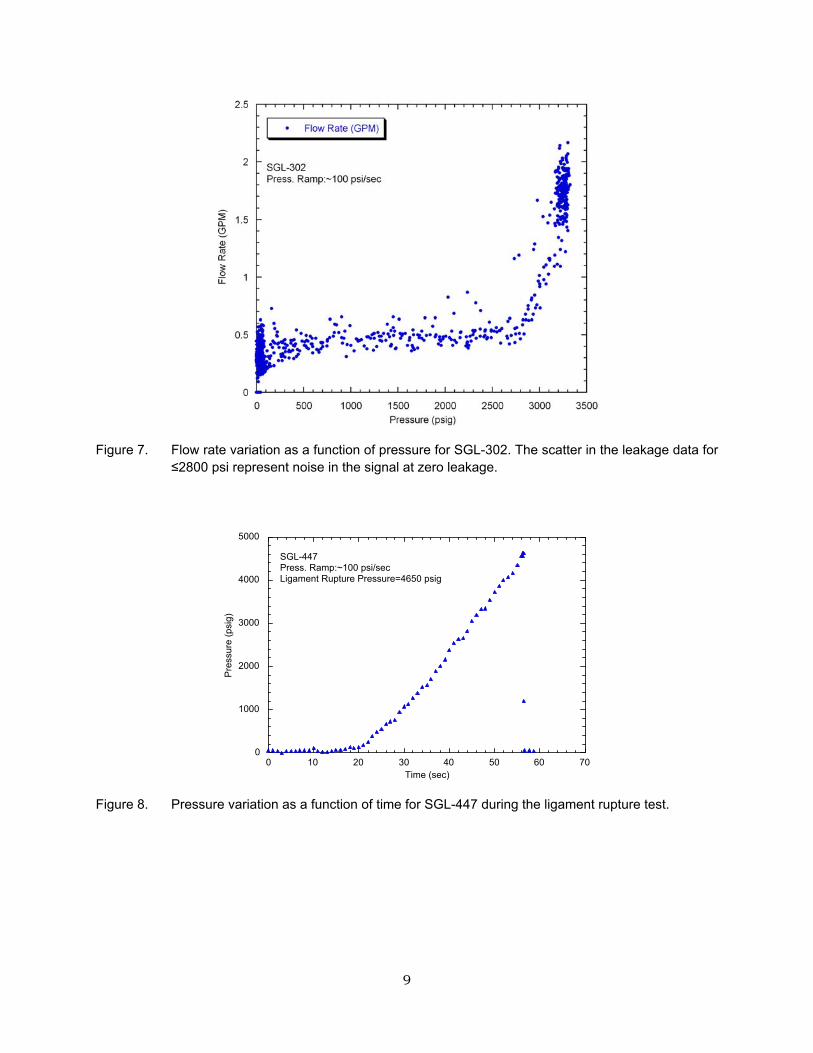
Figure 7. Flow rate variation as a function of pressure for SGL-302. The scatter in the leakage data for ≤2800 psi represent noise in the signal at zero leakage.
Figure 8. Pressure variation as a function of time for SGL-447 during the ligament rupture test.
9
Figure 9. Pressure variation as a function of time for SGL-735 during the ligament rupture test.
7 Fractographic Results
7.1 Crack Depth Profiles Measured Post-Test
Since NDE data were not obtained for specimen SGL 735, the specimen was examined fractographically after the rupture test to estimate crack depth profile prior to ligament rupture so that the equivalent rectangular crack method could be applied to predict the ligament rupture pressure. Of the remaining specimens, we selected one that displayed a ligament rupture event (SGL 302) and one that displayed time-dependent leak rate increase under constant pressure hold (SGL 489) for determining the crack depth profiles fractographically that could be used to establish the accuracy of the depth profiles measured by NDE as well as to obtain a second estimate of the ligament rupture pressure. After stage 1 testing (ligament rupture), the rupture surfaces in these specimens were marked by heat tinting prior to running the stage 2 burst tests. Following the stage 2 testing (burst tests), the specimens were pried open to expose the fracture surfaces. The initial SCC zones could be identified by their intergranular appearance and the heat tinting allowed the ligament rupture zones to be distinguished from the fracture surfaces created during the final unstable burst. The various depth profiles for specimens SGL-489 and SGL-302 are plotted in Figs. 10a-b, respectively. Note that the SCC profiles (before running the ligament rupture tests) of both specimens showed several throughwall segments separated by axial ligaments. Although SGL-489 did exhibit evidence of a throughwall flaw as detected by a 30-psi gas bubbling test, SGL-302 did not. In both specimens, the stage 1 ligament rupture tests ruptured the crack tip radial ligaments and produced throughwall cracks of significant length. In both cases, the NDE method failed to detect the short ligaments and generally underestimated the flaw depths.
10
0
20
40
60
80
100
120
-5 0 5 10 15 20 25 30
SCC ZoneAfter Ligament RuptureNDE
Cra
ck D
ep
th (
%T
W)
Axial Location (mm)
SGL-489
0
20
40
60
80
100
120
-2 0 2 4 6 8 10
SCC ZoneAfter Ligament RuptureNDE
Cra
ck D
epth
(%
TW
)
Axial Location (mm)
SGL-302
(a) (b)
Figure 10. Crack depth profiles as measured by NDE and fractography for specimens (a) SGL-489 and (b) SGL-302.
The crack depth profiles as measured by fractography for specimen SGL-735 are shown in Fig. 11. Unlike the other two specimens, this specimen did not have throughwall crack segments prior to ligament rupture test. Since this specimen burst immediately after ligament rupture, there is a long throughwall crack extending over the full crack front at the end of the stage 1 test.
0
20
40
60
80
100
120
0 4 8 12 16 20 24
SCC ZoneAfter Ligament Rupture
Cra
ck D
epth
(%
TW
)
Axial Location (mm)
SGL-735
Figure 11. Crack depth profiles as measured by fractography for specimen SGL-735
7.2 Surface Crack Opening
Figures 12(a-f) show photographs of the tube OD surfaces after the ligament rupture (Stage 1) tests. Except for specimens SGL-447 (Fig. 12e) and SGL-735 (Fig. 12f), which show fish-mouth
11
opening that are characteristics of burst, all the others have much narrower openings, indicating that these specimens were not pressurized to their respective unstable burst pressures. It is noted that SGL-302 (Fig. 12d) shows circumferential cracks, as well as a 0.25”-long axial crack, and SGL-447 (Fig 12e) shows a second non-ruptured axial crack, confirming the NDE indication (Fig. 2a). SGL-447 showed a relatively high ligament rupture pressure (Table 2) even though it had multiple axial cracks and a relatively long total crack length of about 35 mm because it was relatively shallow (60-70% deep), as shown by the NDE profile Fig. 2a.
(a) SGL-489
(b) SGL-121
12
(c) SGL-443
(d) SGL-302
(e) SGL-447
13
(f) SGL-735
Figure 12. Photographs of OD crack opening area after ligament tearing tests (in photo, one graduation is equal to 1 mm).
8 Rupture and Burst Pressures Prediction
Ligament rupture and burst pressures predicted from the NDE profiles and the fractography profiles are given in Table 3, which also includes the experimentally observed rupture and burst pressures. Note that of the three specimens (SGL-302, SGL-447, and SGL-735) that showed ligament rupture events (as evidenced by sudden onset of leakage), two experienced simultaneous unstable burst. SCCs that are grown in the laboratory using high temperature annealing treatment are generally highly branched and ligamented with short through-wall or close to through-wall segments. Current NDE techniques do not detect and profile such ligamented cracks with high accuracy. As a result, the ligament rupture pressures predicted by the equivalent rectangular crack from the crack profiles generated by NDE were greater than the experimentally observed pressures at first leakage (Table 3). The predicted leak rates on ligament rupture were also much greater than the observed leak rates at first leakage. Therefore, we calculated the effective through-wall crack lengths from the measured leak rates and include them in Table 3. These estimated crack lengths are much shorter than the throughwall crack lengths predicted by the equivalent rectangular crack method, indicating that these cracks were initially fairly deep and consisted of small segments separated by axial ligaments, one or more of which ruptured initially followed by gradual tearing (and time-dependent leak rate) of the remaining ligaments at constant pressure. Only SGL-735 did not have the high temperature annealing treatment and fractography did not reveal any throughwall crack segments prior to rupture.
In general, the unstable burst pressures are predicted with reasonable accuracy. The predicted burst pressures for SGL-447 and SGL-735 are lower than the respective predicted ligament rupture pressures. Thus, these two specimens are predicted to experience burst immediately after ligament rupture, in agreement with the tests.
14
Table 3. Predicted and observed ligament rupture pressures, equivalent throughwall rectangular crack lengths (predicted and estimated from measured leak rates), and unstable burst pressures. All specimens except SGL-735 were subjected to high temperature annealing treatment.
Ligament Rupture Pressure
(psig)
Equivalent TW Crack Length (in.)
Burst Pressure (psi) Specimen ID
Predicted Observed Predicted Estimated from Leak
Rate
Predicted Observed
1700a 0.96
a 2140
a
SGL-489
800b
1300c
0.44b
0.06
3870b
2480
SGL-121 4200
a 1860c 0.38 0.04 4210 3290
SGL-443 2850
a 1650c 0.60 0.03 3100 2680
3600a 0.31
a 4800
a
SGL-302 3400
b
2850
0.21b
0.16
5760b
5660
SGL-447 4400
a
4650 0.90
a
2300
a
SGL-735 4220
b
5200 0.66 3600
b
aPrediction based on NDE profile
bPrediction based on fractography profile
c These tests did not exhibit ligament rupture event
9 Conclusions and Recommendations
The unstable burst pressures of the SCCs were predicted reasonably well for all the specimens.
The ligament rupture pressures of the SCCs, which were grown in the laboratory at room temperature with reactive chemicals using a sensitization heat treatment following a high temperature annealing treatment, were generally over-predicted by the equivalent rectangular crack method when calculated from the NDE profiles of the cracks. Fractography showed that most of these cracks were fairly deep with several throughwall segments that were separated by axial ligaments. Thus, these specimens started leaking early in the tests and the leak rates increased with increasing pressure (or constant pressure) due to stable tearing of the axial ligaments.
Only three specimens showed behavior that is actually typical of ligament rupture, i.e., zero leak rate with pressurization until the ligament rupture pressure and then abrupt increase of leakage. However, of these three, two specimens also burst immediately following ligament rupture. The burst pressures (which are equal to the ligament rupture pressures) of these two specimens were predicted reasonably well by the equivalent rectangular crack method.
15
16
To properly validate the equivalent rectangular method for predicting ligament rupture pressures, additional SCCs that are neither too deep nor too shallow, i.e., in the range of 75-85%, will be needed. If they are too shallow, then ligament rupture is followed immediately by unstable burst. If they are too deep, they may experience ligament tearing at low pressure followed by increasing leakage with increasing pressure.
Techniques are currently available that should permit control of the depth and length of laboratory grown SCCs.
References
1. . S. Majumdar, W. J. Shack, D. R. Diercks, K. Mruk, J. Franklin, and L. Knoblich, "Failure Behavior of Internally Pressurized Flawed and Unflawed Steam Generator Tubing at High temperatures – Experiments and Comparison With Model Predictions," NUREG/CR-6575, 1998.
2. S. Majumdar, K. Kasza, and J. Franklin, "Pressure and Leak-Rate Tests and Models for Predicting Failure of Flawed Steam Generator Tubes," NUREG/CR-6664, 2000.
3. S. Majumdar, S. Bakhtiari, K. Kasza and J. Y. Park, "Validation of Failurer and Leak-Rate Correlations for Stress Corrosion Cracks in Steam Generator Tubes," NUREG/CR-6774, 2002.


![38695531 Mortgage Debt Validation Letter Notice[1]](https://static.documents.pub/doc/80x56/577d25f01a28ab4e1e9ff02f/38695531-mortgage-debt-validation-letter-notice1.jpg)


