+ All Categories
Home > Documents > TECHNICAL MEMORANDUM: SWMM Modeling for … · 2019-02-22 · Management Model 5.0 (SWMM). SWMM...

TECHNICAL MEMORANDUM: SWMM Modeling for … · 2019-02-22 · Management Model 5.0 (SWMM). SWMM...

Date post: 20-Apr-2020
Category:
Upload: others
View: 9 times
Download: 0 times
Share this document with a friend
84
TECHNICAL MEMORANDUM: SWMM Modeling for Hydromodification Compliance of: Skyline Retirement Center Prepared For: Skyline Wesleyan Church October 20, 2016 (Revision) September 15, 2017 (Update) Prepared by: Luis Parra, PhD, CPSWQ, ToR, D.WRE. R.C.E. 66377 REC Consultants 2442 Second Avenue San Diego, CA 92101 Telephone: (619) 232-9200
Transcript

TECHNICAL MEMORANDUM:

SWMM Modeling for

Hydromodification Compliance of:

Skyline Retirement Center

Prepared For:

Skyline Wesleyan Church October 20, 2016 (Revision) September 15, 2017 (Update)

Prepared by: Luis Parra, PhD, CPSWQ, ToR, D.WRE. R.C.E. 66377

REC Consultants 2442 Second Avenue

San Diego, CA 92101 Telephone: (619) 232-9200

TECHNICAL MEMORANDUM  

TO: SKYLINE WESLEYAN CHURCH  

FROM:    Luis Parra, PhD, PE, CPSWQ, ToR, D.WRE.       David Edwards, PE.  

DATE:    April 27, 2016 (Revised October 20, 2016)(Updated September 15, 2017)  

RE:    Summary of SWMM Modeling for Hydromodification Compliance for Skyline Retirement Center, La Mesa, CA. 


INTRODUCTION 

This memorandum  summarizes  the  approach  used  to model  the  proposed  residential  development project  site  in  the  City  of  La Mesa  using  the  Environmental  Protection  Agency  (EPA)  Storm Water Management Model  5.0  (SWMM).    SWMM models were  prepared  for  the  pre  and  post‐developed conditions  at  the  site  in order  to determine  if  the proposed  LID biofiltration  facilities have  sufficient volume  to meet  Order  R9‐2013‐001  requirements  of  the  California  Regional Water  Quality  Control Board  San Diego  Region  (SDRWQCB),  as  explained  in  the  Final Hydromodification Management  Plan (HMP), dated March 2011, prepared for the County of San Diego by Brown and Caldwell.  

SWMM Model Development 

The  Skyline  Retirement  Center  project  comprises  of  single  and  attached  proposed  residential developments  including associated  roads and parking  lots. Two  (2) SWMM models were prepared  for this  study:  the  first  for  the pre‐development  and  the  second  for  the post‐developed  conditions.  The project  site  drains  to  two  (2)  Points  of  Compliance  (POC‐1  and  POC‐2)  located  at  two  (2)  existing different storm drain locations within the adjacent access road to the Skyline Church. Runoff from both storm drain  systems are conveyed  in a  southerly direction, discharging  to a creek adjacent  to Campo Road at two (2) separate locations.  The  SWMM  model  was  used  since  we  have  found  it  to  be  more  comparable  to  San  Diego  area watersheds  than  the  alternative  San  Diego  Hydrology Model  (SDHM)  and  also  because  it  is  a  non‐proprietary model  approved by  the HMP document.    For both  SWMM models,  flow duration  curves were  prepared  to  determine  if  the  proposed HMP  facilities  are  sufficient  to meet  the  current HMP requirements. 

 The  inputs  required  to  develop  SWMM models  include  rainfall, watershed  characteristics,  and  BMP configurations.  The  inputs  required  to  develop  SWMM  models  include  rainfall,  watershed characteristics, and BMP configurations.   In  regards  to  the proper  rainfall  station  to use  for  this project,  two  factors are  taken  into account  to select the most appropriate rainfall  location,  in agreement with the County of San Diego BMP Manual: Proximity  of  the  project with  the  rainfall  station  (in  terms  of  distance),  and  difference  in  elevation between the project and the rainfall station selected. Unfortunately, section G.1.3.1 of the BMP Manual 

Skyline Retirement Center HMP Memo April 26, 2016 (Revised October 20, 2016) (Updated September 15, 2017) 

2 W.O.979‐01

is not 100% reliable because (a) it includes rainfall stations in Figure G.1‐1 whose data does not exists in the  Project  Clean Water web  site  (La Mesa)  and  it  does  not  include  rainfall  stations  in  Figure G.1‐1 whose data does exists (Borrego); (b) it assumes that all data sets are of the same quality, which is not the case  (for example, data  in Lindbergh  is of much higher quality  than data  in  the closed‐by Fashion Valley station, and the later should never be used as a substitute of the former because most of its data is copied from Lindbergh and the elevation of both stations is the same; similarly quality of data for San Vicente and Santee is extremely poor and both should never be used) and (c) it lacks a methodological procedure on how to evaluate scenarios when the station that is closer in location, is not the same that the station that is closer in elevation, as in the case of this project.  As a consequence, the author of this study has decided to use a statistical methodology to evaluate the most appropriate rainfall station among a group of “n” candidates (stations), using 2 parameters: (1) the distance Di between  the  station “i” and  the  location of  the project and  (2)  the absolute difference  in elevation between the station “i” considered and the project location, Zi. Assuming that the importance of Di  is  identical  to  the  importance of  Zi  (distance  is  as  important  as different  in  elevation)  for  each station considered the following parameter Pi is calculated:  

2∑ 2∑ 

 The station whose parameter Pi  is  the highest  is statistically more significant  in  terms of distance and difference in elevation respect to the location of the project. It should be noted that all Pi values added are equal to 1.  To evaluate the most appropriate rainfall station, the following stations were considered as potentially the most representative stations: Flinn, Lower Otay, Bonita, Santee. The distance of the project to each station  is  approximately  9.15  miles,  9.53  miles,  7.65  miles  and  7.66  miles  respectively,  while  the absolute  difference  in  elevation  between  the  station  and  the  average  elevation  in  the  project  is approximately  365 ft, 24 ft, 395 ft and 215 ft respectively. It seems evident that Lower Otay is the best station, because the distances are similar but  its elevation  is very close to that of the project. Applying the Pi equation we obtain the following values for Flinn, Lower Otay, Bonita and Santee: 0.142, 0.514, 0.162 and 0.182. Therefore,  it  is clear that the Lower Otay rain gauge  is the most appropriate  for this project.    In  regards  to  evapotranspiration,  per  the  California  Irrigation  Management  Information  System “Reference  Evaporation  Zones”  (CIMIS  ETo  Zone Map),  the  project  site  is  located within  the  Zone  9 Evapotranspiration  Area.  Thus  evapotranspiration  values  for  the  site  were  modeled  using  Zone  9 average monthly values from Table G.1‐1 from the City of San Diego 2016 BMP Design Manual. The site was modeled with Types A & D hydrologic  soils as  this  is  the existing  soil determined  from  the NRCS Web Soil Survey.  Soils have been assumed to be uncompacted in the existing condition to represent the natural condition of the site and fully compacted in the post developed conditions.  Other SWMM inputs for  the  subareas  are  discussed  in  the  appendices  to  this  document,  where  the  selection  of  the parameters is explained in detail. 


Skyline Retirement Center HMP Memo April 26, 2016 (Revised October 20, 2016) (Updated September 15, 2017) 

3 W.O.979‐01

 HMP MODELING 

EXISTING CONDITIONS  

The current site  is a mass graded  lot  that drains  in a southerly direction  to two  (2) different receiving storm  drains  located within  the  adjacent  access  road  to  the  existing  Skyline  Church.  There  is  also  a portion of the existing‐offsite slope along the western property boundary that drains to one (1) of the receiving storm drains. 

 TABLE 1 – SUMMARY OF EXISTING CONDITIONS 

DMA  Tributary Area, A (Ac)  Impervious Percentage, Ip 

DMA‐1‐D  4.42  0.34%(1) 

DMA‐1‐A  4.09  1.46%(1) 

DMA‐OFFSITE‐A  0.37  0.00%(1) 

DMA‐OFFSITE‐A  0.01  0.00%(1) 

TOTAL POC 1  8.89  n/a 

DMA‐2‐D  0.60  0.00%(1) 

TOTAL POC 2  0.60  n/a 

TOTAL  9.48  ‐‐ Notes:   (1) – Per the 2013 RWQCB permit, existing condition impervious surfaces are not to be accounted for in existing conditions analysis. However, as some of POC 1 will remain untouched this impervious % can be accounted for. 


DEVELOPED CONDITIONS   

Storm water runoff  from the proposed project site  is routed to  two  (2) POCs  located at the discharge locations to the south east of the project site at the existing storm drain systems within the access road to  the  Skyline Church.  For POC 1,  the  runoff  from  the developed project  site  is drained  to  three  (3) onsite  receiving biofiltration LID BMPs. Once  flows are  routed via  the proposed LID BMPs, developed onsite flows are then conveyed to the aforementioned storm drain POC 1. Runoff from the offsite‐slope previously described also drains to POC‐1.   POC 2 does not need any  treatment nor does  it need hydromodification compliance  for  the  following reasons. In existing conditions the area draining to POC 2 is 0.60 acres while in developed conditions the area  is  0.59  acres,  a  reduction  of  0.01  acres.  Additionally  the  0.59  acres  draining  to  POC  2  remain unchanged  and  undisturbed  from  the  existing  condition,  thus  the  land  use  is  the  same  as  in  pre developed conditions. So given these two facts, there must be less runoff in post developed condition, therefore no analysis needs to undertaken for POC 2.   It  is assumed all storm water quality  requirements  for  the project will be met by  the biofiltration LID BMPs.  However, detailed water quality requirements are not discussed within this technical memo. For further  information  in regards to storm water quality requirements for the project, please refer to the site specific Storm Water Quality Management Plan (SWQMP).   

Skyline Retirement Center HMP Memo April 26, 2016 (Revised October 20, 2016) (Updated September 15, 2017) 

4 W.O.979‐01


TABLE 2 – SUMMARY OF DEVELOPED CONDITIONS 

POC  DMA Tributary Area, 

A (Ac)(1) 

Impervious Percentage %, 

Ip Basin 

POC‐1  

1‐1‐D  0.89  32% BMP‐1 

1‐1‐A  1.31  43% 

1‐D‐BYPASS  0.37  0% 

n/a 1‐A‐BYPASS  1.07  0% 

OFFSITE‐A  0.37  27% 

OFFSITE‐D  0.01  100% 

2‐1‐A  1.60  77% BMP‐2

2‐1‐D  1.95  58% 

3‐1‐A  0.11  100% BMP‐3

3‐1‐D  1.22  33% 

POC‐2  2‐1‐D  0.59  0%  n/a 

TOTAL  9.48  ‐‐   

Notes:   (1) – DMA areas include the area of the biofiltration.   

Three  (3)  LID  biofiltration  basins  with  partial  retention  are  located  within  the  project  site  and  are responsible for handling hydromodification requirements for the projects runoff to POC 1.  In developed conditions, the basins will have a surface depth and a riser spillway structure (see dimensions  in Table 3).  Flows will then discharge from the basins via the outlet structure or infiltrate through the base of the facilities to the receiving amended soil and low flow orifice.  The riser structure will act as a spillway such that peak flows can be safely discharged to the receiving storm drain systems.   Beneath  the  basins’  invert  lies  the  proposed  LID  biofiltration  portion  of  the  drainage  facility.    This portion of the basin  is comprised of a 3‐inch  layer of mulch, an 18‐inch  layer of amended soil (a highly sandy, organic rich composite with an infiltration capacity of at least 5 inches/hr) and a layer of gravel.  All BMPs will be unlined to allow for infiltration into the underlying soils.  The  biofiltration  basins  were  modeled  using  the  biofiltration  LID  module  within  SWMM.    The biofiltration module can model the amended soil layer, and a surface storage pond up to the elevation of the invert of the spillway. It should be noted that detailed outlet structure location and elevations will be shown on the construction plans based on the recommendations of this study.  


Skyline Retirement Center HMP Memo April 26, 2016 (Revised October 20, 2016) (Updated September 15, 2017) 

5 W.O.979‐01


BMP MODELING FOR HMP PURPOSES 

Modeling of dual purpose Water Quality/HMP BMP 

Three (3) LID BMP biofiltration basins are proposed for water quality treatment and hydromodification conformance  for the project site. Tables 3 & 4  illustrate the dimensions required  for HMP compliance according to the SWMM model that was undertaken for the project.   

TABLE 3 – SUMMARY OF DEVELOPED DUAL PURPOSE BMP 

BMP Tributary Area (Ac) 

DIMENSIONS 

BMP Area(1), (ft2) 

Low Flow Orifice (in) 

Gravel Depth (5)(in) 

Depth Riser Invert (ft)(2)  

Weir Perimeter Length(3) (ft) 

Total Surface Depth(4) (ft) 

BMP‐1  2.20  1,509  1.0  27  2.25  8.00  2.50 

BMP‐2  3.55  4,364  1.5  27  2.00  12.00  2.50 

BMP‐3  1.33  1,411  0.875  30  2.00  8.00  2.50 

Notes:  (1): Area of amended soil = area of gravel = area of the BMP (2): Depth of ponding beneath riser structure’s surface spillway to bottom of mulch layer.(3): Overflow length, the internal perimeter of the square riser  

  (4): Total surface depth of BMP from bottom of mulch layer to crest elevation.

 (5): Gravel depth includes the dead storage below the LID orifice (9‐inches for BMP 1 and 2. 12‐inches for BMP‐3) and 6 inches of 

gravel/sand filter layers. See Basin detail on attachment 5. 


TABLE 4 – SUMMARY OF RISER DETAILS Lower Outlet  Middle Slot  Upper Slot  Top Riser 

Basin  Type B x H (in),    #‐Dia (in) 

Elev. (ft)(1) 

B x H (in),   #‐Dia (in) 

Elev. (ft)(1) 

B x H (in),   #‐Dia (in) 

Elev. (ft)(1) 

Length(2) (ft) 

Elev.(1) (ft) 

BMP 1  Orifice  2 – 0.75  0.50  6 x 2   1.00  30 x 3    1.33  8  2.25 

BMP 2  Slot  36 x 3  0.75  n/a  n/a  n/a  n/a  12  2.00 

BMP 3  Slot  12 x 2  0.50   n/a  n/a  n/a  n/a  8  2.00      Notes: 

 (1): Basin ground surface elevation assumed to be 0.00 ft elevation.(2): Overflow length is the internal perimeter of the riser structure. 


Skyline Retirement Center HMP Memo April 26, 2016 (Revised October 20, 2016) (Updated September 15, 2017) 

6 W.O.979‐01


FLOW DURATION CURVE COMPARISON 

The Flow Duration Curve (FDC) for the site was compared at POC‐1 by exporting the hourly runoff time series  results  from  SWMM  to  a  spreadsheet.    The  FDC was  compared  between  10%  of  the  existing condition Q2 up to the existing condition Q10 for POC‐1.  The Q2 and Q10 were determined with a partial duration statistical analysis of the runoff time series in an Excel spreadsheet using the Cunnane plotting position method  (which  is  the  preferred  plotting methodology  in  the HMP  Permit).    As  the  SWMM Model includes a statistical analysis based on the Weibull Plotting Position Method, the Weibull Method was also used within the spreadsheet to ensure that the results were similar to those obtained by the SWMM Model.   

The range between 10% of Q2 and Q10 was divided  into 100 equal time  intervals; the number of hours that each flow rate was exceeded was counted from the hourly series.   Additionally, the  intermediate peaks with a return period “i” were obtained (Qi with i=3 to 9).  For the purpose of the plot, the values were  presented  as  percentage  of  time  exceeded  for  each  flow  rate.  FDC  comparison  at  the  POC  is illustrated in Figures 1a and 1b in both normal and logarithmic scale.  Attachment 5 provides a detailed drainage exhibit for the post‐developed condition.  

As can be seen in Figure 1, the FDC for the proposed condition with the HMP BMPs is within 110% of the curve  for  the  existing  condition  in  both  peak  flows  and  durations.  The  additional  runoff  volume generated  from developing  the  site will be  released  to  the existing point of discharge  at  a  flow  rate below the 10% Q2 lower threshold for the POC.  Additionally, the project will also not increase peak flow rates  between  the  Q2  and  the  Q10,  as  shown  in  the  graphic  and  also  in  the  peak  flow  tables  in Attachment 1.   Discussion of the Manning’s coefficient (Pervious Areas) for Pre and Post‐Development Conditions  

Typically  the  Manning’s  coefficient  is  selected  as  n  =  0.10  for  pervious  areas  and  n  =  0.012  for impervious areas. However, due to the impact that n has in the continuous simulation a more accurate value of  the Manning’s  coefficient has been  chosen  for pervious  areas. Taken  into  consideration  the study prepared by TRWE (Reference [6]) a value of n = 0.05 has been selected (see Table 1 of Reference [6] included in Attachment 7). An average n value between average grass plus pasture (0.04) and dense grass (0.06) has been selected per the reference cited, for light rain (<0.8 in/hr) as more than 99% of the rainfall has been measured with this intensity. 


SUMMARY 

This study has demonstrated that the proposed HMP BMPs provided for the Skyline Retirement Center project  site  is  sufficient  to  meet  the  current  HMP  criteria  if  the  cross‐section  areas  and  volumes recommended within  this  technical memorandum, and  the  respective orifice and outlet  structure are incorporated as specified within the proposed project site.   


Skyline Retirement Center HMP Memo April 26, 2016 (Revised October 20, 2016) (Updated September 15, 2017) 

7 W.O.979‐01


KEY ASSUMPTIONS 

1. Types A & D Soil is representative of the existing condition site. 

2. All basins will be unlined to allow for infiltration.  


ATTACHMENTS 

1. Q2 to Q10 Comparison Tables 

2. Flow Duration Curve Analysis 

3. List of the “n” largest Peaks: Pre‐Development and Post‐Development Conditions 

4. Area Vs Elevation & Discharge Vs Elevation 

5. Pre & Post Development Maps, Project Plan and  Section Sketches 

6. SWMM Input Data in Input Format (Existing and Proposed Models) 

7. EPA SWMM Figures and Explanations 

8. Soil Maps & Geotechnical Investigation 

9. Summary files from the SWMM Model 


REFERENCES 

[1]  –  “Review  and  Analysis  of  San  Diego  County  Hydromodification  Management  Plan  (HMP): Assumptions,  Criteria,  Methods,  &  Modeling  Tools  –  Prepared  for  the  Cities  of  San  Marcos, Oceanside & Vista”, May 2012, TRW Engineering. 


[2]  –  “Final Hydromodification Management  Plan  (HMP)  prepared  for  the  County  of  San Diego”, March 2011, Brown and Caldwell. 


[3]  ‐  Order  R9‐2013‐001,  California  Regional  Water  Quality  Control  Board  San  Diego  Region (SDRWQCB). 

   [4] – “Handbook of Hydrology”, David R. Maidment, Editor in Chief. 1992, McGraw Hill.    [5] – “City of San Diego BMP Design Manual”, February 2016.  

Skyline Retirement Center HMP Memo April 26, 2016 (Revised October 20, 2016) (Updated September 15, 2017) 

8 W.O.979‐01


Figure 1a and 1b.   Flow Duration Curve Comparison (logarithmic and normal “x” scale) 

Skyline Retirement Center HMP Memo April 26, 2016 (Revised October 20, 2016) (Updated September 15, 2017) 

9 W.O.979‐01

ATTACHMENT 1.


Q2 to Q10 Comparison Table – POC 1 

Return Period  Existing Condition (cfs)  Mitigated Condition (cfs) Reduction, Exist ‐ Mitigated (cfs) 

2‐year  1.707  1.564  0.143 

3‐year  2.401  1.916  0.485 

4‐year  2.649  2.306  0.342 

5‐year  2.818  2.629  0.188 

6‐year  3.135  2.756  0.378 

7‐year  3.415  2.828  0.587 

8‐year  3.601  3.063  0.538 

9‐year  3.675  3.299  0.377 

10‐year  3.737  3.328  0.409 


ATTACHMENT 2 

FLOW DURATION CURVE ANALYSIS 

1) Flow duration  curve  shall not exceed  the existing  conditions by more  than 10%, neither  in peak 

flow nor duration. 

The  figures  on  the  following  pages  illustrate  that  the  flow  duration  curve  in  post‐development 

conditions after the proposed BMP is below the existing flow duration curve. The flow duration curve 

table following the curve shows that if the interval 0.10Q2 – Q10 is divided in 100 sub‐intervals, then a) 

the post development divided by pre‐development durations are never  larger than 110% (the permit 

allows up to 110%); and b) there are no more than 10 intervals in the range 101%‐110% which would 

imply  an  excess  over  10%  of  the  length  of  the  curve  (the  permit  allows  less  than  10%  of  excesses 

measured as 101‐110%). 

Consequently, the design passes the hydromodification test. 

It  is  important to note that the flow duration curve can be expressed  in the “x” axis as percentage of 

time, hours per year, total number of hours, or any other similar time variable. As those variables only 

differ by a multiplying constant, their plot  in  logarithmic scale  is going to  look exactly the same, and 

compliance can be observed regardless of the variable selected. However, in order to satisfy the City of 

La Mesa HMP example, % of time exceeded  is the variable of choice  in the  flow duration curve. The 

selection of a logarithmic scale in lieu of the normal scale is preferred, as differences between the pre‐

development and post‐development curves can be seen more clearly  in  the entire range of analysis. 

Both graphics are presented just to prove the difference. 

In  terms  of  the  “y”  axis,  the  peak  flow  value  is  the  variable  of  choice.  As  an  additional  analysis 

performed by REC, not only  the  range of analysis  is  clearly depicted  (10% of Q2  to Q10) but also all 

intermediate flows are shown (Q2, Q3, Q4, Q5, Q6, Q7, Q8 and Q9) in order to demonstrate compliance at 

any range Qx – Qx+1. It must be pointed out that one of the limitations of both the SWMM and SDHM 

models is that the intermediate analysis is not performed (to obtain Qi from i = 2 to 10). REC performed 

the analysis using  the Cunnane Plotting position Method  (the preferred method  in  the HMP permit) 

from the “n” largest independent peak flows obtained from the continuous time series. 

The largest “n” peak flows are attached in this appendix, as well as the values of Qi with a return period 

“i”, from i=2 to 10. The Qi values are also added into the flow‐duration plot. 


0.00

0.50

1.00

1.50

2.00

2.50

3.00

3.50

4.00

0.0003 0.003 0.03 0.3

Q (cfs)

Percentage of time exceeded (%)

Skyline Retirement Center POC 1 ‐ Flow Duration Curve

Existing

Proposed

Qx

0

0.2

0.4

0.6

0.8

1

1.2

1.4

1.6

1.8

2

2.2

2.4

2.6

2.8

3

3.2

3.4

3.6

3.8

4

‐0.02 0 0.02 0.04 0.06 0.08 0.1 0.12 0.14 0.16 0.18 0.2

Q (cfs)

Percentage of time exceeded (%)

Skyline Retirement Center  POC 1 ‐ Flow Duration Curve

Existing

Proposed

Qx

Flow Duration Curve Data for Skyline Retirement Center POC‐1, City of La Mesa, CA

Q2 = 1.71 cfs Fraction 10 %

Q10 = 3.74 cfs

Step = 0.0360 cfs

Count = 496008 hours

56.58 years

Pass or 

Q (cfs) Hours > Q % time Hours>Q % time Post/Pre Fail?

1 0.171 796 1.60E‐01 833 1.68E‐01 105% Pass

2 0.207 721 1.45E‐01 613 1.24E‐01 85% Pass

3 0.243 644 1.30E‐01 485 9.78E‐02 75% Pass

4 0.279 572 1.15E‐01 394 7.94E‐02 69% Pass

5 0.315 537 1.08E‐01 357 7.20E‐02 66% Pass

6 0.351 509 1.03E‐01 316 6.37E‐02 62% Pass

7 0.387 487 9.82E‐02 294 5.93E‐02 60% Pass

8 0.423 464 9.35E‐02 269 5.42E‐02 58% Pass

9 0.459 436 8.79E‐02 258 5.20E‐02 59% Pass

10 0.495 411 8.29E‐02 239 4.82E‐02 58% Pass

11 0.531 386 7.78E‐02 225 4.54E‐02 58% Pass

12 0.567 353 7.12E‐02 214 4.31E‐02 61% Pass

13 0.603 329 6.63E‐02 198 3.99E‐02 60% Pass

14 0.639 299 6.03E‐02 183 3.69E‐02 61% Pass

15 0.675 266 5.36E‐02 170 3.43E‐02 64% Pass

16 0.711 240 4.84E‐02 159 3.21E‐02 66% Pass

17 0.747 217 4.37E‐02 148 2.98E‐02 68% Pass

18 0.783 203 4.09E‐02 141 2.84E‐02 69% Pass

19 0.819 189 3.81E‐02 130 2.62E‐02 69% Pass

20 0.855 179 3.61E‐02 120 2.42E‐02 67% Pass

21 0.891 161 3.25E‐02 114 2.30E‐02 71% Pass

22 0.927 153 3.08E‐02 108 2.18E‐02 71% Pass

23 0.963 142 2.86E‐02 105 2.12E‐02 74% Pass

24 0.999 132 2.66E‐02 100 2.02E‐02 76% Pass

25 1.035 125 2.52E‐02 91 1.83E‐02 73% Pass

26 1.071 116 2.34E‐02 84 1.69E‐02 72% Pass

27 1.107 100 2.02E‐02 81 1.63E‐02 81% Pass

28 1.143 89 1.79E‐02 72 1.45E‐02 81% Pass

29 1.179 76 1.53E‐02 65 1.31E‐02 86% Pass

30 1.215 74 1.49E‐02 62 1.25E‐02 84% Pass

31 1.251 70 1.41E‐02 61 1.23E‐02 87% Pass

32 1.287 66 1.33E‐02 59 1.19E‐02 89% Pass

33 1.323 63 1.27E‐02 55 1.11E‐02 87% Pass

34 1.359 60 1.21E‐02 52 1.05E‐02 87% Pass

35 1.395 58 1.17E‐02 51 1.03E‐02 88% Pass

36 1.431 57 1.15E‐02 46 9.27E‐03 81% Pass

37 1.467 55 1.11E‐02 42 8.47E‐03 76% Pass

 Detention Optimized

Interval 

Existing Condition

Pass or 

Q (cfs) Hours > Q % time Hours>Q % time Post/Pre Fail?

Detention Optimized

Interval 

Existing Condition

38 1.504 46 9.27E‐03 41 8.27E‐03 89% Pass

39 1.540 42 8.47E‐03 39 7.86E‐03 93% Pass

40 1.576 39 7.86E‐03 35 7.06E‐03 90% Pass

41 1.612 36 7.26E‐03 33 6.65E‐03 92% Pass

42 1.648 32 6.45E‐03 32 6.45E‐03 100% Pass

43 1.684 32 6.45E‐03 31 6.25E‐03 97% Pass

44 1.720 29 5.85E‐03 31 6.25E‐03 107% Pass

45 1.756 29 5.85E‐03 31 6.25E‐03 107% Pass

46 1.792 29 5.85E‐03 29 5.85E‐03 100% Pass

47 1.828 27 5.44E‐03 28 5.65E‐03 104% Pass

48 1.864 26 5.24E‐03 27 5.44E‐03 104% Pass

49 1.900 26 5.24E‐03 24 4.84E‐03 92% Pass

50 1.936 26 5.24E‐03 21 4.23E‐03 81% Pass

51 1.972 26 5.24E‐03 20 4.03E‐03 77% Pass

52 2.008 25 5.04E‐03 19 3.83E‐03 76% Pass

53 2.044 24 4.84E‐03 17 3.43E‐03 71% Pass

54 2.080 21 4.23E‐03 17 3.43E‐03 81% Pass

55 2.116 21 4.23E‐03 17 3.43E‐03 81% Pass

56 2.152 21 4.23E‐03 17 3.43E‐03 81% Pass

57 2.188 21 4.23E‐03 17 3.43E‐03 81% Pass

58 2.224 21 4.23E‐03 16 3.23E‐03 76% Pass

59 2.260 21 4.23E‐03 16 3.23E‐03 76% Pass

60 2.296 21 4.23E‐03 16 3.23E‐03 76% Pass

61 2.332 20 4.03E‐03 16 3.23E‐03 80% Pass

62 2.368 19 3.83E‐03 15 3.02E‐03 79% Pass

63 2.404 19 3.83E‐03 15 3.02E‐03 79% Pass

64 2.440 19 3.83E‐03 14 2.82E‐03 74% Pass

65 2.476 18 3.63E‐03 14 2.82E‐03 78% Pass

66 2.512 18 3.63E‐03 14 2.82E‐03 78% Pass

67 2.548 17 3.43E‐03 13 2.62E‐03 76% Pass

68 2.584 16 3.23E‐03 13 2.62E‐03 81% Pass

69 2.620 15 3.02E‐03 13 2.62E‐03 87% Pass

70 2.656 13 2.62E‐03 11 2.22E‐03 85% Pass

71 2.692 13 2.62E‐03 10 2.02E‐03 77% Pass

72 2.728 13 2.62E‐03 10 2.02E‐03 77% Pass

73 2.764 12 2.42E‐03 9 1.81E‐03 75% Pass

74 2.800 11 2.22E‐03 8 1.61E‐03 73% Pass

75 2.836 11 2.22E‐03 8 1.61E‐03 73% Pass

76 2.872 11 2.22E‐03 8 1.61E‐03 73% Pass

77 2.908 11 2.22E‐03 7 1.41E‐03 64% Pass

78 2.944 11 2.22E‐03 7 1.41E‐03 64% Pass

79 2.980 11 2.22E‐03 7 1.41E‐03 64% Pass

80 3.016 10 2.02E‐03 7 1.41E‐03 70% Pass

81 3.052 10 2.02E‐03 7 1.41E‐03 70% Pass

82 3.088 10 2.02E‐03 7 1.41E‐03 70% Pass

Pass or 

Q (cfs) Hours > Q % time Hours>Q % time Post/Pre Fail?

Detention Optimized

Interval 

Existing Condition

83 3.124 9 1.81E‐03 7 1.41E‐03 78% Pass

84 3.160 9 1.81E‐03 7 1.41E‐03 78% Pass

85 3.197 9 1.81E‐03 7 1.41E‐03 78% Pass

86 3.233 9 1.81E‐03 7 1.41E‐03 78% Pass

87 3.269 9 1.81E‐03 7 1.41E‐03 78% Pass

88 3.305 9 1.81E‐03 6 1.21E‐03 67% Pass

89 3.341 8 1.61E‐03 5 1.01E‐03 63% Pass

90 3.377 8 1.61E‐03 5 1.01E‐03 63% Pass

91 3.413 8 1.61E‐03 5 1.01E‐03 63% Pass

92 3.449 8 1.61E‐03 5 1.01E‐03 63% Pass

93 3.485 8 1.61E‐03 5 1.01E‐03 63% Pass

94 3.521 8 1.61E‐03 5 1.01E‐03 63% Pass

95 3.557 8 1.61E‐03 5 1.01E‐03 63% Pass

96 3.593 7 1.41E‐03 5 1.01E‐03 71% Pass

97 3.629 7 1.41E‐03 5 1.01E‐03 71% Pass

98 3.665 6 1.21E‐03 5 1.01E‐03 83% Pass

99 3.701 6 1.21E‐03 5 1.01E‐03 83% Pass

100 3.737 6 1.21E‐03 5 1.01E‐03 83% Pass

Peak Flows calculated with Cunnane Plotting Position

Return Period 

(years)Pre‐dev. Q (cfs)

Post‐Dev. Q 

(cfs)

Reduction 

(cfs)

10 3.737 3.328 0.409

9 3.675 3.299 0.377

8 3.601 3.063 0.538

7 3.415 2.828 0.587

6 3.135 2.756 0.378

5 2.818 2.629 0.188

4 2.649 2.306 0.342

3 2.401 1.916 0.485

2 1.707 1.564 0.143


ATTACHMENT 3 

List of the “n” Largest Peaks:  Pre & Post‐Developed Conditions 


  Basic Probabilistic Equation: 

  R = 1/P     R: Return period (years). 

  P: Probability of a flow to be equaled or exceeded any given year (dimensionless). 


  Cunnane Equation:       Weibull Equation:  

  P.

.        P  


i: Position of the peak whose probability is desired (sorted from large to small). 

n: Number of years analyzed.  


  Explanation of Variables for the Tables in this Attachment 

Peak: Refers to the peak flow at the date given, taken from the continuous simulation hourly results of 

the n year analyzed.  

Posit:  If  all  peaks  are  sorted  from  large  to  small,  the  position  of  the  peak  in  a  sorting  analysis  is 

  included under the variable Posit. 

Date: Date of the occurrence of the peak at the outlet from the continuous simulation 

Note: All peaks are not annual maxima; instead they are defined as event maxima, with a threshold to 

separate peaks of at  least 12 hours.  In other words, any peak P  in a time series  is defined as a value 

where dP/dt = 0, and the peak is the largest value in 25 hours (12 hours before, the hour of occurrence 

and 12 hours after the occurrence, so it is in essence a daily peak).   

List of Peak events and Determination of Q2 and Q10 (Pre‐Development)Skyline Retirement Center ‐ POC 1

T         

(Year)

Cunnane  

(cfs)

Weibull 

(cfs)

10 3.74 3.82 Date Posit Weibull Cunnane

9 3.68 3.70 1.293 3/14/2003 57 1.02 1.01

8 3.60 3.63 1.316 2/15/1992 56 1.04 1.03

7 3.41 3.49 1.329 3/21/1983 55 1.05 1.05

6 3.13 3.18 1.359 3/22/1954 54 1.07 1.07

5 2.82 2.87 1.364 1/18/1973 53 1.09 1.09

4 2.65 2.65 1.37 1/14/1969 52 1.12 1.11

3 2.40 2.42 1.413 2/22/1969 51 1.14 1.13

2 1.71 1.71 1.434 1/7/1993 50 1.16 1.15

1.467 11/21/1978 49 1.18 1.18

1.474 12/2/1952 48 1.21 1.20

Note: 1.477 1/18/1952 47 1.23 1.23

Cunnane is the preferred 1.487 12/20/1997 46 1.26 1.25

method by the HMP permit. 1.492 2/20/1993 45 1.29 1.28

1.495 12/18/1967 44 1.32 1.31

1.497 3/1/1983 43 1.35 1.34

1.498 11/28/1970 42 1.38 1.38

1.5 1/11/2001 41 1.41 1.41

1.503 1/4/1995 40 1.45 1.44

1.516 3/5/1970 39 1.49 1.48

1.517 1/31/1979 38 1.53 1.52

1.532 3/27/1992 37 1.57 1.56

1.541 2/8/1976 36 1.61 1.61

1.571 3/24/1983 35 1.66 1.65

1.574 1/4/2005 34 1.71 1.70

1.584 10/19/2004 33 1.76 1.75

1.601 10/27/2004 32 1.81 1.81

1.634 2/15/1986 31 1.87 1.87

1.701 2/16/1998 30 1.93 1.93

1.707 3/2/1983 29 2.00 2.00

1.713 2/16/1959 28 2.07 2.07

1.794 10/20/2004 27 2.15 2.15

1.812 11/21/1967 26 2.23 2.23

1.838 12/30/1951 25 2.32 2.33

1.998 1/18/1955 24 2.42 2.42

2.044 11/12/1976 23 2.52 2.53

2.049 2/6/1992 22 2.64 2.65

2.051 11/15/1965 21 2.76 2.78

2.331 1/29/1983 20 2.90 2.92

2.466 11/25/1985 19 3.05 3.08

2.539 2/6/1976 18 3.22 3.25

2.566 2/23/1998 17 3.41 3.45

2.604 3/1/1970 16 3.63 3.67

2.646 11/22/1996 15 3.87 3.92

2.655 2/23/2005 14 4.14 4.21

2.737 3/1/1978 13 4.46 4.54

2.784 3/27/1971 12 4.83 4.93

3.011 3/4/1978 11 5.27 5.40

3.123 2/22/2004 10 5.80 5.96

3.317 1/3/2005 9 6.44 6.65

3.562 12/21/1970 8 7.25 7.53

3.655 2/2/1988 7 8.29 8.67

3.75 10/14/2006 6 9.67 10.21

4.154 10/19/1972 5 11.60 12.43

4.572 2/2/1998 4 14.50 15.89

4.583 10/30/1998 3 19.33 22.00

4.836 2/7/1998 2 29.00 35.75

5.2 2/13/1998 1 58.00 95.33

Peaks 

(cfs)

Period of Return 

(Years)

List of Peak events and Determination of Q2 and Q10 (Post‐Development)Skyline Retirement Center ‐ POC 1

T         

(Year)

Cunnane  

(cfs)

Weibull 

(cfs)

10 3.33 3.42 Date Posit Weibull Cunnane

9 3.30 3.31 0.826 3/4/1983 57 1.02 1.01

8 3.06 3.18 0.84 12/7/1992 56 1.04 1.03

7 2.83 2.86 0.855 1/23/1967 55 1.05 1.05

6 2.76 2.76 0.869 2/16/1959 54 1.07 1.07

5 2.63 2.64 0.881 3/24/1964 53 1.09 1.09

4 2.31 2.37 0.924 2/28/1970 52 1.12 1.11

3 1.92 1.92 1.008 1/29/1983 51 1.14 1.13

2 1.56 1.56 1.019 1/7/1957 50 1.16 1.15

1.025 3/4/1978 49 1.18 1.18

1.025 3/18/1982 48 1.21 1.20

Note: 1.038 1/5/1974 47 1.23 1.23

Cunnane is the preferred 1.051 3/5/1995 46 1.26 1.25

method by the HMP permit. 1.061 1/16/1993 45 1.29 1.28

1.108 10/19/2004 44 1.32 1.31

1.161 3/1/1970 43 1.35 1.34

1.166 1/15/1978 42 1.38 1.38

1.168 2/14/1995 41 1.41 1.41

1.173 3/27/1971 40 1.45 1.44

1.177 10/20/2004 39 1.49 1.48

1.256 2/23/2004 38 1.53 1.52

1.289 1/8/1993 37 1.57 1.56

1.406 3/1/1983 36 1.61 1.61

1.421 2/23/2005 35 1.66 1.65

1.435 1/18/1955 34 1.71 1.70

1.445 12/21/1970 33 1.76 1.75

1.48 11/23/1965 32 1.81 1.81

1.538 1/13/1997 31 1.87 1.87

1.555 2/8/1976 30 1.93 1.93

1.564 12/28/1984 29 2.00 2.00

1.587 10/27/2004 28 2.07 2.07

1.625 11/15/1965 27 2.15 2.15

1.663 1/29/1980 26 2.23 2.23

1.761 10/19/1972 25 2.32 2.33

1.789 1/18/1952 24 2.42 2.42

1.851 2/23/1998 23 2.52 2.53

1.867 3/22/1954 22 2.64 2.65

1.884 3/1/1991 21 2.76 2.78

1.912 1/7/1993 20 2.90 2.92

1.92 2/15/1986 19 3.05 3.08

1.934 1/3/2005 18 3.22 3.25

2.008 1/14/1969 17 3.41 3.45

2.031 2/6/1976 16 3.63 3.67

2.218 2/22/2004 15 3.87 3.92

2.528 3/2/1983 14 4.14 4.21

2.621 1/4/1995 13 4.46 4.54

2.624 2/6/1992 12 4.83 4.93

2.661 11/25/1985 11 5.27 5.40

2.755 12/30/1951 10 5.80 5.96

2.779 11/12/1976 9 6.44 6.65

2.902 3/1/1978 8 7.25 7.53

3.289 2/2/1988 7 8.29 8.67

3.334 11/22/1996 6 9.67 10.21

3.812 10/30/1998 5 11.60 12.43

4.28 10/14/2006 4 14.50 15.89

4.547 2/2/1998 3 19.33 22.00

4.923 2/7/1998 2 29.00 35.75

5.274 2/13/1998 1 58.00 95.33

Peaks (cfs)

Period of Return 

(Years)


ATTACHMENT 4 

AREA VS ELEVATION 

The storage provided by the LID BMPs is entered into the LID Module within SWMM – please refer to 

Attachment 7 for further information. 

Volume provided above the first surface outlet is accounted for in the basins Module within SWMM.  A 

stage‐storage relationship  is provided within this Module, a copy of which  is  located on the following 

pages. 

DISCHARGE VS ELEVATION 

The orifices have been  selected  to maximize  its  size while  still  restricting  flows  to conform with  the 

required 10% of the Q2 event flow as mandated  in the Final Hydromodification Management Plan by 

Brown & Caldwell, dated March 2011.  While REC acknowledges that the orifices are small, to increase 

the size of  the outlet would  impact  the basin’s ability  to  restrict  flows beneath  the HMP  thresholds, 

thus preventing the BMP from conformance with HMP requirements. 

In order  to  further  reduce  the  risk of blockage of  the orifices,  regular maintenance of  the  riser and 

orifices must be performed to ensure potential blockages are minimized.   A detail of the orifices and 

riser structures is provided in Attachment 5 of this memorandum.   

A stage‐discharge relationship is provided on the following pages for the surface outlet structures.  The 

LID low flow orifice discharge relationship is addressed within the LID Module within SWMM – please 

refer to Attachment 7 for further information. 


Stage‐Area for BMP 1

Elevation (ft) Area (ft2) Volume (ft3)

0.00 1509 0 BIOFILTRATION(1)

0.08 1556 51

0.17 1603 104

0.25 1649 158 TOP OF MULCH(2)

0.33 1694 297

0.42 1740 440

0.50 1784 587 SURFACE DISCHARGE(3)

0.58 1829 738

0.67 1872 892

0.75 1916 1050

0.83 1959 1211

0.92 2001 1376

1.00 2043 1545 SURFACE DISCHARGE

1.08 2085 1717

1.17 2126 1892

1.25 2167 2071

1.33 2207 2253 SURFACE DISCHARGE

1.42 2247 2439

1.50 2287 2628

1.58 2326 2820

1.67 2364 3015

1.75 2402 3214

1.83 2440 3416

1.92 2477 3621

2.00 2514 3829

2.08 2550 4039

2.17 2586 4253

2.25 2621 4470 EMERGENCY WEIR(4)

2.33 2656 4690

2.42 2690 4913

2.50 2725 5139

SUB SURFACE STORAGE BMP 1

Elevation (ft) Area (ft2) Volume (ft3)

‐1.50 1509 679 Amended Soil Base (0.3 voids)

‐3.75 1509 1358 Gravel Base (0.4 voids)(5)

Gravel & Amended Soil TOTAL  = 2037 (ft3)

Surface Total TOTAL  = 1545 (ft3)

IMP TOTAL  = 3582 (ft3)

(1):  The area at this surface elevation corresponds to the area of gravel and amended soil (Bio‐filtration layer)

(2):  The volume for the first 3 inches of surface depth accounts for the voids of mulch

(3):  Volume at this elevation coresponds with surface volume for WQ purposes (invert of lowest surface outlet)

(4):  This elevation corresponds to the top of the riser elevation.

(5):  Gravel Depth includes  nine (9) inches of storage below the LID orifice.

Effective Depth: 4.67 in

Stage‐Area for BMP 2

Elevation (ft) Area (ft2) Volume (ft3)

0.00 4364 0 BIOFILTRATION(1)

0.08 4364 145

0.17 4364 291

0.25 4364 436 TOP OF MULCH(2)

0.33 4364 800

0.42 4364 1164

0.50 4364 1527

0.58 4364 1891

0.67 4364 2255

0.75 4364 2618 SURFACE DISCHARGE(3)

0.83 4364 2982

0.92 4364 3346

1.00 4364 3709

1.08 4364 4073

1.17 4364 4437

1.25 4364 4800

1.33 4364 5164

1.42 4364 5528

1.50 4364 5891

1.58 4364 6255

1.67 4364 6619

1.75 4364 6982

1.83 4364 7346

1.92 4364 7710

2.00 4364 8073 EMERGENCY WEIR(4)

2.08 4364 8437

2.17 4364 8801

2.25 4364 9164

2.33 4364 9528

2.42 4364 9892

2.50 4364 10255

SUB SURFACE STORAGE BMP 2

Elevation (ft) Area (ft2) Volume (ft3)

‐1.50 4364 1964 Amended Soil Base (0.3 voids)

‐3.75 4364 3928 Gravel Base (0.4 voids)(5)

Gravel & Amended Soil TOTAL  = 5891 (ft3)

Surface Total TOTAL  = 3709 (ft3)

IMP TOTAL  = 9601 (ft3)

(1):  The area at this surface elevation corresponds to the area of gravel and amended soil (Bio‐filtration layer)

(2):  The volume for the first 3 inches of surface depth accounts for the voids of mulch

(3):  Volume at this elevation coresponds with surface volume for WQ purposes (invert of lowest surface outlet)

(4):  This elevation corresponds to the top of the riser elevation.

(5):  Gravel Depth includes nine (9) inches of storage below the LID orifice.

Effective Depth: 7.20 in

Stage‐Area for BMP 3

Elevation (ft) Area (ft2) Volume (ft3)

0.00 1411 0 BIOFILTRATION(1)

0.08 1411 47

0.17 1411 94

0.25 1411 141 TOP OF MULCH(2)

0.33 1411 259

0.42 1411 376

0.50 1411 494 SURFACE DISCHARGE(3)

0.58 1411 611

0.67 1411 729

0.75 1411 847

0.83 1411 964

0.92 1411 1082

1.00 1411 1199

1.08 1411 1317

1.17 1411 1435

1.25 1411 1552

1.33 1411 1670

1.42 1411 1787

1.50 1411 1905

1.58 1411 2022

1.67 1411 2140

1.75 1411 2258

1.83 1411 2375

1.92 1411 2493

2.00 1411 2610 EMERGENCY WEIR(4)

2.08 1411 2728

2.17 1411 2846

2.25 1411 2963

2.33 1411 3081

2.42 1411 3198

2.50 1411 3316

SUB SURFACE STORAGE BMP 3

Elevation (ft) Area (ft2) Volume (ft3)

‐1.50 1411 635 Amended Soil Base (0.3 voids)

‐4.00 1411 1411 Gravel Base (0.4 voids)(5)

Gravel & Amended Soil TOTAL  = 2046 (ft3)

Surface Total TOTAL  = 1199 (ft3)

IMP TOTAL  = 3245 (ft3)

(1):  The area at this surface elevation corresponds to the area of gravel and amended soil (Bio‐filtration layer)

(2):  The volume for the first 3 inches of surface depth accounts for the voids of mulch

(3):  Volume at this elevation coresponds with surface volume for WQ purposes (invert of lowest surface outlet)

(4):  This elevation corresponds to the top of the riser elevation.

(5):  Gravel Depth includes  twelve (12) inches of storage below the LID orifice.

Effective Depth: 4.20 in

Outlet structure for Discharge of Detention Basin 1 (note: 0.0 elev = 2.75 ft actual elevation)

Discharge vs Elevation Table

Low orifice: 0.75 " Lower slot Emergency Weir

Number: 2 Invert: 0.25 ft Invert: 1.750 ft

Cg‐low: 0.61 B 0.50 ft B: 8 ft

h 0.167 ft

Middle orifice: 1 " Upper slot

number of orif: 0 Invert: 0.833 ft

Cg‐middle: 0.61 B: 2.50 ft

invert elev: 0.25 ft h 0.250 ft

h H/D‐low H/D‐mid Qlow‐orif Qlow‐weir Qtot‐low Qmid‐orif Qmid‐weir Qtot‐med Qslot‐low Qslot‐upp Qemer Qtot

(ft) ‐ ‐ (cfs) (cfs) (cfs) (cfs) (cfs) (cfs) (cfs) (cfs) (cfs) (cfs)

0.000 0.000 0.000 0.000 0.000 0.000 0.000 0.000 0.000 0.000 0.000 0.000 0.000

0.042 0.667 0.000 0.003 0.003 0.003 0.000 0.000 0.000 0.000 0.000 0.000 0.003

0.083 1.333 0.000 0.007 0.008 0.007 0.000 0.000 0.000 0.000 0.000 0.000 0.007

0.125 2.000 0.000 0.009 0.012 0.009 0.000 0.000 0.000 0.000 0.000 0.000 0.009

0.167 2.667 0.000 0.011 0.014 0.011 0.000 0.000 0.000 0.000 0.000 0.000 0.011

0.208 3.333 0.000 0.013 0.014 0.013 0.000 0.000 0.000 0.000 0.000 0.000 0.013

0.250 4.000 0.000 0.014 0.023 0.014 0.000 0.000 0.000 0.000 0.000 0.000 0.014

0.292 4.667 0.500 0.015 0.057 0.015 0.000 0.000 0.000 0.013 0.000 0.000 0.029

0.333 5.333 1.000 0.017 0.147 0.017 0.000 0.000 0.000 0.037 0.000 0.000 0.054

0.375 6.000 1.500 0.018 0.176 0.018 0.000 0.000 0.000 0.069 0.000 0.000 0.086

0.417 6.667 2.000 0.019 0.186 0.019 0.000 0.000 0.000 0.105 0.000 0.000 0.124

0.458 7.333 2.500 0.020 0.196 0.020 0.000 0.000 0.000 0.144 0.000 0.000 0.164

0.500 8.000 3.000 0.021 0.206 0.021 0.000 0.000 0.000 0.167 0.000 0.000 0.187

0.542 8.667 3.500 0.021 0.215 0.021 0.000 0.000 0.000 0.186 0.000 0.000 0.208

0.583 9.333 4.000 0.022 0.223 0.022 0.000 0.000 0.000 0.204 0.000 0.000 0.226

0.625 10.000 4.500 0.023 0.231 0.023 0.000 0.000 0.000 0.220 0.000 0.000 0.243

0.667 10.667 5.000 0.024 0.239 0.024 0.000 0.000 0.000 0.236 0.000 0.000 0.259

0.708 11.333 5.500 0.025 0.247 0.025 0.000 0.000 0.000 0.250 0.000 0.000 0.275

0.750 12.000 6.000 0.025 0.255 0.025 0.000 0.000 0.000 0.263 0.000 0.000 0.289

0.792 12.667 6.500 0.026 0.262 0.026 0.000 0.000 0.000 0.276 0.000 0.000 0.302

0.833 13.333 7.000 0.027 0.269 0.027 0.000 0.000 0.000 0.288 0.000 0.000 0.315

0.875 14.000 7.500 0.028 0.276 0.028 0.000 0.000 0.000 0.300 0.066 0.000 0.394

0.917 14.667 8.000 0.028 0.283 0.028 0.000 0.000 0.000 0.312 0.186 0.000 0.526

0.958 15.333 8.500 0.029 0.289 0.029 0.000 0.000 0.000 0.323 0.342 0.000 0.694

1.000 16.000 9.000 0.030 0.296 0.030 0.000 0.000 0.000 0.333 0.527 0.000 0.890

1.042 16.667 9.500 0.030 0.302 0.030 0.000 0.000 0.000 0.343 0.737 0.000 1.110

1.083 17.333 10.000 0.031 0.308 0.031 0.000 0.000 0.000 0.353 0.969 0.000 1.353

1.125 18.000 10.500 0.031 0.314 0.031 0.000 0.000 0.000 0.363 1.221 0.000 1.615

1.167 18.667 11.000 0.032 0.320 0.032 0.000 0.000 0.000 0.372 1.396 0.000 1.801

1.208 19.333 11.500 0.033 0.326 0.033 0.000 0.000 0.000 0.382 1.530 0.000 1.944

1.250 20.000 12.000 0.033 0.332 0.033 0.000 0.000 0.000 0.391 1.652 0.000 2.076

1.292 20.667 12.500 0.034 0.337 0.034 0.000 0.000 0.000 0.399 1.766 0.000 2.199

1.333 21.333 13.000 0.034 0.343 0.034 0.000 0.000 0.000 0.408 1.874 0.000 2.316

1.375 22.000 13.500 0.035 0.348 0.035 0.000 0.000 0.000 0.416 1.975 0.000 2.426

1.417 22.667 14.000 0.035 0.354 0.035 0.000 0.000 0.000 0.425 2.071 0.000 2.531

1.458 23.333 14.500 0.036 0.359 0.036 0.000 0.000 0.000 0.433 2.163 0.000 2.632

1.500 24.000 15.000 0.036 0.364 0.036 0.000 0.000 0.000 0.441 2.252 0.000 2.729

1.542 24.667 15.500 0.037 0.369 0.037 0.000 0.000 0.000 0.448 2.337 0.000 2.822

1.583 25.333 16.000 0.037 0.374 0.037 0.000 0.000 0.000 0.456 2.419 0.000 2.912

1.625 26.000 16.500 0.038 0.379 0.038 0.000 0.000 0.000 0.464 2.498 0.000 3.000

1.667 26.667 17.000 0.038 0.384 0.038 0.000 0.000 0.000 0.471 2.575 0.000 3.084

1.708 27.333 17.500 0.039 0.389 0.039 0.000 0.000 0.000 0.478 2.650 0.000 3.167

1.750 28.000 18.000 0.039 0.394 0.039 0.000 0.000 0.000 0.486 2.722 0.000 3.247

1.792 28.667 18.500 0.040 0.399 0.040 0.000 0.000 0.000 0.493 2.793 0.211 3.536

1.833 29.333 19.000 0.040 0.403 0.040 0.000 0.000 0.000 0.500 2.862 0.597 3.998

1.875 30.000 19.500 0.041 0.408 0.041 0.000 0.000 0.000 0.507 2.929 1.096 4.573

1.917 30.667 20.000 0.041 0.412 0.041 0.000 0.000 0.000 0.513 2.995 1.687 5.237

1.958 31.333 20.500 0.042 0.417 0.042 0.000 0.000 0.000 0.520 3.060 2.358 5.979

2.000 32.000 21.000 0.042 0.421 0.042 0.000 0.000 0.000 0.527 3.123 3.100 6.791

Outlet structure for Discharge of Detention Basin 2 (note: 0.0 elev = 2.75 ft actual elevation)

Discharge vs Elevation Table

Low orifice: 1.5 " Lower slot Emergency Weir

Number: 0 Invert: 0.00 ft Invert: 1.500 ft

Cg‐low: 0.61 B 3.00 ft B: 12 ft

h 0.250 ft

Middle orifice: 1 " Upper slot

number of orif: 0 Invert: 0.000 ft

Cg‐middle: 0.61 B: 0.00 ft

invert elev: 0.25 ft h 0.000 ft

h H/D‐low H/D‐mid Qlow‐orif Qlow‐weir Qtot‐low Qmid‐orif Qmid‐weir Qtot‐med Qslot‐low Qslot‐upp Qemer Qtot

(ft) ‐ ‐ (cfs) (cfs) (cfs) (cfs) (cfs) (cfs) (cfs) (cfs) (cfs) (cfs)

0.000 0.000 0.000 0.000 0.000 0.000 0.000 0.000 0.000 0.000 0.000 0.000 0.000

0.042 0.333 0.000 0.000 0.000 0.000 0.000 0.000 0.000 0.079 0.000 0.000 0.079

0.083 0.667 0.000 0.000 0.000 0.000 0.000 0.000 0.000 0.224 0.000 0.000 0.224

0.125 1.000 0.000 0.000 0.000 0.000 0.000 0.000 0.000 0.411 0.000 0.000 0.411

0.167 1.333 0.000 0.000 0.000 0.000 0.000 0.000 0.000 0.633 0.000 0.000 0.633

0.208 1.667 0.000 0.000 0.000 0.000 0.000 0.000 0.000 0.884 0.000 0.000 0.884

0.250 2.000 0.000 0.000 0.000 0.000 0.000 0.000 0.000 1.162 0.000 0.000 1.162

0.292 2.333 0.500 0.000 0.000 0.000 0.000 0.000 0.000 1.465 0.000 0.000 1.465

0.333 2.667 1.000 0.000 0.000 0.000 0.000 0.000 0.000 1.676 0.000 0.000 1.676

0.375 3.000 1.500 0.000 0.000 0.000 0.000 0.000 0.000 1.836 0.000 0.000 1.836

0.417 3.333 2.000 0.000 0.000 0.000 0.000 0.000 0.000 1.983 0.000 0.000 1.983

0.458 3.667 2.500 0.000 0.000 0.000 0.000 0.000 0.000 2.120 0.000 0.000 2.120

0.500 4.000 3.000 0.000 0.000 0.000 0.000 0.000 0.000 2.248 0.000 0.000 2.248

0.542 4.333 3.500 0.000 0.000 0.000 0.000 0.000 0.000 2.370 0.000 0.000 2.370

0.583 4.667 4.000 0.000 0.000 0.000 0.000 0.000 0.000 2.486 0.000 0.000 2.486

0.625 5.000 4.500 0.000 0.000 0.000 0.000 0.000 0.000 2.596 0.000 0.000 2.596

0.667 5.333 5.000 0.000 0.000 0.000 0.000 0.000 0.000 2.702 0.000 0.000 2.702

0.708 5.667 5.500 0.000 0.000 0.000 0.000 0.000 0.000 2.804 0.000 0.000 2.804

0.750 6.000 6.000 0.000 0.000 0.000 0.000 0.000 0.000 2.903 0.000 0.000 2.903

0.792 6.333 6.500 0.000 0.000 0.000 0.000 0.000 0.000 2.998 0.000 0.000 2.998

0.833 6.667 7.000 0.000 0.000 0.000 0.000 0.000 0.000 3.090 0.000 0.000 3.090

0.875 7.000 7.500 0.000 0.000 0.000 0.000 0.000 0.000 3.180 0.000 0.000 3.180

0.917 7.333 8.000 0.000 0.000 0.000 0.000 0.000 0.000 3.267 0.000 0.000 3.267

0.958 7.667 8.500 0.000 0.000 0.000 0.000 0.000 0.000 3.352 0.000 0.000 3.352

1.000 8.000 9.000 0.000 0.000 0.000 0.000 0.000 0.000 3.434 0.000 0.000 3.434

1.042 8.333 9.500 0.000 0.000 0.000 0.000 0.000 0.000 3.515 0.000 0.000 3.515

1.083 8.667 10.000 0.000 0.000 0.000 0.000 0.000 0.000 3.594 0.000 0.000 3.594

1.125 9.000 10.500 0.000 0.000 0.000 0.000 0.000 0.000 3.671 0.000 0.000 3.671

1.167 9.333 11.000 0.000 0.000 0.000 0.000 0.000 0.000 3.747 0.000 0.000 3.747

1.208 9.667 11.500 0.000 0.000 0.000 0.000 0.000 0.000 3.821 0.000 0.000 3.821

1.250 10.000 12.000 0.000 0.000 0.000 0.000 0.000 0.000 3.894 0.000 0.000 3.894

1.292 10.333 12.500 0.000 0.000 0.000 0.000 0.000 0.000 3.966 0.000 0.000 3.966

1.333 10.667 13.000 0.000 0.000 0.000 0.000 0.000 0.000 4.036 0.000 0.000 4.036

1.375 11.000 13.500 0.000 0.000 0.000 0.000 0.000 0.000 4.105 0.000 0.000 4.105

1.417 11.333 14.000 0.000 0.000 0.000 0.000 0.000 0.000 4.173 0.000 0.000 4.173

1.458 11.667 14.500 0.000 0.000 0.000 0.000 0.000 0.000 4.239 0.000 0.000 4.239

1.500 12.000 15.000 0.000 0.000 0.000 0.000 0.000 0.000 4.305 0.000 0.000 4.305

1.542 12.333 15.500 0.000 0.000 0.000 0.000 0.000 0.000 4.370 0.000 0.316 4.686

1.583 12.667 16.000 0.000 0.000 0.000 0.000 0.000 0.000 4.434 0.000 0.895 5.329

1.625 13.000 16.500 0.000 0.000 0.000 0.000 0.000 0.000 4.497 0.000 1.644 6.141

1.667 13.333 17.000 0.000 0.000 0.000 0.000 0.000 0.000 4.559 0.000 2.531 7.090

1.708 13.667 17.500 0.000 0.000 0.000 0.000 0.000 0.000 4.620 0.000 3.537 8.157

1.750 14.000 18.000 0.000 0.000 0.000 0.000 0.000 0.000 4.680 0.000 4.650 9.330

Outlet structure for Discharge of Detention Basin 3 (note: 0.0 elev = 2.75 ft actual elevation)

Discharge vs Elevation Table

Low orifice: 0.75 " Lower slot Emergency Weir

Number: 0 Invert: 0.00 ft Invert: 1.500 ft

Cg‐low: 0.61 B 1.00 ft B: 8 ft

h 0.167 ft

Middle orifice: 1 " Upper slot

number of orif: 0 Invert: 0.000 ft

Cg‐middle: 0.61 B: 0.00 ft

invert elev: 0.25 ft h 0.000 ft

h H/D‐low H/D‐mid Qlow‐orif Qlow‐weir Qtot‐low Qmid‐orif Qmid‐weir Qtot‐med Qslot‐low Qslot‐upp Qemer Qtot Total H Total Q

(ft) ‐ ‐ (cfs) (cfs) (cfs) (cfs) (cfs) (cfs) (cfs) (cfs) (cfs) (cfs) (ft) (cfs)

0.000 0.000 0.000 0.000 0.000 0.000 0.000 0.000 0.000 0.000 0.000 0.000 0.000 2.750 0.026

0.042 0.667 0.000 0.000 0.000 0.000 0.000 0.000 0.000 0.026 0.000 0.000 0.026 2.792 0.052

0.083 1.333 0.000 0.000 0.000 0.000 0.000 0.000 0.000 0.075 0.000 0.000 0.075 2.833 0.100

0.125 2.000 0.000 0.000 0.000 0.000 0.000 0.000 0.000 0.137 0.000 0.000 0.137 2.875 0.163

0.167 2.667 0.000 0.000 0.000 0.000 0.000 0.000 0.000 0.211 0.000 0.000 0.211 2.917 0.236

0.208 3.333 0.000 0.000 0.000 0.000 0.000 0.000 0.000 0.288 0.000 0.000 0.288 2.958 0.314

0.250 4.000 0.000 0.000 0.000 0.000 0.000 0.000 0.000 0.333 0.000 0.000 0.333 3.000 0.359

0.292 4.667 0.500 0.000 0.000 0.000 0.000 0.000 0.000 0.372 0.000 0.000 0.372 3.042 0.398

0.333 5.333 1.000 0.000 0.000 0.000 0.000 0.000 0.000 0.408 0.000 0.000 0.408 3.083 0.433

0.375 6.000 1.500 0.000 0.000 0.000 0.000 0.000 0.000 0.441 0.000 0.000 0.441 3.125 0.466

0.417 6.667 2.000 0.000 0.000 0.000 0.000 0.000 0.000 0.471 0.000 0.000 0.471 3.167 0.497

0.458 7.333 2.500 0.000 0.000 0.000 0.000 0.000 0.000 0.500 0.000 0.000 0.500 3.208 0.525

0.500 8.000 3.000 0.000 0.000 0.000 0.000 0.000 0.000 0.527 0.000 0.000 0.527 3.250 0.552

0.542 8.667 3.500 0.000 0.000 0.000 0.000 0.000 0.000 0.552 0.000 0.000 0.552 3.292 0.578

0.583 9.333 4.000 0.000 0.000 0.000 0.000 0.000 0.000 0.577 0.000 0.000 0.577 3.333 0.602

0.625 10.000 4.500 0.000 0.000 0.000 0.000 0.000 0.000 0.600 0.000 0.000 0.600 3.375 0.626

0.667 10.667 5.000 0.000 0.000 0.000 0.000 0.000 0.000 0.623 0.000 0.000 0.623 3.417 0.649

0.708 11.333 5.500 0.000 0.000 0.000 0.000 0.000 0.000 0.645 0.000 0.000 0.645 3.458 0.671

0.750 12.000 6.000 0.000 0.000 0.000 0.000 0.000 0.000 0.666 0.000 0.000 0.666 3.500 0.692

0.792 12.667 6.500 0.000 0.000 0.000 0.000 0.000 0.000 0.687 0.000 0.000 0.687 3.542 0.712

0.833 13.333 7.000 0.000 0.000 0.000 0.000 0.000 0.000 0.707 0.000 0.000 0.707 3.583 0.732

0.875 14.000 7.500 0.000 0.000 0.000 0.000 0.000 0.000 0.726 0.000 0.000 0.726 3.625 0.751

0.917 14.667 8.000 0.000 0.000 0.000 0.000 0.000 0.000 0.745 0.000 0.000 0.745 3.667 0.770

0.958 15.333 8.500 0.000 0.000 0.000 0.000 0.000 0.000 0.763 0.000 0.000 0.763 3.708 0.789

1.000 16.000 9.000 0.000 0.000 0.000 0.000 0.000 0.000 0.781 0.000 0.000 0.781 3.750 0.807

1.042 16.667 9.500 0.000 0.000 0.000 0.000 0.000 0.000 0.799 0.000 0.000 0.799 3.792 0.824

1.083 17.333 10.000 0.000 0.000 0.000 0.000 0.000 0.000 0.816 0.000 0.000 0.816 3.833 0.841

1.125 18.000 10.500 0.000 0.000 0.000 0.000 0.000 0.000 0.833 0.000 0.000 0.833 3.875 0.858

1.167 18.667 11.000 0.000 0.000 0.000 0.000 0.000 0.000 0.849 0.000 0.000 0.849 3.917 0.875

1.208 19.333 11.500 0.000 0.000 0.000 0.000 0.000 0.000 0.865 0.000 0.000 0.865 3.958 0.891

1.250 20.000 12.000 0.000 0.000 0.000 0.000 0.000 0.000 0.881 0.000 0.000 0.881 4.000 0.907

1.292 20.667 12.500 0.000 0.000 0.000 0.000 0.000 0.000 0.897 0.000 0.000 0.897 4.042 0.922

1.333 21.333 13.000 0.000 0.000 0.000 0.000 0.000 0.000 0.912 0.000 0.000 0.912 4.083 0.938

1.375 22.000 13.500 0.000 0.000 0.000 0.000 0.000 0.000 0.927 0.000 0.000 0.927 4.125 0.953

1.417 22.667 14.000 0.000 0.000 0.000 0.000 0.000 0.000 0.942 0.000 0.000 0.942 4.167 0.968

1.458 23.333 14.500 0.000 0.000 0.000 0.000 0.000 0.000 0.957 0.000 0.000 0.957 4.208 0.982

1.500 24.000 15.000 0.000 0.000 0.000 0.000 0.000 0.000 0.971 0.000 0.000 0.971 4.250 0.997

1.542 24.667 15.500 0.000 0.000 0.000 0.000 0.000 0.000 0.985 0.000 0.211 1.196 4.292 1.222

1.583 25.333 16.000 0.000 0.000 0.000 0.000 0.000 0.000 0.999 0.000 0.596 1.596 4.333 1.621

1.625 26.000 16.500 0.000 0.000 0.000 0.000 0.000 0.000 1.013 0.000 1.096 2.109 4.375 2.134

1.667 26.667 17.000 0.000 0.000 0.000 0.000 0.000 0.000 1.027 0.000 1.687 2.714 4.417 2.739

1.708 27.333 17.500 0.000 0.000 0.000 0.000 0.000 0.000 1.040 0.000 2.358 3.398 4.458 3.424

1.750 28.000 18.000 0.000 0.000 0.000 0.000 0.000 0.000 1.053 0.000 3.100 4.153 4.500 4.179

1.792 28.667 18.500 0.000 0.000 0.000 0.000 0.000 0.000 1.066 0.000 3.906 4.973 4.542 4.998

1.833 29.333 19.000 0.000 0.000 0.000 0.000 0.000 0.000 1.079 0.000 4.773 5.852 4.583 5.877

1.875 30.000 19.500 0.000 0.000 0.000 0.000 0.000 0.000 1.092 0.000 5.695 6.787 4.625 6.812

1.917 30.667 20.000 0.000 0.000 0.000 0.000 0.000 0.000 1.105 0.000 6.670 7.775 4.667 7.800

1.958 31.333 20.500 0.000 0.000 0.000 0.000 0.000 0.000 1.117 0.000 7.695 8.812 4.708 8.838

2.000 32.000 21.000 0.000 0.000 0.000 0.000 0.000 0.000 1.130 0.000 8.768 9.897 4.750 9.923


DISCHARGE EQUATIONS 

1) Weir: 

/                   (1) 


2) Slot: 

As an orifice:  2           (2.a) 

As a weir:  /               (2.b) 

For  H  >  hs  slot works  as weir  until  orifice  equation  provides  a  smaller  discharge.    The  elevation  such  that 

equation (2.a) = equation (2.b) is the elevation at which the behavior changes from weir to orifice. 

3) Vertical Orifices 


As an orifice:   0.25 2           (3.a) 

As a weir:  Critical depth and geometric family of circular sector must be solved to determined Q as a function of 

H: 

; 2

; 2 ; 8

1 0.5                (3.b.1, 3.b.2, 3.b.3, 3.b.4 and 3.b.5) 

There is a value of H (approximately H = 110% D) from which orifices no longer work as weirs as critical depth is 

not  possible  at  the  entrance  of  the  orifice.  This  value  of H  is  obtained  equaling  the  discharge  using  critical 

equations and equations (3.b). 

A mathematical model is prepared with the previous equations depending on the type of discharge. 

The following are the variables used above: 

QW, Qs, QO = Discharge of weir, slot or orifice (cfs) 

CW, cg : Coefficients of discharge of weir (typically 3.1) and orifice (0.61 to 0.62) 

L, Bs, D, hs : Length of weir, width of slot, diameter of orifice and height of slot, respectively;  (ft) 

H: Level of water in the pond over the invert of slot, weir or orifice (ft) 

Acr, Tcr, ycr, αcr: Critical variables for circular sector: area (sq‐ft), top width (ft), critical depth (ft), and angle to the 

center, respectively.  


ATTACHMENT 5 

Pre & Post‐Developed Maps, Project Plan and Detention  

Section Sketches 


1

DM

A E

XH

IB

IT

- E

XIS

IT

IN

G C

ON

DIT

IO

NS

SK

YL

IN

E R

ET

IR

EM

EN

T C

EN

TE

R

LA

M

ES

A, C

ALIF

OR

NIA

91941

LEGEND

C

A

M

P

O

R

O

A

D

(

S

R

-

9

4

)

CAMPO ROAD (SR-94)

SAMPLE PROHIBITIVE SIGNAGE

SITE DESIGN BMP'S

FLOW CONTROL ORIFICE PLATE

TABULATED DATA BMP TABLE

1

BMP BASIN DETAILS

DMA EXHIBIT

PDS 040 (REV. 09/24/2012)BUILDING PLOT PLAN TEMPLATE

SK

YLI

NE

RE

TIR

EM

EN

T C

EN

TE

R

SOURCE CONTROL BMP'S


ATTACHMENT 6 

SWMM Input Data in Input Format (Existing & Proposed Models) 


PRE_DEV 

[TITLE] [OPTIONS] FLOW_UNITS CFS INFILTRATION GREEN_AMPT FLOW_ROUTING KINWAVE START_DATE 08/29/1951 START_TIME 00:00:00 REPORT_START_DATE 08/29/1951 REPORT_START_TIME 00:00:00 END_DATE 03/29/2008 END_TIME 00:00:00 SWEEP_START 01/01 SWEEP_END 12/31 DRY_DAYS 0 REPORT_STEP 01:00:00 WET_STEP 00:15:00 DRY_STEP 04:00:00 ROUTING_STEP 0:01:00 ALLOW_PONDING NO INERTIAL_DAMPING PARTIAL VARIABLE_STEP 0.75 LENGTHENING_STEP 0 MIN_SURFAREA 0 NORMAL_FLOW_LIMITED BOTH SKIP_STEADY_STATE NO FORCE_MAIN_EQUATION H-W LINK_OFFSETS DEPTH MIN_SLOPE 0 [EVAPORATION] ;;Type Parameters ;;---------- ---------- MONTHLY 0.07 0.10 0.13 0.17 0.19 0.22 0.24 0.22 0.19 0.13 0.09 0.06 DRY_ONLY NO [RAINGAGES] ;; Rain Time Snow Data ;;Name Type Intrvl Catch Source ;;-------------- --------- ------ ------ ---------- Lower-Otay INTENSITY 1:00 1.0 TIMESERIES LowerOtay [SUBCATCHMENTS] ;; Total Pcnt. Pcnt. Curb Snow ;;Name Raingage Outlet Area Imperv Width Slope Length Pack ;;-------------- ---------------- ---------------- -------- -------- -------- -------- -------- -------- 1-1-A Lower-Otay POC-1 4.086 0 820 13.50 0 1-1-D Lower-Otay POC-1 4.417 0 796 14.10 0 OFFSITE-A Lower-Otay POC-1 0.367 0 28 3.50 0 OFFSITE-D Lower-Otay POC-1 0.012 0 20 3.90 0 [SUBAREAS] ;;Subcatchment N-Imperv N-Perv S-Imperv S-Perv PctZero RouteTo PctRouted ;;-------------- ---------- ---------- ---------- ---------- ---------- ---------- ---------- 1-1-A 0.012 0.05 0.05 0.10 25 OUTLET 1-1-D 0.012 0.05 0.05 0.10 25 OUTLET OFFSITE-A 0.012 0.05 0.05 0.10 25 OUTLET OFFSITE-D 0.012 0.05 0.05 0.10 25 OUTLET [INFILTRATION] ;;Subcatchment Suction HydCon IMDmax ;;-------------- ---------- ---------- ---------- 1-1-A 1.5 0.30 0.30 1-1-D 9.0 0.025 0.33 OFFSITE-A 1.5 0.30 0.30 OFFSITE-D 9.0 0.025 0.33 [OUTFALLS] ;; Invert Outfall Stage/Table Tide ;;Name Elev. Type Time Series Gate ;;-------------- ---------- ---------- ---------------- ----

PRE_DEV 

POC-1 0 FREE NO [TIMESERIES] ;;Name Date Time Value ;;-------------- ---------- ---------- ---------- LowerOtay FILE "Lower Otay.txt" [REPORT] INPUT NO CONTROLS NO SUBCATCHMENTS ALL NODES ALL LINKS ALL [TAGS] [MAP] DIMENSIONS 1450.000 2925.000 2550.000 4575.000 Units None [COORDINATES] ;;Node X-Coord Y-Coord ;;-------------- ------------------ ------------------ POC-1 2000.000 3000.000 [VERTICES] ;;Link X-Coord Y-Coord ;;-------------- ------------------ ------------------ [Polygons] ;;Subcatchment X-Coord Y-Coord ;;-------------- ------------------ ------------------ 1-1-A 1500.000 4000.000 1-1-A 1500.000 4000.000 1-1-D 2500.000 4000.000 OFFSITE-A 1500.000 3000.000 OFFSITE-D 2500.000 3000.000 [SYMBOLS] ;;Gage X-Coord Y-Coord ;;-------------- ------------------ ------------------ Lower-Otay 2000.000 4500.000


POST_DEV 

[TITLE] [OPTIONS] FLOW_UNITS CFS INFILTRATION GREEN_AMPT FLOW_ROUTING KINWAVE START_DATE 08/29/1951 START_TIME 00:00:00 REPORT_START_DATE 08/29/1951 REPORT_START_TIME 00:00:00 END_DATE 03/29/2008 END_TIME 00:00:00 SWEEP_START 01/01 SWEEP_END 12/31 DRY_DAYS 0 REPORT_STEP 01:00:00 WET_STEP 00:15:00 DRY_STEP 04:00:00 ROUTING_STEP 0:01:00 ALLOW_PONDING NO INERTIAL_DAMPING PARTIAL VARIABLE_STEP 0.75 LENGTHENING_STEP 0 MIN_SURFAREA 0 NORMAL_FLOW_LIMITED BOTH SKIP_STEADY_STATE NO FORCE_MAIN_EQUATION H-W LINK_OFFSETS DEPTH MIN_SLOPE 0 [EVAPORATION] ;;Type Parameters ;;---------- ---------- MONTHLY 0.07 0.10 0.13 0.17 0.19 0.22 0.24 0.22 0.19 0.13 0.09 0.06 DRY_ONLY NO [RAINGAGES] ;; Rain Time Snow Data ;;Name Type Intrvl Catch Source ;;-------------- --------- ------ ------ ---------- LowerOtay INTENSITY 1:00 1.0 TIMESERIES LowerOtay [SUBCATCHMENTS] ;; Total Pcnt. Pcnt. Curb Snow ;;Name Raingage Outlet Area Imperv Width Slope Length Pack ;;-------------- ---------------- ---------------- -------- -------- -------- -------- -------- -------- 1-1-D LowerOtay BR-1 0.888 32.4 363 50 0 1-1-A LowerOtay BR-1 1.278 44.5 400 39.10 0 1-2-A LowerOtay BR-2 1.600 77.17 598 12.50 0 1-2-D LowerOtay BR-2 1.848 60.60 527 45 0 1-3-A LowerOtay BR-3 0.106 100 214 6.12 0 1-3-D LowerOtay BR-3 1.189 46.4 672 38.56 0 BR-1 LowerOtay DIV-1 0.03464 0 10 0 0 BR-2 LowerOtay DIV-2 0.10018 0 10 0 0 BR-3 LowerOtay DIV-3 0.03237 0 10 0 0 1-1-D-BYPASS LowerOtay POC-1 0.365 0 423 14.10 0 1-1-A-BYPASS LowerOtay POC-1 1.067 0 865 13.50 0 OFFSITE-A LowerOtay POC-1 0.367 27.4 28 3.50 0 OFFSITE-D LowerOtay POC-1 0.012 100 20 3.90 0 [SUBAREAS] ;;Subcatchment N-Imperv N-Perv S-Imperv S-Perv PctZero RouteTo PctRouted

POST_DEV 

;;-------------- ---------- ---------- ---------- ---------- ---------- ---------- ---------- 1-1-D 0.012 0.05 0.05 0.10 25 OUTLET 1-1-A 0.012 0.05 0.05 0.10 25 OUTLET 1-2-A 0.012 0.05 0.05 0.10 25 OUTLET 1-2-D 0.012 0.05 0.05 0.10 25 OUTLET 1-3-A 0.012 0.05 0.05 0.10 25 OUTLET 1-3-D 0.012 0.05 0.05 0.10 25 OUTLET BR-1 0.012 0.05 0.05 0.10 25 OUTLET BR-2 0.012 0.05 0.05 0.10 25 OUTLET BR-3 0.012 0.05 0.05 0.10 25 OUTLET 1-1-D-BYPASS 0.012 0.05 0.05 0.10 25 OUTLET 1-1-A-BYPASS 0.012 0.05 0.05 0.10 25 OUTLET OFFSITE-A 0.012 0.05 0.05 0.10 25 OUTLET OFFSITE-D 0.012 0.05 0.05 0.10 25 OUTLET [INFILTRATION] ;;Subcatchment Suction HydCon IMDmax ;;-------------- ---------- ---------- ---------- 1-1-D 9 0.01875 0.33 1-1-A 1.5 0.225 0.30 1-2-A 1.5 0.225 0.30 1-2-D 9 0.01875 0.33 1-3-A 1.5 0.225 0.30 1-3-D 9 0.01875 0.33 BR-1 1.5 0.225 0.30 BR-2 9 0.01875 0.33 BR-3 9 0.01875 0.33 1-1-D-BYPASS 9 0.025 0.33 1-1-A-BYPASS 1.5 0.3 0.30 OFFSITE-A 1.5 0.225 0.30 OFFSITE-D 9 0.01875 0.33 [LID_CONTROLS] ;; Type/Layer Parameters ;;-------------- ---------- ---------- BR-1 BC BR-1 SURFACE 4.67 0.05 0 0 5 BR-1 SOIL 18 0.4 0.2 0.1 5 5 1.5 BR-1 STORAGE 27 0.67 0.1018 0 BR-1 DRAIN 0.2207 0.5 9 6 BR-2 BC BR-2 SURFACE 7.2 0.05 0 0 5 BR-2 SOIL 18 0.4 0.2 0.1 5 5 1.5 BR-2 STORAGE 27 0.67 0.0896 0 BR-2 DRAIN 0.1717 0.5 9 6 BR-3 BC BR-3 SURFACE 4.20 0.05 0 0 5 BR-3 SOIL 18 0.4 0.2 0.1 5 5 1.5 BR-3 STORAGE 30 0.67 0.14 0 BR-3 DRAIN 0.1807 0.5 12 6 [LID_USAGE] ;;Subcatchment LID Process Number Area Width InitSatur FromImprv ToPerv Report File ;;-------------- ---------------- ------- ---------- ---------- ---------- ---------- ---------- ----------- BR-1 BR-1 1 1509 0 0 100 0 BR-2 BR-2 1 4364 0 0 100 0 BR-3 BR-3 1 1410 0 0 100 0

POST_DEV 

[OUTFALLS] ;; Invert Outfall Stage/Table Tide ;;Name Elev. Type Time Series Gate ;;-------------- ---------- ---------- ---------------- ---- POC-1 0 FREE NO [DIVIDERS] ;; Invert Diverted Divider ;;Name Elev. Link Type Parameters ;;-------------- ---------- ---------------- ---------- ---------- DIV-1 0 BYPASS-1 CUTOFF 0.03210 0 0 0 0 DIV-2 0 BYPASS-2 CUTOFF 0.07115 0 0 0 0 DIV-3 0 BYPASS-3 CUTOFF 0.02466 0 0 0 0 [STORAGE] ;; Invert Max. Init. Storage Curve Ponded Evap. ;;Name Elev. Depth Depth Curve Params Area Frac. Infiltration Parameters ;;-------------- -------- -------- -------- ---------- -------- -------- -------- -------- -------- ----------------------- BASIN-1 0 2 0 TABULAR BASIN-1 2725 0 BASIN-2 0 1.75 0 TABULAR BASIN-2 4364 0 BASIN-3 0 2 0 TABULAR BASIN-3 1411 1 [CONDUITS] ;; Inlet Outlet Manning Inlet Outlet Init. Max. ;;Name Node Node Length N Offset Offset Flow Flow ;;-------------- ---------------- ---------------- ---------- ---------- ---------- ---------- ---------- ---------- BYPASS-1 DIV-1 BASIN-1 10 0.01 0 0 0 0 U-DRAIN-1 DIV-1 POC-1 10 0.01 0 0 0 0 U-DRAIN-2 DIV-2 POC-1 10 0.01 0 0 0 0 BYPASS-2 DIV-2 BASIN-2 10 0.01 0 0 0 0 U-DRAIN-3 DIV-3 POC-1 10 0.01 0 0 0 0 BYPASS-3 DIV-3 BASIN-3 10 0.01 0 0 0 0 [OUTLETS] ;; Inlet Outlet Outflow Outlet Qcoeff/ Flap ;;Name Node Node Height Type QTable Qexpon Gate ;;-------------- ---------------- ---------------- ---------- --------------- ---------------- ---------- ---- OUTLET-1 BASIN-1 POC-1 0 TABULAR/HEAD OUT-1 NO OUTLET-2 BASIN-2 POC-1 0 TABULAR/HEAD OUT-2 NO OUTLET-3 BASIN-3 POC-1 0 TABULAR/HEAD OUT-3 NO [XSECTIONS] ;;Link Shape Geom1 Geom2 Geom3 Geom4 Barrels ;;-------------- ------------ ---------------- ---------- ---------- ---------- ---------- BYPASS-1 DUMMY 0 0 0 0 1

POST_DEV 

U-DRAIN-1 DUMMY 0 0 0 0 1 U-DRAIN-2 DUMMY 0 0 0 0 1 BYPASS-2 DUMMY 0 0 0 0 1 U-DRAIN-3 DUMMY 0 0 0 0 1 BYPASS-3 DUMMY 0 0 0 0 1 [LOSSES] ;;Link Inlet Outlet Average Flap Gate ;;-------------- ---------- ---------- ---------- ---------- [CURVES] ;;Name Type X-Value Y-Value ;;-------------- ---------- ---------- ---------- OUT-1 Rating 0.000 0.000 OUT-1 0.042 0.003 OUT-1 0.083 0.007 OUT-1 0.125 0.009 OUT-1 0.167 0.011 OUT-1 0.208 0.013 OUT-1 0.250 0.014 OUT-1 0.292 0.029 OUT-1 0.333 0.054 OUT-1 0.375 0.086 OUT-1 0.417 0.124 OUT-1 0.458 0.164 OUT-1 0.500 0.187 OUT-1 0.542 0.208 OUT-1 0.583 0.226 OUT-1 0.625 0.243 OUT-1 0.667 0.259 OUT-1 0.708 0.275 OUT-1 0.750 0.289 OUT-1 0.792 0.302 OUT-1 0.833 0.315 OUT-1 0.875 0.394 OUT-1 0.917 0.526 OUT-1 0.958 0.694 OUT-1 1.000 0.890 OUT-1 1.042 1.110 OUT-1 1.083 1.353 OUT-1 1.125 1.615 OUT-1 1.167 1.801 OUT-1 1.208 1.944 OUT-1 1.250 2.076 OUT-1 1.292 2.199 OUT-1 1.333 2.316 OUT-1 1.375 2.426 OUT-1 1.417 2.531 OUT-1 1.458 2.632 OUT-1 1.500 2.729 OUT-1 1.542 2.822 OUT-1 1.583 2.912 OUT-1 1.625 3.000 OUT-1 1.667 3.084 OUT-1 1.708 3.167 OUT-1 1.750 3.247 OUT-1 1.792 3.536 OUT-1 1.833 3.998 OUT-1 1.875 4.573 OUT-1 1.917 5.237 OUT-1 1.958 5.979 OUT-1 2.000 6.791

POST_DEV 

OUT-2 Rating 0.000 0.000 OUT-2 0.042 0.079 OUT-2 0.083 0.224 OUT-2 0.125 0.411 OUT-2 0.167 0.633 OUT-2 0.208 0.884 OUT-2 0.250 1.162 OUT-2 0.292 1.465 OUT-2 0.333 1.676 OUT-2 0.375 1.836 OUT-2 0.417 1.983 OUT-2 0.458 2.120 OUT-2 0.500 2.248 OUT-2 0.542 2.370 OUT-2 0.583 2.486 OUT-2 0.625 2.596 OUT-2 0.667 2.702 OUT-2 0.708 2.804 OUT-2 0.750 2.903 OUT-2 0.792 2.998 OUT-2 0.833 3.090 OUT-2 0.875 3.180 OUT-2 0.917 3.267 OUT-2 0.958 3.352 OUT-2 1.000 3.434 OUT-2 1.042 3.515 OUT-2 1.083 3.594 OUT-2 1.125 3.671 OUT-2 1.167 3.747 OUT-2 1.208 3.821 OUT-2 1.250 3.894 OUT-2 1.292 3.966 OUT-2 1.333 4.036 OUT-2 1.375 4.105 OUT-2 1.417 4.173 OUT-2 1.458 4.239 OUT-2 1.500 4.305 OUT-2 1.542 4.686 OUT-2 1.583 5.329 OUT-2 1.625 6.141 OUT-2 1.667 7.090 OUT-2 1.708 8.157 OUT-2 1.750 9.330 OUT-3 Rating 0.000 0.000 OUT-3 0.042 0.026 OUT-3 0.083 0.075 OUT-3 0.125 0.137 OUT-3 0.167 0.211 OUT-3 0.208 0.288 OUT-3 0.250 0.333 OUT-3 0.292 0.372 OUT-3 0.333 0.408 OUT-3 0.375 0.441 OUT-3 0.417 0.471 OUT-3 0.458 0.500 OUT-3 0.500 0.527 OUT-3 0.542 0.552 OUT-3 0.583 0.577 OUT-3 0.625 0.600 OUT-3 0.667 0.623

POST_DEV 

OUT-3 0.708 0.645 OUT-3 0.750 0.666 OUT-3 0.792 0.687 OUT-3 0.833 0.707 OUT-3 0.875 0.726 OUT-3 0.917 0.745 OUT-3 0.958 0.763 OUT-3 1.000 0.781 OUT-3 1.042 0.799 OUT-3 1.083 0.816 OUT-3 1.125 0.833 OUT-3 1.167 0.849 OUT-3 1.208 0.865 OUT-3 1.250 0.881 OUT-3 1.292 0.897 OUT-3 1.333 0.912 OUT-3 1.375 0.927 OUT-3 1.417 0.942 OUT-3 1.458 0.957 OUT-3 1.500 0.971 OUT-3 1.542 1.196 OUT-3 1.583 1.596 OUT-3 1.625 2.109 OUT-3 1.667 2.714 OUT-3 1.708 3.398 OUT-3 1.750 4.153 OUT-3 1.792 4.973 OUT-3 1.833 5.852 OUT-3 1.875 6.787 OUT-3 1.917 7.775 OUT-3 1.958 8.812 OUT-3 2.000 9.897 BASIN-1 Storage 0.00 1784 BASIN-1 0.25 1829 BASIN-1 0.50 1872 BASIN-1 0.75 1916 BASIN-1 1.00 1959 BASIN-1 1.25 2001 BASIN-1 1.50 2043 BASIN-1 1.75 2085 BASIN-1 2.00 2126 BASIN-2 Storage 0.00 4364 BASIN-2 0.25 4364 BASIN-2 0.50 4364 BASIN-2 0.75 4364 BASIN-2 1.00 4364 BASIN-2 1.25 4364 BASIN-2 1.50 4364 BASIN-2 1.75 4364 BASIN-3 Storage 0.00 1411 BASIN-3 0.25 1411 BASIN-3 0.50 1411 BASIN-3 0.75 1411 BASIN-3 1.00 1411 BASIN-3 1.25 1411 BASIN-3 1.50 1411 BASIN-3 1.75 1411 [TIMESERIES]

POST_DEV 

;;Name Date Time Value ;;-------------- ---------- ---------- ---------- LowerOtay FILE "Lower Otay.txt" [REPORT] INPUT NO CONTROLS NO SUBCATCHMENTS ALL NODES ALL LINKS ALL [TAGS] [MAP] DIMENSIONS -400.000 175.000 8400.000 7325.000 Units None [COORDINATES] ;;Node X-Coord Y-Coord ;;-------------- ------------------ ------------------ POC-1 4000.000 1000.000 DIV-1 500.000 4000.000 DIV-2 5000.000 4000.000 DIV-3 7500.000 4000.000 BASIN-1 500.000 1000.000 BASIN-2 3000.000 4000.000 BASIN-3 7500.000 1000.000 [VERTICES] ;;Link X-Coord Y-Coord ;;-------------- ------------------ ------------------ [Polygons] ;;Subcatchment X-Coord Y-Coord ;;-------------- ------------------ ------------------ 1-1-D 1000.000 6000.000 1-1-D 1000.000 6000.000 1-1-A 0.000 6000.000 1-2-A 3500.000 6000.000 1-2-D 4500.000 6000.000 1-3-A 7000.000 6000.000 1-3-D 8000.000 6000.000 BR-1 500.000 5000.000 BR-2 4000.000 5000.000 BR-3 7500.000 5000.000 1-1-D-BYPASS 7500.000 500.000 1-1-A-BYPASS 500.000 500.000 OFFSITE-A 2250.000 500.000 OFFSITE-D 5750.000 500.000 [SYMBOLS] ;;Gage X-Coord Y-Coord ;;-------------- ------------------ ------------------ LowerOtay 4000.000 7000.000


ATTACHMENT 7 

EPA SWMM FIGURES AND EXPLANATIONS 

Per the attached, the reader can see the screens associated with the EPA‐SWMM Model  in both pre‐

development  and post‐development  conditions.  Each portion,  i.e.,  sub‐catchments, outfalls,  storage 

units, weir as a discharge, and outfalls (point of compliance), are also shown. 

Variables  for modeling  are  associated with  typical  recommended  values by  the  EPA‐SWMM model, 

typical  values  found  in  technical  literature  (such  as  Maidment’s  Handbook  of  Hydrology).   

Recommended values for the SWMM model have been attained from the Model BMP Design Manual 

San Diego Region. 

Soil characteristics of  the existing soils were determined  from  the NRCS Web Soil Survey  (located  in 

Attachment 8 of this report). 

Some  values  incorporated within  the  SWMM model  have  been  determined  from  the  professional 

experience of REC using  conservative assumptions  that have a  tendency  to  increase  the  size of  the 

needed BMP and also generate a long‐term runoff as a percentage of rainfall similar to those measured 

in gage stations in Southern California by the USGS. 

A technical document prepared by Tory R Walker Engineering for the Cities of San Marcos, Oceanside 

and Vista (Reference [1]) can also be consulted for additional  information regarding typical values for 

SWMM parameters. 


PRE‐DEVELOPED CONDITION 


POST‐DEVELOPED CONDITION 


EXPLANATION OF SELECTED VARIABLES 

Sub‐Catchment Areas: 

Please refer to the attached diagrams that indicate the DMA and Bio‐Retention BMPs (BMPs) sub areas 

modeled within the project site at both the pre and post developed conditions draining to the POC. 

Parameters for the pre‐ and post‐developed models include soil types A & D as determined from the site 

specific Natural  Resources  Conservation  Service  (NRCS)  geologic  review  (attached  at  the  end  of  this 

appendix).    Suction  head,  conductivity  and  initial  deficit  corresponds  to  average  values  expected  for 

these  soils  types,  according  to  sources  consulted,  professional  experience,  and  approximate  values 

obtained by the interim Orange County modeling approach.  

REC selected  infiltration values, such that the percentage of total precipitation that becomes runoff,  is 

realistic for the soil types and slightly smaller than measured values for Southern California watersheds. 

Selection of a Kinematic Approach:  As the continuous model is based on hourly rainfall, and the time of 

concentration for the pre‐development and post‐development conditions is significantly smaller than 60 

minutes, precise routing of the flows through the impervious surfaces, the underdrain pipe system, and 

the discharge pipe was  considered unnecessary. The  truncation error of  the precipitation  into hourly 

steps  is much more significant than the precise routing  in a system where the time of concentration  is 

much smaller than 1 hour. 

Sub‐Catchment BMP: 

The area of bio‐filtration must be equal  to  the area of  the development  tributary  to  the bioretention 

facility (area that drains into a biofiltration, equal external area plus bio‐filtration itself).  Five (5) decimal 

places were given regarding the areas of the bio‐filtration to  insure that the area used by the program 

for the LID subroutine corresponds exactly with this tributary.  


LID Control Editor: Explanation of Significant Variables 

Storage Depth:  

The storage depth variable within  the SWMM model  is  representative of  the storage volume 

provided beneath the first surface riser outlet and the engineered soil and mulch components 

of the bioretention facilities.   

In those cases where the surface storage has a variable area that is also different to the area of 

the gravel and amended soil, the SWMM model needs to be calibrated as the LID module will 

use  the  storage  depth multiplied  by  the  BMP  area  as  the  amount  of  volume  stored  at  the 

surface. 

Let ABMP be the area of the BMP (area of amended soil and area of gravel). The proper value of 

the  storage depth SD  to be  included  in  the LID module can be calculated by using geometric 

properties of the surface volume. Let A0 be the surface area at the bottom of the surface pond, 

and let Ai be the surface area at the elevation of the invert of the first row of orifices (or at the 

invert  of  the  riser  if  not  surface  orifices  are  included).  Finally,  let  hi  be  the  difference  in 

elevation between A0 and Ai. By volumetric definition: 

                  (1) 

Equation (1) allows the determination of SD to be included as Storage Depth in the LID module. 

Porosity:   A porosity value of 0.4 has been selected for the model.   The amended soil  is to be 

highly sandy  in content  in order to have a saturated hydraulic conductivity of approximately 5 

in/hr.   

REC  considers  such  a  value  to  be  slightly  high;  however,  in  order  to  comply with  the HMP 

Permit,  the value recommended by the Copermittees  for  the porosity of amended soil  is 0.4, 

per Appendix A of the Final Hydromodification Management Plan by Brown & Caldwell, dated 

March 2011. Such porosity is equal to the porosity of the gravel per the same document. 

Void  Ratio:    The  ratio  of  the  void  volume  divided  by  the  soil  volume  is  directly  related  to 

porosity as n/(1‐n). As the underdrain  layer  is composed of gravel, a porosity value of 0.4 has 

been selected (also per Appendix A of the Final HMP document), which results in a void ratio of 

0.4/(1‐0.4) = 0.67 for the gravel detention layer.    

Conductivity:      All  basins  will  be  unlined  to  allow  for  infiltration  into  the  underlying  soils. 

Conductivity values are taken from the Percolation test found  in attachment 8 and a factor of 

safety of 2 was applied to them. The conductivity values can  be seen in the screen shot of the 

LID  in the previous pages. 

Clogging factor:  A clogging factor was not used (0 indicates that there is no clogging assumed 

within the model). The reason for this is related to the fairness of a comparison with the SDHM 

model and the HMP sizing tables: a clogging factor was not considered, and instead, a 

conservative value of infiltration was recommended.  

Drain (Flow) coefficient:  The flow coefficient C in the SWMM Model is the coefficient needed to 

transform the orifice equation into a general power law equation of the form: 

                    (2) 

where q is the peak flow in in/hr, n is the exponent (typically 0.5 for orifice equation), HD is the 

elevation of the centroid of the orifice in inches (assumed equal to the invert of the orifice for 

small orifices and in our design equal to 0) and H is the depth of the water in inches. 

The general orifice equation can be expressed as: 

2                   (3) 

where Q is the peak flow in cfs, D is the diameter in inches, cg is the typical discharge coefficient 

for orifices (0.61‐0.63 for thin walls and around 0.75‐0.8 for thick walls), g is the acceleration of 

gravity in ft/s2, and H and HD are defined above and are also used in inches in Equation (3). 

It is clear that:   


              (4) 


DETENTION BASINS 


  Overland Flow Manning’s Coefficient per TRWE (Reference [6]) 

3 Further discussion is provided on page 6 under “Discussion of Differences Between Manning’s n Values” 3

appeal of a de facto value, we anticipate that jurisdictions will not be inclined to approve land surfaces

other than short prairie grass. Therefore, in order to provide SWMM users with a wider range of land

surfaces suitable for local application and to provide Copermittees with confidence in the design

parameters, we recommend using the values published by Yen and Chow in Table 3-5 of the EPA SWMM

Reference Manual Volume I – Hydrology.

SWMM-Endorsed Values Will Improve Model Quality

In January 2016, the EPA released the SWMM Reference Manual Volume I – Hydrology (SWMM

Hydrology Reference Manual). The SWMM Hydrology Reference Manual complements the SWMM 5

User’s Manual and SWMM 5 Applications Manual by providing an in-depth description of the program’s

hydrologic components (EPA 2016). Table 3-5 of the SWMM Hydrology Reference Manual expounds

upon SWMM 5 User’s Manual Table A.6 by providing Manning’s n values for additional overland flow

surfaces3. The values are provided in Table 1:

Table 1: Manning’s n Values for Overland Flow (EPA, 2016; Yen 2001; Yen and Chow, 1983).

Overland Surface Light Rain

(< 0.8 in/hr) Moderate Rain (0.8-1.2 in/hr)

Heavy Rain (> 1.2 in/hr)

Smooth asphalt pavement 0.010 0.012 0.015

Smooth impervious surface 0.011 0.013 0.015

Tar and sand pavement 0.012 0.014 0.016

Concrete pavement 0.014 0.017 0.020

Rough impervious surface 0.015 0.019 0.023

Smooth bare packed soil 0.017 0.021 0.025

Moderate bare packed soil 0.025 0.030 0.035

Rough bare packed soil 0.032 0.038 0.045

Gravel soil 0.025 0.032 0.045

Mowed poor grass 0.030 0.038 0.045

Average grass, closely clipped sod 0.040 0.050 0.060

Pasture 0.040 0.055 0.070

Timberland 0.060 0.090 0.120

Dense grass 0.060 0.090 0.120

Shrubs and bushes 0.080 0.120 0.180

Land Use

Business 0.014 0.022 0.035

Semibusiness 0.022 0.035 0.050

Industrial 0.020 0.035 0.050

Dense residential 0.025 0.040 0.060

Suburban residential 0.030 0.055 0.080

Parks and lawns 0.040 0.075 0.120

For purposes of local hydromodification management BMP design, these Manning’s n values are an

improvement upon the values presented by Engman (1986) in SWMM 5 User’s Manual Table A.6. Values

from SWMM 5 User’s Manual Table A.6, while completely suitable for the intended application to

certain agricultural land covers, comes with the disclaimer that the provided Manning’s n values are

valid for shallow-depth overland flow that match the conditions in the experimental plots (Engman,

ATTACHMENT 8 

Soils Maps 


Hydrologic Soil Group—San Diego County Area, California(Skyline)

Natural ResourcesConservation Service

Web Soil SurveyNational Cooperative Soil Survey

3/23/2015Page 1 of 5

3622

780

3622

840

3622

900

3622

960

3623

020

3623

080

3623

140

3622

780

3622

840

3622

900

3622

960

3623

020

3623

080

3623

140

503860 503920 503980 504040 504100 504160 504220 504280 504340 504400 504460

503860 503920 503980 504040 504100 504160 504220 504280 504340 504400 504460

32° 44' 46'' N11

6° 5

7' 3

1'' W

32° 44' 46'' N

116°

57'

8'' W

32° 44' 33'' N

116°

57'

31'

' W

32° 44' 33'' N

116°

57'

8'' W

N

Map projection: Web Mercator Corner coordinates: WGS84 Edge tics: UTM Zone 11N WGS840 100 200 400 600

Feet0 40 80 160 240

MetersMap Scale: 1:2,800 if printed on A landscape (11" x 8.5") sheet.

MAP LEGEND MAP INFORMATION

Area of Interest (AOI)Area of Interest (AOI)

SoilsSoil Rating Polygons

A

A/D

B

B/D

C

C/D

D

Not rated or not available

Soil Rating LinesA

A/D

B

B/D

C

C/D

D

Not rated or not available

Soil Rating PointsA

A/D

B

B/D

C

C/D

D

Not rated or not available

Water FeaturesStreams and Canals

TransportationRails

Interstate Highways

US Routes

Major Roads

Local Roads

BackgroundAerial Photography

The soil surveys that comprise your AOI were mapped at 1:24,000.

Warning: Soil Map may not be valid at this scale.

Enlargement of maps beyond the scale of mapping can causemisunderstanding of the detail of mapping and accuracy of soil lineplacement. The maps do not show the small areas of contrastingsoils that could have been shown at a more detailed scale.

Please rely on the bar scale on each map sheet for mapmeasurements.

Source of Map: Natural Resources Conservation ServiceWeb Soil Survey URL: http://websoilsurvey.nrcs.usda.govCoordinate System: Web Mercator (EPSG:3857)

Maps from the Web Soil Survey are based on the Web Mercatorprojection, which preserves direction and shape but distortsdistance and area. A projection that preserves area, such as theAlbers equal-area conic projection, should be used if more accuratecalculations of distance or area are required.

This product is generated from the USDA-NRCS certified data as ofthe version date(s) listed below.

Soil Survey Area: San Diego County Area, CaliforniaSurvey Area Data: Version 8, Sep 17, 2014

Soil map units are labeled (as space allows) for map scales 1:50,000or larger.

Date(s) aerial images were photographed: May 2, 2010—Jun 7,2012

The orthophoto or other base map on which the soil lines werecompiled and digitized probably differs from the backgroundimagery displayed on these maps. As a result, some minor shiftingof map unit boundaries may be evident.

Hydrologic Soil Group—San Diego County Area, California(Skyline)

Natural ResourcesConservation Service

Web Soil SurveyNational Cooperative Soil Survey

3/23/2015Page 2 of 5

Hydrologic Soil Group

Hydrologic Soil Group— Summary by Map Unit — San Diego County Area, California (CA638)

Map unit symbol Map unit name Rating Acres in AOI Percent of AOI

FxG Friant rocky fine sandyloam, 30 to 70 percentslopes

D 6.4 48.5%

PeC Placentia sandy loam, 2to 9 percent slopes,warm MAAT, MLRA 19

C 0.0 0.2%

PfC Placentia sandy loam,thick surface, 2 to 9percent slo pes

D 1.2 9.0%

VaB Visalia sandy loam, 2 to5 percent slopes

A 5.6 42.3%

Totals for Area of Interest 13.3 100.0%

Hydrologic Soil Group—San Diego County Area, California Skyline

Natural ResourcesConservation Service

Web Soil SurveyNational Cooperative Soil Survey

3/23/2015Page 3 of 5

Description

Hydrologic soil groups are based on estimates of runoff potential. Soils areassigned to one of four groups according to the rate of water infiltration when thesoils are not protected by vegetation, are thoroughly wet, and receive precipitationfrom long-duration storms.

The soils in the United States are assigned to four groups (A, B, C, and D) andthree dual classes (A/D, B/D, and C/D). The groups are defined as follows:

Group A. Soils having a high infiltration rate (low runoff potential) when thoroughlywet. These consist mainly of deep, well drained to excessively drained sands orgravelly sands. These soils have a high rate of water transmission.

Group B. Soils having a moderate infiltration rate when thoroughly wet. Theseconsist chiefly of moderately deep or deep, moderately well drained or well drainedsoils that have moderately fine texture to moderately coarse texture. These soilshave a moderate rate of water transmission.

Group C. Soils having a slow infiltration rate when thoroughly wet. These consistchiefly of soils having a layer that impedes the downward movement of water orsoils of moderately fine texture or fine texture. These soils have a slow rate of watertransmission.

Group D. Soils having a very slow infiltration rate (high runoff potential) whenthoroughly wet. These consist chiefly of clays that have a high shrink-swellpotential, soils that have a high water table, soils that have a claypan or clay layerat or near the surface, and soils that are shallow over nearly impervious material.These soils have a very slow rate of water transmission.

If a soil is assigned to a dual hydrologic group (A/D, B/D, or C/D), the first letter isfor drained areas and the second is for undrained areas. Only the soils that in theirnatural condition are in group D are assigned to dual classes.

Rating Options

Aggregation Method: Dominant Condition

Hydrologic Soil Group—San Diego County Area, California Skyline

Natural ResourcesConservation Service

Web Soil SurveyNational Cooperative Soil Survey

3/23/2015Page 4 of 5

Aggregation is the process by which a set of component attribute values is reducedto a single value that represents the map unit as a whole.

A map unit is typically composed of one or more "components". A component iseither some type of soil or some nonsoil entity, e.g., rock outcrop. For the attributebeing aggregated, the first step of the aggregation process is to derive one attributevalue for each of a map unit's components. From this set of component attributes,the next step of the aggregation process derives a single value that represents themap unit as a whole. Once a single value for each map unit is derived, a thematicmap for soil map units can be rendered. Aggregation must be done because, onany soil map, map units are delineated but components are not.

For each of a map unit's components, a corresponding percent composition isrecorded. A percent composition of 60 indicates that the corresponding componenttypically makes up approximately 60% of the map unit. Percent composition is acritical factor in some, but not all, aggregation methods.

The aggregation method "Dominant Condition" first groups like attribute values forthe components in a map unit. For each group, percent composition is set to thesum of the percent composition of all components participating in that group. Thesegroups now represent "conditions" rather than components. The attribute valueassociated with the group with the highest cumulative percent composition isreturned. If more than one group shares the highest cumulative percentcomposition, the corresponding "tie-break" rule determines which value should bereturned. The "tie-break" rule indicates whether the lower or higher group valueshould be returned in the case of a percent composition tie. The result returned bythis aggregation method represents the dominant condition throughout the map unitonly when no tie has occurred.

Component Percent Cutoff: None Specified

Components whose percent composition is below the cutoff value will not beconsidered. If no cutoff value is specified, all components in the database will beconsidered. The data for some contrasting soils of minor extent may not be in thedatabase, and therefore are not considered.

Tie-break Rule: Higher

The tie-break rule indicates which value should be selected from a set of multiplecandidate values, or which value should be selected in the event of a percentcomposition tie.

Hydrologic Soil Group—San Diego County Area, California Skyline

Natural ResourcesConservation Service

Web Soil SurveyNational Cooperative Soil Survey

3/23/2015Page 5 of 5

GEOTECHNICAL INVESTIGATION PROPOSED SKYLINE RETIREMENT CENTER

NORTHWEST OF 11330 CAMPO ROAD LA MESA, CALIFORNIA 91941

PREPARED FOR:

SKYLINE WESLEYAN CHURCH ATTENTION: MR. DANIEL GRANT

11330 CAMPO ROAD LA MESA, CALIFORNIA 91941

PREPARED BY:

CONSTRUCTION TESTING & ENGINEERING, INC. 1441 MONTIEL ROAD, SUITE 115 ESCONDIDO, CALIFORNIA 92026

CTE JOB NO. 10-13295G OCTOBER 3, 2016

X

No, calculated infiltration rates for all three proposed basins were less than 0.5 inches per hour.Review the CTE document "Preliminary Geotechnical Report, Proposed Skyline RetirementCenter" dated October 3, 2016 for subsurface conditions, applicable maps and cross sections, andexploration logs. Appendix E of the Preliminary Geotechnical Report provides percolation ratesand infiltration rate calculations.

X

Infiltrate from proposed basins is anticipate to move downslope to the southwest where majorelectrical utilities such as electrical, cable service, and natural gas are located. Infiltrate over timecould impact these infrastructure facilities. As such, the sidewalls of the basin should be lined at aminimum of three feet or the depth of the deepest utility or foundation excavation within 100 feetof basin to minimize such potential adverse impacts. The basin bottom should remain unlined.

X

Calculated infiltration is less than 0.5 inches per hour. Groundwater is anticipated to be deeperthan at least 10 feet below the bottom of planned basins bottoms based upon test borings placedwithin 50 feet of the basins (see the Preliminary Geotechnical Report dated October 3, 2016 forboring logs). The site and up-gradient properties are not known contaminated sites according toGeotracker, a State of California on line resource for listings of regulated contaminated sites.

X

Calculated infiltration rates are less than 0.5 inches per hour. However, it is anticipated that anyamount of infiltration at the site would not increase the risk of changing the seasonality ofephemeral streams or increase the risk of contaminating surface waters than currently exists. Ablue line stream is approximately 150 feet southwest of the site across Campo Road. Potentialimpacts of the proposed basins to the blue line creek are low due to distance in combination withconstruction of the recommended lining of basin sidewalls to the maximum depth of adjacentutility trench and foundation excavations within 100 feet of the basins. The site and up-gradientproperties are not known contaminated sites according to Geotracker, a State of California on lineresource for listings of regulated contaminated sites. As such there is minimal potentialcontamination impacts to the blue line creek with installation of the proposed basins.

NO

X

On site calculated infiltration rates are less than 0.5 inches/hour. See Appendix E of the October 3,2016 Preliminary Geotechnical Report to which this Worksheet is attached. The recommendedinfiltration rates including a safety factor of 2.25 per Worksheet D.5-1 are:BMP Basin 1: 0.1018 inches/hourBMP Basin 2: 0.0896 inches/hourBMP Basin 3: 0.1400 inches/hourAs such there was infiltration in all three basins. The determination of "appreciable" is a functionof interpretation by the County of San Diego and project designers. CTE has stated "Yes" simplybecause infiltration has been recorded at the site.

X

See Question 2, Part 1. Potential adverse geotechnical impacts to geotechnical hazards may beminimized by installation of an impermeable liner on the sidewalls of the proposed BMP basins.Such impermeable liners should extend to the maximum depth of all utility infrastructure andfoundations excavations within 100 feet of the closest approximation to the BMP basins.

X

Groundwater is not present within at least 10 feet of the bottom of the BMP basins. The site andupslope properties are not known contaminated sites based upon reference to Geotracker, an online source for regulatory listed known contaminated properties.Mounding and lateral infiltrationof infiltrate is to be mitigated by recommended lining of BMP basin sidewalls with an impereablegeotextile. The impermeable liner should extend to the maximum depth of utility infrastructureand foundation excavations for these facilities within 100 feet of the closest approximation to aBMP basin.

X

To CTE's knowledge there is no downstream water rights violation as the site infiltrate isanticipated to remain within or relatively close to the property.

YES

1 0.25

1 0.25

1 0.25

1 0.25

1.0

1 0.5

1 0.25

2 0.5

1.25

2.25

See Below.

See Below

Reference CTE October 3, 2016 "Preliminary Geotechnical Report, Proposed Skyline RetirementCenter" to include Appendix E Percolation Test Results and Calculated Infiltration Rates. Lowest of twocalculated infiltration rates are: BMP Basin 1=0.1018 in/hr, BMP Basin 2=0.0896 in/hr, BMP Basin3=0.1400 in/hr.

ATTACHMENT 9 

Summary Files from the SWMM Model 


PRE_DEV  EPA STORM WATER MANAGEMENT MODEL - VERSION 5.0 (Build 5.0.022) -------------------------------------------------------------- ********************************************************* NOTE: The summary statistics displayed in this report are based on results found at every computational time step, not just on results from each reporting time step. ********************************************************* **************** Analysis Options **************** Flow Units ............... CFS Process Models: Rainfall/Runoff ........ YES Snowmelt ............... NO Groundwater ............ NO Flow Routing ........... NO Water Quality .......... NO Infiltration Method ...... GREEN_AMPT Starting Date ............ AUG-29-1951 00:00:00 Ending Date .............. MAR-29-2008 00:00:00 Antecedent Dry Days ...... 0.0 Report Time Step ......... 01:00:00 Wet Time Step ............ 00:15:00 Dry Time Step ............ 04:00:00 ************************** Volume Depth Runoff Quantity Continuity acre-feet inches ************************** --------- ------- Total Precipitation ...... 437.920 591.650 Evaporation Loss ......... 9.958 13.454 Infiltration Loss ........ 398.914 538.952 Surface Runoff ........... 35.069 47.379 Final Surface Storage .... 0.000 0.000 Continuity Error (%) ..... -1.375 ************************** Volume Volume Flow Routing Continuity acre-feet 10^6 gal ************************** --------- --------- Dry Weather Inflow ....... 0.000 0.000 Wet Weather Inflow ....... 35.069 11.428 Groundwater Inflow ....... 0.000 0.000 RDII Inflow .............. 0.000 0.000 External Inflow .......... 0.000 0.000 External Outflow ......... 35.069 11.428 Internal Outflow ......... 0.000 0.000 Storage Losses ........... 0.000 0.000 Initial Stored Volume .... 0.000 0.000 Final Stored Volume ...... 0.000 0.000 Continuity Error (%) ..... 0.000 *************************** Subcatchment Runoff Summary *************************** -------------------------------------------------------------------------------------------------------- Total Total Total Total Total Total Peak Runoff Precip Runon Evap Infil Runoff Runoff Runoff Coeff Subcatchment in in in in in 10^6 gal CFS -------------------------------------------------------------------------------------------------------- 1.1-A 591.65 0.00 0.36 589.16 2.65 0.29 1.88 0.004

PRE_DEV  1.1-D 591.65 0.00 26.62 488.42 92.42 11.09 3.17 0.156 OFFSITE-A 591.65 0.00 0.38 589.89 1.58 0.02 0.15 0.003 2 591.65 0.00 26.47 485.43 98.79 0.03 0.01 0.167 Analysis begun on: Fri Sep 15 10:09:30 2017 Analysis ended on: Fri Sep 15 10:09:45 2017 Total elapsed time: 00:00:15 

POST_DEV 

EPA STORM WATER MANAGEMENT MODEL - VERSION 5.0 (Build 5.0.022) -------------------------------------------------------------- ********************************************************* NOTE: The summary statistics displayed in this report are based on results found at every computational time step, not just on results from each reporting time step. ********************************************************* **************** Analysis Options **************** Flow Units ............... CFS Process Models: Rainfall/Runoff ........ YES Snowmelt ............... NO Groundwater ............ NO Flow Routing ........... YES Ponding Allowed ........ NO Water Quality .......... NO Infiltration Method ...... GREEN_AMPT Flow Routing Method ...... KINWAVE Starting Date ............ AUG-29-1951 00:00:00 Ending Date .............. MAR-29-2008 00:00:00 Antecedent Dry Days ...... 0.0 Report Time Step ......... 01:00:00 Wet Time Step ............ 00:15:00 Dry Time Step ............ 04:00:00 Routing Time Step ........ 60.00 sec WARNING 04: minimum elevation drop used for Conduit BYPASS-1 WARNING 04: minimum elevation drop used for Conduit U-DRAIN-1 WARNING 04: minimum elevation drop used for Conduit U-DRAIN-2 WARNING 04: minimum elevation drop used for Conduit BYPASS-2 WARNING 04: minimum elevation drop used for Conduit U-DRAIN-3 WARNING 04: minimum elevation drop used for Conduit BYPASS-3 ************************** Volume Depth Runoff Quantity Continuity acre-feet inches ************************** --------- ------- Total Precipitation ...... 438.175 591.650 Evaporation Loss ......... 53.699 72.508 Infiltration Loss ........ 266.988 360.502 Surface Runoff ........... 123.845 167.223 Final Surface Storage .... 0.000 0.000 Continuity Error (%) ..... -1.451 ************************** Volume Volume Flow Routing Continuity acre-feet 10^6 gal ************************** --------- --------- Dry Weather Inflow ....... 0.000 0.000 Wet Weather Inflow ....... 123.716 40.315 Groundwater Inflow ....... 0.000 0.000
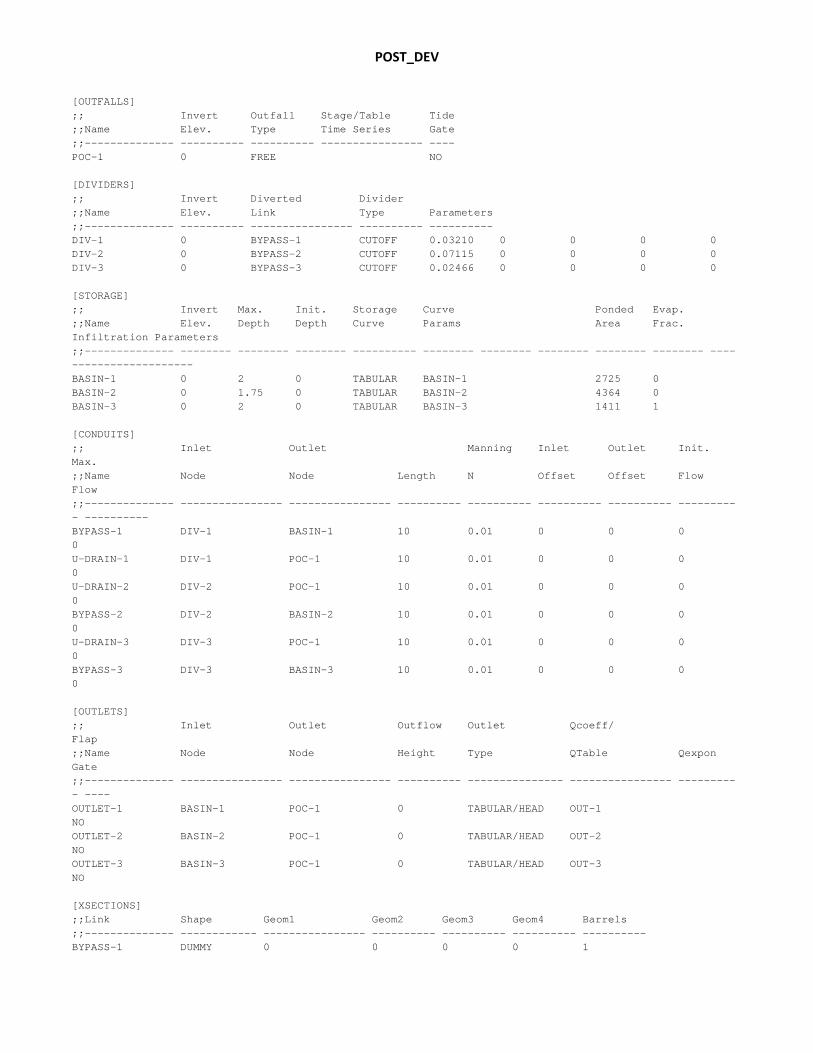
POST_DEV 

RDII Inflow .............. 0.000 0.000 External Inflow .......... 0.000 0.000 External Outflow ......... 123.680 40.303 Internal Outflow ......... 0.000 0.000 Storage Losses ........... 0.014 0.004 Initial Stored Volume .... 0.000 0.000 Final Stored Volume ...... 0.000 0.000 Continuity Error (%) ..... 0.018 ******************************** Highest Flow Instability Indexes ******************************** All links are stable. ************************* Routing Time Step Summary ************************* Minimum Time Step : 60.00 sec Average Time Step : 60.00 sec Maximum Time Step : 60.00 sec Percent in Steady State : 0.00 Average Iterations per Step : 1.00 *************************** Subcatchment Runoff Summary *************************** -------------------------------------------------------------------------------------------------------- Total Total Total Total Total Total Peak Runoff Precip Runon Evap Infil Runoff Runoff Runoff Coeff Subcatchment in in in in in 10^6 gal CFS -------------------------------------------------------------------------------------------------------- 1-1-D 591.65 0.00 50.17 306.64 246.15 5.94 0.66 0.416 1-1-A 591.65 0.00 48.01 324.06 226.46 7.86 0.82 0.383 1-2-A 591.65 0.00 83.83 133.27 384.82 16.72 1.21 0.650 1-2-D 591.65 0.00 74.26 178.69 350.73 17.60 1.45 0.593 1-3-A 591.65 0.00 106.63 0.00 498.86 1.44 0.09 0.843 1-3-D 591.65 0.00 61.79 242.92 299.41 9.67 0.91 0.506 BR-1 591.65 14665.13 975.65 4284.55 10013.60 9.42 1.49 0.656 BR-2 591.65 12615.86 972.47 4121.48 8110.93 22.06 2.59 0.614 BR-3 591.65 12631.22 965.59 5051.35 7116.38 6.25 0.98 0.538 1-1-D-BYPASS 591.65 0.00 18.53 482.28 98.98 0.98 0.26 0.167 1-1-A-BYPASS 591.65 0.00 0.36 588.75 3.22 0.09 0.49 0.005

POST_DEV 

OFFSITE-A 591.65 0.00 31.19 425.33 138.47 1.38 0.21 0.234 OFFSITE-D 591.65 0.00 107.21 0.00 497.81 0.16 0.01 0.841 *********************** LID Performance Summary *********************** ------------------------------------------------------------------------------------------------------------------ Total Evap Infil Surface Drain Init. Final Pcnt. Inflow Loss Loss Outflow Outflow Storage Storage Error Subcatchment LID Control in in in in in in in ------------------------------------------------------------------------------------------------------------------ BR-1 BR-1 15256.78 975.63 4284.48 2718.49 7294.94 0.00 0.00 -0.11 BR-2 BR-2 13207.51 972.47 4121.48 1370.10 6740.83 0.00 0.00 0.02 BR-3 BR-3 13222.87 965.65 5051.67 2141.37 4975.46 0.00 0.00 0.67 ****************** Node Depth Summary ****************** --------------------------------------------------------------------- Average Maximum Maximum Time of Max Depth Depth HGL Occurrence Node Type Feet Feet Feet days hr:min --------------------------------------------------------------------- POC-1 OUTFALL 0.00 0.00 0.00 0 00:00 DIV-1 DIVIDER 0.00 0.00 0.00 0 00:00 DIV-2 DIVIDER 0.00 0.00 0.00 0 00:00 DIV-3 DIVIDER 0.00 0.00 0.00 0 00:00 BASIN-1 STORAGE 0.00 1.10 1.10 16970 17:12 BASIN-2 STORAGE 0.00 0.52 0.52 16970 17:18 BASIN-3 STORAGE 0.00 0.92 0.92 16970 17:23 ******************* Node Inflow Summary ******************* ------------------------------------------------------------------------------------- Maximum Maximum Lateral Total Lateral Total Time of Max Inflow Inflow Inflow Inflow Occurrence Volume Volume Node Type CFS CFS days hr:min 10^6 gal 10^6 gal ------------------------------------------------------------------------------------- POC-1 OUTFALL 0.97 5.27 16970 17:00 2.616 40.300 DIV-1 DIVIDER 1.49 1.49 16970 17:00 9.406 9.406 DIV-2 DIVIDER 2.59 2.59 16970 17:00 22.037 22.037 DIV-3 DIVIDER 0.98 0.98 16970 17:00 6.253 6.253 BASIN-1 STORAGE 0.00 1.46 16970 17:00 0.000 2.508 BASIN-2 STORAGE 0.00 2.52 16970 17:00 0.000 3.847 BASIN-3 STORAGE 0.00 0.96 16970 17:00 0.000 1.835

POST_DEV 

********************** Node Surcharge Summary ********************** Surcharging occurs when water rises above the top of the highest conduit. --------------------------------------------------------------------- Max. Height Min. Depth Hours Above Crown Below Rim Node Type Surcharged Feet Feet --------------------------------------------------------------------- DIV-1 DIVIDER 496008.02 0.000 0.000 DIV-2 DIVIDER 496008.02 0.000 0.000 DIV-3 DIVIDER 496008.02 0.000 0.000 BASIN-1 STORAGE 496008.02 1.099 0.901 BASIN-2 STORAGE 496008.02 0.524 1.226 BASIN-3 STORAGE 496008.02 0.922 1.078 ********************* Node Flooding Summary ********************* No nodes were flooded. ********************** Storage Volume Summary ********************** -------------------------------------------------------------------------------------------- Average Avg E&I Maximum Max Time of Max Maximum Volume Pcnt Pcnt Volume Pcnt Occurrence Outflow Storage Unit 1000 ft3 Full Loss 1000 ft3 Full days hr:min CFS -------------------------------------------------------------------------------------------- BASIN-1 0.002 0 0 2.067 53 16970 17:11 1.45 BASIN-2 0.001 0 0 2.289 30 16970 17:17 2.32 BASIN-3 0.000 0 0 1.302 46 16970 17:22 0.75 *********************** Outfall Loading Summary *********************** ----------------------------------------------------------- Flow Avg. Max. Total Freq. Flow Flow Volume Outfall Node Pcnt. CFS CFS 10^6 gal ----------------------------------------------------------- POC-1 3.57 0.08 5.27 40.300 ----------------------------------------------------------- System 3.57 0.08 5.27 40.300 ******************** Link Flow Summary ******************** ----------------------------------------------------------------------------- Maximum Time of Max Maximum Max/ Max/ |Flow| Occurrence |Veloc| Full Full

POST_DEV 

Link Type CFS days hr:min ft/sec Flow Depth ----------------------------------------------------------------------------- BYPASS-1 DUMMY 1.46 16970 17:00 U-DRAIN-1 DUMMY 0.03 123 09:30 U-DRAIN-2 DUMMY 0.07 123 09:59 BYPASS-2 DUMMY 2.52 16970 17:00 U-DRAIN-3 DUMMY 0.02 123 09:40 BYPASS-3 DUMMY 0.96 16970 17:00 OUTLET-1 DUMMY 1.45 16970 17:12 OUTLET-2 DUMMY 2.32 16970 17:18 OUTLET-3 DUMMY 0.75 16970 17:23 ************************* Conduit Surcharge Summary ************************* ---------------------------------------------------------------------------- Hours Hours --------- Hours Full -------- Above Full Capacity Conduit Both Ends Upstream Dnstream Normal Flow Limited ---------------------------------------------------------------------------- BYPASS-1 0.01 0.01 0.01 496008.02 0.01 U-DRAIN-1 0.01 0.01 0.01 496008.02 0.01 U-DRAIN-2 0.01 0.01 0.01 496008.02 0.01 BYPASS-2 0.01 0.01 0.01 496008.02 0.01 U-DRAIN-3 0.01 0.01 0.01 496008.02 0.01 BYPASS-3 0.01 0.01 0.01 496008.02 0.01 Analysis begun on: Fri Sep 15 14:20:38 2017 Analysis ended on: Fri Sep 15 14:21:28 2017 Total elapsed time: 00:00:50 


Recommended