APPENDIX A Technical Memorandum TM-82-9 CONCORD WATERSHED 2001 DWM WATER QUALITY MONITORING DATA February 2005 DWM Control Number CN 130.0 Commonwealth of Massachusetts Executive Office of Environmental Affairs Ellen Roy Herzfelder, Secretary Massachusetts Department of Environmental Protection Robert W. Golledge, Jr., Commissioner Bureau of Resource Protection SuAsCo Watershed 2001 Water Quality Assessment Report Appendix A A1 82wqar.doc DWM CN 92.0
Transcript
APPENDIX A
Technical Memorandum
TM-82-9
CONCORD WATERSHED 2001DWM WATER QUALITY MONITORING DATA
February 2005
DWM Control Number CN 130.0
Commonwealth of MassachusettsExecutive Office of Environmental Affairs
Ellen Roy Herzfelder, SecretaryMassachusetts Department of Environmental Protection
Robert W. Golledge, Jr., CommissionerBureau of Resource Protection
Cynthia Giles, Assistant CommissionerDivision of Watershed Management
Glenn Haas, Director
SuAsCo Watershed 2001 Water Quality Assessment Report Appendix A A182wqar.doc DWM CN 92.0
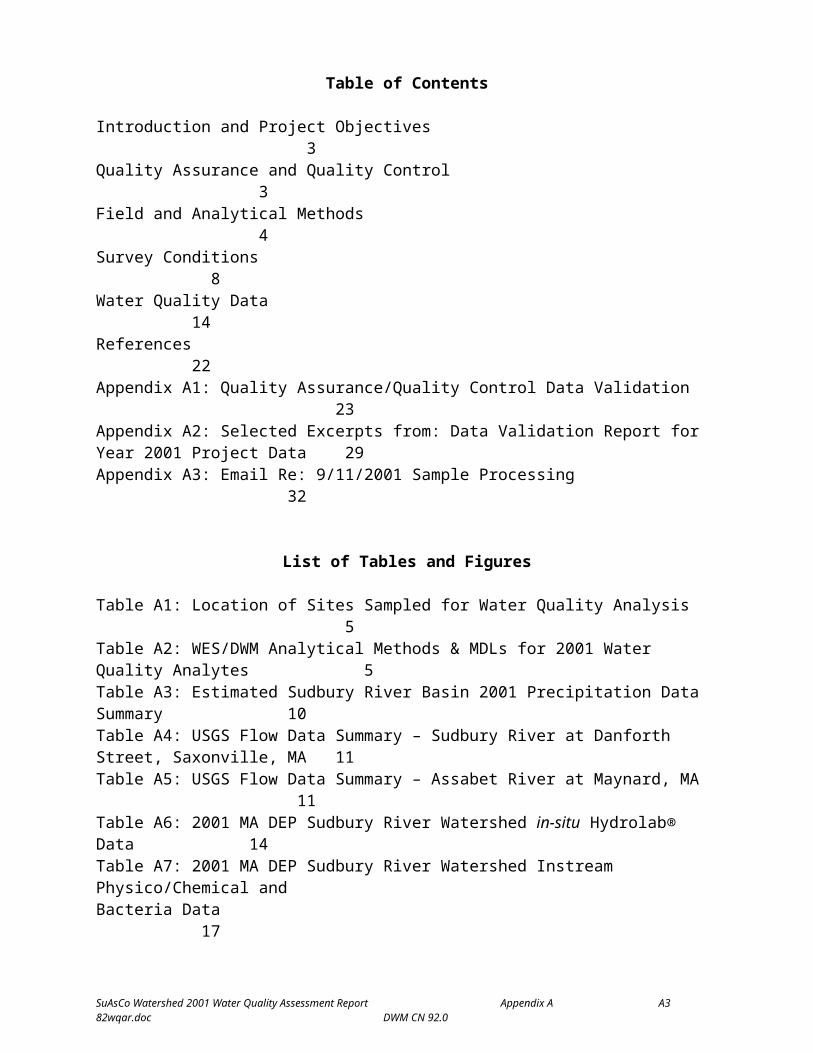
Table of Contents
Introduction and Project Objectives 3Quality Assurance and Quality Control 3Field and Analytical Methods 4Survey Conditions 8Water Quality Data 14References 22Appendix A1: Quality Assurance/Quality Control Data Validation 23Appendix A2: Selected Excerpts from: Data Validation Report for Year 2001 Project Data 29Appendix A3: Email Re: 9/11/2001 Sample Processing 32
List of Tables and Figures
Table A1: Location of Sites Sampled for Water Quality Analysis 5Table A2: WES/DWM Analytical Methods & MDLs for 2001 Water Quality Analytes 5Table A3: Estimated Sudbury River Basin 2001 Precipitation Data Summary 10Table A4: USGS Flow Data Summary – Sudbury River at Danforth Street, Saxonville, MA 11Table A5: USGS Flow Data Summary – Assabet River at Maynard, MA 11Table A6: 2001 MA DEP Sudbury River Watershed in-situ Hydrolab® Data 14Table A7: 2001 MA DEP Sudbury River Watershed Instream Physico/Chemical and Bacteria Data 17
Figure A1: Location of 2001 DEP/DWM Water Quality Sampling Stations and USGS Gaging Stations in the Sudbury River Watershed 7Figure A2: Sudbury River Flow – June 1- Sept. 12, 2001 – USGS Gage at Saxonville, MA 12Figure A3: Assabet River Flow – June 1- Sept. 12, 2001 – USGS Gage at Maynard, MA 13
SuAsCo Watershed 2001 Water Quality Assessment Report Appendix A A282wqar.doc DWM CN 92.0
INTRODUCTION AND PROJECT OBJECTIVES
The DWM 2001 water quality monitoring plan for the Concord watershed was developed by DWM in consultation with the former EOEA SuAsCo (Sudbury, Assabet, and Concord) Watershed Team, a coalition of governmental and non-governmental groups. Because of a separate data collection effort for the Assabet River by a consultant (ENSR, Inc.) during the years 1999 and 2000, and a projected similar effort for the Concord River in 2002-2003, the DWM 2001 watershed survey was confined to the Sudbury River. The monitoring strategy was guided primarily by the recommendations in the unpublished 1996 DWM water quality assessment report (MA DEP, 1996) and suggestions by members of the EOEA SuAsCo Watershed Team. Priority monitoring needs addressed by DWM included sampling for water chemistry, bacteria, macroinvertebrate biomonitoring, fish population studies, and fish toxics monitoring. This technical memorandum presents the DWM riverine water quality sampling component of the survey. Results of the other monitoring efforts mentioned above are described in separate DWM memoranda or reports. Additional water quality, bacterial, and biological data, especially for the Assabet River, are available from ENSR, Inc. (ENSR, 2001) and from the Organization for the Assabet River (OAR, 2001).
The 1996 DWM SuAsCo assessment report (MA DEP, 1996) identified several segments that lacked sufficient water quality data for evaluation and also flagged several sites with potential water quality problems that needed more water chemistry data for adequate assessment. Several sites were also identified for sampling in order to maintain an historical database to evaluate long-term trends. To address some of these water quality sampling needs, DWM conducted three water quality sampling surveys from July through September 2001 for water quality data and three surveys for bacteria data. The three water quality sampling surveys were pre-dawn surveys intended to capture dissolved oxygen minimums. Two of the bacteria surveys were conducted separately from the water quality surveys while the third one (September 11) was conducted as part of a water quality survey.
Samples were analyzed in the field using Hydrolab® Series 3 Multiprobes for dissolved oxygen and percent saturation of dissolved oxygen, temperature, pH, conductivity, and total dissolved solids. Samples for alkalinity, nutrients, hardness, turbidity, total suspended solids and bacteria (E. coli and fecal coliforms) were collected for analysis at the state’s analytical laboratory, the Wall Experiment Station (WES).
QUALITY ASSURANCE AND QUALITY CONTROL
A QAPP (MA DEP 2001d) was written for the 2001 Green Basins water quality sampling surveys in 2001. Procedures used were consistent with the prevailing DWM sampling protocols that are described in the Grab Collection Techniques for DWM Water Quality Sampling, Standard Operating Procedure (MA DEP 2001a). While no field audits were performed during the Sudbury River surveys in 2001, basket-drop and wade-in grab samples were assumed to be representative and to have been taken consistent with DWM SOPs (except as noted). For all water quality surveys, quality control samples (field blanks and sample splits) were taken at a minimum of one each per analyte per crew per survey. All water quality and bacteria samples were delivered to the WES laboratory for analysis.
DWM quality assurance and database management staff reviewed lab data reports and all Hydrolab® multi-probe data. The data were validated and finalized per data validation procedures outlined in the DWM Data Validation SOP (MA DEP, 2001c). In general, all water sample data were validated by reviewing QC sample results, analytical holding time compliance, QC sample frequency and related ancillary data/documentation (at a minimum). A complete summary of censoring and qualification decisions for all 2001 DWM data is provided in the DWM 2001 Data Validation Report (MA DEP, 2003).
Appendix A1 of this technical memorandum contains data censoring/qualification decisions for the 2001 Sudbury River data. Definitions for the data qualifiers are included in Appendix A2. This information was excerpted from the DWM 2001 Data Validation Report (MA DEP, 2003).
The samples collected on September 11 were delivered to WES laboratory in the early morning but extraordinary events precluded their expeditious handling and analysis for some of the analytes,
SuAsCo Watershed 2001 Water Quality Assessment Report Appendix A A382wqar.doc DWM CN 92.0
especially the bacteria samples; additionally, some significant field sampling errors occurred requiring eventual censoring or qualification of some of the data. In the case of the bacteria data, due to the emergency closing of WES because of the September 11 World Trade Center attack, all data was censored due to holding time violations. A number of water quality samples had noticeable amounts of solids which, given the less than 7Q10 flow, could only have come from a disturbance of the stream bottom while sampling. See Appendix A3 for a copy of an email detailing the laboratory handling of these samples. The subsequent QA/QC review resulted in censoring of the data for 82-0119 and the qualification (r) of 82-0111. See Sections 5.3 (1) and 5.2.2 in Appendix A1 of this memo for further details.
FIELD AND ANALYTICAL METHODS
DWM personnel performed in-situ water quality measurements at 15 stations for dissolved oxygen and dissolved oxygen percent saturation, temperature, pH, conductivity, and TDS with a Hydrolab® Series 3 Multiprobe. Water quality samples were collected for alkalinity, turbidity, nutrients, hardness, and total suspended solids for WES laboratory analysis at 14 stations (Table A1 and Figure A1) on July 10, July 31, and September 11, 2001. Fecal coliform and E. coli samples were collected at 22 stations on July 18 and July 30 during bacteria-only surveys, and on September 11 along with the in-situ and collected water samples mentioned in the preceding sentence. One station (SU13) sampled on July 10 was dropped for safety reasons and replaced with a nearby station (SU12) for the July 31 and September 10 surveys. Each survey crew also took a minimum of one ambient field blank and one field split sample during each survey for quality control purposes.
Procedures used for water sampling and sample handling are described in the Grab Collection Techniques for DWM Water Quality Sampling, Standard Operating Procedure (MA DEP, 2001a) and Hydrolab® Series 3 and 4 Multiprobes SOP (2001-02) (MA DEP 2001b). The Wall Experiment Station (WES), the Department’s analytical laboratory, supplied all sample bottles and field preservatives, which were prepared according to the WES Laboratory Quality Assurance Plan and Standard Operating Procedures (MA DEP 2001). Samples were transported on ice to WES where they were analyzed according to the WES’s Standard Operating Procedures (MA DEP 2001). The specific methods employed for each analyte are presented in Table A2.
Table A1. 2001 DEP-DWM Sudbury River Watershed survey. Location of sites sampled for water quality analysis on July 10, July 18, July 30, July 31, and September 11, 2001.
STREAM SAMPLE TYPE*
STATION(UNIQUE ID)
DESCRIPTOR(upstream side unless otherwise indicated)
Sudbury River 1, 2, 3 SU01 (W0832) downstream Fruit Street, Hopkinton/WestboroughSudbury River 1, 2 SU02 (W0834) Cedar Street, Hopkinton/SouthboroughSudbury River 1, 2, 3 SU03 (W0835) Rt. 85 (Cordaville Road) bridge, Hopkinton/SouthboroughSudbury River 1, 2, 3 SU04 (W0840) downstream Winter Street, FraminghamSudbury River 1 SU04A
(W0838)Rt 135 near Chestnut St, Ashland
Sudbury River 1, 2, 3 SU07 (W0696) Danforth Street, FraminghamSudbury River 1, 2, 3 SU09 (W0850) Pelham Island Road bridge, WaylandSudbury River 1, 2, 3 SU11 (W0848) Rt. 27 bridge, WaylandSudbury River 1, 2, 3 SU12 (W0847) Sherman Bridge Road bridge, Wayland/SudburySudbury River 2, 3 SU13 (W0855) Rt. 117 bridge, Concord/Lincoln (only sampled once)Sudbury River 1, 2, 3 SU15 (W0844) downstream Nashawtuc Road bridge, ConcordWhitehall Brook 1, 2, 3 WH01 (W0833) Fruit Street, HopkintonIndian Brook 1 IB01 (W0853) Cross St, AshlandIndian Brook 1 IB01A (W0836) downstream Indian Brook Rd, AshlandCold Spring Brook 1 CS01 (W0837) Chestnut St, AshlandEames Brook 1 EP01 (W0839) downstream of footpath @ end of Sherwin Terrace,
FraminghamUnnamed tributary**
1, 2, 3 CB01 (W0841) Outlet Lake Cochituate off foot bridge, Framingham
Unnamed tributary**
1, 2, 3 CB02 (W0842) School St/Rt 126, Saxonville
SuAsCo Watershed 2001 Water Quality Assessment Report Appendix A A482wqar.doc DWM CN 92.0
STREAM SAMPLE TYPE*
STATION(UNIQUE ID)
DESCRIPTOR(upstream side unless otherwise indicated)
Fecal Coliform SM 9222D Not defined; usu. 5 and 10 cfu/100ml NI
E. coli SM 9213D Not defined; usu. 5 and 10 cfu/100ml NI
* = “Methods for Chemical Analysis of Water and Wastes”, Environmental Protection Agency, Environmental Monitoring Systems Laboratory – Cincinnati (EMSL-CI), EPA-600/4-79-020, Revised March 1983 and 1979 where applicable.
** = Standard Methods, Examination of Water and Wastewater, 20th editionNA = Not ApplicableNI = No Information
SuAsCo Watershed 2001 Water Quality Assessment Report Appendix A A582wqar.doc DWM CN 92.0
#
#
$T
$T$T
$T$T$T
$T$T
$T$T
$T$T $T
$T$T
$T
$T $T $T
$T$T
$T
$T
SUDBURY
SOUTHBOROUGH
STOW
HUDSON
MARLBOROUGH
NORTHBOROUGH
WESTBOROUGH
HOPKINTON
ASHLAND
FRAMINGHAM
CONCORD
LINCOLN
WESTON
NATICK
SHERBORN
HOLLISTON
UPTON
#
01098530USGS gage
Assabet River
Concord River
WAYLAND
PB01
WB01
SU13
SU12
SU11
PI01SU09
AS01 MB01
SU15
SU07
CB02 CB01
SU04
EP01
SU04A
CS01IB01A
IB01
SU03
SU02
SU01
WH01
$TLegendWater Quality Stations
# USGS Stream Gages
River Segments
Town Boundaries
Watershed Outline
N
0 1 2 Miles
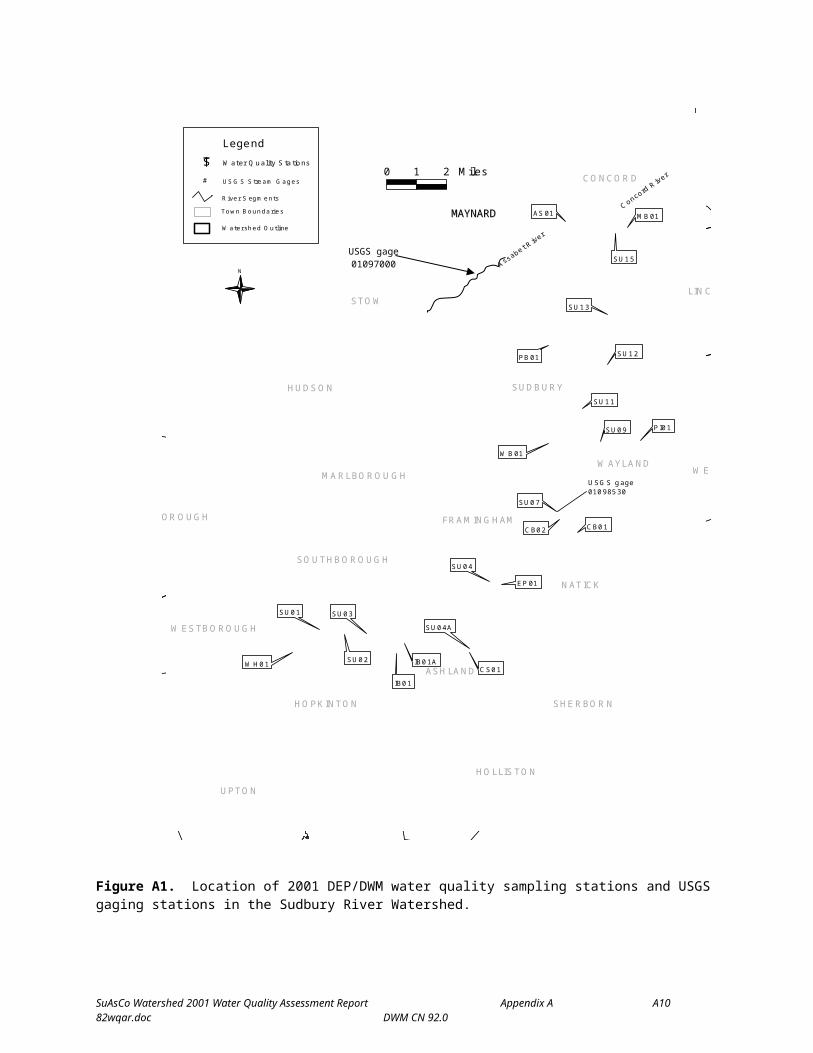
Figure A1. Location of 2001 DEP/DWM water quality sampling stations and USGS gaging stations in the Sudbury River Watershed.
SuAsCo Watershed 2001 Water Quality Assessment Report Appendix A A682wqar.doc DWM CN 92.0
USGS gage01097000
MAYNARDMAYNARD
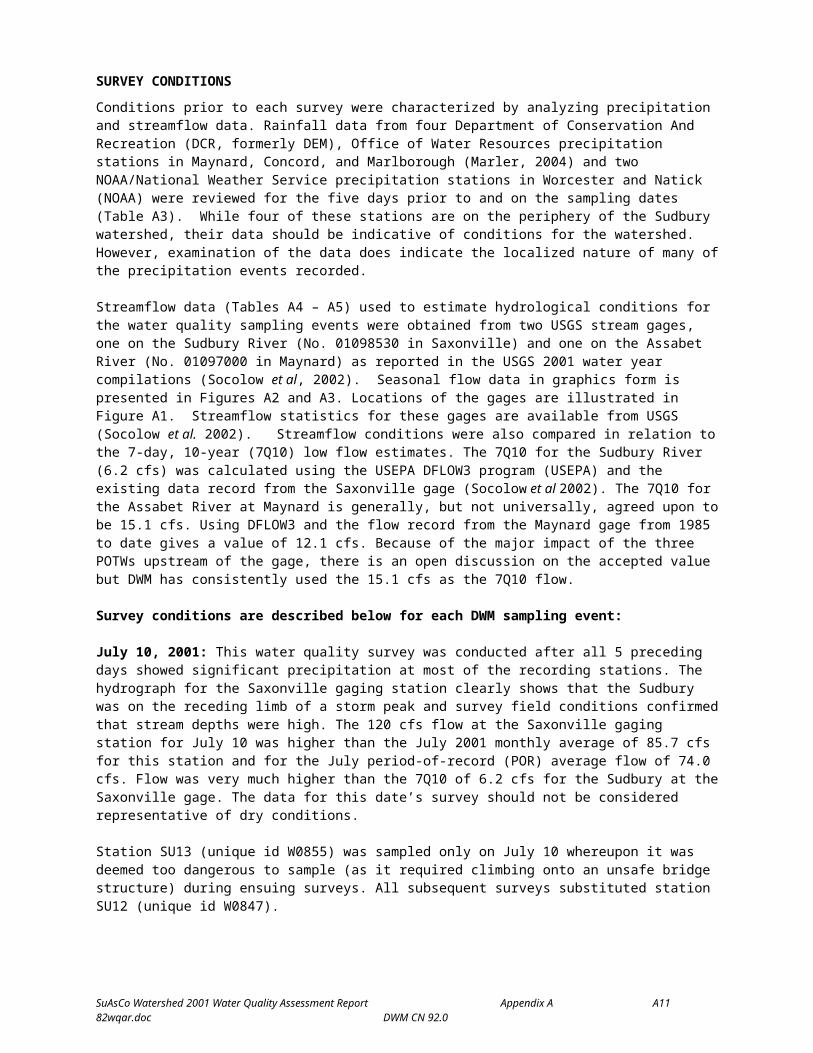
SURVEY CONDITIONSConditions prior to each survey were characterized by analyzing precipitation and streamflow data. Rainfall data from four Department of Conservation And Recreation (DCR, formerly DEM), Office of Water Resources precipitation stations in Maynard, Concord, and Marlborough (Marler, 2004) and two NOAA/National Weather Service precipitation stations in Worcester and Natick (NOAA) were reviewed for the five days prior to and on the sampling dates (Table A3). While four of these stations are on the periphery of the Sudbury watershed, their data should be indicative of conditions for the watershed. However, examination of the data does indicate the localized nature of many of the precipitation events recorded.
Streamflow data (Tables A4 – A5) used to estimate hydrological conditions for the water quality sampling events were obtained from two USGS stream gages, one on the Sudbury River (No. 01098530 in Saxonville) and one on the Assabet River (No. 01097000 in Maynard) as reported in the USGS 2001 water year compilations (Socolow et al, 2002). Seasonal flow data in graphics form is presented in Figures A2 and A3. Locations of the gages are illustrated in Figure A1. Streamflow statistics for these gages are available from USGS (Socolow et al. 2002). Streamflow conditions were also compared in relation to the 7-day, 10-year (7Q10) low flow estimates. The 7Q10 for the Sudbury River (6.2 cfs) was calculated using the USEPA DFLOW3 program (USEPA) and the existing data record from the Saxonville gage (Socolow et al 2002). The 7Q10 for the Assabet River at Maynard is generally, but not universally, agreed upon to be 15.1 cfs. Using DFLOW3 and the flow record from the Maynard gage from 1985 to date gives a value of 12.1 cfs. Because of the major impact of the three POTWs upstream of the gage, there is an open discussion on the accepted value but DWM has consistently used the 15.1 cfs as the 7Q10 flow.
Survey conditions are described below for each DWM sampling event:
July 10, 2001: This water quality survey was conducted after all 5 preceding days showed significant precipitation at most of the recording stations. The hydrograph for the Saxonville gaging station clearly shows that the Sudbury was on the receding limb of a storm peak and survey field conditions confirmed that stream depths were high. The 120 cfs flow at the Saxonville gaging station for July 10 was higher than the July 2001 monthly average of 85.7 cfs for this station and for the July period-of-record (POR) average flow of 74.0 cfs. Flow was very much higher than the 7Q10 of 6.2 cfs for the Sudbury at the Saxonville gage. The data for this date’s survey should not be considered representative of dry conditions.
Station SU13 (unique id W0855) was sampled only on July 10 whereupon it was deemed too dangerous to sample (as it required climbing onto an unsafe bridge structure) during ensuing surveys. All subsequent surveys substituted station SU12 (unique id W0847).
July 18, 2001: This bacteria-only survey was conducted at a flow (47.0 cfs) below both the 2001 monthly average (85.7 cfs) and the July POR flow (74.0 cfs) for the Saxonville gage. While there was recordable precipitation at a number of the recording stations the Saxonville hydrograph did not show any increase in flow which may have been due to scattered showers rather than regional rainfall. Based on the hydrograph, the data for this date’s survey is possibly representative of dry conditions.
July 30, 2001: This bacteria-only survey was conducted at a flow (7.4 cfs) just above the 7Q10 flow of 6.2 cfs at the Saxonville gage. While a number of the precipitation stations recorded rain 3 or more days prior to the sampling date, both the general extended dry period prior to July 30 and a hydrograph minimally responsive to the precipitation indicates that this date’s survey is most likely representative of not only dry but also 7Q10 conditions.
July 31, 2001: This water quality survey, as was the July 30 survey above, was conducted during and following essentially dry weather. Flow at the Saxonville gage was 7.0 cfs, just slightly above the 6.2 cfs 7Q10 flow. The sampling date was preceded by 3 days of no recorded rainfall and the rainfall recorded in Maynard was probably local with no effect on the Sudbury River. Data collected during this survey are interpreted as being representative of both dry weather and 7Q10 conditions.
SuAsCo Watershed 2001 Water Quality Assessment Report Appendix A A782wqar.doc DWM CN 92.0
September 11, 2001: Data collected during this survey are being interpreted as representative of dry weather and below 7Q10 conditions. Flow at the Saxonville gage was 4.3 cfs. Unfortunately, some of the data had to be censored or qualified due to field sampling errors and/or to holding time issues. See discussion under “Quality Assurance and Quality Control”.
SuAsCo Watershed 2001 Water Quality Assessment Report Appendix A A882wqar.doc DWM CN 92.0
Table A3: Estimated Sudbury River Basin 2001 Precipitation Data Summarybased on DCR (DEM) and NOAA data1
(reported in inches of rainfall)
Survey Dates 5 Days Prior 4 Days Prior 3 Days Prior 2 Days Prior 1 Days Prior Survey Date
Wor Nat May Con Mar Wor Nat May Con Mar Wor Nat May Con Mar Wor Nat May Con Mar Wor Nat May Con Mar Wor Nat May Con Mar
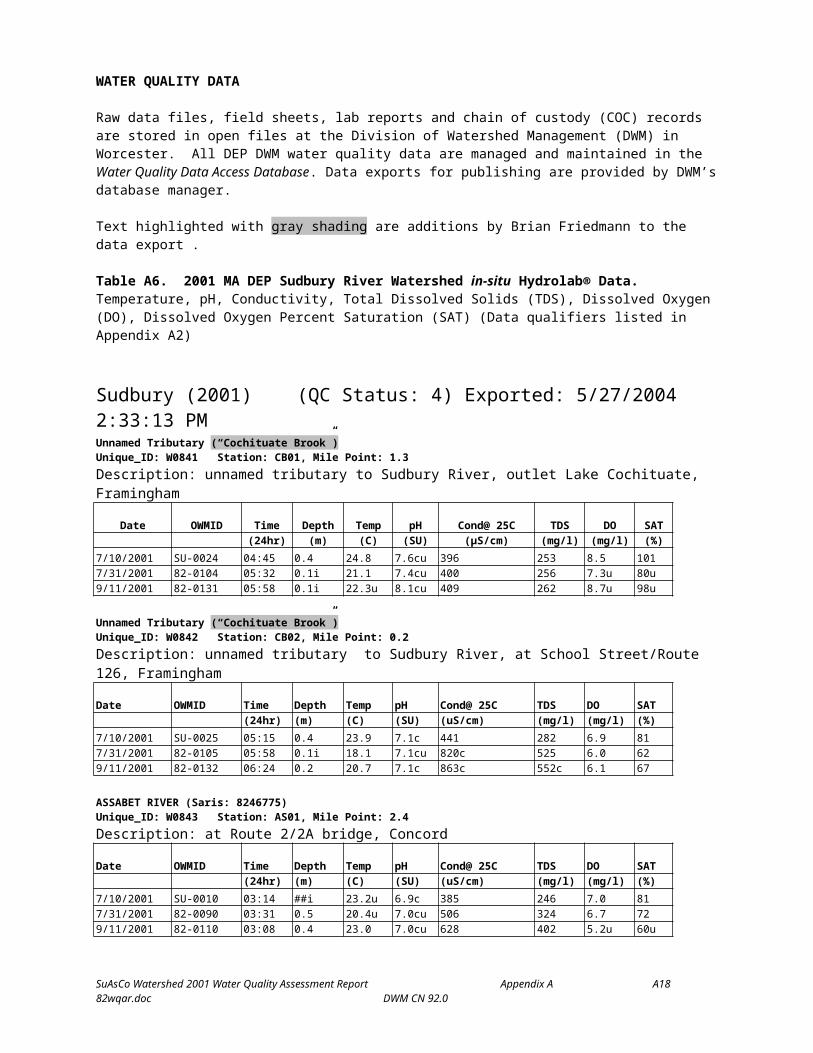
Raw data files, field sheets, lab reports and chain of custody (COC) records are stored in open files at the Division of Watershed Management (DWM) in Worcester. All DEP DWM water quality data are managed and maintained in the Water Quality Data Access Database. Data exports for publishing are provided by DWM’s database manager.
Text highlighted with gray shading are additions by Brian Friedmann to the data export .
Table A6. 2001 MA DEP Sudbury River Watershed in-situ Hydrolab® Data.Temperature, pH, Conductivity, Total Dissolved Solids (TDS), Dissolved Oxygen (DO), Dissolved Oxygen Percent Saturation (SAT) (Data qualifiers listed in Appendix A2)
Sudbury (2001) (QC Status: 4) Exported: 5/27/2004 2:33:13 PMUnnamed Tributary (“Cochituate Brook”)Unique_ID: W0841 Station: CB01, Mile Point: 1.3Description: unnamed tributary to Sudbury River, outlet Lake Cochituate, Framingham
Date OWMID Time Depth Temp pH Cond@ 25C TDS DO SAT(24hr) (m) (C) (SU) (µS/cm) (mg/l) (mg/l) (%)
Unnamed Tributary (“Cochituate Brook”)Unique_ID: W0842 Station: CB02, Mile Point: 0.2Description: unnamed tributary to Sudbury River, at School Street/Route 126, Framingham
Date OWMID Time Depth Temp pH Cond@ 25C TDS DO SAT(24hr) (m) (C) (SU) (uS/cm) (mg/l) (mg/l) (%)
SuAsCo Watershed 2001 Water Quality Assessment Report Appendix A A1382wqar.doc DWM CN 92.0
SUDBURY RIVER (Saris: 8247650)Unique_ID: W0834 Station: SU02, Mile Point: 30Description: at Cedar Street, Hopkinton/Southborough (locality of Southville)
Date OWMID Time Depth Temp pH Cond@ 25C TDS DO SAT(24hr) (m) (C) (SU) (uS/cm) (mg/l) (mg/l) (%)
SUDBURY RIVER (Saris: 8247650) {Sampled only once on 7/10; deemed too dangerous; substituted SU12 for ensuing surveys – BFF}Unique_ID: W0855 Station: SU13, Mile Point: 5Description: Route 117, Concord/Lincoln
Date OWMID Time Depth Temp pH Cond@ 25C TDS DO SAT(24hr) (m) (C) (SU) (uS/cm) (mg/l) (mg/l) (%)
SuAsCo Watershed 2001 Water Quality Assessment Report Appendix A A1582wqar.doc DWM CN 92.0
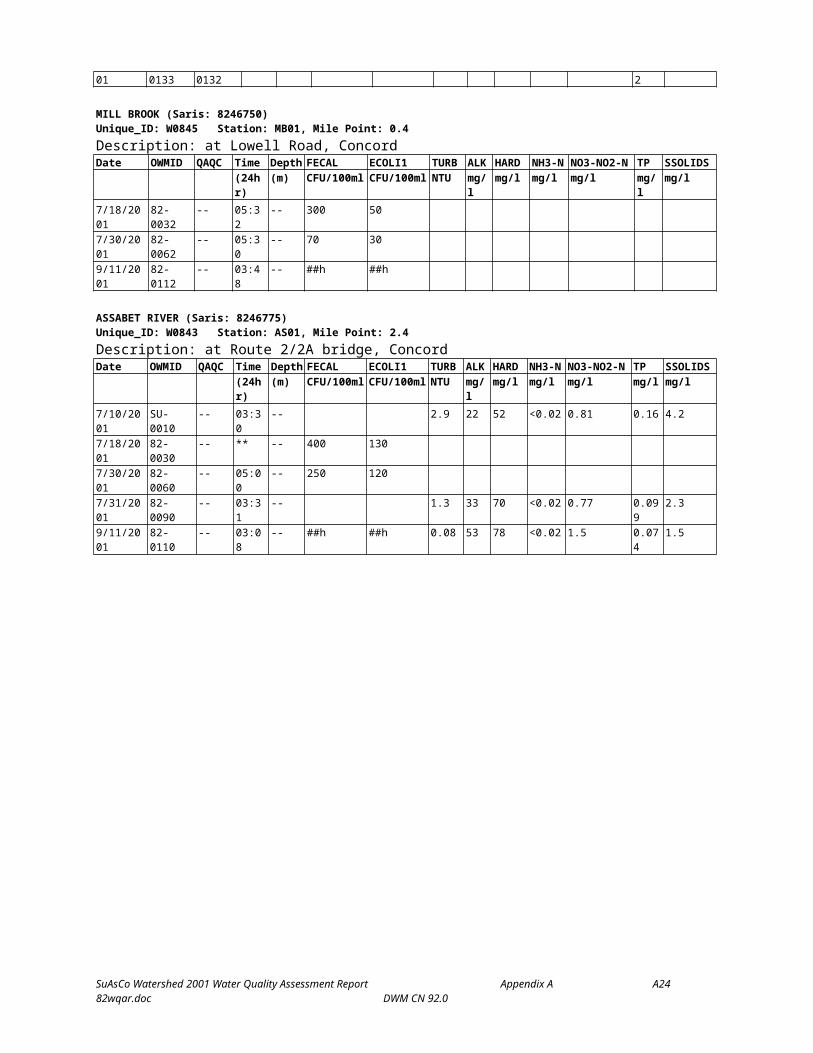
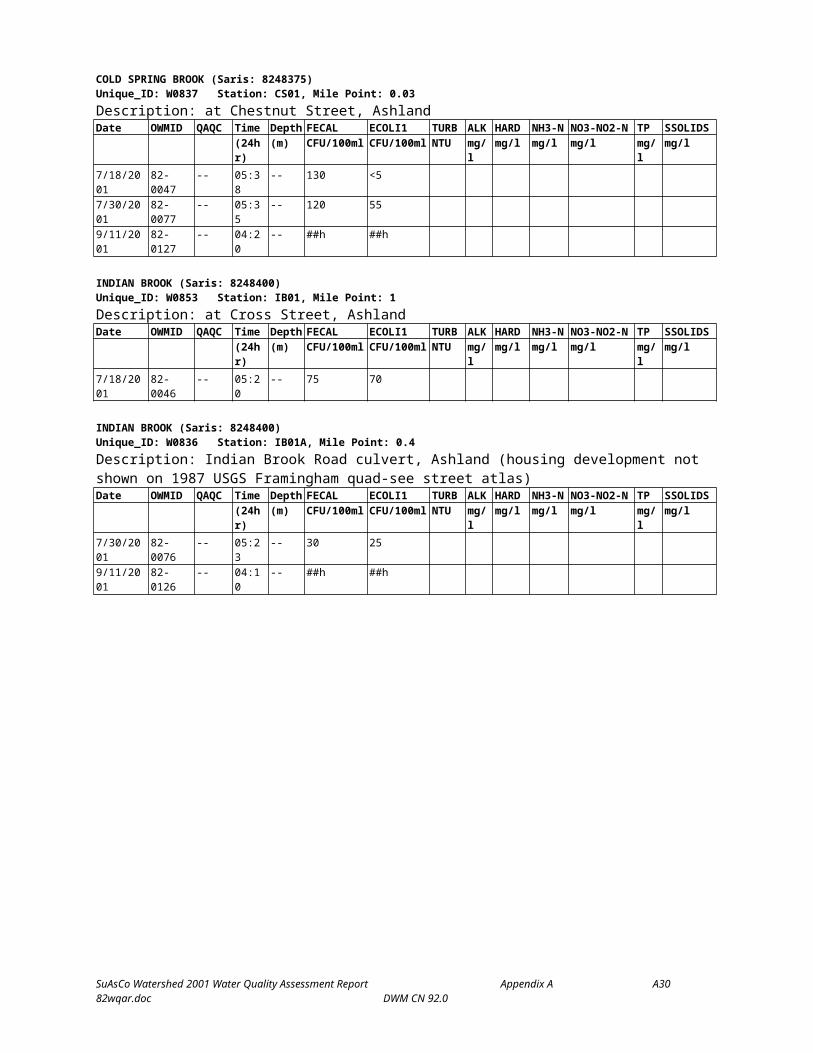
Table A7. 2001 MA DEP Sudbury River Watershed Instream Physico/Chemical and Bacteria Data.Alkalinity, Hardness, Total Suspended Solids (TSS), Turbidity, Ammonia Nitrogen, Nitrate-Nitrite Nitrogen, Total Phosphorus, E. coli, Fecal coliform (Data qualifiers listed in Appendix A2)
SUDBURY RIVER (Saris: 8247650)Unique_ID: W0834 Station: SU02, Mile Point: 30Description: at Cedar Street, Hopkinton/Southborough (locality of Southville)Date OWMID QAQC Time Depth FECAL ECOLI1 TURB ALK HARD NH3-N NO3-NO2-N TP SSOLIDS
SUDBURY RIVER (Saris: 8247650)Unique_ID: W0838 Station: SU04A, Mile Point: 25.1Description: at the Route 135 crossing upstream of Cold Spring Brook confluence, AshlandDate OWMID QAQC Time Depth FECAL ECOLI1 TURB ALK HARD NH3-N NO3-NO2-N TP SSOLIDS
INDIAN BROOK (Saris: 8248400)Unique_ID: W0836 Station: IB01A, Mile Point: 0.4Description: Indian Brook Road culvert, Ashland (housing development not shown on 1987 USGS Framingham quad-see street atlas)Date OWMID QAQC Time Depth FECAL ECOLI1 TURB ALK HARD NH3-N NO3-NO2-N TP SSOLIDS
SuAsCo Watershed 2001 Water Quality Assessment Report Appendix A A2282wqar.doc DWM CN 92.0
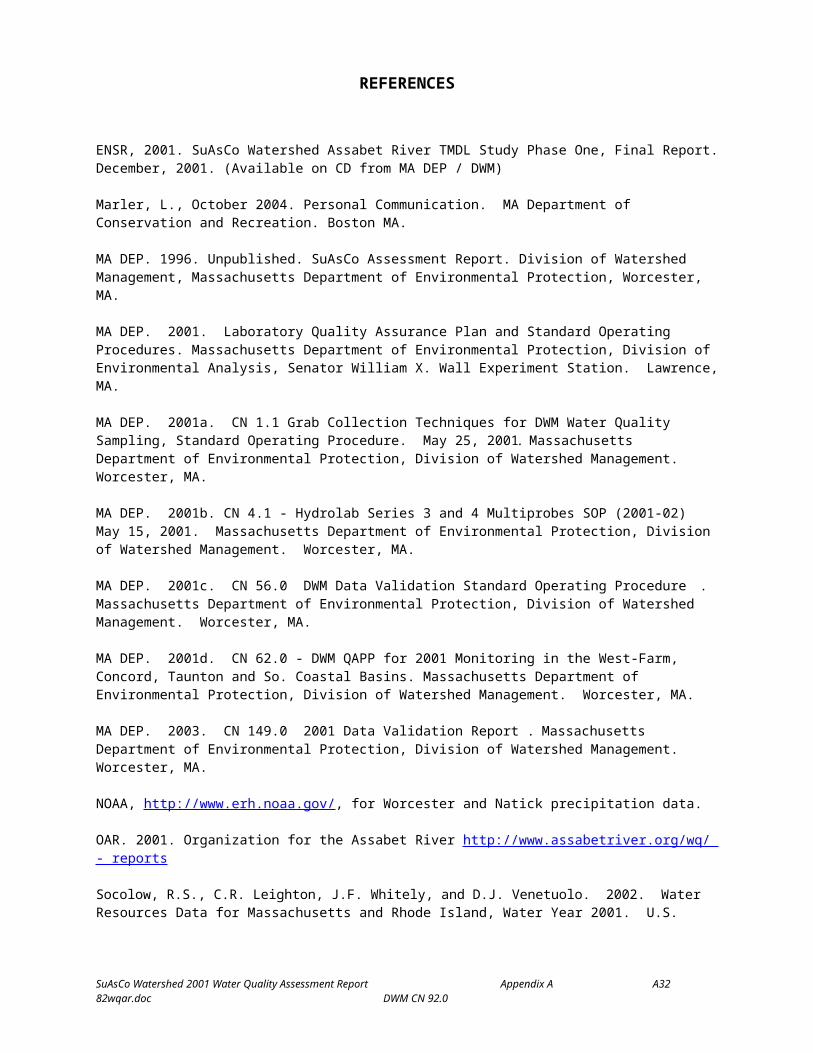
REFERENCES
ENSR, 2001. SuAsCo Watershed Assabet River TMDL Study Phase One, Final Report. December, 2001. (Available on CD from MA DEP / DWM)
Marler, L., October 2004. Personal Communication. MA Department of Conservation and Recreation. Boston MA.
MA DEP. 1996. Unpublished. SuAsCo Assessment Report. Division of Watershed Management, Massachusetts Department of Environmental Protection, Worcester, MA.
MA DEP. 2001. Laboratory Quality Assurance Plan and Standard Operating Procedures. Massachusetts Department of Environmental Protection, Division of Environmental Analysis, Senator William X. Wall Experiment Station. Lawrence, MA.
MA DEP. 2001a. CN 1.1 Grab Collection Techniques for DWM Water Quality Sampling, Standard Operating Procedure. May 25, 2001. Massachusetts Department of Environmental Protection, Division of Watershed Management. Worcester, MA.
MA DEP. 2001b. CN 4.1 - Hydrolab Series 3 and 4 Multiprobes SOP (2001-02) May 15, 2001. Massachusetts Department of Environmental Protection, Division of Watershed Management. Worcester, MA.
MA DEP. 2001c. CN 56.0 DWM Data Validation Standard Operating Procedure . Massachusetts Department of Environmental Protection, Division of Watershed Management. Worcester, MA.
MA DEP. 2001d. CN 62.0 - DWM QAPP for 2001 Monitoring in the West-Farm, Concord, Taunton and So. Coastal Basins. Massachusetts Department of Environmental Protection, Division of Watershed Management. Worcester, MA.
MA DEP. 2003. CN 149.0 2001 Data Validation Report . Massachusetts Department of Environmental Protection, Division of Watershed Management. Worcester, MA.
NOAA, http://www.erh.noaa.gov/, for Worcester and Natick precipitation data.
OAR. 2001. Organization for the Assabet River http://www.assabetriver.org/wq/ - reports
Socolow, R.S., C.R. Leighton, J.F. Whitely, and D.J. Venetuolo. 2002. Water Resources Data for Massachusetts and Rhode Island, Water Year 2001. U.S. Geological Survey Report MA-RI-01-1. Water Resources Division, Northborough, MA.
USEPA, DFLOW 3, Technical Guidance Manual for Performing Wasteload Allocations, Book VI - Design Conditions, Chapter 1 - Stream Design Flow for Steady-State Modeling, PB92-231178, http://epa.gov/waterscience/dflow/index.htm
SuAsCo Watershed 2001 Water Quality Assessment Report Appendix A A2382wqar.doc DWM CN 92.0
APPENDIX A1Quality Assurance/Quality Control Data Validation for the
Sudbury Watershed 2001 Water Quality Survey
Selected Excerpts from:Data Validation Report for Year 2001 Project Data (CN 149.0)
December, 2004
Department of Environmental ProtectionDivision of Watershed Management
5.0 2001 Discrete Water Sample Data
5.1 QA/QC Objectives and Criteria for 2001 Discrete Water Sample Data
The collection and analysis of discrete water samples in 2001 followed the DWM Standard Operating Procedure for Grab Sampling (CN# 1.1) and analyte-specific WES SOPs.
The grab sampling protocol outlines the use of new-for-2001 “basket samplers” in lieu of buckets (used by DWM in 2000) to collect samples from drop locations. Also, the taking of field replicates for quality control purposes differed from that performed in 2000. In 2000, large-volume samples were split into two samples to measure precision or repeatability. In 2001, most replicate samples were taken as separate, co-located (side-by-side), simultaneous field duplicates to estimate overall precision (including variation due to sampling technique). Using the following criteria, as well as other considerations and input from data reviewers, individual datum were either:
1) Accepted2) Accepted with qualification, or3) Censored
In cases where poor quality control (e.g., blank/cross contamination, lab accuracy) affected batched analyses or entire surveys, censoring/qualification decisions were applied to groups of samples (e.g., a specific crew’s samples, a specific survey’s samples or all samples from a specific batch analysis).
Criteria for acceptance of discrete water quality samples were as follows:
- For simplicity, samples that were “lost”, “missing”, “spilled” and “not analyzed” were ‘censored’ using the ‘m’ (method not followed) qualifier.
- Sampling/Analysis Holding Time: Each analyte has a standard holding time that has been established to ensure sample/analysis integrity. Refer to DWM Standard Operating Procedure CN# 1.1 for a complete listing. If the standard holding time was exceeded, this criterion is violated and the data may be censored, depending on the extent of exceedance. For minor exceedances (e.g., < than 20% of the holding time), the data is typically qualified (“h” for minor holding time violation).
- Quality Control Sample Frequency: At a minimum, one field blank and one replicate must be collected for every ten samples by any given sampling crew on any given date. If less than 10% blanks and replicates were collected, the data are typically qualified with “f”. If blanks were omitted and duplicates taken, typically no data are qualified, as long as there are no documented historical problems for the survey-specific samplers or station locations with regard to field contamination. If blanks were taken but duplicates were not, the data may be qualified with “f”. Typically, no censoring of data takes place for insufficient QC sample frequencies only.
SuAsCo Watershed 2001 Water Quality Assessment Report Appendix A A2482wqar.doc DWM CN 92.0
- Field Blanks: Field blanks were prepared at the DWM Worcester Laboratory. Reagent grade water was transported into the field in a sample container where it was transferred into a different sample container directly or via a sampling device (equipment blank) using the same methods as for its corresponding field sample (e.g., blank samples were preserved in the same way). All blanks were submitted to the WES laboratory “blind”. If the field blank results were greater than the MDL (indicating potential sampling error, airborne contaminants, dirty equipment, etc.), the data may be censored or qualified, depending on extent and other factors.
- Field Replicates: In 2001, field duplicate samples for rivers were taken as co-located, simultaneous duplicates. As a result, these duplicate results include any spatial, natural variability present between side-by-side samples (which should be minimal in most cases where site selection has accounted for uniform mixing). Duplicate lake samples were sequential and therefore also include any temporal variability.
Samples were submitted to WES laboratory “blind”. In order for this data quality criterion to be met, the results must generally be:
• <20% Relative Percent Difference (RPD) for method detection limits >1mg/L, or• <30% RPD for method detection limits <1mg/L.
or meet more specific criteria contained in a 2001 QAPP document. If the criteria are not met, the sample/duplicate data may be censored or qualified, depending on extent of exceedance and other factors. Arguably, very poor precision of field duplicate samples reflects poor reproducibility for entire surveys and/or analytical batch runs, and should result in censoring or qualification of the entire survey/batch data.
- Results of Field and/or Lab Audits and Miscellaneous Survey Information: If, based on the results of field evaluation of implementation of field sampling SOPs, samples are deemed to have been taken incorrectly or to not represent station conditions at the time of sampling, then individual or survey-based sample results may be qualified or censored. Likewise, the results of QC audits of lab(s) analytical accuracy (and precision) for specific parameters are evaluated. If results indicate poor accuracy or repeatability, batch run data may be qualified or censored. In addition, information from survey personnel regarding sample integrity and representativeness may lead to decisions to qualify or censor data. - Laboratory assessment of analytical precision and accuracy: The WES Laboratory is solely responsible for the administration of its Quality Assurance Program and Standard Operating Procedures. WES staff release discrete water sample data when their established QA/QC criteria have been met. When the following criteria cannot be met, data are qualified using appropriate qualifiers:
• Low Calibration Standards – Checks the stability of the instrument’s calibration curve; analyzes the accuracy of an instrument’s calibration within a 5% range.
• Reference Standards – Generally, a second source standard (a standard different from the calibration stock standard) that analyzes the method accuracy.
• Laboratory Reagent Blank/Method Blank (LRB) – Reagent grade water (de-ionized) extracted with every sample set used to ensure that the system is free of target analytes (< MDL) and to assess potential blank contamination.
• Duplicate Sample – Measures the precision (as Relative Percent Difference or RPD) of the analytical process. The acceptable laboratory %RPD range is typically 25%. For bacteria, duplicate data are evaluated based the range of logged values.
• Spike Sample (Laboratory Fortified Blank - LFB, Laboratory Fortified Matrix - LFM)– Measures the accuracy (% Recovery) of an analytical method. The acceptable laboratory % recovery range is typically between 80 – 120% for LFB samples and 70 –130% for LFM discrete water samples.
SuAsCo Watershed 2001 Water Quality Assessment Report Appendix A A2582wqar.doc DWM CN 92.0
5.2 Field and Lab Audit Results
Field Audits – (No water quality field audits were performed during the 2001 Sudbury surveys. – BFF) In 2001, nine field audits (total) were performed by DWM’s QC Analyst. Six of these were for water sample collection and multi-probe use. Specifically, these six audits were useful in:
- Reminding survey staff of the potential of using two separate multi-probe units when one crew is sampling fresh and salt waters (to ensure proper calibration ranges for conductivity measurements).
- Stressing the importance of survey timing to enable ebb tide sampling in tidal areas- Noting inattention to required field safety precautions- Noting inattention to proper care of multi-probe units - Stressing the importance of filling out fieldsheets completely, and- Stressing the need to depth-calibrate the multi-probe initially at the first station
Any field audit results affecting sample data are reflected in the tables below. (Copies of completed audit forms are available from DWM’s QC Analyst.)
Lab Audits – To provide external evaluation of lab performance with regard to analyses for fecal coliform bacteria and nutrients (TP, TKN, PO4, NO3 and NH3) quality control samples were provided to WES.
The external audit of WES for fecal coliform bacteria analysis planned for 2001 was intended to employ semi-quantitative samples provided by Microcheck, Inc.. DWM placed the order two weeks prior but missed the cutoff for the PT Study. The audit was rescheduled for Spring, 2002. The results of the April, 2002 audit were satisfactory.
The nutrients QC samples (via Accustandard, Inc.) were diluted at DWM and sent double-blind to WES along with some equipment blank samples (see 5.3 below). Due to mis-communication between Accustandard and DWM, the dilution resulted in sample concentrations above the preferred range, making them less useful in assessing low-level accuracy. As a result, DWM instructed WES to run only the NO3-NO2-N and NH3-N QC samples. These results showed good precision between same concentration replicate samples (albeit at high concentrations) and ND for lab blank samples. Quality control audit samples for TP that were provided to WES in 2000 and 2002 showed satisfactory results.
5.4 Miscellaneous Information
The following are particularly noteworthy regarding 2001 DWM/CERO surveys and WES analyses. The validation decisions contained in the tables below reflect these considerations.
1) 9/11/01 Sudbury River survey, Concord Watershed: Survey coordinator noted that many water samples had excessive sediment buildup upon delivery to the lab that was inexplicable (sediment transport was not evident during survey). Based on these observations, specific instructions on sample processing (decanting) were given to the lab (see 9/18/01 e-mail from B. Friedmann). The cause of the undue sediment in samples is thought to have been sampling error (presumed to be poor sampling technique for both basket use and wade in samples. Despite the cause(s) and efforts to process these samples accordingly, those samples with medium to high sediment may not have been representative of field conditions and therefore have been censored or qualified. Samples with only slight sediment have been presumed to be representative.
3) MDL/RDL with regard to “ND” Results: In 2001, WES began to use Reporting Detection Limits or RDLs in addition to MDLs in their data reports. These reports defined (in a standard footnote) results less than the RDL as not detected or “ND”. Based on a clarifying email from Oscar Pancorbo dated 8/1/2003, “ND” actually referred to <MDL for most WES results prior to May, 2002. The exception to this is NO3-N, where “ND” results referred to <RDL.
7) Turbidity Results: Poor comparison between paired sample data for field vs. laboratory turbidity resulted in the censoring of all Year 2001 field turbidity results measured using the Hydrolab®
SuAsCo Watershed 2001 Water Quality Assessment Report Appendix A A2682wqar.doc DWM CN 92.0
multi-probe. Follow-up QC testing is planned to resolve accuracy/precision issues related to turbidity.
5.5 2001 Censored/Qualified Discrete Water Sample Data
All Year 2001 data (Concord excerpts only – BFF) for discrete water samples that have been censored or qualified are listed below by watershed, except for missing data. Additional sample information is also provided as needed for accepted data in need of further elaboration/ discussion. For qualifier definitions see Appendix A2.
Concord Watershed
Projname Analyte DATE OWMID LabSNum rResVal DWMQual UnitsConcord (2001) Fecal Coliforms 7/18/2001 82-0051 2001275-10 22 e CFU/100mL
Concord (2001) Fecal Coliforms 7/18/2001 82-0052 2001275-11 95 d CFU/100mL
Concord (2001) Fecal Coliforms 7/18/2001 82-0053 2001275-12 180 d CFU/100mL
Concord (2001) Fecal Coliforms 9/11/2001 82-0110 2001454-15 ## h CFU/100mL
Concord (2001) Fecal Coliforms 9/11/2001 82-0111 2001454-16 ## h CFU/100mL
Concord (2001) Fecal Coliforms 9/11/2001 82-0112 2001454-17 ## h CFU/100mL
Concord (2001) Fecal Coliforms 9/11/2001 82-0113 2001454-18 ## h CFU/100mL
Concord (2001) Fecal Coliforms 9/11/2001 82-0114 2001454-19 ## h CFU/100mL
Concord (2001) Fecal Coliforms 9/11/2001 82-0115 2001454-20 ## h CFU/100mL
Concord (2001) Fecal Coliforms 9/11/2001 82-0116 2001454-21 ## h CFU/100mL
Concord (2001) Fecal Coliforms 9/11/2001 82-0117 2001454-22 ## h CFU/100mL
Concord (2001) Fecal Coliforms 9/11/2001 82-0118 2001454-23 ## h CFU/100mL
Concord (2001) Fecal Coliforms 9/11/2001 82-0119 2001454-24 ## h CFU/100mL
Concord (2001) Fecal Coliforms 9/11/2001 82-0120 2001454-25 ## h CFU/100mL
Concord (2001) Fecal Coliforms 9/11/2001 82-0121 2001454-14 ## h CFU/100mL
Concord (2001) Fecal Coliforms 9/11/2001 82-0122 2001454-01 ## h CFU/100mL
Concord (2001) Fecal Coliforms 9/11/2001 82-0123 2001454-02 ## h CFU/100mL
Concord (2001) Fecal Coliforms 9/11/2001 82-0124 2001454-03 ## h CFU/100mL
Concord (2001) Fecal Coliforms 9/11/2001 82-0125 2001454-04 ## h CFU/100mL
Concord (2001) Fecal Coliforms 9/11/2001 82-0126 2001454-05 ## h CFU/100mL
Concord (2001) Fecal Coliforms 9/11/2001 82-0127 2001454-06 ## h CFU/100mL
Concord (2001) Fecal Coliforms 9/11/2001 82-0128 2001454-07 ## h CFU/100mL
Concord (2001) Fecal Coliforms 9/11/2001 82-0129 2001454-08 ## h CFU/100mL
Concord (2001) Fecal Coliforms 9/11/2001 82-0130 2001454-09 ## h CFU/100mL
Concord (2001) Fecal Coliforms 9/11/2001 82-0131 2001454-10 ## h CFU/100mL
Concord (2001) Fecal Coliforms 9/11/2001 82-0132 2001454-11 ## h CFU/100mL
Concord (2001) Fecal Coliforms 9/11/2001 82-0133 2001454-12 ## h CFU/100mL
Concord (2001) Fecal Coliforms 9/11/2001 82-0134 2001454-13 ## h CFU/100mL
Concord (2001) E. coli - MTEC 7/18/2001 82-0051 2001275-10 27 e CFU/100mL
Concord (2001) E. coli - MTEC 9/11/2001 82-0110 2001454-15 ## h CFU/100mL
Concord (2001) E. coli - MTEC 9/11/2001 82-0111 2001454-16 ## h CFU/100mL
Concord (2001) E. coli - MTEC 9/11/2001 82-0112 2001454-17 ## h CFU/100mL
Concord (2001) E. coli - MTEC 9/11/2001 82-0113 2001454-18 ## h CFU/100mL
Concord (2001) E. coli - MTEC 9/11/2001 82-0114 2001454-19 ## h CFU/100mL
Concord (2001) E. coli - MTEC 9/11/2001 82-0115 2001454-20 ## h CFU/100mL
SuAsCo Watershed 2001 Water Quality Assessment Report Appendix A A2782wqar.doc DWM CN 92.0
Projname Analyte DATE OWMID LabSNum rResVal DWMQual UnitsConcord (2001) E. coli - MTEC 9/11/2001 82-0116 2001454-21 ## h CFU/100mL
Concord (2001) E. coli - MTEC 9/11/2001 82-0117 2001454-22 ## h CFU/100mL
Concord (2001) E. coli - MTEC 9/11/2001 82-0118 2001454-23 ## h CFU/100mL
Concord (2001) E. coli - MTEC 9/11/2001 82-0119 2001454-24 ## h CFU/100mL
Concord (2001) E. coli - MTEC 9/11/2001 82-0120 2001454-25 ## h CFU/100mL
Concord (2001) E. coli - MTEC 9/11/2001 82-0121 2001454-14 ## h CFU/100mL
Concord (2001) E. coli - MTEC 9/11/2001 82-0122 2001454-01 ## h CFU/100mL
Concord (2001) E. coli - MTEC 9/11/2001 82-0123 2001454-02 ## h CFU/100mL
Concord (2001) E. coli - MTEC 9/11/2001 82-0124 2001454-03 ## h CFU/100mL
Concord (2001) E. coli - MTEC 9/11/2001 82-0125 2001454-04 ## h CFU/100mL
Concord (2001) E. coli - MTEC 9/11/2001 82-0126 2001454-05 ## h CFU/100mL
Concord (2001) E. coli - MTEC 9/11/2001 82-0127 2001454-06 ## h CFU/100mL
Concord (2001) E. coli - MTEC 9/11/2001 82-0128 2001454-07 ## h CFU/100mL
Concord (2001) E. coli - MTEC 9/11/2001 82-0129 2001454-08 ## h CFU/100mL
Concord (2001) E. coli - MTEC 9/11/2001 82-0130 2001454-09 ## h CFU/100mL
Concord (2001) E. coli - MTEC 9/11/2001 82-0131 2001454-10 ## h CFU/100mL
Concord (2001) E. coli - MTEC 9/11/2001 82-0134 2001454-13 ## h CFU/100mL
Concord (2001) Turbidity 7/10/2001 SU-0013 2001251-22 ## m NTU
Concord (2001) Turbidity 9/11/2001 82-0111 2001455-46 2.8 r NTU
Concord (2001) Turbidity 9/11/2001 82-0119 2001455-52 ## r NTU
Concord (2001) Alkalinity 7/10/2001 SU-0013 2001251-22 ## m mg/l
Concord (2001) Alkalinity 9/11/2001 82-0111 2001455-46 49 r mg/l
Concord (2001) Alkalinity 9/11/2001 82-0119 2001455-52 ## r mg/l
Concord (2001) Hardness 7/10/2001 SU-0013 2001251-22 ## m mg/l
Concord (2001) Hardness 9/11/2001 82-0111 2001455-46 65 r mg/l
Concord (2001) Hardness 9/11/2001 82-0119 2001455-52 ## r mg/l
Concord (2001) Ammonia-N 7/10/2001 SU-0027 2001251-52 0.06 b mg/l
Concord (2001) Ammonia-N 9/11/2001 82-0111 2001455-28 <0.02 r mg/l
Concord (2001) Ammonia-N 9/11/2001 82-0119 2001455-34 ## r mg/l
Concord (2001) Nitrate/Nitrite-N 9/11/2001 82-0111 2001455-28 <0.06 r mg/l
Concord (2001) Nitrate/Nitrite-N 9/11/2001 82-0119 2001455-34 ## r mg/l
Concord (2001) Total Phosphorus 9/11/2001 82-0111 2001455-28 0.055 r mg/l
Concord (2001) Total Phosphorus 9/11/2001 82-0119 2001455-34 ## r mg/l
Concord (2001) Suspended solids 7/10/2001 SU-0013 2001251-04 ## m mg/l
Concord (2001) Suspended solids 9/11/2001 82-0111 2001455-10 8.0 r mg/l
Concord (2001) Suspended solids 9/11/2001 82-0119 2001455-16 ## r mg/l
SuAsCo Watershed 2001 Water Quality Assessment Report Appendix A A2882wqar.doc DWM CN 92.0
APPENDIX A2Selected Excerpts from:
Data Validation Report for Year 2001 Project Data (CN 149.0)
December, 2004
Department of Environmental ProtectionDivision of Watershed Management
2001 Data Symbols and Qualifiers
The following data qualifiers or symbols are used in the MADEP/DWM WQD database for qualified and censored water quality and Hydrolab® data. Decisions regarding censoring vs. qualification for specific, problematic data are made based on a thorough review of all pertinent information related to the data, including the magnitude or extent of the problem(s). General Symbols (applicable to all types):
“ ## ” = Censored data (i.e., data that has been discarded for some reason). NOTE: Prior to 2001 data, “**” denoted either censored or missing data.
“ ** ” = Missing data (i.e., data that should have been reported). See NOTE above.
“ -- ” = No data (i.e., data not taken/not required)
“ <mdl ” = Less than method detection limit (MDL). Denotes a sample result that went undetected using a specific analytical method. The actual, numeric MDL is typically specified (e.g. <0.2).
Multiprobe -Specific Qualifiers: “ i ” = inaccurate readings from Hydrolab® multiprobe likely; may be due to significant pre-survey calibration problems, post-survey calibration readings outside typical acceptance range for the low ionic check and for the deionized blank water check, lack of calibration of the depth sensor prior to use, or to checks against laboratory analyses.
SuAsCo Watershed 2001 Water Quality Assessment Report Appendix A A2982wqar.doc DWM CN 92.0
Qualification Criteria for Depth (i):
General Depth Criteria: Apply to each OWMID#
- Clearly erroneous readings due to faulty depth sensor: Censor (i) - Negative and zero depth readings: Censor (i); (likely in error)- 0.1 m depth readings: Qualify (i); (potentially in error)- 0.2 and greater depth readings: Accept without qualification; (likely accurate)
Specific Depth Criteria: Apply to entirety of depth data for survey date
- If zero and/or negative depth readings occur more than once per survey date, censor all negative/zero depth data, and qualify all other depth data for that survey (indicates that erroneous depth readings were not recognized in the field and that corrective action (field calibration of the depth sensor) was not taken, i.e. that all positive readings may be in error.)
“ m ” = method not followed; one or more protocols contained in the DWM Hydrolab® SOP not followed, i.e. operator error (e.g. less than 3 readings per station (rivers) or per depth (lakes), or instrument failure not allowing method to be implemented.
“ s ” = field sheet recorded data were used to accept data, not data electronically recorded in the Hydrolab® surveyor unit, due to operator error or equipment failure.
“ u ” = unstable readings, due to lack of sufficient equilibration time prior to final readings, non-representative location, highly-variable water quality conditions, etc. See Section 4.1 for acceptance criteria.
“ c ” = greater than calibration standard used for pre-calibration, or outside the acceptable range about the calibration standard. Typically used for conductivity (>718, 1,413, 2,760, 6,668 or 12,900 uS/cm) or turbidity (>10, 20 or 40 NTU). It can also be used for TDS and Salinity calculations based on qualified (“c”) conductivity data, or that the calculation was not possible due to censored conductivity data ( TDS and Salinity are calculated values and entirely based on conductivity reading). See Section 4.1 for acceptance criteria.
“ ? ” = Light interference on Turbidity sensor (Hydrolab error message). Data is typically censored.
Sample-specific Qualifiers:
“ a ” = accuracy as estimated at WES Lab via matrix spikes, PT sample recoveries, internal check standards and lab-fortified blanks did not meet project data quality objectives identified for program or in QAPP.
“ b ” =blank Contamination in lab reagent blanks and/or field blank samples (indicating possible bias high and false positives).
“ d ” =precision of field duplicates (as RPD) did not meet project data quality objectives identified for program or in QAPP. Batched samples may also be affected.
“ e ” =not theoretically possible. Specifically, used for bacteria data where colonies per unit volume for e-coli bacteria > fecal coliform bacteria, for lake Secchi and station depth data where a specific Secchi depth is greater than the reported station depth, and for other incongruous or conflicting results. “ f ” = frequency of quality control duplicates did not meet data quality objectives identified for program or in QAPP.
“ h ” =holding time violation (usually indicating possible bias low)
“ j ” = ‘estimated’ value; used for lab-related issues where certain lab QC criteria are not met and re-testing is not possible (as identified by the WES lab only). Also used to report sample data where the sample concentration is less than the ‘reporting’ limit or RDL and greater than the method detection limit or MDL (mdl< x <rdl). Also used to note where values have been reported at levels less than the mdl.
“ m ” = method SOP not followed (only partially implemented or not implemented at all) due to complications with sample matrix (e.g. sediment in sample, floc formation), lab error (e.g. cross-contamination between samples), additional steps taken by the lab to deal with matrix complications, lost/unanalyzed samples, missing data or deviations from field sampling SOPs.
“ p ” =samples not preserved per SOP or analytical method requirements.
SuAsCo Watershed 2001 Water Quality Assessment Report Appendix A A3082wqar.doc DWM CN 92.0
“ r ” = samples collected may not be representative of actual field conditions, based on documented or suspected field sampling error, or inexplicable or improbable (“outliers”) values.
SuAsCo Watershed 2001 Water Quality Assessment Report Appendix A A3182wqar.doc DWM CN 92.0
APPENDIX A3Email Re: 9/11/2001 Sample Processing
For Internal Review OnlyFriedmann, Brian (DEP)To: Brian Friedmann(E-mail); Richard Chase(E-mail)Subject: Sudbury Sampling Processing for 9/11/01 Survey
Richard, after speaking with you and Jim Sullivan at WES, I decided to have the lab do the following with regard to the sediment—contaminated samples from the 9/11/01 water quality survey:
1. Nutrients (low tot P, NH3, N03+N02) and general chem (hard, tot alk, turb) were all to be decanted.
2. Total suspended solids (TSS) were shaken.
3. Bacteria samples were analyzed the following day which violates holding time.
Based on the list of the sample bottles that I visually inspected at WES, I can make a qualifying assessment of the reported data. I will also use prior data from the other two surveys to assess the data from the 9/11 survey.
Field conditions for flow and velocity during the survey were such that no scouring or other significant sediment transport should have been occuring except for minor detritus and algae.
Since the nutrient bottles were acidified in the field, the potential is for them to have higher reported values in the bottles that contained sediment. For those bottles that I have confidence in that did not have sediment, I would expect that decanting would give a number close to or no higher than the value if the bottle were shaken. For those with reported sediment, the reported values will most likely be higher than they should; at best, we will have an upper limit value for the nutrients.
For TSS, which will be determined after shaking, high confidence samples should be OK; sediment—contaminated samples will be “upper limit”.
For Tot Alk, Hard, and Turb, which will be decanted, high confidence samples should be close to the “real” value and represent a lower limit. For the sediment—contaminated samples, values will represent an upper limit.
Here is the transcription of the notes I took when we delivered samples to WES:
Station OWMIDSediment Visible
SU15 82—0111 medium amount (approx. 1mm)SU12 82—0114 slight amount (approx <0.5mm)SU11 82—0115 slight amountWB01 82—0116 slight amount (0116 and 0117 are the duplicates)WB01 82—0117 slight amount
Brian FriedmannDWM627 Main StreetWorcester, MA 01608508-767-2867 / FAX 508-791-4131
SuAsCo Watershed 2001 Water Quality Assessment Report Appendix A A3282wqar.doc DWM CN 92.0
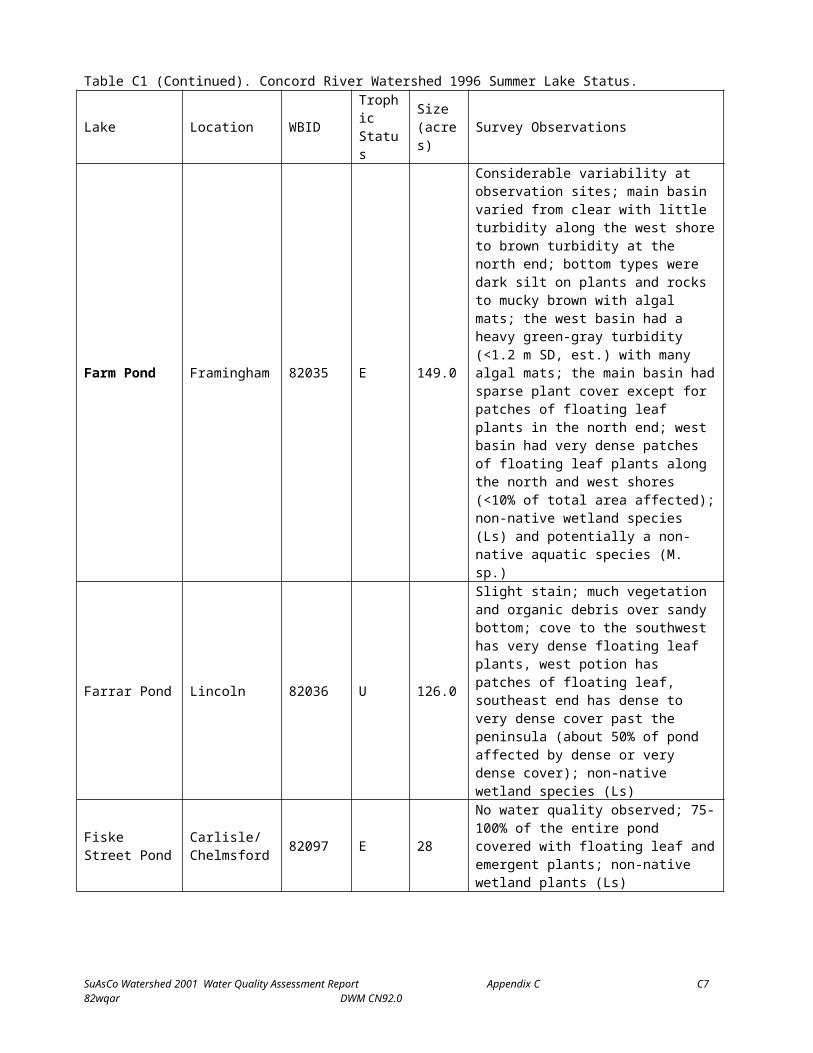
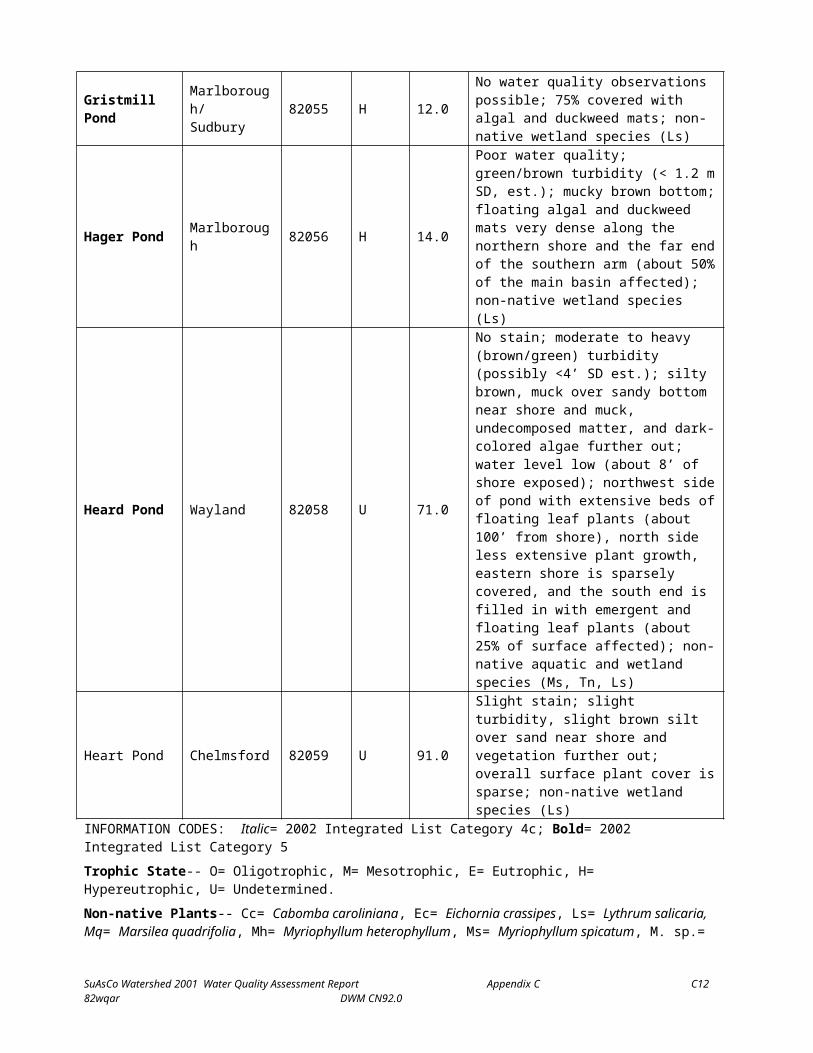
APPENDIX B - MA DEP OWM/DWM FISH TOXICS MONITORING IN THE CONCORD RIVER WATERSHED 1995, 1996, 1997, 2000, AND 2001
INTRODUCTION Fish toxics monitoring is a cooperative effort between three Massachusetts Department of Environmental Protection Offices/Divisions- Watershed Management, Research and Standards (ORS), and Environmental Analysis (Wall Experiment Station- WES), the Massachusetts Department of and Game, Division of Fisheries and Wildlife (MDFW), and the Massachusetts Department of Public Health (MDPH).
Between July 1995 and August 2001 the MA DEP Office of Watershed Management (OWM) /Division of Watershed Management (DWM) collected fish at eight sites in the Concord River Watershed as follows (See Figure 1). Waterbody Location Date(s) SampledLake Cochituate Natick/Wayland July 28, 1995Lake Boon Stow/Hudson July 11, 1996Whitehall Reservoir Hopkinton July 26, 1996Warners Pond Concord September 16, 1997Assabet River (3 stations) Concord, Maynard, Hudson September 17,18, 1997Nutting Lake Billerica August 18, 2000Hocomonco Pond Westborough August 21, 2001Sudbury Reservoir Marlborough/Southborough August 14, 2001
$
$$
$
$
$
$
$
Assabet River, at Woods Park, Hudson
Nutting Lake, Billerica
Sudbury Reservoir, Marlborough/Southborough
Assabet River, Downstream of Route 2, Concord
Assabet River at White Pond Road, Maynard
Lake Cochituate, Natick/Wayland
Warners Pond, Concord
Lake Boon, Stow/Hudson
Hocomonco Pond, Westborough
Whitehall Reservoir, Hopkinton
$
$
N
4 0 4 8 Miles
Figure B1. Fish Toxics Monitoring Locations in the Concord River Watershed, 1995-2001
SuAsCo Watershed 2001 Water Quality Assessment Report Appendix B B182wqar.doc DWM CN 92.0
PROJECT OBJECTIVESFish tissue monitoring is typically conducted to assess the levels of toxic contaminants in freshwater fish, identify waterbodies where those levels may impact human health, and identify waters where toxic chemicals may impact fish and other aquatic life. Human health concerns have received highest priority and, therefore, fish tissue analysis has been restricted to edible fillets. As such, fish toxics monitoring was designed to screen the edible fillets of several species of fishes representing different feeding groups (i.e., bottom dwelling omnivores, top-level predators, and water column feeders) for the presence of heavy metals, polychlorinated biphenyls (PCBs) and organochlorine pesticides. Beginning in 1999 MA DEP DWM Fish Toxics Monitoring was conducted in accordance with Fish Toxics Quality Assurance Project Plans (QAPPs). Data Quality Objectives are presented in the QAPPs. There were no deviations from the QAPPs.
METHODSField MethodsElectrofishing was performed by maneuvering the boat through the littoral zone and shallow water habitat of a given waterbody and collecting most fish shocked. Fish collected by electrofishing were stored in a live well filled with site water until the completion of sampling. Trotlines were baited with nightcrawlers or shiners, set overnight, and retrieved the following day. Fish to be retained for analysis were put on ice and returned to the DWM laboratory in Grafton (1995 and 1996) or Worcester (1997, 2000, and 2001). All other fish were returned to the water unharmed when possible. Specific information regarding collection techniques is presented below.
Lab MethodsIced fish, which were brought to the MA DEP DWM laboratory in Grafton or Worcester, were processed using protocols designed to assure accuracy and prevent cross-contamination of samples. Specimen lengths and weights were recorded along with any notes on tumors, lesions, or other anomalies noticed during an external visual inspection. Scales, spines, or pectoral fin ray samples were obtained and archived for use in age determination. Fish were filleted (skin off) on glass cutting boards and prepared for freezing. All equipment used in the filleting process was rinsed in tap water and then rinsed twice in de-ionized water before and or after each sample. Samples (individual or composite) targeted for % lipids, PCBs and organochlorine pesticide analysis were wrapped in aluminum foil. Samples targeted for metals analysis were placed in VWR 32-ounce high-density polyethylene (HDPE) cups with covers. Composite samples ranged from two to five fillets from like-sized individuals of the same species (or occasionally the same genus). Samples were tagged and frozen for subsequent delivery to the Department’s Wall Experiment Station (WES).
Methods used at WES for metals and organics analysis included the following.
During 1995, 1996, and 1997 analytical methods included a cold vapor method using a VGA hydride generator for mercury and Varian 1475 flame atomic absorption for all remaining metals. PCB/organochlorine pesticide analysis was performed on a gas chromatograph equipped with an electron capture detector. Additional information on analytical techniques used at WES is available from the laboratory.
In 2000 and 2001 mercury was analyzed by a cold vapor method using a Perkin Elmer, FIMS (Flow Injection Mercury System), which uses Flow Injection Atomic Absorption Spectroscopy. Cadmium and lead are analyzed
SuAsCo Watershed 2001 Water Quality Assessment Report Appendix B B282wqar.doc DWM CN 92.0
using a Perkin Elmer, Optima 3000 XL ICP - Optical Emission Spectrophotometer. Arsenic and selenium are analyzed using a Perkin Elmer, Zeeman 5100 PC, Platform Graphite Furnace, Atomic Absorption Spectrophotometer. PCB Arochlor, PCB congener, and organochlorine pesticide analysis was performed on a gas chromatograph equipped with an electron capture detector “according to the modified AOAC 983.21 procedure for the analysis of PCB Arochlors, Congeners, and Organochlorine Pesticides.” Additional information on analytical techniques used at WES is available from the laboratory.
RESULTS AND DISCUSSION
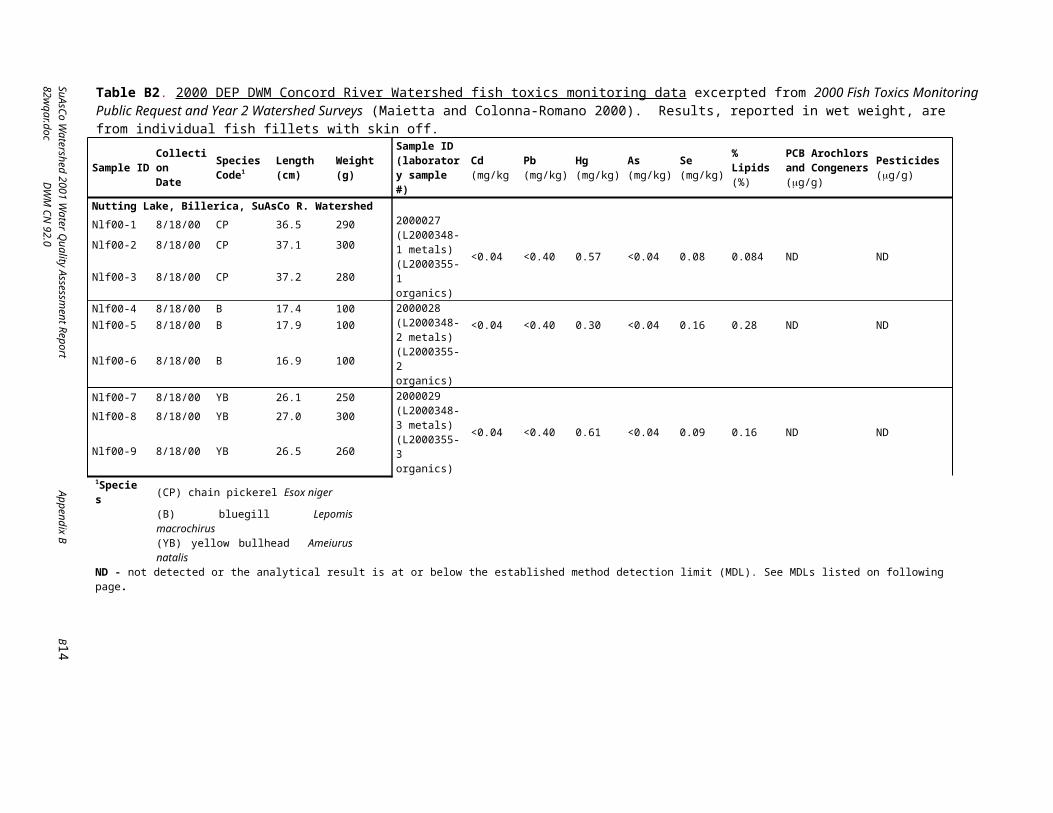
According to standard practice, all laboratory analytical results were forwarded to the Massachusetts Department of Public Health. Data for all surveys are presented in Tables 3-1 through 3-4. All raw data files, field sheets, lab reports, chain of custody forms, and other metadata are maintained in open files and databases at the MA DEP DWM in Worcester. Quality Assurance Data are available in Data Validation Report for Year 2000 Project Data (CN 083.0) DRAFT December 19, 2002.
1995 Lake Cochituate, Natick/WaylandLake Cochituate (sampled by public request) is a large (594 acre) mesotrophic waterbody located in the Sudbury River Watershed. There are three distinct basins separated by two major highways. The watershed is highly developed both commercially and residentially and includes a number of major industrial areas. The lake receives direct stormwater runoff from a number of large storm drains. There is historic evidence (MDFW) of a tar/oil dump on Beaverdam Brook, a tributary to Lake Cochituate's South Basin. MDFW files note numerous problems dating back to the early 1950s. These problems include low dissolved oxygen, algal blooms, and fish kills. The requestor noted seeing dead fish on numerous occasions in the southern basin near the United States Army's Natick Laboratory. The United States Army's Natick Laboratory site was listed on the National Priority List (NPL) in May of 1994 due to groundwater contamination. Contaminants of concern include a number of volatile organic compounds, mercury, and polyaromatic hydrocarbons. Cleanup of the site will be funded by the Department of Defense. The United States Environmental Protection Agency (USEPA) is the lead regulatory agency with the MA DEP BWSC supporting. The requestor also notes a large number of people "subsistence fishing" on the lake. The MDFW stocks the lake with trout (Salmonidae), northern pike (Esox lucius), and tiger musky (Esox lucius x masquinongy) and rates fishing pressure as high (>40 fishing trips/acre/year).
Electrofishing at Lake Cochituate resulted in the collection of three largemouth bass (Micropterus salmoides), three black crappie (Pomoxis nigromaculatus), three yellow perch (Perca flavescens), three American eel (Anguilla rostrata), one pumpkinseed (Lepomis gibbosus), two bluegill (Lepomis macrochirus), and one yellow bullhead (Ameiurus natalis). Three-fillet composites of largemouth bass, black crappie, American eel, yellow perch, and sunfish (pumpkinseed and bluegill) were analyzed at the Wall Experiment Station for cadmium, lead, mercury, arsenic, selenium, percent lipids, PCB Arochlors and congeners, and pesticides. An individual sample of yellow bullhead was also submitted to WES.
Arsenic, cadmium, and lead were below method detection limits in all samples analyzed. Mercury concentrations ranged from 0.049 mg/kg in a composite of American eel (LCF95-10-12) to 0.411 mg/kg in a composite of largemouth bass (LCF95-1-3). Selenium concentrations ranged from 0.100 mg/kg in the individual yellow bullhead (LCF95-16) to 0.187 mg/kg in the aforementioned composite of largemouth bass. Organic scan analysis resulted in the detection of PCB Arochlor 1254 in four of the six samples analyzed. Concentrations ranged from none detected in composites of black crappie (LCF95-4-6) and yellow perch (LCF95-7-9) to 3.2 mg/kg in a composite of American eel (LCF95-10-12). Composite samples of largemouth bass (LCF95-1-3), and sunfish (LCF95-13-15) as well as the individual yellow bullhead (LCF95-16) also had detectable concentrations of PCB Arochlor 1254. Of the four samples with detectable concentrations of PCBs only the American eel sample exceeded the MDPH's informal trigger level of 1.0 mg/kg total PCBs. It should be noted that this sample had an unusually high lipid content (21% lipids). PCBs are known to be lipophilic compounds. Organochlorine pesticides were below MDLs in all samples analyzed.
Elevated PCB Arochlor 1254 in American eel resulted in the issuance of the following MDPH fish consumption advisory.
SuAsCo Watershed 2001 Water Quality Assessment Report Appendix B B382wqar.doc DWM CN 92.0
”Children younger than 12 years, pregnant women, and nursing mothers should not eat fish from Lake Cochituate”.
“The general public should not consume American eel from Lake Cochituate.”
Although mercury concentrations were below the MDPH trigger level for mercury (0.5 mg/kg), it should be noted that bass in the composite ranged from 0.59 to 0.80 kg (approximately 1.3 to 1.7 pounds) in weight. Larger bass most likely contain mercury concentrations approaching or exceeding the MDPH trigger level. Selenium concentrations are consistent with those found in waterbodies throughout the Commonwealth and do not appear to be a concern.
1996 Lake Boon, Hudson/StowLake Boon is a 175-acre mesotrophic lake located in the towns of Hudson and Stow. The watershed is predominantly forested but the immediate shoreline is heavily developed with year-round residences.
Electrofishing at Lake Boon resulted in the collection of three largemouth bass, two black crappie, three yellow perch, three white perch Morone americana, three bluegill, and three American eel. Fillets were composited by species and were analyzed at the Wall Experiment Station for cadmium, lead, mercury, arsenic, selenium, percent lipids, PCB arochlors , and pesticides. Additional species observed/collected but not analyzed included golden shiner Notemigonus crysoleucas, pumpkinseed Lepomis macrochirus, brown bullhead Ameiurus nebulosus , and chain pickerel Esox niger. One brown bullhead was noted as having a large melanoma.
Arsenic, cadmium, and lead were below method detection limits in all samples analyzed. Mercury concentrations ranged from 0.197 mg/kg in a composite of American eel (LBF96-15-17) to 0.827 mg/kg in a composite of black crappie (LBF96-4+5). Selenium concentrations ranged from 0.072 mg/kg in the composite of black crappie to 0.255 mg/kg in the composite of white perch (LBF96-9-11). PCB and organic scan analysis resulted in the detection of trace amounts of PCB Arochlor 1242 (0.091 mg/kg), DDD (0.064 mg/kg), DDE (0.13 mg/kg), and DDT (0.024 mg/kg) in one (American eel LBF96-15-17) of the six samples analyzed. Concentrations in all other samples were either not detected or below method detection limits (MDLs).
The composites of black crappie and largemouth bass (LBF96-1-3) contained mercury concentrations (0.827 and 0.61 mg/kg respectively) which exceeded the MDPH trigger level of 0.5 mg/kg. Elevated mercury concentrations resulted in the issuance of the following MDPH fish consumption advisories.
”Children younger than 12 years, pregnant women, and nursing mothers should not eat largemouth bass or black crappie from Lake Boon”.
“The general public should limit consumption of largemouth bass and black crappie from Lake Boon to two meals per month.”
It is unclear what may be causing the elevated mercury concentrations in Lake Boon fishes. It is assumed that atmospheric deposition of mercury is the primary source of mercury to this waterbody. Selenium concentrations are consistent with those found in waterbodies throughout the Commonwealth and do not appear to be a concern.
With regard to the trace concentrations of organochlorine pesticides and PCBs in American eel, it should be noted that American eel are considered worst-case for organic contamination due to their bottom feeding/dwelling habits as well as their very high lipid concentrations (22%). Organochlorine pesticide and PCB concentrations were not considered to pose a public health threat.
1996 Whitehall Reservoir, HopkintonWhitehall Reservoir is a 575-acre eutrophic lake located in the Town of Hopkinton. Although there is very little shoreline development landuse in the watershed is a mix of forested and medium density residential. The MDFW stocks the Reservoir with trout each spring. In addition, the waterbody occasionally receives stockings of northern
SuAsCo Watershed 2001 Water Quality Assessment Report Appendix B B482wqar.doc DWM CN 92.0
pike and tiger musky. The Reservoir is managed by the Massachusetts Department of Conservation and Recreation and gets heavy fishing pressure year round.
In accordance with the Office of Watershed Management's (OWM's) Concord River Watershed Team’s request, Whitehall Reservoir in Hopkinton was sampled for fish on July 25, 1996. Electrofishing resulted in the collection of a fair number of largemouth bass in the 8 to 11 inch range. Three specimens that were slightly shorter than the 12-inch minimum size limit were retained for analysis. In addition to largemouth bass, composites of black crappie, yellow perch, and bluegill were also prepared for analysis. Additional fish sampling was conducted using trotlines on August 15, 1996. Overnight trotline sets resulted in the collection of yellow bullhead and white catfish Ameiurus catus. Fillets were composited by species and were analyzed at the Wall Experiment Station for cadmium, lead, mercury, arsenic, selenium, percent lipids, PCB Arochlors , and organochlorine pesticides. Additional species observed/collected but not analyzed included pumpkinseed, chain pickerel and white perch .
Cadmium, and lead were below method detection limits in all samples analyzed. Mercury concentrations ranged from 0.369 mg/kg in a composite of bluegill (WRF96-10-12) to 1.06 mg/kg in a composite of yellow bullhead (WRF96-13-15). Composite samples of largemouth bass (WRF96-1-3), black crappie (WRF96-4-6), yellow bullhead, white catfish (WRF96-16-18), and bluegill contained mercury concentrations which exceeded the MDPH trigger level of 0.5 mg/kg. Selenium concentrations ranged from 0.051 mg/kg in the composite of white catfish to 0.146 mg/kg in the composite of yellow bullhead. Arsenic was detected at concentration just above the method detection limit in both yellow bullhead and white catfish samples. PCB and organic scan analysis resulted in the detection of trace amounts of DDD and DDE (0.013 and 0.023 mg/kg respectively ) in white catfish. All other contaminants in all other samples were either not detected or below method detection limits (MDLs).
Elevated mercury concentrations resulted in the issuance of the following MDPH fish consumption advisories.
”Children younger than 12 years, pregnant women, and nursing mothers should not eat fish from Whitehall Reservoir”.
“The general public should not consume yellow bullhead from Whitehall Reservoir.”
“The general public should limit consumption of all other species from Whitehall Reservoir to two meals per month.” It is unclear what may be causing the elevated mercury concentrations in Whitehall Reservoir fishes. It is assumed that atmospheric deposition of mercury is the primary source of mercury to this waterbody. It should be noted that although largemouth bass and black crappie are regularly found to contained elevated mercury, species such as bluegill and yellow bullhead rarely bioaccumulate mercury to concentrations which exceed the MDPH trigger level. Trace amounts of organochlorine pesticides in the composite of white catfish were not considered a public health threat.
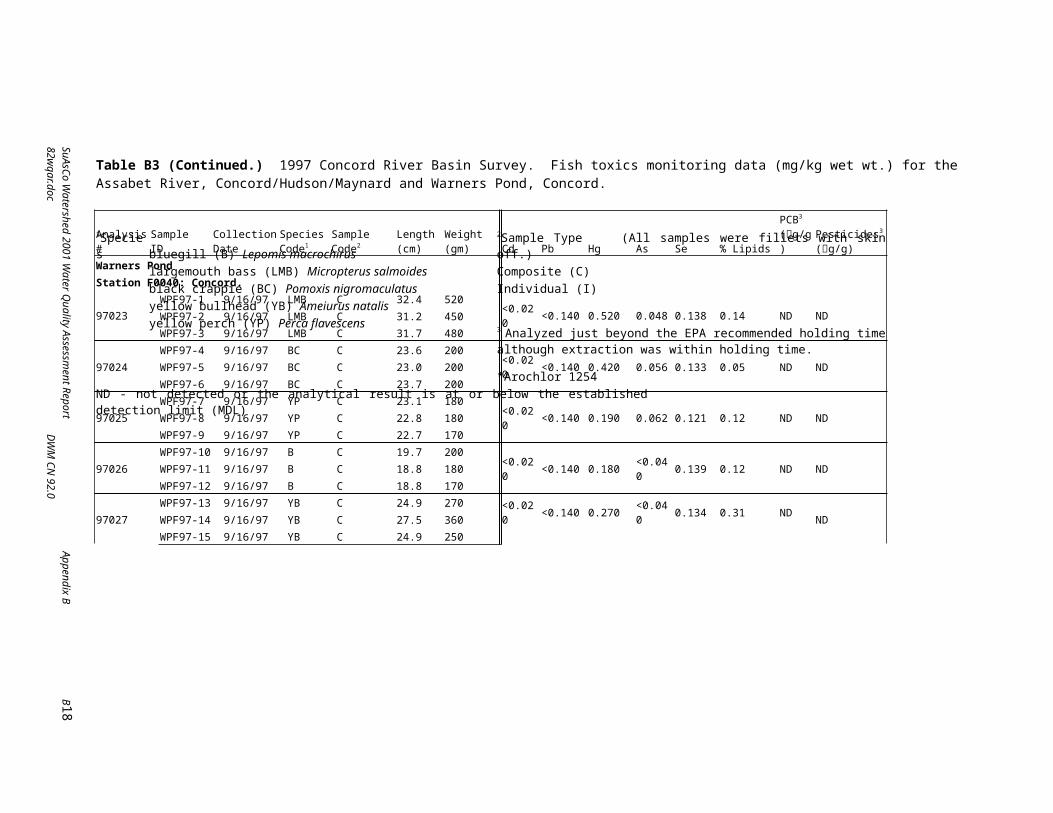
1997 Warners Pond, ConcordThis 54-acre pond in the Town of Concord is located within the Assabet River watershed. Residential development is heavy along a small section of the shoreline and watershed, and part of the pond’s immediate watershed is in active agricultural use. The pond is very shallow with a very high percent coverage by macrophytes. The pond receives flow from Fort Pond Brook and Nashoba Brook, which drain large portions of Acton, Boxborough, and Westford.
Boat electrofishing in Warners Pond on September 16, 1997 resulted in the collection of three largemouth bass, three black crappie, three yellow perch, three bluegill, and three yellow bullhead.
Cadmium, and lead were below method detection limits in all samples analyzed. Mercury concentrations ranged from 0.180 mg/kg in a composite of bluegill (WPF97-10-12) to 0.52 mg/kg in a composite of largemouth bass (WPF97-1-3). Selenium concentrations ranged from 0.133 mg/kg in the composite of black crappie (WPF97-4-6) to 0.139 mg/kg in the composite of bluegill. Arsenic was detected at 0.048 mg/kg in the
SuAsCo Watershed 2001 Water Quality Assessment Report Appendix B B582wqar.doc DWM CN 92.0
composite of largemouth bass and at 0.062 mg/kg in the composite of yellow perch (WPF97-7-9). PCBs and organochlorine pesticides were below detection in all samples analyzed.
Although mercury concentrations were below levels of concern in most species analyzed mercury was slightly elevated in the composite sample of largemouth bass. While the concentration (0.52 mg/kg) is consistent with data from similar waterbodies it does exceed the MDPH’s trigger levelfor mercury. As a result of the elevated mercury concentrations in largemouth bass the MDPH issued a fish consumption advisory for Warners Pond, which advises that:
“Children younger than 12 years, pregnant women and nursing mothers should not eat largemouth bass from Warners Pond,” and
“The general public should limit consumption of largemouth bass from Warners Pond to two meals per month.”
Mercury concentrations in largemouth bass are similar to those found at other locations across the Commonwealth and the primary source is assumed to be atmospheric deposition. Selenium concentrations are consistent with those found in waterbodies throughout the Commonwealth and do not appear to be a concern. While arsenic was detected three of the five samples, concentrations were low. While there is no United States Food and Drug Administration (USFDA) “Action Level” for arsenic, the USFDA reports legal limits (foreign countries) for arsenic in fisheries products ranging from 0.1 mg/kg (Venezuela) to 10 mg/kg (Hong Kong). Most countries listed had legal limits of 1.0 mg/kg or greater. Potential sources include bedrock geology, herbicides, and insecticides.
One of the yellow bullhead from Warners Pond was observed to have a melanoma (glossy black raised area) approximately one inch in diameter located on its side. The melanoma appeared similar to those noted in bullhead from the Sudbury River a number of years ago. Dr. Harshbarger of the Smithsonian Institute’s Registry of Tumors in Lower Animals reported that the melanoma observed in bullhead from the Sudbury River most likely “have a genetic basis rather than being chemically induced” (Harshbarger 1989).
This very shallow eutrophic waterbody appears to be supporting a very diverse and abundant assemblage of warmwater fishes. Due to the already highly eutrophied condition of Warners Pond, efforts to control agricultural and other non-point sources of nutrients within the immediate watershed and the watersheds of Fort Pond and Nashoba Brooks are essential to maintaining a viable recreational fishery in Warner’s Pond.
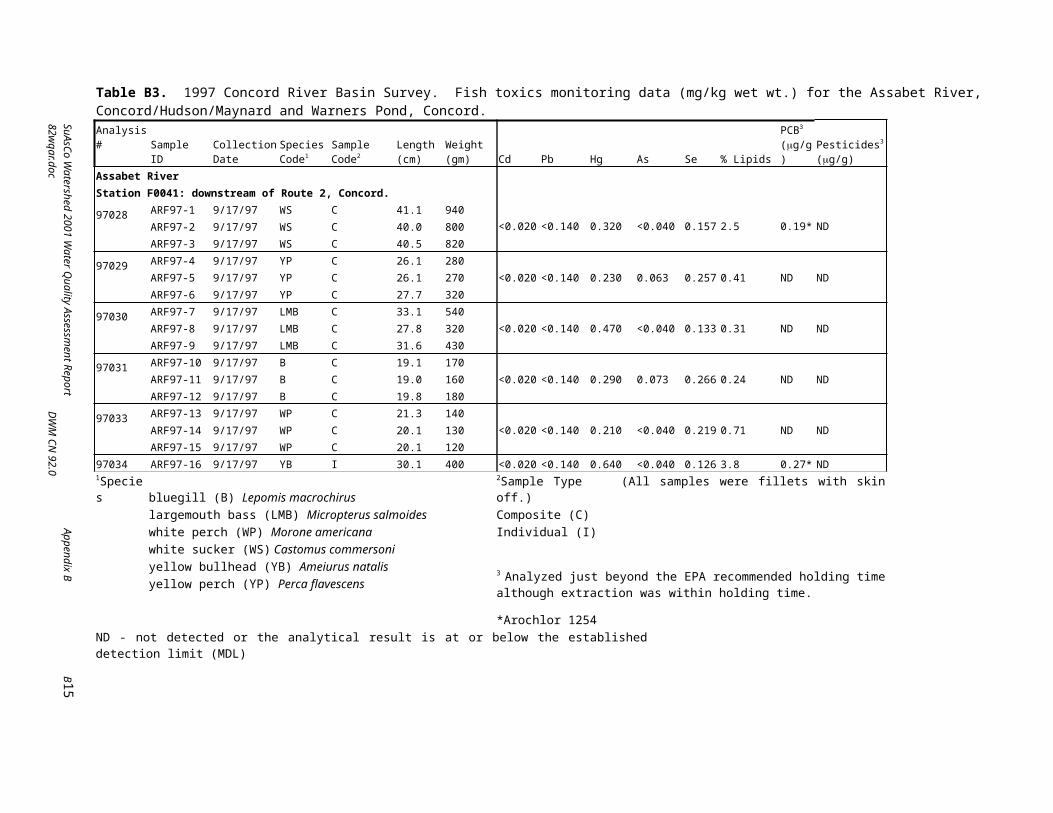
1997 Assabet River, ConcordThe Assabet River segment downstream from Route 2 in Concord contains both wide, shallow reaches containing sand and gravel riffles and deeper, slow-moving pool type habitats containing snags in the form of downed trees and large boulders. Land use in the immediate watershed is a mix of forested, residential, and agricultural. There is also a medium-sized, four-lane highway (Route 2) at the upper end of this segment. Boat electroshocking on September 17 1997 resulted in the capture of three white sucker, three yellow perch, three bluegill, and three largemouth bass and one yellow bullhead.
Cadmium and lead were below method detection limits in all samples analyzed. Mercury concentrations were relatively low in most samples, but the composite of largemouth bass (Arf97-7-9) contained 0.47 mg/kg of mercury and an individual yellow bullhead (Arf97-16) was found to contain 0.64 mg/kg of mercury. Selenium concentrations ranged from 0.126 mg/kg in the individual yellow bullhead to 0.266 mg/kg in the composite of bluegill (ARF97-10-12). Trace amounts of arsenic (0.063 mg/kg and 0.073 mg/kg) were detected in the composite of yellow perch (ARF97-4-6) and the composite of bluegill (ARF97-10-12), respectively. The composite of white sucker (ARF97-1-3) and the individual yellow bullhead were found to contain detectable concentrations of PCB Arochlor 1254.Note the relatively high concentrations of lipids (2.5 and 3.8% respectively) in these samples.
Although mercury in the yellow bullhead sample exceeded the MDPH trigger level the MDPH will not issue an advisory as the result of a data point from an individual fish sample. While it is not surprising to see largemouth bass containing mercury approaching the MDPH trigger level of 0.5 mg/kg it is surprising to see bullhead in excess of this trigger level. It should be noted that the downstream end of this segment is located
SuAsCo Watershed 2001 Water Quality Assessment Report Appendix B B682wqar.doc DWM CN 92.0
fairly close to the confluence with the Assabet and Sudbury River (source of the Concord River) and that both the Sudbury and Concord Rivers have documented problems with regard to the bioaccumulation of mercury. It is possible that this particular bullhead migrated into the Assabet from a downstream area of the Concord River or from the Sudbury River.
Selenium concentrations are consistent with those found in waterbodies throughout the Commonwealth and do not appear to be a concern.
While arsenic was detected in two of the six samples concentrations were low just above the level of detection. While there is no USFDA Action Level for arsenic the USFDA reports legal limits (foreign countries) for arsenic in fisheries products ranging from 0.1 mg/kg (Venezuela) to 10 mg/kg (Hong Kong). Most countries listed had legal limits of 1.0 mg/kg or greater. Potential sources include bedrock geology, herbicides, and insecticides.
The PCB concentrations (0.19 and 0.27 mg/kg) were well below the MDPH PCB trigger level of 1.0 mg/kg. Potential sources of PCBs to the Assabet River in Concord include a number of wastewater treatment plants (WWTPs) as well as historic industrial discharges to the river but no specific source had been identified at this time. It should be noted that PCBs had also been detected in fish from the Sudbury and Concord Rivers in 1988. Organochlorine pesticides were below detection in all samples analyzed.
1997 Assabet River, MaynardAn impoundment of the Assabet River located at White Pond Road was sampled as a result of a public request. Although a small portion of the shoreline is developed with year-round residences, a large percentage of the immediate watershed is forested. Submerged aquatic macrophytes were abundant and the waters surface was covered entirely by floating duckweed. The requester notes that the impoundment receives flow from Taylor Brook, which drains a Superfund Site located within the watershed. Boat electroshocking on September 18, 1997 resulted in the capture of three largemouth bass, three brown bullhead, three bluegill, and two black crappie.
Cadmium, and lead were below method detection limits in all samples analyzed. Mercury concentrations ranged from 0.08 mg/kg in the composites of brown bullhead (ARF97-32-34) and bluegill (ARF97-35-37) to 0.41 mg/kg of mercury in the composite of largemouth bass (Arf97-29-31). Selenium concentrations ranged from 0.079 mg/kg in the composite of brown bullhead to 0.125 mg/kg in the composite of largemouth bass. A trace amount of arsenic (0.041 mg/kg) was detected in the largemouth bass composite. PCBs and organochlorine pesticides were below detection in all samples analyzed.
Mercury concentrations were below the MDPH trigger level in all samples analyzed. Selenium concentrations are consistent with those found in waterbodies throughout the Commonwealth and do not appear to be a concern. While arsenic was detected in one sample, the concentration was just above the level of detection. While there is no USFDA Action Level for arsenic the USFDA reports legal limits (foreign countries) for arsenic in fisheries products ranging from 0.1 mg/kg (Venezuela) to 10 mg/kg (Hong Kong). Most countries listed had legal limits of 1.0 mg/kg or greater.
Although the requestor also noted a high incidence of deformities in bullhead from this station fifteen that were examined on the day of sampling appeared normal. There have been other reports of strange looking growths and coloration on certain fishes. One of the descriptions provided closely fit a characteristic known as “spawning or nuptial tubercles,” which are normal in certain cyprinids (minnows). Other descriptions involved color variation that can also be highly variable in some fishes depending on the time of the year and the individual fish. Fisherman and others should continue to monitor the numbers and types of fish found to exhibit abnormalities. Photo documentation would be helpful in trying to determine the identity of any abnormalities.
1997 Assabet River, HudsonAn impoundment of the Assabet River located in downtown Hudson was also sampled as a result of a public request. The watershed is heavily developed with residences and the impoundment’s shoreline contains evidence of historic industrial activities, a service station, and other light industry. Boat electrofishing on
SuAsCo Watershed 2001 Water Quality Assessment Report Appendix B B782wqar.doc DWM CN 92.0
September 18, 1997 resulted in the collection of three largemouth bass, three white sucker, three bluegill, two American eel, and one brown bullhead.
Cadmium and lead were below method detection limits in all samples analyzed. Mercury concentrations ranged from 0.120 mg/kg in the individual brown bullhead (ARF97-28) to 0.47 mg/kg in the composite of largemouth bass (Arf97-17-19). Selenium concentrations ranged from 0.052 mg/kg in the individual brown bullhead to 0.130 mg/kg in the composite of American eel (Arf97-26+27). A trace amount of arsenic (0.054 mg/kg) was detected in the composite of white sucker (Arf97-20-22). PCB Arochlor 1254 was detected in two of the five samples analyzed. The composites of white sucker and American eel contained 0.17 mg/kg and 0.32 mg/kg of PCB Arochlor 1254 respectively. All other PCB Arochlors and organochlorine pesticides were below detection in all samples analyzed.
Although mercury concentrations in Assabet River (Hudson) fishes were below the MDPH trigger level in all samples analyzed the largemouth bass sample contained mercury just below the MDPH trigger level(0.5 mg/kg) and it is likely that larger bass contain mercury concentrations that exceed the “trigger level”. While arsenic was detected in one sample the concentration was just above the level of detection. While there is no USFDA Action Level for arsenic the USFDA reports legal limits (foreign countries) for arsenic in fisheries products ranging from 0.1 mg/kg (Venezuela) to 10 mg/kg (Hong Kong). Most countries listed had legal limits of 1.0 mg/kg or greater. Selenium concentrations are consistent with those found in other waterbodies across the Commonwealth and do not appear to be a concern.
Although white sucker and American eel were found to contain detectable concentrations of PCB Arochlor 1254 these samples were well below the MDPH PCB trigger level of 1.0 mg/kg. Potential sources of PCBs to the Assabet River in Hudson include WWTPs as well as historic industrial discharges, but no specific source has been identified at this time.
It was noted that a small number of largemouth bass from this impoundment had what appeared to be small skin lesions. In addition, a largemouth bass is also noted as having a skin pigmentation problem (black blotches). It was unclear what might be causing these anomalies.
2000 Nutting Lake, Billerica This 78-acre eutrophic lake is located within the Concord River watershed in the Town of Billerica. A causeway divides the pond into an eastern and a western basin. Electrofishing and trotlines set overnight in the western basin resulted in the collection of three chain pickerel, three bluegill, and three yellow bullhead. Additional species observed included largemouth bass, American eel, black crappie, pumpkinseed, golden shiner, and yellow perch.
Cadmium, lead, and arsenic were below MDLs in all samples analyzed. Mercury ranged from 0.30 mg/kg in the composite of bluegill (Nlf00-4-6) to 0.61 mg/kg in the composite of yellow bullhead (Nlf00-7-9). Selenium ranged from 0.08 in the composite of chain pickerel Esox niger (Nlf00-1-3) to 0.16 mg/kg in the composite of bluegill. PCBs and organochlorine pesticides were below MDLs in all three samples analyzed from Nutting Lake.
Mercury exceeded the MDPH trigger level (0.5 mg/kg) in both the composite of chain pickerel (0.57 mg/kg) and the composite of yellow bullhead (0.61 mg/kg). As a result of the elevated mercury concentrations the MDPH issued the following fish consumption advisory in February of 2001.
“Children younger than 12 years, pregnant women, and nursing mothers should not eat any fish from Nutting Lake.”
“The general public should limit consumption of all fish from Nutting Lake to two meals per month.”
It should be noted that while elevated mercury concentrations in predatory fishes is fairly common the presence of elevated mercury (greater than the MDPH “trigger” level) in bottom feeders such as yellow bullhead is relatively rare. It is unclear what may be causing the elevated mercury concentrations in Nutting Lake. It is assumed that atmospheric deposition of mercury is the primary source of mercury to this waterbody
SuAsCo Watershed 2001 Water Quality Assessment Report Appendix B B882wqar.doc DWM CN 92.0
Selenium concentrations are consistent with those found in other waterbodies within the Commonwealth and do not appear to be of concern.
2001 Hocomonco Pond, WestboroughThis 27-acre eutrophic pond is located in the Sudbury River Watershed in the Town of Westborough. Although the immediate shoreline is undeveloped land use in the ponds watershed is a mix of industrial, commercial, and forest. There is also a remediated EPA superfund site located on the southeastern shoreline of the pond. Access to the pond was prohibited for many years during site remediation and, although the area is being considered for increased levels of recreation in the near future, the pond remains closed to fishing.
Electrofishing at Hocomonco Pond in Westborough on August 21, 2001 resulted in the collection of three largemouth bass, three yellow bullhead, three pumpkinseed, three chain pickerel, and three bluegill. Additional species observed included: chain pickerel, golden shiner (Notemigonus crysoleucas), brown bullhead, white sucker, redfin pickerel (Esox americanus americanus), American eel, and yellow perch.
Arsenic, lead, and cadmium were below method detection limits (MDLs) in all samples analyzed. Mercury ranged from 0.076 mg/kg in a composite of bluegill (Hpf01-4-6) to 0.31 mg/kg in a composite of largemouth bass (Hpf01-1-3). Selenium ranged from 0.11 in yellow bullhead (Hpf01-13-15) to 0.18 mg/kg in the composite of pumpkinseed (Hpf01-10-12). PCBs and organochlorine pesticides were below MDLs in all five samples analyzed from Hocomonco Pond.
Mercury was below the MDPH trigger level of 0.5mg/kg in all samples analyzed and selenium concentrations are consistent with those found in other waterbodies within the Commonwealth and do not appear to be of concern. Although one of the historic contaminants of concern at the site was PAHs they were not analyzed for. Historic data from Hocomonco Pond and other studies indicate that semi-volatile organic compounds such as PAHs do not bioaccumulate in fish tissue (Jonasch 1986).
2001 Sudbury Reservoir, Southborough/MarlboroughSudbury Reservoir is a 1292-acre reservoir located in the Town of Southborough and the City of Marlborough. It was originally constructed as a water supply reservoir for the Boston Metropolitan Area and continues to serve as a back-up emergency water supply for this area. The immediate watershed and shoreline is undeveloped but the watershed as a whole is heavily developed both residentially and commercially. Fish toxics monitoring during 1987 revealed mercury concentrations in largemouth bass ranging from 0.26 to 0.50 mg/kg (n=3).
Electrofishing at Sudbury Reservoir in Marlborough/Southborough on August 14, 2001 resulted in the collection of three largemouth bass, three black crappie, three yellow perch, three white perch, and three yellow bullhead. Additional species observed included pumpkinseed, chain pickerel, bluegill, redbreast sunfish (Lepomis auritus), and smallmouth bass (Micropterus dolomieui).
Arsenic, lead, and cadmium were below method detection limits (MDLs) in all samples analyzed. Mercury ranged from 0.063 mg/kg in a composite of black crappie (SRF01-0-12) to 0.16 mg/kg in a composite of white perch (SRF01-7-9). Selenium ranged from 0.21 in yellow bullhead (SRF01-13-15) to 0.74 mg/kg in the composite of white perch. PCBs and organochlorine pesticides were below MDLs in all five samples analyzed from Sudbury Reservoir.
Mercury was below the MDPH trigger level in all five samples analyzed in 2001. It should be noted that largemouth bass sampled in 2001 were smaller than those sampled in 1987. Selenium concentrations are consistent with those found in waterbodies throughout the Commonwealth.
SuAsCo Watershed 2001 Water Quality Assessment Report Appendix B B982wqar.doc DWM CN 92.0
SUMMARY
Fish toxics monitoring screening surveys in the Concord River Watershed between 1995 and 2001 resulted in site-specific fish consumption advisories for five of the ten waterbodies sampled.
Fish toxics monitoring screening surveys should be conducted in the future to screen additional Concord River Watershed waterbodies for the presence of mercury, PCBs and other toxic contaminants. Additional fish toxics monitoring in the middle and north basins of Lake Cochituate might help to pinpoint potential sources of PCBs as well as document the magnitude and extent of PCB contamination.
Study of the Sudbury River continues as part of the Nyanza Superfund Site’s remediation phase. In the summer of 2003 the United States Fish &Wildlife Service spent two weeks catching largemouth bass, brown bullhead, and yellow perch from within the Sudbury River as part of this remediation. They collected over 700 fish for this study. Results are not yet available.
Due to the highly eutrophic condition of Warners Pond DWM biologists recommended controlling agricultural and other nonpoint sources of nutrients within the immediate watershed of Warners Pond and in the watersheds of Fort Pond and Nashoba Brook in order to maintain a viable recreational fishery. Fisherman and others should continue to monitor numbers and types of fish found to exhibit abnormalities in the Assabet River and, if possible, photo document these to help to determine the identity and ultimately causes of any abnormalities.
SuAsCo Watershed 2001 Water Quality Assessment Report Appendix B B1082wqar.doc DWM CN 92.0
REFERENCES
Harshbarger, J. C. 1989 Letter to Robert J. Maietta of MA DEP. National Museum of Natural History, Smithsonian Institution, Washington D.C.
Jonasch, J. J. 1986. Letter to Peter Oatis of the MDFWELE. Massachusetts Department of Environmental Quality Engineering, Technical Services Branch. Westborough, MA
MA DEP. 1995. Open File. 1995 Fish Toxics Monitoring Data in the Concord River Watershed. Massachusetts Department of Environmental Protection, Division of Watershed Management, Worcester, MA.
MA DEP. 1996. Open File. 1996 Fish Toxics Monitoring Data in the Concord River Watershed. Massachusetts Department of Environmental Protection, Division of Watershed Management, Worcester, MA.
MA DEP. 1997. Open File. 1997 Fish Toxics Monitoring Data in the Concord River Watershed. Massachusetts Department of Environmental Protection, Division of Watershed Management, Worcester, MA.
MA DEP 1999. CN 13.0 . Fish Contaminant Monitoring Program, Quality Assurance Project Plan, 1999. Massachusetts Department of Environmental Protection, Division of Watershed Management. Worcester, MA.
MA DEP. 2000. Open File. 2000 Fish Toxics Monitoring Data in the Concord River Watershed. Massachusetts Department of Environmental Protection, Division of Watershed Management, Worcester, MA.
MA DEP. 2001. Open File. 2001 Fish Toxics Monitoring Data in the Concord River Watershed. Massachusetts Department of Environmental Protection, Division of Watershed Management, Worcester, MA.
MA DEP. 2003. CN 37.0. Fish Contaminant Monitoring Program, Quality Assurance Project Plan. Massachusetts Department of Environmental Protection, Division of Watershed Management. Worcester, MA.
MA DEP. 2003. CN 83.0. Data Validation Report for Year 2000 Project Data Massachusetts Department of Environmental Protection, Division of Watershed Management. Worcester, MA.
Maietta, R. J. 1995. 1995 Public Request Fish Toxics Monitoring Surveys (TM-S-4). Massachusetts Department of Environmental Protection, Office of Watershed Management. Worcester, MA
Maietta, R. J. 1997. 1997 Public Request Fish Toxics Monitoring Surveys (TM-S-9). Massachusetts Department of Environmental Protection, Office of Watershed Management. Worcester, MA
Maietta, R. J. and J. Colonna-Romano. 2000. 2000 Fish Toxics Monitoring Public Request and Year 2 Watershed Surveys (TM-S-13). Massachusetts Department of Environmental Protection, Division of Watershed Management. Worcester, MA
Maietta, R. J., Colonna-Romano, J., and R.F. Chase. 2002. 2001 Fish Toxics Monitoring Public Request and Year 2 Watershed Surveys (TM-S-16). Massachusetts Department of Environmental Protection, Division of Watershed Management. Worcester, MA
MDPH. 1996. Freshwater Fish Consumption Advisory List. Massachusetts Department of Public Health. Boston, MA.
MDPH. 2002. Freshwater Fish Consumption Advisory List. Massachusetts Department of Public Health. Boston, MA.
SuAsCo Watershed 2001 Water Quality Assessment Report Appendix B B1182wqar.doc DWM CN 92.0
Table B1. Analytical Results for 2001 Fish Toxics Monitoring Public Request and Year 2 Watershed Surveys. Results, reported in wet weight, are from composite samples of fish fillets with skin off.
ND - not detected or the analytical result is at or below the established method detection limit (MDL).
SuA
sCo W
atershed 2001 Water Q
uality Assessm
ent Report
Appendix B
B1282w
qar.docD
WM
CN
92.0
Table B1 (Continued). Analytical Results for 2001 Fish Toxics Monitoring Public Request and Year 2 Watershed Surveys. Results, reported in wet weight, are from composite samples of fish fillets with skin off.SampleID Collection
DateSpeciesCode1
Length(cm)
Weight(g)
Sample ID(laboratory sample #)
Cd(mg/kg)
Pb(mg/kg)
Hg(mg/kg)
As(mg/kg)
Se(mg/kg)
% Lipids(%)
PCB Arochlors and Congeners(g/g)
Pesticides(g/g)
Sudbury River, Marlborough, Concord WatershedSRF01-1 8/14/01 LMB 30.9 390 2001027
1 Species (LMB) largemouth bass Micropterus salmoides(YP) yellow perch Perca flavescens(WP) white perch Morone americana(BC) black crappie Pomoxis nigromaculatus(YB) yellow bullhead Ameiurus natalis
ND - not detected or the analytical result is at or below the established method detection limit (MDL).
SuA
sCo W
atershed 2001 Water Q
uality Assessm
ent Report
Appendix B
B1382w
qar.docD
WM
CN
92.0
Table B2. 2000 DEP DWM Concord River Watershed fish toxics monitoring data excerpted from 2000 Fish Toxics Monitoring Public Request and Year 2 Watershed Surveys (Maietta and Colonna-Romano 2000). Results, reported in wet weight, are from individual fish fillets with skin off.
Sample ID CollectionDate
SpeciesCode1
Length(cm)
Weight(g)
Sample ID(laboratory sample #)
Cd(mg/kg
Pb(mg/kg)
Hg(mg/kg)
As(mg/kg)
Se(mg/kg)
% Lipids(%)
PCB Arochlors and Congeners(g/g)
Pesticides(g/g)
Nutting Lake, Billerica, SuAsCo R. WatershedNlf00-1 8/18/00 CP 36.5 290 2000027
ND - not detected or the analytical result is at or below the established method detection limit (MDL). See MDLs listed on following page.
SuA
sCo W
atershed 2001 Water Q
uality Assessm
ent Report
Appendix B
B1482w
qar.docD
WM
CN
92.0
Table B3. 1997 Concord River Basin Survey. Fish toxics monitoring data (mg/kg wet wt.) for the Assabet River, Concord/Hudson/Maynard and Warners Pond, Concord.Analysis# Sample
IDCollectionDate
SpeciesCode1
SampleCode2
Length(cm)
Weight(gm) Cd Pb Hg As Se % Lipids
PCB3
(g/g)Pesticides3
(g/g)Assabet River Station F0041: downstream of Route 2, Concord.
97028ARF97-1 9/17/97 WS C 41.1 940
<0.020 <0.140 0.320 <0.040 0.157 2.5 0.19* NDARF97-2 9/17/97 WS C 40.0 800 ARF97-3 9/17/97 WS C 40.5 820
97029ARF97-4 9/17/97 YP C 26.1 280
<0.020 <0.140 0.230 0.063 0.257 0.41 ND NDARF97-5 9/17/97 YP C 26.1 270 ARF97-6 9/17/97 YP C 27.7 320
97030ARF97-7 9/17/97 LMB C 33.1 540
<0.020 <0.140 0.470 <0.040 0.133 0.31 ND NDARF97-8 9/17/97 LMB C 27.8 320 ARF97-9 9/17/97 LMB C 31.6 430
97031ARF97-10 9/17/97 B C 19.1 170
<0.020 <0.140 0.290 0.073 0.266 0.24 ND NDARF97-11 9/17/97 B C 19.0 160 ARF97-12 9/17/97 B C 19.8 180
97033ARF97-13 9/17/97 WP C 21.3 140
<0.020 <0.140 0.210 <0.040 0.219 0.71 ND NDARF97-14 9/17/97 WP C 20.1 130 ARF97-15 9/17/97 WP C 20.1 120
1Species bluegill (B) Lepomis macrochirus 2Sample Type (All samples were fillets with skin off.)largemouth bass (LMB) Micropterus salmoides Composite (C)white perch (WP) Morone americana Individual (I)white sucker (WS) Castomus commersoniyellow bullhead (YB) Ameiurus natalis
3 Analyzed just beyond the EPA recommended holding time although extraction was within holding time.yellow perch (YP) Perca flavescens
*Arochlor 1254ND - not detected or the analytical result is at or below the established detection limit (MDL)
SuA
sCo W
atershed 2001 Water Q
uality Assessm
ent Report
Appendix B
B1582w
qar.docD
WM
CN
92.0
Table B3 (Continued). 1997 Concord River Basin Survey. Fish toxics monitoring data (mg/kg wet wt.) for the Assabet River, Concord/Hudson/Maynard and Warners Pond, Concord.
Analysis#
SampleID
CollectionDate
SpeciesCode1
SampleCode2
Length(cm)
Weight(gm) Cd Pb Hg As Se % Lipids
PCB3
(g/g)Pesticides3
(g/g)Assabet RiverStation F0042: at Woods Park, Hudson.
97035ARF97-17 9/18/97 LMB C 37.4 800
<0.020 <0.140 0.470 <0.040 0.104 0.22 ND NDARF97-18 9/18/97 LMB C 35.2 670 ARF97-19 9/18/97 LMB C 34.2 630
97036ARF97-20 9/18/97 WS C 44.0 1000
<0.020 <0.140 0.280 0.054 0.124 4.4 0.17* NDARF97-21 9/18/97 WS C 44.6 1050 ARF97-22 9/18/97 WS C 44.5 1020
97037ARF97-23 9/18/97 B C 19.0 150
<0.020 <0.140 0.230 <0.040 0.106 0.12 ND NDARF97-24 9/18/97 B C 19.7 180 ARF97-25 9/18/97 B C 19.3 160
1Species bluegill (B) Lepomis macrochirus 2Sample Type (All samples were fillets with skin off.)largemouth bass (LMB) Micropterus salmoides Composite (C)American eel (AE) Anguilla rostrata Individual (I)white sucker (WS) Castomus commersonibrown bullhead (BB) Ameiurus nebulosus
3 Analyzed just beyond the EPA recommended holding time although extraction was within holding time.
*Arochlor 1254ND - not detected or the analytical result is at or below the established detection limit (MDL)
SuA
sCo W
atershed 2001 Water Q
uality Assessm
ent Report
Appendix B
B1682w
qar.docD
WM
CN
92.0
Table B3 (Continued.) 1997 Concord River Basin Survey. Fish toxics monitoring data (mg/kg wet wt.) for the Assabet River, Concord/Hudson/Maynard and Warners Pond, Concord. Analysis# Sample
IDCollectionDate
SpeciesCode1
SampleCode2
Length(cm)
Weight(gm) Cd Pb Hg As Se % Lipids
PCB3
(g/g)Pesticides3
(g/g)Assabet RiverStation F0043: White Pond Road, Maynard.
97040ARF97-29 9/18/97 LMB C 40.2 1060
<0.020 <0.140 0.410 0.041 0.125 0.14 ND NDARF97-30 9/18/97 LMB C 42.5 1100 ARF97-31 9/18/97 LMB C 37.5 860
97041ARF97-32 9/18/97 BB C 26.8 220
<0.020 <0.140 0.080 <0.040 0.079 0.35 ND NDARF97-33 9/18/97 BB C 28.5 290 ARF97-34 9/18/97 BB C 30.5 430
97042ARF97-35 9/18/97 B C 18.3 150
<0.020 <0.140 0.080 <0.040 0.113 0.12 NDND
ARF97-36 9/18/97 B C 18.3 140 ARF97-37 9/18/97 B C 19.6 160
97043 ARF97-38 9/18/97 BC C 22.5 180 <0.020 <0.140 0.260 <0.040 0.115 0.13 NDNDARF97-39 9/18/97 BC C 19.6 120
1Species bluegill (B) Lepomis macrochirus 2Sample Type (All samples were fillets with skin off.)largemouth bass (LMB) Micropterus salmoides Composite (C)Brown bullhead (BB) Ameiurus nebulosus Individual (I)black crappie (BC) Pomoxis nigromaculatus
3 Analyzed just beyond the EPA recommended holding time although extraction was within holding time.
*Arochlor 1254ND - not detected or the analytical result is at or below the established detection limit (MDL)
SuA
sCo W
atershed 2001 Water Q
uality Assessm
ent Report
Appendix B
B1782w
qar.docD
WM
CN
92.0S
uAsC
o Watershed 2001 W
ater Quality A
ssessment R
eportA
ppendix BB18
82wqar.doc
DW
M C
N 92.0
Table B3 (Continued.) 1997 Concord River Basin Survey. Fish toxics monitoring data (mg/kg wet wt.) for the Assabet River, Concord/Hudson/Maynard and Warners Pond, Concord.
1Species bluegill (B) Lepomis macrochirus 2Sample Type (All samples were fillets with skin off.)
Table B4 (Continued). 1996 SuAsCo RIVER BASIN SURVEY. Fish toxics monitoring data (mg/kg wet wt.) for Lake Boon, Hudson/Stow and Whitehall Reservoir, Hopkinton.Analysis #
TABLE B5. Analytical results for 1995 Concord River Watershed Fish Toxics Monitoring Year 2 Watershed Surveys. Results, reported in wet weight, are from individual or composite samples of fish fillets with skin off.
Analysis #
Sample ID
Collection Date
Species Code1
Sample Type2
Length (cm)
Weight (gm) Cd Pb Hg As Se % Lipids PCB
(ug/g)Pesticides (ug/g)
SuA
sCo W
atershed 2001 Water Q
uality Assessm
ent Report
Appendix B
B2182w
qar.docD
WM
CN
92.0
Lake Cochituate
95033LCF95-1 07/28/95 LMB C 38.9 800 <0.20 <1.00 0.411 <0.040 0.187 0.28 0.25* NDLCF95-2 07/28/95 LMB C 33.9 630 LCF95-3 07/28/95 LMB C 33.8 590
95034LCF95-4 07/28/95 BC C 24.3 210 <0.20 <1.00 0.184 <0.040 0.162 0.15 ND3 NDLCF95-5 07/28/95 BC C 21.6 170 LCF95-6 07/28/95 BC C 21.9 170
95035LCF95-7 07/28/95 YP C 27.0 200 <0.20 <1.00 0.237 <0.040 0.142 0.08 ND NDLCF95-8 07/28/95 YP C 24.5 170 LCF95-9 07/28/95 YP C 24.6 180
95036LCF95-10 07/28/95 AE C 58.1 410 <0.20 <1.00 0.049 <0.040 0.162 21 3.2* NDLCF95-11 07/28/95 AE C 61.9 450 LCF95-12 07/28/95 AE C 58.2 380
95037LCF95-13 07/28/95 P C 17.6 110 <0.20 <1.00 0.088 <0.040 0.150 0.16 0.39* NDLCF95-14 07/28/95 B C 18.7 110 LCF95-15 07/28/95 B C 17.1 100
95038 LCF95-16 07/28/95 YB I 23.7 200 <0.20 1.6 0.093 <0.040 0.100 0.28 0.91* NDNotes: 1 Species 2 Sample Type (All samples were fillets with skin off.)
APPENDIX CDWM LAKES SURVEY DATA 1996 AND 2001 IN THE SUASCO RIVER WATERSHED
1996In the SuAsCo River Watershed DWM conducted synoptic surveys at 54 lakes during the 1996 field season. Observations, from at least one access point on each lake (multiple access points on larger lakes), were recorded on standardized field sheets. An attempt was made to observe the entire surface area of each lake to determine the extent of aerial macrophyte cover. At each sampling location general water quality conditions, identification and abundance of aquatic and wetland macrophyte plant species, and estimates of total percent aerial coverage were recorded. Macrophyte visual observations were augmented at each station by identifying plant specimens collected from the lake bottom. Specimens were retrieved using a “rake” (a short handled, double-sided garden rake on a 50 foot line) thrown to its maximum extension in multiple directions at each station. Macrophytes collected in the “rake” were identified (in situ or in the laboratory) and recorded on the field sheets. Transparency was measured where possible using a standard 20-centimeter diameter Secchi disk. Where Secchi disk measurements were not feasible transparency was estimated as being above or below 1.2 meter (the MDPH bathing beach guideline). Trophic status was estimated primarily using visual observations of macrophyte cover and phytoplankton populations. A more definitive assessment of trophic status would require more extensive collection of water quality and biological data.
Table C1. SuAsCo River Watershed 1996 Summer Lake Status.
Lake Location WBIDTrophic Status
Size (acres) Survey Observations
Ashland Reservoir Ashland 82003 U 155.0
Moderate tea stain; slight to moderate algal turbidity (>1.2m SD, est.); slight brown silt and organic matter (undecomposed) over sand, gravel and vegetation near shore, dark brown to black organic muck further out; sparse plant cover at south end and west side; non-native aquatic and wetland species (Mh, Ls)
Assabet River Reservoir Westborough 82004 H 333.0
Slight stain; very turbid (<1.2 m SD, est.); surface scum (blue-green bloom evident); partly decomposed matter over sandy bottom; very dense plant cover (all types) through most of the west side of the pond, very dense encroaching emergents around entire perimeter with occasional patches of floating plants (<10% affected); non-native aquatic and wetland species (Ms, Ls)
INFORMATION CODES: Italic= 2002 Integrated List Category 4c; Bold= 2002 Integrated List Category 5Trophic State-- O= Oligotrophic, M= Mesotrophic, E= Eutrophic, H= Hypereutrophic, U= Undetermined. Non-native Plants-- Cc= Cabomba caroliniana, Ec= Eichornia crassipes, Ls= Lythrum salicaria, Mq= Marsilea quadrifolia, Mh= Myriophyllum heterophyllum, Ms= Myriophyllum spicatum, M. sp.= possibly Myriophyllum heterophyllum (needs confirmation because insufficient key characteristics were observed to positively identify), Pa= Phragmites australs, Pc= Potamogeton crispus* Indicates Class A (water supply) water body; all others are Class B.
SuAsCo Watershed 2001 Water Quality Assessment Report Appendix C C182wqar DWM CN92.0
Table C1 (Continued). SuAsCo River Watershed 1996 Summer Lake Status.
Lake Location WBIDTrophic Status
Size (acres) Survey Observations
Bartlett Pond Northborough 82007 E 45.0
Slight stain; moderate turbidity; green algae masses; dark brown silt over sand along shore, dark brown to black muck further out; cove next to boat ramp about 40-50% covered with floating leaf plants, very dense floating leaf and emergent plants around southern perimeter (about 20’ out), open at northern end; presence of non-native aquatic and wetland species (Cc, Ms, Pc, Ls)
Batemans Pond Concord 82008 E 20.0
Heavy stain; slight turbidity (1.3m SD at dock); much organic matter on bottom; southwestern area partly filled in with wetland plants, western and northeastern section heavily encroached by emergent plants, patches of very dense floating leaf plants frequently throughout pond (about 50% of the pond affected); non-native aquatic and wetland species (Mq, Ls)
Boons Pond Stow/ Hudson 82011 E 175.0
Slight stain; little to moderate greenish brown to gray-brown turbidity; slight brown silt on sand, gravel bottom and vegetation further out; 100% of eastern cove with very dense floating leaf, submergent and emergent plants, main basin with plants sparse on surface; non-native aquatic species (Cc, Mh)
Carding Mill Pond Sudbury 82015 E 40.0
No water quality observations possible; 100% very dense cover of duckweed and filamentous algae over at least the lower half of the pond
Chauncy Lake Westborough 82017 U 177.0
Green/brown turbidity; heavy near access (possibly <1.2 m SD, est.) but uncertain in main body of the lake; dark silt covering over sand and gravel bottom near shore, dark muck further out; windrows of green filamentous algae; very dense plant cover in cove area, but the rest of the pond is sparse; non-native aquatic and wetland species (Ms, Ls)
Clamshell Pond Clinton 82018 U 8.0
No water quality observations possible; about a third of the pond covered with very dense floating leaf plants
INFORMATION CODES: Italic= 2002 Integrated List Category 4c; Bold= 2002 Integrated List Category 5Trophic State-- O= Oligotrophic, M= Mesotrophic, E= Eutrophic, H= Hypereutrophic, U= Undetermined. Non-native Plants-- Cc= Cabomba caroliniana, Ec= Eichornia crassipes, Ls= Lythrum salicaria, Mq= Marsilea quadrifolia, Mh= Myriophyllum heterophyllum, Ms= Myriophyllum spicatum, M. sp.= possibly Myriophyllum heterophyllum (needs confirmation because insufficient key characteristics were observed to positively identify), Pa= Phragmites australs, Pc= Potamogeton crispus* Indicates Class A (water supply) water body; all others are Class B.
SuAsCo Watershed 2001 Water Quality Assessment Report Appendix C C282wqar DWM CN92.0
Table C1 (Continued). SuAsCo River Watershed 1996 Summer Lake Status.
Lake Location WBIDTrophic Status
Size (acres) Survey Observations
Lake Cochituate (Middle Basin)
Natick/ Wayland 82125 U 131.0
Slight stain; moderate turbidity (likely >1.2 m SD, est.); undecomposed matter and vegetation on bottom over sand and gravel; mostly sparse aquatic plant density on the surface, areas of very dense low-growing submergent plants but not a nuisance, patches of floating leaf and submergents plants to the surface, (< 10% of the surface area affected)
Lake Cochituate (North Basin)
Framingham/ Natick/ Wayland
82020 U 195.0
North end mostly clear water; very slight turbidity; slight organic material over sand, brown silt coating on rocks; southeast shore with moderate green turbidity; undecomposed organic matter and green algae on bottom; low-growing submergent plants very dense in some areas, surface plants sparse over most of the pond
Lake Cochituate (South Basin)
Natick 82127 E 233
Poor water quality; high green turbidity (possibly < 1.2 m SD, est.); heavy green filamentous algae on rocky bottom, also brown silt, gas bubbles given off from rocks, black muck further out; sparse surface plant cover throughout the basin; non-native wetland species (Ls) and potentially a non-native aquatic species (M. sp.)
Dudley Pond Wayland 82029 E 84.0
Heavy green/brown turbidity heavy (likely < 1.2 m SD, est.); much organic matter on bottom; surface plant cover sparse throughout the pond except occasional patches near the outlet; non-native aquatic species (Ms, Pc)
Elm Street Pond
Chelmsford/ Carlisle 82032 E 42.0
Moderate stain; moderate turbidity; slight surface scum; organic debris on bottom; about 95% of the pond covered with floating leaf plants; non-native wetland species (Ls)
INFORMATION CODES: Italic= 2002 Integrated List Category 4c; Bold= 2002 Integrated List Category 5Trophic State-- O= Oligotrophic, M= Mesotrophic, E= Eutrophic, H= Hypereutrophic, U= Undetermined. Non-native Plants-- Cc= Cabomba caroliniana, Ec= Eichornia crassipes, Ls= Lythrum salicaria, Mq= Marsilea quadrifolia, Mh= Myriophyllum heterophyllum, Ms= Myriophyllum spicatum, M. sp.= possibly Myriophyllum heterophyllum (needs confirmation because insufficient key characteristics were observed to positively identify), Pa= Phragmites australs, Pc= Potamogeton crispus* Indicates Class A (water supply) water body; all others are Class B.
SuAsCo Watershed 2001 Water Quality Assessment Report Appendix C C382wqar DWM CN92.0
Table C1 (Continued). Concord River Watershed 1996 Summer Lake Status.
Lake Location WBIDTrophic Status
Size (acres) Survey Observations
Farm Pond Framingham 82035 E 149.0
Considerable variability at observation sites; main basin varied from clear with little turbidity along the west shore to brown turbidity at the north end; bottom types were dark silt on plants and rocks to mucky brown with algal mats; the west basin had a heavy green-gray turbidity (<1.2 m SD, est.) with many algal mats; the main basin had sparse plant cover except for patches of floating leaf plants in the north end; west basin had very dense patches of floating leaf plants along the north and west shores (<10% of total area affected); non-native wetland species (Ls) and potentially a non-native aquatic species (M. sp.)
Farrar Pond Lincoln 82036 U 126.0
Slight stain; much vegetation and organic debris over sandy bottom; cove to the southwest has very dense floating leaf plants, west potion has patches of floating leaf, southeast end has dense to very dense cover past the peninsula (about 50% of pond affected by dense or very dense cover); non-native wetland species (Ls)
Fiske Street Pond
Carlisle/Chelmsford 82097 E 28
No water quality observed; 75-100% of the entire pond covered with floating leaf and emergent plants; non-native wetland plants (Ls)
Fisk Pond Natick 82038 U 68.0
Moderate stain; moderate brown turbidity (>1.2 m SD, est.); bottom vegetated with silty brown coating; slight powdery scum on surface; much debris washed up at the outlet structure; gas bubbles rising from bottom; very dense aquatic plant cover in western cove and coves along south side, about a third of the surface area affected; non-native aquatic and wetland species (Mh, Ls)
INFORMATION CODES: Italic= 2002 Integrated List Category 4c; Bold= 2002 Integrated List Category 5Trophic State-- O= Oligotrophic, M= Mesotrophic, E= Eutrophic, H= Hypereutrophic, U= Undetermined. Non-native Plants-- Cc= Cabomba caroliniana, Ec= Eichornia crassipes, Ls= Lythrum salicaria, Mq= Marsilea quadrifolia, Mh= Myriophyllum heterophyllum, Ms= Myriophyllum spicatum, M. sp.= possibly Myriophyllum heterophyllum (needs confirmation because insufficient key characteristics were observed to positively identify), Pa= Phragmites australs, Pc= Potamogeton crispus* Indicates Class A (water supply) water body; all others are Class B.
SuAsCo Watershed 2001 Water Quality Assessment Report Appendix C C482wqar DWM CN92.0
Table C1 (Continued). SuAsCo River Watershed 1996 Summer Lake Status.
Lake Location WBIDTrophic Status
Size (acres) Survey Observations
Fort Meadow Reservoir
Marlborough/ Hudson 82042 U 284.0
No stain to slight stain; very slight to moderate turbidity; slight oily scum and water meal along the southwest shore of the west basin; partly decomposed matter and brown silt over sand and gravel bottom; dense stands of emergent plants located frequently along the south and west shore of the west basin, otherwise the surface plant cover is sparse throughout the pond; non-native wetland species (Ls, Pa)
Fort Pond Littleton 82043 U 100.0
Moderate tea stain; moderate brown turbidity; brown silt over sandy bottom; a few patches of floating leaf plants scattered, otherwise sparse surface plant cover; non-native wetland species (Ls)
Framingham Reservoir #1 (Sterns Reservoir)
Framingham 82044 U 162.0
Slight to moderate stain; slight turbidity (> 1.2 m SD, est.); bottom uncertain, algae attached to some milfoil; oily/powdery scum on surface in the southwest “arm”; dense to very dense submergent and floating leaf plants in the northern cove, thin band of floating leaf and submergent plants around the remaining perimeter except frequent patches of floating leaf plants (about 50% cover) in the western cove; non-native aquatic and wetland species (Mh, Ms, Ls)
Framingham Reservoir #2
Framingham/ Ashland 82045 U 125.0
Moderate tea stain; moderate turbidity (1.1 m SD measured); bottom uncertain; sparse surface plant cover over entire lake; non-native wetland species (Ls)
Framingham Reservoir #3* Framingham 82046 U 237.0
Slight stain; moderate green/gray algal turbidity (2.1 m SD measured); slight brown silt over rocks on bottom; sparse surface aquatic plants over entire lake; non-native aquatic and wetland species (Ms, Ls)
Gates Pond* Berlin 82047 U 84.0
Clear; no turbidity; light brown silt on rocks and gravel; sparse surface plant cover over entire pond; non-native wetland species (Ls)
INFORMATION CODES: Italic= 2002 Integrated List Category 4c; Bold= 2002 Integrated List Category 5Trophic State-- O= Oligotrophic, M= Mesotrophic, E= Eutrophic, H= Hypereutrophic, U= Undetermined. Non-native Plants-- Cc= Cabomba caroliniana, Ec= Eichornia crassipes, Ls= Lythrum salicaria, Mq= Marsilea quadrifolia, Mh= Myriophyllum heterophyllum, Ms= Myriophyllum spicatum, M. sp.= possibly Myriophyllum heterophyllum (needs confirmation because insufficient key characteristics were observed to positively identify), Pa= Phragmites australs, Pc= Potamogeton crispus* Indicates Class A (water supply) water body; all others are Class B.
SuAsCo Watershed 2001 Water Quality Assessment Report Appendix C C582wqar DWM CN92.0
Table C1 (Continued). SuAsCo River Watershed 1996 Summer Lake Status.
Lake Location WBIDTrophic Status
Size (acres) Survey Observations
Gleasons Pond Framingham 82048 U 12.0
No water quality observations; very dense floating leaf plants along the north shore and interspersed throughout the pond (about 25% of the pond surface affected)
Great Meadow Pond #3 Concord 82053 E 38.0
Moderate stain, heavy brown turbidity (likely < 1.2 m SD, est.), mucky dark brown silt on the bottom and on vegetation in the east basin; no open water in the west basin; very dense vegetation over the entirety of both basins; non-native aquatic and wetland species (Nl, Tn, Ls)
Gristmill Pond Marlborough/Sudbury 82055 H 12.0
No water quality observations possible; 75% covered with algal and duckweed mats; non-native wetland species (Ls)
Hager Pond Marlborough 82056 H 14.0
Poor water quality; green/brown turbidity (< 1.2 m SD, est.); mucky brown bottom; floating algal and duckweed mats very dense along the northern shore and the far end of the southern arm (about 50% of the main basin affected); non-native wetland species (Ls)
Heard Pond Wayland 82058 U 71.0
No stain; moderate to heavy (brown/green) turbidity (possibly <4’ SD est.); silty brown, muck over sandy bottom near shore and muck, undecomposed matter, and dark-colored algae further out; water level low (about 8’ of shore exposed); northwest side of pond with extensive beds of floating leaf plants (about 100’ from shore), north side less extensive plant growth, eastern shore is sparsely covered, and the south end is filled in with emergent and floating leaf plants (about 25% of surface affected); non-native aquatic and wetland species (Ms, Tn, Ls)
Heart Pond Chelmsford 82059 U 91.0
Slight stain; slight turbidity, slight brown silt over sand near shore and vegetation further out; overall surface plant cover is sparse; non-native wetland species (Ls)
INFORMATION CODES: Italic= 2002 Integrated List Category 4c; Bold= 2002 Integrated List Category 5Trophic State-- O= Oligotrophic, M= Mesotrophic, E= Eutrophic, H= Hypereutrophic, U= Undetermined. Non-native Plants-- Cc= Cabomba caroliniana, Ec= Eichornia crassipes, Ls= Lythrum salicaria, Mq= Marsilea quadrifolia, Mh= Myriophyllum heterophyllum, Ms= Myriophyllum spicatum, M. sp.= possibly Myriophyllum heterophyllum (needs confirmation because insufficient key characteristics were observed to positively identify), Pa= Phragmites australs, Pc= Potamogeton crispus, Tn= Trapa natans* Indicates Class A (water supply) water body; all others are Class B.
SuAsCo Watershed 2001 Water Quality Assessment Report Appendix C C682wqar DWM CN92.0
Table C1 (Continued). SuAsCo River Watershed 1996 Summer Lake Status.
Lake Location WBIDTrophic Status
Size (acres) Survey Observations
Hocomonoco Pond Westborough 82060 U 27.0
Slight stain, moderate brown turbidity in open water area; much undecomposed and partly decomposed organic matter on bottom; very dense floating leaf and emergent vegetation at the west end, east end has a band of floating leaf plants near the shore (about a third of the total pond surface is affected); non- native wetland species (Ls)
Hopkinton Reservoir
Ashland/ Hopkinton 82061 U 170.0
Moderate tea stain; large chunks of bluegreens; slight turbidity (> 1.2 m SD, est.); slight silt on rocky/gravel bottom; sparse surface plant cover throughout the pond; non-native wetland species (Ls)
Learned Pond Framingham 82069 U 34.0
No stain; dark brown/black organic matter over sandy bottom; occasional patches of floating leaf plants spaced around perimeter, otherwise sparse surface plant cover throughout the pond; non-native wetland species (Ls)
Little Chauncy Pond Northborough 82070 E 45.0
Slight stain; moderate turbidity (> 1.2 m SD est.); brown silt over rocks and gravel; about a third to half of the pond covered with very dense floating leaf plants; non-native aquatic species (Mh, Pc)
Long Pond Littleton 82072 U 88.0
Little stain; slight turbidity; slight light brown silt over sandy bottom; very dense growths of emergent and floating leaf plants around the entire pond, cove on south side and the west end are very densely covered (about 10% of the total surface is affected); many freshwater mussels observed; non-native wetland species (Ls, Pa) and potentially a non-native aquatic species (M. sp.)
Milham Reservoir* Marlborough 82077 U 69.0
Moderate tea stain; little turbidity; white foam on the shore; slight brown silt on rocks and gravel, some undecomposed matter on bottom; sparse surface aquatic plant cover throughout the pond; non-native wetland species (Ls)
INFORMATION CODES: Italic= 2002 Integrated List Category 4c; Bold= 2002 Integrated List Category 5Trophic State-- O= Oligotrophic, M= Mesotrophic, E= Eutrophic, H= Hypereutrophic, U= Undetermined. Non-native Plants-- Cc= Cabomba caroliniana, Ec= Eichornia crassipes, Ls= Lythrum salicaria, Mq= Marsilea quadrifolia, Mh= Myriophyllum heterophyllum, Ms= Myriophyllum spicatum, M. sp.= possibly Myriophyllum heterophyllum (needs confirmation because insufficient key characteristics were observed to positively identify), Pa= Phragmites australs, Pc= Potamogeton crispus, Tn= Trapa natans* Indicates Class A (water supply) water body; all others are Class B.
SuAsCo Watershed 2001 Water Quality Assessment Report Appendix C C782wqar DWM CN92.0
Table C1 (Continued). SuAsCo River Watershed 1996 Summer Lake Status.
Lake Location WBIDTrophic Status
Size (acres) Survey Observations
Nagog Pond* Littleton/ Acton 82082 U 284.0
Clear; very slight turbidity; much undecomposed matter over rock/sand/ gravel bottom, slight brown silt on rocks; moderate patches of floating leaf plants in coves on south end of lake, overall sparse surface plant cover throughout the pond; non-native wetland species (Ls)
Nutting Lake, (East Basin) Billerica 82088 U 28.0
Moderate tea stain; moderate turbidity; fine dark brown organic silt over sandy bottom; dense to very dense floating leaf plants around about 50% of the perimeter (<10% surface area affected); non-native aquatic and wetland species (Tn, Ls)
Nutting Lake, (West Basin) Billerica 82124 U 51.0
Clear; little turbidity; slight brown silt over sandy bottom near shore with vegetation on bottom in deeper water; dense to very dense floating leaf plants around most of the perimeter (< 10% of the surface area affected); non-native wetland species (Ls)
Rocky Pond Boylston 82095 U 60.0
Clear; slight turbidity; much organic matter and vegetation over sand and gravel bottom; encroachment around the peninsula from the west center, very dense cover in the southwestern cove near the outlet and along the south shore to the southeast cove; northern part of the pond mostly open water except the east shore (about 1/4 to 1/3 of the surface affected); non-native aquatic species (Mh)
Russell Millpond Chelmsford 82096 U 20.0
Slight to dark tea stain; slight to moderate brown turbidity and iron floc in some areas, mucky brown bottom in other areas; green powdery scum on about 50% of the surface; pond very low (about 30-40’ of the shore exposed); dense plant cover in the remaining water at the upper end of the lower pond, the rest is open water; upper pond is covered with very dense submergent, floating leaf and emergent plants except for a narrow channel; non-native aquatic and wetland species (Tn, Ls)
INFORMATION CODES: Italic= 2002 Integrated List Category 4c; Bold= 2002 Integrated List Category 5Trophic State-- O= Oligotrophic, M= Mesotrophic, E= Eutrophic, H= Hypereutrophic, U= Undetermined. Non-native Plants-- Cc= Cabomba caroliniana, Ec= Eichornia crassipes, Ls= Lythrum salicaria, Mq= Marsilea quadrifolia, Mh= Myriophyllum heterophyllum, Ms= Myriophyllum spicatum, M. sp.= possibly Myriophyllum heterophyllum (needs confirmation because insufficient key characteristics were observed to positively identify), Pa= Phragmites australs, Pc= Potamogeton crispus
SuAsCo Watershed 2001 Water Quality Assessment Report Appendix C C882wqar DWM CN92.0
* Indicates Class A (water supply) water body; all others are Class B.
SuAsCo Watershed 2001 Water Quality Assessment Report Appendix C C982wqar DWM CN92.0
Table C1 (Continued). SuAsCo River Watershed 1996 Summer Lake Status.
Lake Location WBIDTrophic Status
Size (acres) Survey Observations
Saxonville Pond Framingham 82097 E 59.0
No apparent stain; slight turbidity; surface scum apparent; much partly decomposed organic matter on bottom; from bridge at the outlet about half of the observed width is very dense with submergent and/or floating leaf plants, for the remainder of the pond upstream the plant cover is very dense in beds that vary along both sides of the pond to the entire width; non-native aquatic and wetland species (Cc, Mq, Ls)
Smith Pond Northborough 82099 E 18.0
Slight stain; moderate turbidity (>1.2 m SD, est.); much organic matter on bottom; duckweed and algae mats on surface; lower end of the pond with very dense floating leaf, algal mats, and duckweed around perimeter and very dense submergent plants, upper end of the pond has very dense cover of floating leaf plants (about 1/2 to 2/3 of the surface affected); non-native wetland species (Ls)
Solomon Pond Northborough 82100 U 22.0
Clear; little turbidity; brown mucky bottom with some rocks and undecomposed matter; very dense emergent plant cover encroaching upon east and north shore, large patches of floating leaf plants along the northeast section and on the west shore (< 10% surface affected)
Stearns Mill Pond Sudbury 82104 E 19.0
Very turbid and covered with duckweed (< 1.2 m SD, est.); about 50% of the lower pond with a very dense cover of duckweed and algae; the upper end is 100% covered; non-native wetlands species (Ls)
Sudbury Reservoir*
Marlborough/Southborough 82106 U 1292.0
No stain; moderate yellow-green algal turbidity; light brown silt on bottom over rocks, some undecomposed organic debris; red-orange stain on rocks at some sites; yellow/white foam on shore in some areas; most of the reservoir has a sparse cover of surface plants, but there are occasional patches of floating leaf plants; non-native wetland species (Ls)
INFORMATION CODES: Italic= 2002 Integrated List Category 4c; Bold= 2002 Integrated List Category 5Trophic State-- O= Oligotrophic, M= Mesotrophic, E= Eutrophic, H= Hypereutrophic, U= Undetermined. Non-native Plants-- Cc= Cabomba caroliniana, Ec= Eichornia crassipes, Ls= Lythrum salicaria, Mq= Marsilea quadrifolia, Mh= Myriophyllum heterophyllum, Ms= Myriophyllum spicatum, M. sp.= possibly Myriophyllum heterophyllum (needs confirmation because insufficient key characteristics were observed to positively identify), Pa= Phragmites australs, Pc= Potamogeton crispus
SuAsCo Watershed 2001 Water Quality Assessment Report Appendix C C1082wqar DWM CN92.0
* Indicates Class A (water supply) water body; all others are Class B.
SuAsCo Watershed 2001 Water Quality Assessment Report Appendix C C1182wqar DWM CN92.0
Table C1 (Continued). SuAsCo River Watershed 1996 Summer Lake Status.
Lake Location WBIDTrophic Status
Size (acres) Survey Observations
Warners Pond Concord 82110 E 54.0
Moderate to heavy tea stain; slight to moderate turbidity; dark brown silt and decomposed debris over sandy bottom; encroaching emergent and floating leaf plants around entire pond, southern coves very dense with floating leaf plants, northwest and north shore covered with floating leaf plants, eastern side and middle between islands with occasional patches (about 50 – 75% of the surface affected); non-native aquatic and wetland species (Tn, Ls) and potentially another non-native aquatic species (M. sp.)
Waushacum Pond Framingham 82112 U 81.0
Slight stain; slight to moderate turbidity; organic debris over sand and gravel bottom; white foam on windward shore; very dense plant cover in the south cove, most of the pond with sparse surface cover; non-native aquatic and wetland species (Mh, Ls)
Westborough Reservoir* Westborough 82114 U 54.0
Clear; little turbidity; a few patches of floating leaf plants on west side, but mostly sparse throughout the pond
White Pond Concord 82118 U 43
Clear; little turbidity; very little silt on sand, gravel and rock bottom; spare surface aquatic plants throughout the pond
White Pond* Hudson/ Stow 82119 U 62.0
Clear; little turbidity; brown/green periphytic material on bottom vegetation over sand, also undecomposed matter; water level low (about 5-10’ of exposed shore); sparse surface plant cover throughout the pond
Whitehall Reservoir Hopkinton 82120 U 575.0
Clear; little turbidity; much undecomposed to decomposed organic matter on bottom and vegetation; very dense submergent and floating leaf plants near shore to about 200’out in southern basin, about 50% of the cove at the north end with dense to very dense floating leaf plants, most of the main basin open; non-native aquatic and wetlands species (Cc, Mh, Ls)
Williams Lake* Marlborough 82121 U 70.0Clear; slight turbidity; slight brown muck over gravelly bottom; sparse surface plant cover throughout the lake
SuAsCo Watershed 2001 Water Quality Assessment Report Appendix C C1282wqar DWM CN92.0
Myriophyllum heterophyllum (needs confirmation because insufficient key characteristics were observed to positively identify), Pa= Phragmites australs, Pc= Potamogeton crispus* Indicates Class A (water supply) water body; all others are Class B.
SuAsCo Watershed 2001 Water Quality Assessment Report Appendix C C1382wqar DWM CN92.0
Table C1 (Continued). SuAsCo River Watershed 1996 Summer Lake Status.
Lake Location WBIDTrophic Status
Size (acres) Survey Observations
Willis Pond Sudbury 82122 U 68.0
Dark tea stain; slight turbidity (+0.6 m SD measured but <1.2 m est.); slight brown silt over sandy bottom; very dense encroaching emergent and floating leaf plants around pond, particularly from the north side wetland area, sparse surface plant cover in the rest of the lake; non-native wetland species (Ls)
Winning Pond Billerica 82132 U 23.0
Dark tea stain; moderate turbidity (> 1.2 m SD, est.); undecomposed matter over sand, gravel, and rocks; very dense patches of floating leaf and emergent plants around about 75% of the shore (affecting <10% of the total area), northeast cove had a very dense plant cover; non-native aquatic and wetland species (Ec, Ms, Tn, Ls)
INFORMATION CODES: Italic= 2002 Integrated List Category 4c; Bold= 2002 Integrated List Category 5Trophic Status-- O= Oligotrophic, M= Mesotrophic, E= Eutrophic, H= Hypereutrophic, U= Undetermined. Non-native Plants-- Cc= Cabomba caroliniana, Ec= Eichornia crassipes, Ls= Lythrum salicaria, Mq= Marsilea quadrifolia, Mh= Myriophyllum heterophyllum, Ms= Myriophyllum spicatum, M. sp.= possibly Myriophyllum heterophyllum (needs confirmation because insufficient key characteristics were observed to positively identify), Pa= Phragmites australs, Pc= Potamogeton crispus* Indicates Class A (water supply) water body; all others are Class B.
2001In the SuAsCo Watershed baseline lake surveys were conducted in July, August, and September 2001 to coincide with maximum growth of aquatic vegetation, highest recreational use, and highest lake productivity. Five ponds, Assabet River Reservoir, Whitehall Reservoir, Willis Pond, Farm Pond, and Heard Pond, were sampled three times each (generally at monthly intervals). A technical memorandum by Dr. Mark Mattson and Albelee Haque (2004) entitled Baseline Lake 2001 Technical Memo provides details of sample collection methods, results, data, and aquatic plant maps for the lakes surveyed in the Westfield, Taunton, South Coastal, and SuAsCo Watersheds in 2001.
In situ measurements using the Hydrolab® (measures dissolved oxygen, water temperature, pH, conductivity, and depth and calculates total dissolved solids and % oxygen saturation) were recorded at various depths creating profiles at deep hole stations. In-lake samples were also collected and analyzed for alkalinity, total phosphorus, apparent color, and chlorophyll a (an integrated sample). Procedures used for water sampling and sample handling are described in the Grab Collection Techniques for DWM Water Quality Sampling Standard Operating Procedure and the Hydrolab® Series 3 Multiprobe Standard Operating Procedure (MA DEP 1999a and MA DEP 1999b). The Wall Experiment Station (WES), the Department’s analytical laboratory, supplied all sample bottles and field preservatives, which were prepared according to the WES Laboratory Quality Assurance Plan and Standard Operating Procedures (MA DEP 1995). Samples were preserved in the field as necessary, transported on ice to WES, and analyzed according to the WES Standard Operating Procedure (SOP). Both quality control samples (field blanks, trip blanks, and split samples) and raw water quality samples were transported on ice to WES on each sampling date. They were subsequently analyzed according to the WES SOP. Information about data quality objectives (accuracy, precision, detection limits, holding times, representativeness and comparability) is also presented in Appendix A. Apparent color and chlorophyll a were measured according to standard procedures at the MA DEP DWM office in Worcester (MA DEP 1999c and MA DEP 1999d). An aquatic macrophyte survey was conducted at each lake. The aquatic plant cover (native and
SuAsCo Watershed 2001 Water Quality Assessment Report Appendix C C1482wqar DWM CN92.0
non-native) and species distribution were mapped and recorded. Details on procedures used can be found in the Baseline Lake Survey Quality Assurance Project Plan (MA DEP 2001).
Data was excerpted from the Baseline Lake Survey 2001 Technical Memo and presented in tables C2 and C3.
Table C2. 2001 DEP DWM SuAsCo Watershed Baseline Lakes in situ Hydrolab® data
Date OWMID Time(24hr)
Depth(m)
Temp(C)
pH(SU)
Cond@ 25C(uS/cm)
TDS(mg/l)
DO(mg/l)
SAT(%)
Assabet River Reservoir (Palis: 82004)Unique_ID: W0938 Station: A Description: Deep hole, center of eastern lobe, Westborough
“##” = Censored data (i.e., data that has been discarded for some reason)“--“ = No data (i.e., data not taken/not required)“c” = greater than calibration standard used for pre-calibration, or outside the acceptable range about the calibration standard. “ m ” = method not followed; one or more protocols contained in the DWM Multi-probe SOP not followed, i.e. operator error (e.g.
less than 3 readings per station (rivers) or per depth (lakes), or instrument failure not allowing method to be implemented.“s” = field sheet recorded data were used to accept data, not electronically recorded using Multi-probe surveyor unit, due to
operator error or equipment failure.“ u ” = unstable readings, due to lack of sufficient equilibration time prior to final readings, non-representative location, highly-
variable water quality conditions, etc
SuAsCo Watershed 2001 Water Quality Assessment Report Appendix C C1582wqar DWM CN92.0
Table C2 (Continued). 2001 DEP DWM SuAsCo Watershed Baseline Lakes in situ Hydrolab® data
Date OWMID Time(24hr)
Depth(m)
Temp(C)
pH(SU)
Cond@ 25C(uS/cm)
TDS(mg/l)
DO(mg/l)
SAT(%)
Heard Pond (Palis: 82058)Unique_ID: W0944 Station: A Description: Deep hole, northeast quadrant of pond, Wayland
“##” = Censored data (i.e., data that has been discarded for some reason)“--“ = No data (i.e., data not taken/not required)“c” = Greater than calibration standard used for pre-calibration, or outside the acceptable range about the calibration standard. “i” = Inaccurate readings from Multi-probe likely; may be due to significant pre-survey calibration problems, post-survey
calibration readings outside typical acceptance range for the low inonic check and for the deionized blank water check, lack of calibration of the depth sensor prior to use, or to checks against laboratory analyses.
“ m ” = Method not followed; one or more protocols contained in the DWM Multi-probe SOP not followed, i.e. operator error (e.g. less than 3 readings per station (rivers) or per depth (lakes), or instrument failure not allowing method to be implemented.
“s” = Field sheet recorded data were used to accept data, not electronically recorded using Multi-probe surveyor unit, due to
SuAsCo Watershed 2001 Water Quality Assessment Report Appendix C C1682wqar DWM CN92.0
operator error or equipment failure.“ u ” = Unstable readings, due to lack of sufficient equilibration time prior to final readings, non-representative location, highly-
variable water quality conditions, etc
SuAsCo Watershed 2001 Water Quality Assessment Report Appendix C C1782wqar DWM CN92.0
Table C2 (Continued). 2001 DEP DWM SuAsCo Watershed Baseline Lakes in situ Hydrolab® data
Date OWMID Time(24hr)
Depth(m)
Temp(C)
pH(SU)
Cond@ 25C(uS/cm)
TDS(mg/l)
DO(mg/l)
SAT(%)
Willis Pond (Palis: 82122)Unique_ID: W0945 Station: A Description: Deep hole, southeast quadrant of pond, Sudbury
11:40s 1.5s 22.5s 5.8s 48.3s -- 6.3s 73s“##” = Censored data (i.e., data that has been discarded for some reason)“--“ = No data (i.e., data not taken/not required)“m” = Method not followed; one or more protocols contained in the DWM Multi-probe SOP not followed, i.e. operator error (e.g.
less than 3 readings per station (rivers) or per depth (lakes), or instrument failure not allowing method to be implemented.“s” = Field sheet recorded data were used to accept data, not electronically recorded using Multi-probe surveyor unit, due to
operator error or equipment failure.“u” = Unstable readings, due to lack of sufficient equilibration time prior to final readings, non-representative location, highly-
variable water quality conditions, etc
SuAsCo Watershed 2001 Water Quality Assessment Report Appendix C C1882wqar DWM CN92.0
Assabet River Reservoir (Palis: 82004)Unique_ID: W0939 Station: B Description: Center of lake, approximately 600 feet north of point on southern shore, Westborough
“ ** ” = Missing data (i.e., data that should have been reported) “--“ = No data (i.e., data that should have been reported)“ b ” = blank Contamination in lab reagent blanks and/or field blank samples (indicating possible bias high and false positives).“ d ” = precision of field duplicates (as RPD) did not meet project data quality objectives identified for program or in QAPP; batch samples may also be affected“ h ” = holding time violation (usually indicating possible bias low)
“ ** ” = Missing data (i.e., data that should have been reported) “--“ = No data (i.e., data that should have been reported)“ b ” = blank Contamination in lab reagent blanks and/or field blank samples (indicating possible bias high and false positives).“ d ” = precision of field duplicates (as RPD) did not meet project data quality objectives identified for program or in QAPP; batch samples may also be affected
“ ** ” = Missing data (i.e., data that should have been reported) “--“ = No data (i.e., data that should have been reported)“ b ” = blank Contamination in lab reagent blanks and/or field blank samples (indicating possible bias high and false positives).“f” = frequency of quality control duplicates did not meet data quality objectives identified for program or in QAPP
“ ** ” = Censored or missing data (i.e., data that should have been reported)“ -- ” = No data (i.e., data not taken/not required) “ b ” = blank Contamination in lab reagent blanks and/or field blank samples (indicating possible bias high and false positives).
ReferencesMA DEP. 1995 January Draft. Laboratory Quality Assurance Plan and Standard Operating Procedures. Massachusetts Department of Environmental Protection, Division of Environmental Analysis. Wall Experiment Station, Lawrence, MA.
MA DEP. 1999a. CN 1.0 Grab Collection Techniques for DWM Water Quality Sampling, Standard Operating Procedure. October 25, 1999. Massachusetts Department of Environmental Protection, Division of Watershed Management. Worcester, MA.
MA DEP. 1999b. CN 4.0 Hydrolab® Series 3 Multiprobe, Standard Operating Procedure. September 23, 1999. Massachusetts Department of Environmental Protection, Division of Watershed Management. Worcester, MA.
MA DEP. 1999c. CN 2.0 Apparent Color Standard Operating Procedures. Massachusetts Department of Environmental Protection, Division of Watershed Management. Worcester, MA.
MA DEP. 1999d. CN 3.0 Chlorophyll a Standard Operating Procedures. Massachusetts Department of Environmental Protection, Division of Watershed Management. Worcester, MA.
MA DEP. 2001. CN 65.0 Quality Assurance Project Plan for TMDL Baseline Lakes Survey 2001. Massachusetts Department of Environmental Protection, Division of Watershed Management. Worcester, MA.
Mattson and Haque. 2004. CN 167.0. Baseline Lake Survey 2001 Technical Memo.TM-S-16 Massachusetts Department of Environmental Protection, Division of Watershed Management. Worcester, MA.
SuAsCo Watershed 2001 Water Quality Assessment Report Appendix C C2982wqar DWM CN92.0
APPENDIX D
(Excerpted from Report #TM-82-8)
The Upper Concord WatershedResults of the 2001 Biomonitoring Survey
Robert M. NuzzoMassachusetts Department of Environmental Protection
Division of Watershed ManagementWorcester, MA
May 2004CN: 184.0
SuAsCo Watershed 2001 Water Quality Assessment Report Appendix D D182wqar DWM CN92.0
Table of Contents
Introduction........................................................................................................................ 3Methods............................................................................................................................. 5Results and Discussion......................................................................................................6
The Assabet River Basin.......................................................................................6NB (B0461)—North Brook, Berlin, MA..................................................................6ARW (B0466)—Assabet River, Westborough, MA................................................7HB (B0462)—Hop Brook, Northborough, MA........................................................8ARN (B0359)—Assabet River, Northborough, MA................................................8ARH (B0465)—Assabet River, Hudson, MA.........................................................9ARS (B0389)—Assabet River, Stow, MA............................................................10FMB (B0198)—Fort Meadow Brook, Hudson, MA...............................................11SB (B0463)—Spencer Brook, Concord, MA........................................................12The Sudbury River Basin....................................................................................12SRH (B0360)—Sudbury River, Hopkinton, MA...................................................12IB (B0202)—Indian Brook, Ashland, MA.............................................................13SRF (B0484)—Sudbury River, Framingham, MA................................................14LCA and LCB (B0464)—Lake Cochituate outlet to Sudbury River, Framingham,
Figure 1. Location of stream [sampling] sites....................................................................4Figure 2. Tiered Aquatic Life Use conceptual model ..........................................17
Table 1. Biomonitoring station descriptions.......................................................................3Table 2. Comparison of aquatic macroinvertebrate community attributes [1986/7 and
2001]................................................................................................................... 18Table A1. Break-down of habitat assessment scores.....................................................21Table B1. Benthic macroinvertebrate taxa list, counts, and metric values......................23Table B2. Summary of RBP metrics and final rankings...................................................26
SuAsCo Watershed 2001 Water Quality Assessment Report Appendix D D2
82wqar DWM CN92.0
Introduction
As part of the watershed assessment activities of the Department of Environmental Protection’s (DEP) Division of Watershed Management (DWM), benthic macroinvertebrate samples were collected in July 2001 from streams in the Assabet River and Sudbury River basins of the Concord Watershed. These biomonitoring samples were collected from 13 stations and analyzed to detect indications of the status of aquatic community health. The station locations are described in Table 1 and their positions within the watershed are shown in Figure 1.
Table 1. Biomonitoring station descriptions, listed from most upstream to most downstream (tributaries at point of confluence with the Assabet or Sudbury River).
Unique ID#
Station Stream Location descriptionDate
Sampled
B0466 ARW ASSABET RIVERdownstream/north from Fisher Street, Westborough, MA 18 July 2001
B0462 HB HOP BROOKapproximately 110 meters downstream/east from Otis Street, Northborough, MA 3 July 2001
B0359 ARN ASSABET RIVERdownstream/north from School Street, Northborough, MA 18 July 2001
B0461 NB NORTH BROOKapproximately 750 meters upstream/north from Randall Road, Berlin, MA 2 July 2001
B0465 ARH ASSABET RIVERapproximately 50 meters downstream/east from Broad Street, Hudson, MA 19 July 2001
B0389 ARS ASSABET RIVER upstream/north form Route 62, Stow, MA 19 July 2001
B0198 FMBFORT MEADOW BROOK
approximately 270 meters upstream/southwest from Shay Street, Hudson, MA 3 July 2001
B0463
SB SPENCER BROOKupstream from Barrett’s Mill Road, downstream from Angiers Pond, Concord, MA 3 July 2001
B0360 SRH SUDBURY RIVERupstream/west from Cordaville Road/River Street (Rte. 85) bridge, Hopkinton/Southborough, MA 19 July 2001
B0202 IB INDIAN BROOKapproximately 380 meters downstream/northeast from Cross Street, Ashland, MA 5 July 2001
B0484 SRF SUDBURY RIVERapproximately 300 meters downstream/southeast from Winter Street, Framingham, MA 19 July 2001
B0464 LCA & LCB
[Unnamed stream] unnamed tributary draining Lake Cochituate to Sudbury River, approximately 150 meters downstream from the
5 July 2001
SuAsCo Watershed 2001 Water Quality Assessment Report Appendix D D3
82wqar DWM CN92.0
Ass
abet
Riv
er B
asin
S
udbu
ry R
iver
Bas
in
lake outlet, Framingham, MA
B0199 PB PINE BROOKapproximately 100 meters downstream/southeast from Pine Brook Road, Wayland, MA 5 July 2001
Streams in these basins were sampled by comparable methods in 1986 (Nuzzo 1987), 1987 (Nuzzo 1989), and 1996 (Nuzzo 1996). Sampling locations in common with the 2001 sampling were:
ARW—Assabet River between Fisher Street and Maynard Street, Westborough, MA (1987)
ARN—Assabet River at School Street, Northborough, MA (1987) FMB—Fort Meadow Brook upstream from Shay Street, Hudson, MA (1996) SRH—Sudbury River upstream from Route 85, Southborough/Hopkinton, MA (1986) IB—Indian Brook downstream from Cross Street, Ashland, MA (1996) SRF—Sudbury River downstream from Winter Street, Framingham, MA (1986) PB—Pine Brook downstream from Pine Brook Road, Wayland, MA (1996).
The identifications of specimens from the 1996 data set were only taken to family, which limits the comparisons that can be made with the 2001 data. Taxonomy for the 1986, 1987, and 2001 samples was to genus or species whenever possible.
SuAsCo Watershed 2001 Water Quality Assessment Report Appendix D D4
82wqar DWM CN92.0
#
#
#
#
#
#
#
#
#
#
#
#
#
# B0463
#
B0464
#
B0202
#
B0360
#
B0466
#
B0462
#
B0359
#
B0461
#
B0465#
B0389
#
B0199#
B0198
#
B0484
ACTON
LOWELL
TEW KSBURYCHELMSFORDWESTFORD
BILLERICA
BEDFORD
CARLISLE
LITTLETON
HARVARD
BOXBOROUGH
LINCOLN
CONCORD
MAYNARD
STOW
BOLTON
CLINTON
HUDSON
SUDBURY
WAYLANDWESTON
NATICK
FRAMINGHAMSOUTHBOROUGH
MARLBOROUGHBOYLSTON
SHREW SBURY
GRAFTON
UPTONHOPKINTON
HOLLISTON
SHERBORN
ASHLAND
NORTHBOROUGH
WESTBOROUGH
BERLIN
N
3000 0 3000 6000 Meters
2 0 2 4 Miles
Figure 1. Location of stream sites where aquatic macroinvertebrate samples were collected in 2001 from the upper Concord River Watershed (Sudbury River and Assabet River basins).
SuAsCo Watershed 2001 Water Quality Assessment Report Appendix D D5
82wqar DWM CN92.0
Methods
As described in the Quality Assurance Project Plan (QAPP; DWM 2001) and standard operating procedures (Nuzzo 2003), aquatic macroinvertebrates were collected from wadable riffle habitat sites by kicking bottom substrates to dislodge the organisms. A kick-net with a 500 m mesh bag, pressed firmly against the stream bottom just downstream from the kicked area, was used to capture the organisms released to the current. Samples were composites of 10 kicks taken from approximate 0.46 m by 0.46 m areas (about 2 m2 total) of riffle habitat within a 100 m reach. Samples were preserved in the field with denatured 95% ethanol, then brought to the DWM lab for processing. Before leaving the sample reach, habitat data were recorded on field sheets and habitat qualities were scored using a modification of the evaluation procedure in Plafkin, et al. (1989). Sampling was conducted at 13 sites in the Assabet River and Sudbury River basins of the watershed from 2 July through 19 July 2001.Processing the benthos samples entailed extracting a count-based subsample from randomized grids within sorting pans. Specimens were sorted from the other materials in the sample until approximately 100 organisms (±10%) were extracted. Only specimens qualifying as members of the following groups were counted toward the subsample:
all aquatic Annelida; all aquatic Mollusca; aquatic macro Crustacea except Decapoda; aquatic Arachnida; and the aquatic life stages of Insecta, including adult Elmidae (Coleoptera) but excluding all
other adult Coleoptera and all Hemiptera.
Specimens were identified to genus or species, as allowed by available keys, specimen condition, and specimen maturity. Taxonomic data were analyzed using a modification of Rapid Bioassessment Protocol III (RBP) metrics and scores (Plafkin, et al. 1989). The modifications were: substitution of “reference site affinity” (RSA) for the Community Loss Index and elimination of the shredder/total ratio (no separate leaf-pack material was collected). The reference site affinity metric is a modification of Percent Model Affinity (Novak and Bode 1992). Instead of using the model’s percentages for Oligochaeta, Ephemeroptera, Plecoptera, Trichoptera, Coleoptera, Chironomidae, and “other,” these percentages were taken from the reference site data. The RSA score is then calculated as:
100 – Σ(δ x 0.5)
where δ is the difference between the reference percentage and the sample percentage for each taxonomic grouping. RSA percentages convert to RBP III scores as follows: <35% receives 0 points; 2 points in the range from 35 to 49%; 4 points for 50 to 64%; and 6 points if ≥65%. The whole suite of metrics used for the analysis were:
Richness (the total number of different species present), HBI (Hilsenhoff Biotic Index, as modified in Nuzzo 2003; HBI is the sum of the products of
the pollution tolerance values and the abundance of each of the taxa present divided by the total count in the subsample)
EPT (sum of richness among the orders Ephemeroptera, Plecoptera, and Trichoptera), EPT/Chironomidae (ratio of total abundance among EPT taxa to total abundance among
chironomid taxa), SC/FC (ratio of the proportion of sample that is represented by individuals that
predominantly feed by scraping to those that feed primarily by filter-feeding), % Dominant (most abundant taxon as a percent of the assemblage; >25% is generally
considered hyperdominant and indicative of a stressor impact), RSA (described above).
SuAsCo Watershed 2001 Water Quality Assessment Report Appendix D D6
82wqar DWM CN92.0
As a final step in sample processing, the sample remainder (the portion of the sample that was not encompassed in the subsampling) is scanned for taxa that were not encountered. Sometimes referred to as a “large/rare search,” this helps give a fuller picture of the diversity of aquatic macroinvertebrates in the riffle habitats sampled. Though not part of the RBP analysis, this information can be useful in water resource management deliberations. This additional count of taxa (subsample richness plus the number of additional taxa encountered during the “large/rare search”) is referred to here as apparent richness to distinguished it from the RBP Richness metric.
Results and Discussion
The Assabet River Basin
Eight locations in the Assabet River basin, including the reference site, were sampled in 2001; four of these were on the mainstem Assabet River. Habitat scores ranged from 136 to 184 out of 200 possible points (see Appendix A). Even the lowest scoring habitat among these sites was considered good enough to support an aquatic community as healthy as that of the reference site (Plafkin, et al. 1989). The list of taxa and their frequency in each of the samples can be found in Appendix B, Table B1. The benthos analysis resulted in all the sites in the Assabet drainage being classified Slightly Impacted or Moderately Impacted (Appendix B, Table B2).
NB (B0461)—North Brook, Berlin, MA
HabitatThe setting of this stream made it appear to be one of the better choices for a reference site in the upper Concord Watershed. Most of the upstream watershed was forested or agricultural land in Berlin, but a small portion of the drainage originated from a residential and commercial/industrial section of Clinton. The land surrounding the sample location off Alan Road in Berlin, MA was all forested.
No erosion or obvious nonpoint source (NPS) pollution problems were detected in the landscape surrounding the sample reach, though Alan Road and the railroad trestle were recognized as having such potential (mostly at upstream crossing points over tributary brooks). The stream width was about 3 m and the depth was fairly uniform at about 25 cm. The water was clear but had a slight tea color to it. The substratum composition throughout the reach was estimated as 10% bedrock, 40% boulder, 30% cobble, 10% pebble, and 10% gravel. Composition at kick sample points were similar but without bedrock (30% boulder, 40% cobble, 20% pebble, 10% gravel).
The trees in the riparian zone produced a canopy over 100% of the sample reach. The predominant trees present were Acer rubrum (red maple), Fagus sp. (beech), Pinus strobus (white pine), and Betula sp. (birch). The understory was essentially all herbaceous, with mosses, several species of ferns, Symplocarpus foetidus (skunk cabbage), and Impatiens sp. (jewel weed) most prominent. About half the sample reach was covered with instream vegetation; nearly all of it moss but with Callitriche sp. (water starwort) and liverworts present, also. No algae were observed.
All habitat parameters in the habitat assessment scored in the “optimal” range except Velocity-Depth Combinations, which scored as suboptimal. Any portion of the sample reach that might have been considered to qualify as “deep” was limited, but was probably mostly adequate for fish passage. The overall habitat score was 180/200.
SuAsCo Watershed 2001 Water Quality Assessment Report Appendix D D7
82wqar DWM CN92.0
BenthosAt the time of sample collection, stonefly nymphs were easily detected in the catch and sponges were observed on the underside of rocks. Consistent with the expectations for a “least impacted” reference site, the benthos data from the sample exhibited a number of attributes associated with good water quality. The total richness was high (34) as was the number of EPT taxa (13); and HBI (3.86) and % dominance (16%) were low. These indicate a well-balanced community dominated by pollution sensitive organisms. The assessment score for the reference was set at six points for each metric, giving a total of 42. A search of the portion of sample not included in the subsample yielded an additional four taxa: Cordulegaster sp. (Odonata), Anchytarsus sp. (Coleoptera), Antocha sp. (Diptera), and Atherix sp. (Diptera). If included, these taxa would have increased the total richness to 38.
The good quality habitat and the indications of a diverse and healthy aquatic macroinvertebrate community mark North Brook and its environs as an exceptional component of the upper Concord Watershed. As such it merits special consideration for protection.
ARW (B0466)—Assabet River, Westborough, MA
HabitatWhen conducting reconnaissance for sampling sites on 27 June 2001, the stretch of the Assabet River extending upstream for about 150 m from Fisher Street toward Mill Street was characterized as having excellent aquatic habitat. The riparian zone was, for the most part, wooded and reasonably well buffered from all but one house and yard at the Mill Street end of the reach. Riffles and cobble substrates predominated instream, making this an ideal location for application of the RBP sampling protocols. Upon returning to sample on 18 July 2001, however, water levels in the river had dropped substantially. Barely a trickle of water escaped the Nichols dam at the A-1 Impoundment, leaving a mostly dry streambed between Mill Street and Fisher Street, with shallow pools barely connected by very shallow, narrow bands of flowing water. These were, in fact, too shallow to sample with a kick-net.
Sampling was conducted, instead, immediately downstream from Fisher Street, where there was just enough riffle habitat with sufficient depth to allow water to flow through the kick-net. Substrates in these riffles were characterized as 60% cobble, 20% pebble, and 20% sand and gravel. While no obvious signs of erosion were detected, there were deposits of sand instream—presumably with origins farther upstream. Some trash, probably tossed from the Fisher Street bridge, littered the reach. The water here lacked any obvious turbidity or color.
The riparian zone of both banks was wooded with mixed hardwoods, producing a canopy that was about 75-80% closed over the stream. There was a well-developed shrub layer that was extensively covered with grape vines (Vitis sp.). Moss was the only instream vegetation and covered only about 10% of the sample reach.
The habitat score demonstrated that the biggest habitat problem was related to low water. Cover for fish was virtually unavailable (although some small bullheads were caught in the kick-samples) in the shallow water. Velocity depth patterns were reduced to two (shallow/fast and shallow/slow), resulting in a score in the Marginal category. Channel flow status also scored as Marginal because only about a quarter of the channel had water in it. The total habitat score was 138 out of 200.
BenthosWith Richness of only 12 (35% of the reference), an EPT index of 7 (little more than half that of the reference station, and lacking Plecoptera—stoneflies), and an increase in the HBI relative to the reference station suggest this site may be under stress from organic enrichment. The total assessment score was 24, which was 62% of the possible total score of 42, placing this site in the category of Slightly Impacted. As this site had one of the lowest habitat scores, and clearly has
SuAsCo Watershed 2001 Water Quality Assessment Report Appendix D D8
82wqar DWM CN92.0
substantial fluctuations in flow volume, it is likely that the indications of ecosystem stress result from the combined effects of enrichment, habitat, and flow fluctuations. A post-processing search of the remainder sample turned up isopods (scuds) and hydrachnids (water mites), increasing the apparent richness to 14.
HB (B0462)—Hop Brook, Northborough, MA
HabitatHop Brook drains portions of eastern Shrewsbury and western Northborough to Smith Pond in Northborough, MA. From the Smith Pond dam at Otis Street, Hop Brook flows through an old stone mill sluice for about 50 m before abruptly forming a pair of reflexed bends (an “S” curve). The remaining 2 km (1.2 mi.) of the brook’s course to the Assabet River is through a very low gradient, wetland landscape. Sampling for aquatic macroinvertebrates was conducted in the riffles amid the initial pair of bends in the brook downstream from Smith Pond. There was some slight erosion observed, particularly near the top of the reach along the southern bank. Trash littering the sample (mostly scrap wood) and the presence of geese upstream from Otis Street suggested potential sources of NPS pollution. The water did not appear to be colored but was slightly turbid. The substratum composition for the reach as a whole was estimated as 10% boulder, 20% cobble, 40% pebble, and 30% sand and gravel. The composition in the kick-sample areas was characterized the same except no boulders were encountered and cobble was about 30%.
The riparian zones were wooded, mostly with Fraxinus sp. (ash) and Acer sp. (maple), forming a canopy over about 85% of the stream. The underlying woody species included Sambucus sp. (elderberry), Rosa sp. (rose), Vitis sp. (grape), and Rhus radicans (poison ivy). Included among the herbaceous cover were ferns, Symplocarpus foetidus (skunk cabbage), Lythrum salicaria (purple loosestrife), Typha sp. (cat-tail), and Sparganium sp. (bur-reed). Only about 20% of the reach was covered by instream vegetation; about half of that was moss and the remainder was submergent rooted species, including Myriophyllum sp. (water milfoil), Elodea sp. (waterweed), and Callitriche sp. (water starwort). Some Lemna sp. (duckweed) was observed on the water’s surface.
All the habitat features covered by the habitat assessment scored within the Optimal range. The total habitat score was 183/200.
BenthosDuring sample collection crayfish and sponges were observed in the reach. Analysis of the sample produced results for Richness, HBI, EPT, and RSA that were deficient in comparison to the reference site. The total RBP score for this site was 30, which fell in the range for Slightly Impacted. Given how good the habitat was in this reach it is somewhat surprising that the RBP results weren’t more comparable to the reference. This may be a warning signal of possible NPS impacts from the impoundments and/or land uses in Hop Brook’s watershed.
The post-processing visual scan of the sample turned up specimens of Zygoptera (damselflies) and Limnephilidae (a family of case-building caddisflies), boosting the apparent richness to 24.
ARN (B0359)—Assabet River, Northborough, MA
HabitatBetween Maynard Street in Westborough and School Street in Northborough the Assabet River flows through an extensive wetland corridor, picking up flow from the Westborough/Shrewsbury wastewater treatment plant (WWTP) as well as from Hop Brook and several small tributaries. Through much of the year the Westborough/Shrewsbury WWTP contributes the major portion of the river’s volume in this stretch. From the WWTP to School Street the river is fairly uniformly wide and slow-moving.
SuAsCo Watershed 2001 Water Quality Assessment Report Appendix D D9
82wqar DWM CN92.0
Kick-samples for aquatic macroinvertebrates were collected just downstream from the School Street bridge, where the gradient increased enough over a short distance to create riffle habitat. Through this stretch of riffle substratum composition was estimated as 40% boulder, 40% cobble, and 20% gravel and sand. The surrounding land use was characterized as 40% forested, 30% residential, and 30% recreational (golf course). There were no obvious signs of erosion problems and the road and golf course were identified as having NPS pollution potential—although along the sample reach the golf course was separated from the river by a fence and a vegetated buffer zone (a little farther downstream the river flows right through the golf course). The water had a “treated sewage” odor, was slightly turbid, and had a moderately dense greenish-brown color.
Trees and shrubs produced a canopy over about 80% of this constricted section of the river, in spite of accounting for only 10% and 20% of the riparian vegetation, respectively. This was due to being concentrated along the margins of the stream. The 70% that was herbaceous growth was mostly beyond the shrubby cover lining both banks. Mowing of herbaceous cover on both banks to within 6-12 m of the stream resulted in substantially reduced points for riparian vegetative zone width when calculating a habitat score for this site. No instream vascular plants or algae were observed within the sample reach.
Though the epifaunal substratum composition in the riffles was “optimal,” sediment deposition and embeddedness scored in the “suboptimal” range. This implies an unfavorable impact on the suitability of the substratum to support a diverse community of benthic invertebrates by virtue of diminishing substrate heterogeneity and reducing the median particle size (Minshall 1984). Channel alteration also scored as suboptimal, though in this case it is likely that the bridge abutment and riprapping were mainly responsible for the presence of riffle habitat here. The total habitat score was 154/200.
BenthosRichness was lower here than at the reference station, and the EPT index was among the lowest from the survey. At that, 49 of the 51 EPT individuals were the filter-feeding hydropsychid caddisflies—Hydropsyche betteni (27% of total) and Cheumatopsyche sp. (24% of total). Though the constituents of the EPT orders are typically pollution intolerant organisms, the hydropsychids tend to have moderate pollution tolerances and tend to proliferate when there is a rich supply of suspended organic matter. This is reflected in the increased HBI (5.35), indicating a moderate stress from organic enrichment. Though all of these metrics point to enrichment-related water quality degradation, the assessment score placed this site in the Slightly Impacted category. This result is not as bad as might have been expected, considering the proportion of the river’s flow that is from wastewater.
No additional taxa were enumerated as a result of the large/rare search.
ARH (B0465)—Assabet River, Hudson, MA
HabitatIn the 50 m immediately below Broad Street in Hudson, MA there was sufficient wadable riffle habitat to allow application of the RBP III sampling protocol. This location (coupled with station ARS on the downstream side) served as an upstream bracket on the Hudson WWTP. The river was about 15 m wide here. The water depth ranged from about 0.5 m to 0.75 m, with the deepest water encountered along the margin.
The land use in the surrounding riparian areas was 90% residential (though a little farther upstream land use is at least 50% commercial/industrial) and the remaining 10% woodlot. Canopy cover was essentially 0%. There was slight erosion observed at this site, as well as obvious indications of NPS pollution (yard waste from some of the adjacent residences, evidence of run-off from the road and bridge abutment areas). Instream there were prominent deposits of
SuAsCo Watershed 2001 Water Quality Assessment Report Appendix D D10
82wqar DWM CN92.0
sand and trash. The substratum composition throughout the reach was estimated as 5% boulder, 30% cobble, 5% pebble and gravel, 50% sand, and 10% silt. By contrast, the composition where the actual kick-samples were taken was 10% boulder, 50% cobble, 10% pebble and gravel, 20% sand, and 10% silt.
Riparian zone vegetation was mostly herbaceous, primarily grasses, Lythrum salicaria (purple loosestrife), and Peltandra viginica (arrow arum). Woody cover was restricted, but included Salix sp. (willow), Pinus strobus (white pine), Rhus typhina (sumac), and Vitis sp. (grape). The stream bottom was about 70% covered with aquatic vegetation, most of it rooted submergent forms such as Potamogeton sp. (pondweed), Elodea sp. (waterweed), Myriophyllum sp. (water milfoil), and Callitriche sp. (water starwort). Mosses and rooted emergent aquatic plants were also present, as were the free-floating Lemna sp. (duckweed) and Wolffia sp. (watermeal). Filamentous and thin-film green algal growth covered about half the area of the reach.
The habitat scoring indicated that habitat quality suffered most from channelization, moderate deposition of sand, and having a riparian vegetative zone with limited protective capabilities due to human activities. The overall habitat score was 136/200.
BenthosAs with the preceding upstream station (ARN), total and EPT richness were low in this sample, and the filter-feeding caddisfly Hydropsyche betteni was again hyperdominant (35% of the total). In addition, the HBI was high (the highest of any of the stations in the survey) and the ratio of scrapers to filtering collectors was low compared to the reference station, or even the next upstream station. This indicated a more degraded condition than upstream and resulted in a lower overall RBP score and an assessment of Moderately Impacted, again with organic enrichment implicated.
No additional taxa were enumerated as a result of the large/rare search.
ARS (B0389)—Assabet River, Stow, MA
HabitatAs the Assabet River flows from Hudson it receives the effluent from the Hudson WWTP. Entering Stow the river flows into an impounded wetland before wrapping around Orchard Hill to spill over the dam and flow past the Gleasondale Mill. In so doing, the river changes its direction of flow from mostly northeasterly (on the west side of Orchard Hill) to just about due south (on the east side of Orchard Hill and Gleasondale Mill). From the dam to Route 62 the river has a steep enough gradient to create a continuous, fast-flowing riffle reach, with the wall of the mill on one side and a wooded bank on the other. When the river passes under Route 62 it bends sharply to the east, the flow velocity slows way down, and the river widens. Sampling was conducted just upstream from Route 62 (about 5.6 km, or 3.5 mi, downstream from ARH). Several residences were located on the east bank just beyond the top of the sample reach. No evidence of erosion was detected within the sample reach but the adjacent mill and nearby road crossings were acknowledged as potential nonpoint sources of pollution. The river was about 12 m wide here, with depths between 0.25 m and 0.5 m. Bottom substrates were a good mix of boulder, cobble, and pebble, with sand and gravel accounting for only about 10% of the total. There was some coating of substrates with fine particulate organic matter (FPOM), but most of the organic substrate material was coarse particulates (CPOM). There was no color to the water and no surface oils, but a sewage odor was detected and the water was slightly turbid.
The trees, mostly silver maple (Acer saccharinum), along the east bank produced a canopy over about 50% of the stream channel. Other conspicuous woody vegetation included sumac (Rhus typhina), grape (Vitis sp.), and poison ivy (Rhus radicans). The remainder of the riparian zone vegetation appeared primarily to be moss and loosestrife (Lythrum salicaria). Instream vegetation was present in roughly 70% of the sample reach. About 10% of this vegetation was
SuAsCo Watershed 2001 Water Quality Assessment Report Appendix D D11
82wqar DWM CN92.0
rooted emergent forms, such as arrow arum (Peltandra virginica) and pickerelweed (Pontederia cordata); 70% were rooted submergents such as Potamogeton sp., Myriophyllum sp., and Elodea sp. The free-floating Lemna sp. could be seen over about 20% of the sample reach at any given moment. Thin film green algae were found on rocks in less than 5% of the sample reach.
The bottom substrates, current velocity, and the availability of benthic habitat (minimal amounts of exposed bottom substrate) made for excellent habitat for aquatic macroinvertebrates. The only deficiencies reflected in the habitat score had to do with the channelization of the reach and the restriction of riparian vegetation as a result of human activities. The overall habitat score for this sampling site was 150/200.
BenthosMost of the metrics for these data were comparable to the next upstream site (ARH). Nearly all the metrics (the EPT/Chironomidae abundance ratio being the exception) indicated this site was still degraded compared to the reference station, and indeed the RBP score ranked it as Moderately Impacted.
No additional taxa were enumerated as a result of the large/rare search.
FMB (B0198)—Fort Meadow Brook, Hudson, MA
HabitatSampling was conducted in a stretch of this stream where it flows between Gospel Hill and Whitney Hill. When this site was sampled in 1996 it was observed that it appeared that house lots were being cleared along the brook. In fact, in 2001 we observed three new homes along or at the head of the sample reach. These residential properties accounted for about 30% of the surrounding land use, the remainder was forest. There were no signs of erosion, though there were deposits of sand on the stream bottom. Obvious sources of NPS pollution were debris related to yard grooming/maintenance. No water odors, color, or turbidity were detected. The stream was about 4 m wide and depths ranged from about 0.25 m to 0.30 m. The substratum composition throughout the reach was estimated as 20% boulder, 10% cobble, 10% pebble, 10% gravel, and 50% sand. Within the actual kick sample areas, however, the composition was 50% boulder, 30% cobble, 10% pebble and gravel, and 10% sand.
Trees provided a canopy over about 95% of the stream channel in the sampling reach. The most conspicuous trees were ash (Fraxinus sp.), red maple (Acer rubrum), oak (Quercus sp.), and white pine (Pinus strobus). Elderberry (Sambucus sp.) was the only shrub recorded and the herbaceous layer was overwhelmingly ferns, though some skunk cabbage (Symplocarpus foetidus) was also noted. Instream vegetation covered only about 5% of the sample reach, and all of it was mosses and liverworts.
Stable instream fish cover was limited to approximately 30% of the reach but epifaunal substrates were generally pretty good. Deposition of sand and the associated embeddedness of substrates compromised the habitat potential of the larger substrates. Disruption of the riparian zone along the north bank where the residential development has taken place is reflected in the low scores for bank vegetative protection, bank stability, and riparian vegetative zone width. The overall habitat score was 140/200.
BenthosRichness, EPT, % Dominance, and RSA were the metrics that lost points in the RBP evaluation of this site. For the most part the degree of degradation indicated was mild. The RBP score ranked this site as Slightly Impacted.
The large/rare search detected an aeshnid dragonfly nymph and a nematode. Only the dragonfly would be counted toward richness so the apparent richness is increased from 22 to 23.
SuAsCo Watershed 2001 Water Quality Assessment Report Appendix D D12
82wqar DWM CN92.0
SB (B0463)—Spencer Brook, Concord, MA
HabitatThe section of Spencer Brook between Angiers Pond and Barrett’s Mill Road was slated for sampling in 1996 but had to be dropped when, on the July sampling date, it was discovered the streambed was nearly 100% exposed (i.e., water could only be found in a few isolated puddles in this reach). When sampled on 3 July 2001 there was sufficient water present to cover the 4 m wide channel and provide a depth of from 0.5 m to 0.75 m. The land surrounding the sample reach was all forested, with no evidence of erosion or NPS pollution inputs.
The streambed in the reach was dominated by cobble and boulder (together 75-80% of the composition) and large woody snags contributed notably to available fish cover. The water had no detectable odors but there was a tea-stained color to it as well as a slightly turbid appearance.
There was a tree canopy over about 95% of the stream channel. Trees noted in the surrounding landscape included birch (Betula sp.), white pine (Pinus strobus), red maple (Acer rubrum), and elm (Ulmus sp.). As components of the understory, elderberry (Sambucus sp.), ferns, moss, and skunk cabbage (Symplocarpus foetidus) were recorded. About 60% of the reach had aquatic vegetation. Most of the aquatic vegetation was mosses but water milfoil (Myriophyllum sp.) and duckweed (Lemna sp.) were also present. No algae were seen.
The features of this sample reach led to optimal ratings in all the habitat categories except embeddedness—which was just high enough to make it fall into the suboptimal category. This embeddedness may indicate run-off problems upstream of the sample reach (though no potential problem areas, other than the road crossing at the dam, were noted at the time of sampling). The habitat ranking for this site was one of the two best encountered during the 2001 survey of the upper Concord Watershed. The overall habitat score was 184/200.
BenthosHBI, EPT, and the EPT/Chironomidae ratio were the most strongly affected metrics for this site. Total richness and the SC/FC ratio, though, were sufficiently lower than at the reference site to result in point reductions. The RBP ranking for this site was Slightly Impacted. The relatively high HBI and the relatively low EPT index—and the fact that not a single mayfly (Ephemeroptera) or stonefly (Plecoptera) was among the five EPT taxa—however, appears to be a strong signal for organic enrichment and potential adverse impacts on the aquatic biota.
The Sudbury River Basin
Five locations in the Sudbury River basin were sampled in 2001; two of these were on the mainstem Sudbury River. Habitat scores ranged from 165 to 185 out of 200 possible points (see Appendix A). These scores were comparable to the reference site, indicating that habitat quality should not be regarded as a limiting factor to the development of an aquatic community as healthy as that of the reference site (Plafkin, et al. 1989). The analysis of the benthic macroinvertebrate samples from the Sudbury drainage resulted in a rating of Moderately Impacted for two sites and Slightly Impacted for the other three (Appendix B, Table B2).
SRH (B0360)—Sudbury River, Hopkinton, MA
HabitatApproximately four kilometers downstream from where the Sudbury River exits Cedar Swamp and emerges from under Interstate 495, this was the farthest upstream station sampled in the Sudbury River drainage. For much of this distance the river is very low gradient (no more than
SuAsCo Watershed 2001 Water Quality Assessment Report Appendix D D13
82wqar DWM CN92.0
about 0.2%) with a wetland floodplain. The sample reach, however, was a segment between the outlet of a small impoundment and Route 85 where the gradient became steeper (1%) where the river was wadable and there was good riffle habitat with large substrates (nearly all cobble and boulder). The surrounding land use was mostly described as forested (60%) but the adjacent roadway encroached considerably on the riparian zone of one bank, representing about 40% of the total riparian zone area along the sample reach. No signs of erosion were detected in the reach but the adjacent roadway and upstream construction activities were identified as having potential as sources of NPS pollution. The water was turbid but no odors were detected. The river was about 3 m wide and water depths were generally between 0.2 m and 0.4 m.
The trees in the riparian zone produced a canopy cover of about 95%. The trees present were predominantly ash (Fraxinus sp.), maple (Acer sp.), and birch (Betula sp.). Shrubs and other woody vegetation included elderberry (Sambucus sp.), grape (Vitis sp.), and poison ivy (Rhus radicans). Herbaceous cover recorded from the riparian zone was ferns and cardinal flower (Lobelia cardinalis). The only instream vegetation was moss, but it covered about 85% of the reach. No algae were observed.
The habitat assessment rated all but three parameters as optimal. Scores in the suboptimal range were given for channel alteration (because of past channelization and bank reinforcement), velocity-depth combinations (one of the four categories was restricted or absent), and riparian vegetative zone width (the road encroached to within 18 m along one side of the river). Overall this was very good riffle habitat for both fish and aquatic invertebrates and received a total score of 179/200.
BenthosDue to an elevated HBI, reduced total and EPT richness, and hyperdominance (by a filter-feeding caddisfly, Chimarra sp.), this site ranked no better than Slightly Impacted. Next to the reference station, however, this site had the highest EPT index and was the only site in this survey to score any points for the EPT index. Nevertheless, these findings should be regarded as signals of potential long-term threat from organic enrichment.
Crayfish and sponges were observed while sampling at this station. The large rare search on the processed sample resulted in detection of the following additional qualifying taxa: Hydrachnidia (aquatic mite), a very large Corydalidae (hellgrammite), Promoresia sp. (an elmid beetle), and a tipulid (cranefly). Adding these to the richness metric would give an apparent richness of 27.
IB (B0202)—Indian Brook, Ashland, MA
HabitatThe sampling site on this brook was within 400 m downstream from Cross Street in a segment of steep gradient with a series of cascading riffles and small plunge pools. It was set in a forested landscape without evidence of damming or channel alteration except for the small wooden bridge (perhaps strong enough to support an automobile) built across it. The stream was about 4 m wide and water depths varied from 0.25 m to 0.5 m. No evidence of erosion or NPS problems was detected, but the upstream road crossings and nearby new home construction were noted as having NPS pollution potential. The water had no detectable odors, was clear, and had no discernable color. Boulders and cobble accounted for about 80% of the bottom substrate materials.
Riparian zone trees included maple (Acer sp.), birch (Betula sp.), ash (Fraxinus sp.), and hemlock (Tsuga canadensis). The only woody growth recorded in the understory was poison ivy (Rhus radicans). Components of the ground cover were ferns, Japanese knotweed (Polygonum cuspidatum), skunk cabbage (Symplocarpus foetidus), and moss. Instream moss was the only vegetation, covering roughly 50% of the reach. No algae were seen.
SuAsCo Watershed 2001 Water Quality Assessment Report Appendix D D14
82wqar DWM CN92.0
Each category of the habitat assessment scored in the optimal range, giving this site the highest score for any of the sample sites in the 2001upper Concord Watershed survey. The overall score was 185/200.
BenthosIndian Brook had the lowest HBI (higher values indicate organic enrichment) of any of the sites in this survey, including the reference. The total richness was among the highest of the sample sites but was still only 68% of the reference site richness, and EPT was less than half that of the reference site. The scraper to filter-feeder ratio (SC/FC) was relatively low and the capniid stoneflies were hyperdominant. In spite of the fact the scores for these metrics were reduced enough to result in a RBP ranking of Slightly Impacted, the low HBI and the hyperdominance by a sensitive stonefly (Capniidae) known to sometimes occur in high densities indicate that organic enrichment is not likely as a problem here. In fact, field notes indicate that there may have been a problem with sampling efficiency because of the number of large, difficult to move/difficult to sample, boulders.
SRF (B0484)—Sudbury River, Framingham, MA
HabitatWithin about 300 m downstream from Winter Street and the Sudbury Reservoir #1 (Stearns Reservoir) dam was a stretch of the river that was within a wooded landscape with fast-flowing current and coarse substrates (5% boulder, 40% cobble, 30% pebble, and only 25% sand and gravel). About 40% of the organic particulates were fines (FPOM) that coated the substrates. There was no indication of erosion or NPS inputs from the land areas adjoining the sample site. The river was about 6 m wide with depths of from 0.25 m to 0.35 m in the riffles/runs and up to 0.5 m in the pools. No odors were associated with the water here but it was slightly turbid.
Oak (Quercus sp.), white pine (Pinus strobus), and ash (Fraxinus sp.) populated the riparian zone and contributed to the canopy reaching over roughly 70% of the channel. Elderberry (Sambucus sp.) and grapes (Vitis sp.) were the only woody components of the understory, while the herbaceous cover was mostly jewelweed (Impatiens sp.), loosestrife (Lythrum salicaria), and moss. The instream vegetation was milfoil (Myriophyllum sp.) but that was present in no more than 5% of the sample reach. No algal growths were seen.
The habitat scoring identified three deficiencies. Stable fish cover (marginal) was present in only about 30% of the area, sediment deposition (suboptimal) affected more than 5% of the area, and only two velocity/depth combinations (marginal) were observed. All other habitat characters scored in the optimal range. The total habitat score was 166/200.
BenthosIn the field this site was impressive because of the abundance of large bryozoan colonies, sponges, unionid mussels, pisidiid clams, and hydropsychid caddisflies. Based on analysis of the sample, degradation of water quality at this site was indicated by the high HBI, low richness, low EPT index, and low SC/FC ratio, along with hyperdominance of both Hydropsyche betteni (37%) and pisidiid clams (30%). The preponderance of filter feeding organisms (82%) in the sample and the high HBI, in particular, are classic traits of lotic communities downstream from productive impoundments. The RBP scoring ranked this site as Moderately Impacted.
No additional taxa were picked up from the large rare search.
SuAsCo Watershed 2001 Water Quality Assessment Report Appendix D D15
82wqar DWM CN92.0
LCA and LCB (B0464)—unnamed stream connecting Lake Cochituate outlet to Sudbury River, Framingham, MA
HabitatLake Cochituate drains to the Sudbury River via an unnamed stream (about 2.3 km—1.4 mi.—from lake outlet to confluence with the Sudbury) flowing between the north side of Massachusetts Turnpike (I-90) interchange 13 and a residential area in Framingham, MA. The sample reach was about 150 m downstream from the lake outlet, the width was roughly 5 m, and the depths ranged from around 0.3 m to 0.5 m. The reach was essentially a long riffle/run of varying depths, with better riffle habitat near the top of the reach. Bottom substrate composition over the entire reach was estimated to be 65% gravel and sand and only 35% pebble or larger materials. In the swift current where the kick samples were collected, however, the gravel and sand accounted for 40% of the bottom composition and cobble and pebble for 60%. The water had a fish odor and was slightly turbid. No color or surface oils were detected. Slight erosion was noted along both banks, and the highway interchange was acknowledged as having potential as a source of NPS contamination.
The riparian zone was mostly forested and produced a canopy extending above approximately 80% of the stream channel. Trees recorded from the riparian zone were red maple (Acer rubrum), oaks (Quercus sp.), white pine (Pinus strobus), and white birch (Betula papyrifera). The shrubs and vines present were elderberry (Sambucus sp.) and grapes (Vitis sp.). The ground cover consisted of mosses, ferns, grasses, and jewelweed (Impatiens sp.). No aquatic vegetation was found anchored in the sample reach but fragments of Elodea sp. did float through—presumably dislodged from somewhere in the lake. Thin-film green algae were observed on rocks in about 10% of the reach. All rated habitat parameters ranked in the optimal range except bank stability, which scored as suboptimal because of the observed small areas of erosion. The total habitat score for this site was 175/200.
BenthosWhile in the field collecting this sample it was clear that the hydropsychid caddisflies were in very high densities. The sample was so overwhelmed with hydropsychid caddisfly larvae (92%) that two subsamples were picked. The second subsample was picked excluding all hydropsychids to reveal any attributes of the community structure or collective tolerance that might be masked by the extremely dense populations of hydropsychids.
The subsample including the hydropsychids—LCA—had the lowest richness encountered in the survey and the only EPT taxa found were hydropsychid species (Hydropsyche betteni and Cheumatopsyche sp.); the HBI was the second highest from the survey (the highest HBI being for its companion subsample, LCB); and it had the most extreme hyperdominance of the survey (Hydropsyche betteni—73% of the assemblage). Without including the hydropsychids (subsample LCB) the number of taxa counted almost doubled, but there were no other EPT taxa found and the HBI increased. The RSA values for these two subsamples were the lowest for the survey. Even with the hydropsychids excluded, one taxon (Gammarus sp.) emerged as hyperdominant (29%) over the other taxa present. The RBP score using just LCA was borderline Moderately Impacted/Severely Impacted. With the exclusion of the hydropsychids, LCB scored little better, but fell within the range for Moderately Impacted. Like the Sudbury River downstream from Winter Street, the dominance by filter feeders (and in this case, the exceptional hyperdominance by a single species of filter feeding caddisfly—H. betteni) and the high HBI values obtained for this site are characteristic of benthic communities in riffle habitats downstream from very enriched impoundments.
SuAsCo Watershed 2001 Water Quality Assessment Report Appendix D D16
82wqar DWM CN92.0
PB (B0466)—Pine Brook, Wayland, MA
HabitatThe sample reach was located in a forested landscape almost 200 m downstream from Pine Brook Road. This reach was away from the influences of artificial channel alterations and no evidence of erosion or NPS pollution in the surrounding area was observed. The upper reaches of this brook, however, historically have had NPS inputs (Nuzzo 1996)—most notably from a farm where cows had direct access to the headwater impoundment and were observed standing in the water (this was observed again in 2001).
At the sample reach the brook was about 2 m wide and very shallow, from less than 0.25 m up to 0.30 m deep. Substratum composition in the reach was much finer than the other sites in the survey: 70% was gravel or finer particles; whereas in the riffles areas actually sampled only about 45% of the substrates were gravel or smaller, 40% was pebble, and 15% was cobble. No odors, surface oils, turbidity, or color were detected from the water.
The canopy was completely closed (100% canopy) over the brook. The riparian zone trees were mostly slippery elm (Ulmus rubra), maple (Acer sp.), ash (Fraxinus sp.), and oak (Quercus sp.). In the understory were elderberry (Sambucus sp.), rose (Rosa sp.), and grape (Vitis sp.). Included among the non-woody ground cover were ferns, skunk cabbage (Symplocarpus foetidus), jewelweed (Impatiens sp.), and moss. Moss was the only instream vegetation but it covered less than 5% of the reach. Thin-film green algae were found attached to rocks, also in less than 5% of the reach.
Sediment deposition affecting almost 30% of the stream bottom led to a score in the low suboptimal range for that parameter. Velocity/depth combinations scored in the marginal range, due mainly to the fairly uniformly shallow water depth. All other habitat characters scored within the optimal range. The overall habitat score was 165/200.
BenthosThough the total richness at this site was matched by four other sites for the second highest number of taxa present, it was still only 68% of the reference site’s richness. The number of EPT taxa was less than a third of the reference site and there was slight hyperdominance (22% Tvetenia bavarica gr.). The RBP score for this site was in the range for Slightly Impacted. In a similar fashion to Spencer Brook (SB) in the Assabet drainage, the low EPT index (with an absence of Ephemeroptera and a paucity of Plecoptera) coupled with the relatively high HBI serve as a signal of organic enrichment and the potential for ensuing degradation.
Conclusions
The outcome of the 2001 biological assessment of the streams in the upper Concord Watershed is plotted against a proposed conceptual model that relates the response of aquatic communities to increasing human disturbance (Figure 2). It incorporates both the biological impact categories (non-, slightly, moderately, severely impacted) outlined in the RBP III biological assessment and the Tiered Aquatic Life Use (TALU) conceptual model developed by US EPA and refined by various state environmental agencies (US EPA 2003). The model summarizes the main attributes of an aquatic community that can be expected at each level of the biological condition category, and how these metric-based bioassessments can then be used to make aquatic life use determinations as part of the Clean Water Act, section 305(b) reporting process.
SuAsCo Watershed 2001 Water Quality Assessment Report Appendix D D17
82wqar DWM CN92.0
Figure 2. Tiered Aquatic Life Use conceptual model showing the status of the 2001 biomonitoring sites in the upper Concord Watershed.
Four sites—Assabet River in Hudson (ARH) and Stow (ARS), the Sudbury River in Framingham (SRF), and the unnamed Sudbury River tributary from Lake Cochituate (LCA/B)—in this survey were found to be Moderately Impacted, based on RBP analysis. For all of these, the attributes of the assemblages indicate impairment that is likely the result of organic enrichment. Organic enrichment was implicated at five additional sites—Assabet River in Westborough (ARW) and Northborough (ARN), Spencer Brook (SB), Sudbury River in Hopkinton (SRH), and Pine Brook (PB)—but these ranked as Slightly Impacted. These may be vulnerable to impairment if enrichment cannot be abated. Samples collected from SRH and SRF in 1986 and from ARW and ARN in 1987 are compared to 2001 RBP results in Table 2. The comparisons of the attributes of the assemblages at these sites do not show an appreciable, if any, difference in aquatic life status then versus now.
Three other sites were not as obviously showing signs associated with organic enrichment. Hop Brook in Northborough (HB) and Fort Meadow Brook in Hudson (FMB) were rated Slightly Impacted, which may represent an early indication that these sites are being impacted by NPS pollution problems, such as nutrients and sedimentation. The rating of Indian Brook (IB) as Slightly Impacted was more likely the result of the preponderance of large, immovable boulders and the difficulties they posed for sampling the stream bottom adequately.
North Brook in Berlin, MA (NB) was selected to serve as a reference site based on its appearance as a likely “least impacted” catchment within the upper Concord Watershed. The attributes of the aquatic macroinvertebrate assemblage collected there were, in fact, characteristic of a high quality stream. Coupled with the excellent quality of the instream habitat and surrounding landscape, these data identify North Brook and its catchment as worthy of special protection efforts.
SuAsCo Watershed 2001 Water Quality Assessment Report Appendix D D18
82wqar DWM CN92.0
Natural or “Least-
Impacted”Comparable to the best situation to be expected within watershed. Balanced trophic structure. Optimum community structure (composition and dominance) for stream size and habitat conditions.
Community structure less than expected. Composition (species richness) lower than expected due to the loss of some intolerant forms. Percent contribution of tolerant forms increases.
Fewer species due to loss of most intolerant forms. Reduction in EPT index. Unbalanced trophic structure.
Few species. One or two taxa dominate.
Human Disturbance Gradient(Stressor Gradient)
Low High
AQ
UATIC
LIFE USE
DETER
MIN
ATION
Support
Impaired
BIO
LOG
ICA
L C
ON
DIT
ION
Degraded
Non
-Im
pact
edS
light
lyIm
pact
edM
oder
atel
yIm
pact
edS
ever
ely
Impa
cted
NB
ARW, ARN, SB, SRH, PB, HB, FMB, IB
ARH, ARS, SRF, LCA/B
Table 2. Comparison of aquatic macroinvertebrate community attributes from samples collected in 1986 or 1987 with those collected in 2001 at the same† Assabet River and Sudbury River sites.
† SRF (Sudbury River, Framingham) was sampled ca. 200 m farther downstream in 2001 than in 1986; As02 (Assabet River, Westborough), sampled in 1987, was ca. 300 m downstream from ARW, sampled in 2001. The sites designated as SRH (Sudbury River, Hopkinton) and ARN (Assabet River, Northborough) were essentially the same sample locations in both 1986/1987 and 2001.
SuAsCo Watershed 2001 Water Quality Assessment Report Appendix D D19
82wqar DWM CN92.0
Literature Cited
DWM. 2001. Quality assurance project plan for 2001 benthic macroinvertebrate and habitat assessment. CN:63.0 Massachusetts DEP/Division of Watershed Management. Worcester, MA. 67 p.
Minshall, G.W. 1984. Aquatic insect-substratum relationships. In: V.H. Resh and D.M. Rosenberg. The ecology of aquatic insects. Praeger. New York, NY. p. 358-400.
Novak, M.A. and R.W. Bode. 1992. Percent model affinity: a new measure of macroinvertebrate community composition. J. N. Am. Benthol. Soc. 11(1):80-85.
Nuzzo, R.M. 1987. 1986 Sudbury River MRB. Technical Memorandum 86-14. Massachusetts DEQE/Division of Water Pollution Control. Westborough, MA. 9 p.
Nuzzo, R.M. 1989. Assabet River Biomonitoring Survey. Technical Memorandum 87-6. Massachusetts DEQE/Division of Water Pollution Control. Westborough, MA. 7 p.
Nuzzo, R. 1996. SuAsCo watershed benthic macroinvertebrates. Technical Memorandum 82-7. Massachusetts DEP/Office of Watershed Management. Grafton, MA. 26 p.
Nuzzo, R.M. 2003. Standard operating procedures: Water quality monitoring in streams using aquatic macroinvertebrates. Massachusetts DEP/Division of Watershed Management, Worcester, MA. 35 p.
Plafkin, J.L., M.T. Barbour, K.D. Porter, S.K. Gross, R.M. Hughes. 1989. Rapid bioassessment protocols for use in streams and rivers: benthic macroinvertebrates and fish. U.S. Environmental Protection Agency. Washington, D.C. EPA/444/4-89-001. 174 p.
US EPA 2003. Using Biological Assessments to Refine Designated Aquatic Life Uses. Presented at the National Biological Assessment and Criteria Workshop: Advancing State and Tribal Programs. Coeur d’ Alene, ID. 31 March-4 April 2003.
SuAsCo Watershed 2001 Water Quality Assessment Report Appendix D D20
82wqar DWM CN92.0
APPENDIX AHabitat Assessment Scores
[photo removed for web publication]
SuAsCo Watershed 2001 Water Quality Assessment Report Appendix D D21
82wqar DWM CN92.0
Table A1. Break-down of habitat assessment scores for 2001 upper Concord Watershed survey sites: North Brook, Berlin (NB); Assabet River, Westborough (ARW); Hop Brook, Northborough (HB); Assabet River, Northborough (ARN); Assabet River, Hudson (ARH); Assabet River, Stow (ARS); Fort Meadow Brook, Hudson (FMB); Spencer Brook, Concord (SB); Sudbury River, Hopkinton (SRH); Indian Brook, Ashland (IB); Sudbury River, Framingham (SRF); Lake Cochituate’s outlet stream (LCA/B); and Pine Brook, Wayland (PB). All sites were in Massachusetts.
SuAsCo Watershed 2001 Water Quality Assessment Report Appendix D D22
82wqar DWM CN92.0
APPENDIX BBenthic Macroinvertebrate Data
[photo removed for web publication]
Specimens of Cheumatopsyche sp., a net-spinning caddisfly (Order: Trichoptera; Family: Hydropsychidae) commonly encountered in the upper Concord Watershed.
SuAsCo Watershed 2001 Water Quality Assessment Report Appendix D D23
Table B1. Benthic macroinvertebrate taxa list, counts, and metric values from the 2001 upper Concord Watershed biomonitoring survey: North Brook, Berlin (NB); Assabet River, Westborough (ARW); Hop Brook, Northborough (HB); Assabet River, Northborough (ARN); Assabet River, Hudson, (ARH); Assabet River, Stow (ARS); Fort Meadow Brook, Hudson (FMB); Spencer Brook, Concord (SB); Sudbury River, Hopkinton (SRH); Indian Brook, Ashland (IB); Sudbury River, Framingham (SRF); sample split "A" from Lake Cochituate outlet stream, Framingham (LCA); sample split "B" from Lake Cochituate outlet stream, Framingham (LCB); Pine Brook, Wayland (PB). All sites were in Massachusetts.
SuAsCo Watershed 2001 Water Quality Assessment Report Appendix D D26
82wqar DWM CN92.0
Table B2. Summary of RBP metrics and final rankings for the 2001 upper Concord Watershed biomonitoring survey. Results are shown for: North Brook, Berlin (NB); Assabet River, Westborough (ARW); Hop Brook, Northborough (HB); Assabet River, Northborough (ARN); Assabet River, Hudson, (ARH); Assabet River, Stow (ARS); Fort Meadow Brook, Hudson (FMB); Spencer Brook, Concord (SB); Sudbury River, Hopkinton (SRH); Indian Brook, Ashland (IB); Sudbury River, Framingham (SRF); sample split "A" from Lake Cochituate outlet stream, Framingham (LCA); sample split "B" from Lake Cochituate outlet stream, Framingham (LCB); Pine Brook, Wayland (PB). All sites were in Massachusetts.
† Ref. = reference station; NI = not impacted; SI = slightly impacted; MI = moderately impacted; XI = severely impacted
SuA
sCo W
atershed 2001 Water Q
uality Assessm
ent Report
Appendix D
D
2782w
qarD
WM
CN
92.0
APPENDIX E – SUMMARY OF NPDES AND WMA PERMITTING INFORMATION, CONCORD RIVER WATERSHED
Table E1. SuAsCo Watershed Municipal Surface Wastewater Discharges.
Permitee NPDES #Permit Issuance Date
Flow (MGD)
Dilution Factor Notes/Comments Receiving Water
Wayland Waste Water Management DistrictNote: expected to be reissued by EPA by spring 2005
MA00398539/4/1998 WWTP taken by eminent domain by the Town of Wayland 26 October 1999. Transferred to Wayland Wastewater Management District Commission
Wetland To Sudbury River(MA82A-04)
Westborough WWTP*
MA01004122/12/2000 7.68 #001 treated plant effluent, seasonal limits for ammonia, phosphorus, TSS, BOD. Interim limit for phosphorus, permit requires highest and best practical treatment (BPT), IPP and CWMP required, 7Q10 upstream of discharge =0.01 cfs
Assabet River(MA82B-02)
Marlborough Westerly WWTP*
MA010048012/14/2000 2.89 #001 treated plant effluent, seasonal limits for ammonia, phosphorus, TSS, BOD. Interim limit for phosphorus, permit requires BPT, IPP and CWMP, 7Q10 upstream of discharge=6.7 cfs
Assabet River(MA82B-04)
Marlborough Easterly WWTP*
MA0100498 9/14/2004 5.5 #001 treated plant effluent, seasonal limits for ammonia, phosphorus, TSS, BOD. Interim limit for phosphorus, permit requires highest and best practical treatment (BPT), IPP and CWMP required, 7Q10=0.01 cfs
Unnamed Tributary to Hop Brook (MA82A-15)
Lowell Regional Water And Wastewater Utilityexpected in 2004-2005
MA01006339/14/1997 Combined Sewer Overflow (Warren Street Parking Lot) Outfall Number 020-SDS#6WWTP discharges to Merrimack River, additional CSOs to Merrimack River and Beaver Brook
Concord River(MA82A-09 subwatershed)
Dilution factor = Qe +Qr/Qe where Qe is the design effluent flow and Qr is the estimated 7Q10 of receiving stream IPP = industrial pretreatment program SWPPP- storm water pollution prevention planCWMP = comprehensive wastewater management plan NCCW=non-contact cooling water*Westborough, Marlborough Westerly, Hudson, and Maynard WWTP were issued interim permits that expired in February 2004. EPA reissued draft permits in the winter of 2004.
SuAsCo Watershed Year 2001 Water Quality Assessment Report Appendix E82wqar DWM CN92.0
E1
Table E1 (Continued). SuAsCo Watershed Municipal Surface Wastewater Discharges.
Permitee NPDES #Permit Issuance Date
Flow (MGD)
Dilution Factor Notes/Comments Receiving Water
Concord WWTF** MA01006683/29/2002modified
1.2 19:1 #001 treated plant effluent, seasonal limits for ammonia, phosphorus, TSS, BOD. Interim limit for phosphorus, permit requires highest and best practical treatment (BPT), IPP and CWMP required
Concord River (MA82A-07)
Maynard WWTF* MA0101001 12/14/2000 1.45 #001 treated plant effluent, seasonal limits for ammonia, phosphorus, TSS, BOD. Interim limit for phosphorus, permit requires highest and best practical treatment (BPT), IPP and CWMP required, 7Q10 upstream of discharge=14.0 cfs
Assabet River(MA82B-06)
Billerica WWTP** MA010171111/2/2001 5.4 4.1 #001 treated plant effluent, seasonal limits for ammonia, phosphorus, TSS, BOD. Interim limit for phosphorus, permit requires highest and best practical treatment (BPT), IPP and CWMP required
Concord River(MA82A-08)
Hudson WWTF* MA010178812/14/2000 2.65/3.01
#001 treated plant effluent, seasonal limits for ammonia, phosphorus, TSS, BOD. Interim limit for phosphorus, permit requires highest and best practical treatment (BPT), IPP and CWMP required, 7Q10 upstream of discharge=10.0 cfs
Assabet River(MA82B-05)
Dilution factor = Qe +Qr/Qe where Qe is the design effluent flow and Qr is the estimated 7Q10 of receiving stream IPP = industrial pretreatment programCWMP = comprehensive wastewater management planNCCW=non-contact cooling waterSWPPP- storm water pollution prevention plan1If the average monthly flow exceeds 2.65 MGD for two consecutive months during May 1through October 31 of any year, the seasonal phosphorus limit shall be 0.5 mg/L and the flow limit will be changed to 3.0 MGD. These limits will be come effective 90 days after the second consecutive month of flows above 2.65 MGD and will be expressed as annual average limits, to be reported in a 12 month, rolling basis. Alternatives to increasing this discharge will be evaluated as part of the CWMP. This flow limit is subject to revision based upon findings of the CWMP and the TMDL being developed by MA DEP.*Westborough, Marlborough Westerly, Hudson, and Maynard WWTP were issued interim permits that expire in February 2004. EPA reissued draft permits in the winter of 2004. ** The permits for Concord and Billerica will be reissued in 2005.
SuAsCo Watershed Year 2001 Water Quality Assessment Report Appendix E82wqar DWM CN92.0
E2
Table E1 (Continued) . SuAsCo Watershed Municipal Surface Wastewater Discharges.
Permitee NPDES #Permit Issuance Date
Flow (MGD)
Dilution Factor Notes/Comments Receiving Water
Middlesex School WWTP NOTE: EPA and DEP issued a new final permit on 3 March 2005. This new permit includes seasonal limits on total phosphorus.
MA004013410/18/2002 Report1 #001 intake screen wash water, reservoir foundation leakage, test water, pump seal water, NCCW, hydroelectric turbine bearing lubrication, cooling water, storm water, SWPPP required; treated drinking water goes to Wachusett Reservoir in Nashua Watershed
Wetland tributary to North Brook
MWRA Wachusett Lower Gatehouse and Wachusett Aqueduct
MA01033737/15/2002 Report #001 flows from the Wachsuett Aqueduct Forebay; required to take instream temperature samples during and within three days after WHCP-2 start-up testing at intake valve at Wachusett resevoir Dam, the point of discharge at the Aqueduct Forebay, Northboro Road, Deerfoot Road, intake valve of the Sudbury Reservoir
Wachusett Aqueduct Open Channel and Sudbury Reservoir
US Army (Natick R&D Labs)MA00017244/17/1979NOTE: Currently not discharging; however, US Army wishes to keep permit open/active (Ahsan 2003).
001 6.4 2.56:1 Main outfall, including climatic chambers
Lake Cochituate(MA82127)
002 0.75 2.74:1 Radiation building 003 0.75 2.74:1 Engineering building004 3.3 2.5:1 Ariem building
Dilution factor * = Qe +Qr/Qe where Qe is the design effluent flow and Qr is the estimated 7Q10 of receiving stream IPP = industrial pretreatment programCWMP = comprehensive wastewater management planNCCW=non-contact cooling waterSWPPP- storm water pollution prevention plan
SuAsCo Watershed Year 2001 Water Quality Assessment Report Appendix E82wqar DWM CN92.0
E3
Table E1 (Continued) . SuAsCo Watershed Municipal Surface Wastewater Discharges.
Permitee NPDES #Permit Issuance Date
Flow (MGD)
Dilution Factor Notes/Comments Receiving Water
MWRA- MetroWest Water Supply TunnelMA010335710/31/2002
#001B 4.32 Excavation and lining of tunnel segment
Sudbury River
#001C0.014 Excavation to complete
near-surfacepiping connections
Sudbury River
#001D
4.68 Hydraulic pressure testing and disinfection of completed tunnel segment
Sudbury River
#002B
5.76 Site dewatering discharges (excavation and lining of tunnel and excavation to complete near-surface piping connections)
Tributary to Stony Brook OR Sudbury Reservoir by pumping over Sudbury dam
#003C0.036 Site dewatering (near-
surface piping connections)
Stony Brook
#013
0.06 Site dewatering (near surface piping connections to Hosmer pump station)
Tributary of the Sudbury Reservoir
#015
0.06 Site dewatering (near-surface piping connections to Edgell Road pimp station in Framingham)
Tributary to the Sudbury River
#016
0.03 Site dewatering (near-surface piping connections to Elm Street pump station in Framingham)
Storm drain located in Sudbury River
#018Hultman Weir
0.07 Flows from the Wachusett Aqueduct Overflow Strucutre and blowoff from Wachusett Aqueduct Forebay Channel
#019
0.03 Water treatment plant overflow related to the disinfection and reactivation of the Cosgrove Tunnel
Open Channel
Dilution factor * = Qe +Qr/Qe where Qe is the design effluent flow and Qr is the estimated 7Q10 of receiving stream IPP = industrial pretreatment programCWMP = comprehensive wastewater management planNCCW=non-contact cooling waterSWPPP- storm water pollution prevention plan
SuAsCo Watershed Year 2001 Water Quality Assessment Report Appendix E82wqar DWM CN92.0
Cabot Corporation MA0034797 No permit required (11/29/1995)—no longer discharging NCCW; may apply for general permit as needed
Hudson Light & Power Department
MA0021610 12/101975 3.6 001 and 002- heat exchanger cooling water
Assabet River
L’Energia, Limited PartnershipTransferred to UAE Lowell Power LLC
MA0033201
MA0033201
7/25/92
6/10/1999
Monitor #001- storm water runoff from detention basin, SWPPP required
River Meadow Brook(MA82A-10)
Penn Culvert Company MA0030147 7/8/1987 Monitor Storm water runoff, tied into the Billerica WWTP in 1990; the company has ceased production and the permit was closed by EPA on 13 February 2003
Wetland To Middlesex Canal
Sperry Corporation, NOTE: closed, no longer active according to NERO
MA0030155 10/10/19860.16 MGD (Max daily)
Cold Brook(MA82A-19 subwatershed)
Stow Partners, LLC (transferred from Belden Wire and Independent Cable)
MA0026999 10/10/2000 original permit date 3/2/1983
001=0.028, 002=0.018
Letter dated 8/19/1999 stated facility ceased operation and closed, boiler blow down discharge
Assabet River
SuAsCo Watershed Year 2001 Water Quality Assessment Report Appendix E82wqar DWM CN92.0
W.R. Grace & Company MA0027421 4/28/1982 0.5 #001Discharge from Acton Water Supply District Assabet Municipal Well No. 1; required to monitor wells surrounding Assabet Well No. 1, Assabet River upstream of discharge, downstream of discharge, 6,000 downstream of discharge at Rt 62 Bridge for VOCs
Assabet River
Coatings Engineering CorpNOTE: Not active (Ahsan 2003)
MA0026743 Landham Brook Via Drainage Ditch(MA82A-06)
Arrow Automotive Industries MA0036480 No Permit Required, discharge terminated
Assabet River(MA82B-11)
Framingham District CourtNOTE: Tier 2 21e site
MA0036145 No Permit Required, discharge terminated
Sudbury River (MA82A-26 subwatershed)
Dennision Manufacturing Company
MA0002844 Ceased discharging non-contact cooling water and the permit was terminated by EPA in August 1999
MA82A-03
The NPDES permit for the William Tonner Co. (MA0002917) was terminated by EPA in May 1986.
Silicon Transistor Corporation (MA0025241) ceased discharging non-contact cooling water and groundwater remediation in February 2001 and EPA determined that a permit is no longer required.
Independent Cable Inc. (MA0026999), also known as Belden Wire & Cable Company ceased operations in October 1999 and no longer discharges.
The permit for Raytheon (MA0001511) was terminated by EPA in April 1997.
SuAsCo Watershed Year 2001 Water Quality Assessment Report Appendix E82wqar DWM CN92.0
E7
Table E3. General NPDES permits in the SuAsCo River Watershed
Permitee NPDES #Permit
Issuance Date
Flow (MGD)
Dilution Factor Notes/Comments Receiving Water
Baker Commodities Inc MAG250026 6/4/2003 0.1 2.2:1 NCCW, individual permit closed (MA0031585), also mutli-sector general stormwater permit (MAR05C532)
26 Sudbury Water Treatment Facility Well #8 off East Street
Hop Brook (MA82A-05)
Westborough DPW MAG640007 6/28/2001 0.264 Westborough Water Purification Facility
Hocomonco Pond (MA82060)
SuAsCo Watershed Year 2001 Water Quality Assessment Report Appendix E82wqar DWM CN92.0
E9
Table E4. Multi-sector General Storm Water Permits as of August 2003.Facility NPDES PERMIT # Estimated Location
3M Chelmsford (MAR05C394) MA82A-10Aggregate Industries Northeast (MAR05C111) MA82B-04Allied Systems LTD (MAR05C201) MA82112Avery Dennison (MAR05B977) MA82A-02Baker Commodities (MAR05C532) MA82A-08Ballard Material Products (MAR05C273) MA82A-10Bose Corporation (MAR05C538) MA82A-02Bose Corporation (MAR05C538) MA82046Bullard Abrasives Inc. (MAR05C060) MA82A-01Bunzl Extrusion Inc. (MAR05C404 MA82B-03Cabot Corporation (MAR05B698) MA82A-07Cambridge Tool & Manufacturing Company Inc. (MAR05B999) MA82A-08Concord Public Works (MAR05C449) MA82A-20Danafilms Inc. (MAR05B912) MA82B-02Dav-Tech Plating Inc. (MAR05B869) MA82106Department of Public Works (MAR05C489) MA82B-02Diamond Machining Technology (MAR05B771) MA82B-03Evergreen Solar Inc (MAR05C290) MA82106FED EX Freight East Worcester (MAR05C430 MA82B-02Federal Express-AYE (MAR05C088 MA82127FEDEX Freight East Boston (MAR05C429) MA82A-07FIBA MAR05C403) MA82B-02First Student (MAR05C214) MA82A-02Framingham Auto Terminal (MAR05C322) MA82112Framingham Pump Station (MAR05B637) MA82127Framingham VMF (MAR05B764) MA82127GE Kaye Instruments Inc. (MAR05C540) MA82A-08Genzyme Corporation (MAR5C100) MA82A-02Genzyme Corporation (MAR5C098) MA82A-02Holland Used Auto Parts Inc. (MAR05B910) MA82A-07International Paper (MAR05B697) MA82046Jack’s Used Parts (MAR05C055) MA82A-09Japenamelac Corp (MAR05C006) MA82A-10Ken’s Foods Inc. (MAR05C276) MA82106Ken’s Foods Inc. (MAR05C255) MA82106L3 Communications Essco Inc. (MAR05B831) MA82B-07Maintenance Shop #7 (MAR05C355) MA82A-02Majilite Manufacturing (MAR05B706) MA82A-10Massachusetts Container Corp (MAR05C215) MA82106Maxtor Corporation (MAR05C222) MA82B-02MCC-DEC Tech, LLC (MAR05C448) MA82127Middlesex Meterials (MAR05C039) MA82A-10Myrolis Corporation (MAR05C377) MA82A-07Natick Paperboard Corp (MAR05B680) MA82127New Penn Motor Express Inc. (MAR05C384) MA82A-07Perma Inc. (MAR05B707) MA82A-07Post Road Auto Parts (MAR05B750) MA82A-15PRTR Marlborough Transfer (MAR05C574) MA82056Raytheon Company (MAR05C078) MA82A-06Raytheon Company (MAR05C077) MA82056Recycling Center (MAR05C486) MA82B-05Safety-Kleen Systems Inc (MAR05C295) MA82106Tadmuck Auto Parts (MAR05B756) MA82A-21The Haartz Corporation (MAR05B612) MA82B-14United Parcel Service Inc. (MAR05B940) MA82A-08UPS- Ashland (MAR05B897) MA82127
SuAsCo Watershed Year 2001 Water Quality Assessment Report Appendix E82wqar DWM CN92.0
E10
Table E5. List of Water Management Act registered and permitted withdrawals in the SuAsCo Watershed.
Billerica Water Department 9P31403101 31403101 3031000-01S
4.41 (reg)0.89 (perm)
5.30 MA82A-07
Carlisle Water Department 31405101 Martin & Fiske St Pond 0.36 MA82A-21 and
MA82037
Cavicchio Greenhouse Inc. 31428802 Codger Ln Pond
River 0.25 MA82A-05
Chelmsford Water District 9P31405601 31405602
3056000-02G-05G-09G-11G-15G-16G-18G-19G
1.8 (reg)0.22 (perm)
2.02MA82A-10
Table E5 (Continued). List of Water Management Act registered and permitted withdrawals in the SuAsCo Watershed.
SuAsCo Watershed Year 2001 Water Quality Assessment Report Appendix E82wqar DWM CN92.0
E11
FacilityWMA
PermitNumber
WMARegistration
Number
Source(G = ground,S = surface)
Authorized Withdrawal (MGD) Segment
Concord Country Club 31406702 01G (Well #1) 0.12 MA82A-04
Concord Water Department 9P31406701 31406704
3067000-01G-03G-06G
2.1 (reg)0.42 (perm)
2.52
MA82A-04
3067000-04G MA82A-19
3067000-02G-07G MA82A-20
3067000-05G MA82B-09
3067000-01S Nagog Pond
MA82B-14 and MA82082
Concrete Service Inc. 21402802 Pond 1 0.34 MA82B-04
East Chelmsford Water District 9P421405602 31405601
3056001-01G-02G-03G
0.13 (reg)0.1 (perm)
0.23MA82A-10
Framingham Water Department (MWRA)
31410001RO END date
3/1/1990
3100000-01G-02G-03G
Permitted supply is from MWRA MA82A-03
Great Oak Farm 21402801 Gr. Oak Farm Pond 0.07 Danforth Brook MA82B-19
Hopkinton Water Department 9P21413901 21413901 2139000-01-05G
0.56 (reg)0.42 (perm)
0.98MA82A-11
Hudson Water Department 9P21414102 21414102
2141000-01G
2.0 (reg)0.95 (perm)
2.95
MA82A-05
2141000-02G MA82B-04
2141000-03G-04G-05G
MA82B-11
2141000-01SGates Pond
MA82B-10 and MA82047
Idylwilde Farm Inc. V21400202 Fort Pond Brook 0.03 MA82B-13
Intel Corp. 9P421414103 21414101 Hudson Well D-1Hudson Well D-2
0.11 (reg)0.24 (perm)
0.35MA82B-04
Juniper Hill Golf Course 9P21421501
01 S (Point A Assabet River)
02S (Point B)0.15 MA82B-02
Kidde-Fenwal Inc. 31401402 Well #1Well #2 0.05 MA82A-25
Lincoln Water Department 31415701 3157000-02G 0.28 MA82A-04
Marlborough DPW Water Division 9P21417001 21417001
2170000-01SMilham Reservoir 0.58 (reg)
1.19 (perm)1.77
MA82077
2170000-02SWilliams Lake MA82121
Table E5 (Continued). List of Water Management Act registered and permitted withdrawals in the SuAsCo Watershed.
SuAsCo Watershed Year 2001 Water Quality Assessment Report Appendix E82wqar DWM CN92.0
E12
FacilityWMA
PermitNumber
WMARegistration
Number
Source(G = ground,S = surface)
Authorized Withdrawal (MGD) Segment
SuAsCo Watershed Year 2001 Water Quality Assessment Report Appendix E82wqar DWM CN92.0
E13
Mass Civil Defense Agency MCDA 31410002 01G
02G 0.29 MA82A-25
Maynard Department of Public Works 9P421417401 21417401
217400-01G-02G-03G-04G 1.09 (reg)
MA82B-08
2174000-05G-06G-07G
MA82B-13
Nashawtuck Country Club Inc. 31406708
01G (Sudbury Road Well)
01S (Sudbury RD W/D)0.1 MA82A-04
Natick Water Department 3149801
3198000-01G-02G-07G-09G-11G -13G
4.1 MA82A-22
Northborough Water & Sewer Department 21421503
2215000-03G
0.74
Cold Harbor BrookMA82B-18
2215000-01G MA82B-02
2215000-02G-04G-05G-06G
MA82B-03
Richard E. Peterson 31406701 01S (Monument St. Pond) 0.1 MA82A-07
Shrewsbury Water & Sewer Department* 9P21427101 2271000-01G
2.64 (reg)1.01 (perm)
3.65
Hop BrookMA82B-20
Stow Acres 2142860201G (Well #1)
01S (9th Hole Pond)04S (13th Hole Pond)
0.14 MA82B-05
Stow Acres Country Club SSC Association 21428602 10th Hole Pond 0.14 MA82B-12
Sudbury Water Department 9P31428801 31428803
3288000-03G,-08G-10G
1.72 (reg)0.36 (perm)
2.08
MA82A-05
3288000-02G,-07G 09G 06G 04G
MA82A-06
3288000-05G MA82A-19
US Army Soldier Systems Center 9P31419801 Monitoring Well 15B
Monitoring Well 90B 0.14 MA82A-03 and MA82127
Verrill Farm 31406707
02S (Wheeler Road (w/d)
04S (Rte 117 #1 w/d)0.06
MA82A-04
Rte 117 #2w/d (s) MA82B-09Pantry Road (w/d) (s)
Concord Road (w/d) (s) MA82A-19
W. R. Grace & Co. – CONN 31415501
Well #1Well #2Well #3
0.58 MA82B-13
*Shrewsbury has additional registered and permitted sources in the Blackstone Watershed. Shrewsbury no longer withdraws from this source (i.e., all withdrawals are now from the Blackstone Watershed). Their permit to withdraw 0.26 MGD (through 2009) will be rescinded (Kickham 2004).
SuAsCo Watershed Year 2001 Water Quality Assessment Report Appendix E82wqar DWM CN92.0
E14
Table E5 (Continued) . List of Water Management Act registered and permitted withdrawals in the SuAsCo Watershed.
FacilityWMA
PermitNumber
WMARegistration
Number
Source(G = ground,S = surface)
Authorized Withdrawal (MGD) Segment
Wayland Water Department 9P431431501 31431502
3315000-03G-04G-05G
1.66 (reg)
MA82A-03
3315000-01G-02G-06G-07G-08G
MA82A-04
Westborough Water Department 9P421432801 21432804
2328000-01S-01G-02G
1.92 (reg)1.18(per)
3.1
MA82A-01
2328000-03G-04G-06G
MA82B-01
2328000-05G-10G MA82B-02
2328000-07G-08G MA82B-03
Westborough Water Dept. 9P42132801 21432804
2328000-01SWestborough Reservoir
(Sandra Pond)
1.92 (reg)1.18 (perm)
3.1MA82114
Weston Nurseries of Hopkinton 21413902
Rudy’s PondBusconi Pond
Meadow Aux. PondMeadow Pond
Garden Center PondHill Pond
Canal SystemKidney Pond
Irrigation PondStone Pond
Tony’s Bridge CanalIrrigation Canal/Pond
Leaky Pond
0.78
MA82A-25
Irrigation Pond Field 37N, 37S, 28,Island Pond
MA82A-23
SuAsCo Watershed Year 2001 Water Quality Assessment Report Appendix E82wqar DWM CN92.0
E15
APPENDIX F – DEP GRANT AND LOAN PROGRAMS
Excerpted from the DEP/DWM World Wide Web site, http://www.mass.gov/dep/brp/mf/othergrt.htm http://www.mass.gov/dep/brp/wm/projsums.htm
604(B) WATER QUALITY MANAGEMENT PLANNING GRANT PROGRAMThis grant program is authorized under the federal Clean Water Act Section 604(b) for water quality assessment and management planning.
00-04 Lake Cochituate Nonpoint Source Management Plan. This project will characterize and prioritize nonpoint source pollution problems in the Cochituate watershed. A watershed-wide inventory, mapping, and assessment of the land use activities and NPS sources will be conducted. A detailed NPS assessment and storm water mapping of selected basins will be created and assess local water quality protection measures. It will provide recommendations to communities for improved management of NPS pollution within the watershed and conduct a workshop to provide outreach and technical assistance. A public information brochure will be created on how to prevent NPS pollution in the Cochituate watershed.
104(B) (3) WETLANDS AND WATER QUALITY GRANT PROGRAMThis grant program is authorized under the Wetlands and Clean Water Act Section 104(b)(3) of the federal Clean Water Act. The water quality proposals received by MA DEP under this National Environmental Performance Partnership Agreement (NEPPA) with the U.S. Environmental Protection Agency is a results oriented approach that will focus attention on environmental protection goals and the efforts to achieve them. The goals of the NEPPA are to: 1) achieve clean air, 2) achieve clean water, 3) protect wetlands, 4) reduce waste generation, and 5) cleanup waste sites.
98-01/104 Marlboro Easterly WWTF and Hop Brook Diagnostic/Feasibility Study. The study will evaluate and make recommendations for the water quality problem plaguing Hop Brook. Existing data will be evaluated and a QAPP will be formed, water quality, aquatic life, and watershed studies will be performed and estimates and recommendations will be made. All existing data, studies, and recommendations will be reviewed to summarize existing reports and identify data gaps. Modeling estimates for annual and seasonal nutrient and water budgets will be provided. Pond contours and sediment depth profiles will be determined along with factors that influence Hydrodictyon sp. growth. Algae, fish, zooplankton, and aquatic macrophytes will be surveyed. A watershed survey will be completed to determine nonpoint sources of pollution and an evaluation of various alternatives to reduce nutrient loading and algal growth.
98-11/104 Assabet River Modeling Project. This project will develop and implement a TMDL program for the Assabet River. A literature review will be completed, appropriate models will be identified, and hydrologic and nutrient budgets will be developed. Land use based modeling will be conducted to determine nonpoint source loads, also developing nutrient TMDL and evaluating alternative loading options. A final TMDL report will be written and presented in a public meeting.
00-10/104 Nutrient TMDL for the Assabet River. This project will quantify the loading capacity and TMDL and assess alternatives to achieve goals. A review of the existing Assabet River water quality reports and documents will be conducted and appropriate data sets for modeling will be identified along with nutrient TMDL. A hydrologic and nutrient budget including a low flow model will be developed, calibrated, and verified for the TMDL. Nutrient TMDLs will be developed and alternative loading options will be evaluated.
SuAsCo Watershed Year 2001 Water Quality Assessment Report Appendix F F182wqar DWM CN92.0
319 NONPOINT SOURCE GRANT PROGRAMThis grant program is authorized under Section 319 of the CWA for implementation projects that address the prevention, control, and abatement of nonpoint source (NPS) pollution. In order to be considered eligible for funding projects must: implement measures that address the prevention, control, and abatement of NPS pollution; target the major source(s) of nonpoint source pollution within a watershed/subwatershed; have a 40 percent non-federal match of the total project cost (match funds must meet the same eligibility criteria as the federal funds); contain an appropriate method for evaluating the project results; address activities that are identified in the Massachusetts NPS Management Program Plan.
98-04/319 Restoring Concord’s Mill Brook: Nonpoint Sources Pollution and Community. This project will continue the work of the Mill Brook task force to restore and conserve the brook. BMPs (best management practices) will be implemented, resulting in reduction of NPS loading to the brook. An innovative storm water treatment technology will be implemented at a high-risk site. Four catch basins will be retrofitted with new sump units and storm drain pillows or sump skimmers. A QAPP will be developed and monitor to demonstrate the effectiveness of the BMPs installed. A long-term plan will be developed with the Town DPW with recommendations for catch basin technologies and maintenance and implemented to work with the DPW to train street maintenance and snow removal crews in appropriate techniques to mitigate NPS impacts from these operations. A review of snow removal and street maintenance will be performed and new policies developed where needed. Removal of stream bottom sediment and stream bank clean up will be performed where allowed by permit.
00-07/319 Town of Acton Nonpoint Source Control Program. This project will implement a Watershed Trading Program to discharge treated wastewater effluent into the Assabet River, such that for every one pound of phosphorus discharged into the river, three pounds will be prevented from entering via nonpoint sources. This will be achieved in two ways. The first will involve implementing storm water BMPs to demonstrate that adequate phosphorus levels can be achieved to the level required under the trading program. Identification of sites where the town has access and resources to install BMPs will be conducted; storm water run-off will be sampled to understand pre-BMP water quality. Sampling will then be conducted post-BMP initiation to understand and document the project’s success. Extrapolation to other Watershed Trading Program goals will be reached. The second will involve the construction of a pond/wetland recirculation system at the town’s newly created 9-acre public swimming pond. The swimming pond has relatively high background phosphorus concentrations that will be reduced by the pond/wetland to keep background phosphorus levels from reaching a point that it would support the growth of nuisance levels of algae and macrophytes. A wetland recirculation system will be designed and implemented. A demonstration project manual will also be completed along with public education materials. Funding from 2000 to 2003.
00-08/319 Long Point Restoration Project, Littleton, MA. This project is a Phase II project for the pond. It will restore water quality and the recreational value of Long Pond by implementation of a watershed management program identified in the initial 1990 Diagnostic/Feasibility Study. Removal of nuisance plants via macrophyte hydroraking will be performed along with installation of bottom barriers in selected areas. Long-term recommendations include installation of a detention basin to reduce nutrient and suspended sediment inputs to Long Pond and development of an educational program for the abutters and users of the pond. That program will include information about use/misuse of storm drains, septic system maintenance and upgrades, lawn fertilizer restrictions, protection of shoreline integrity, and disposal of organic material into the pond. Regulations and water resource bylaws will be developed to control development on pre-existing undersized lots within the watershed.
01-01/319 Lake Cochituate, Snake Brook NPS Remediation, Phase 1. This project will install BMPs to reduce the heavy loads of sediment in Snake Brook and Lake Cochituate. It will begin to address the sedimentation and nutrient loading from Snake Brook that has accelerated enrichment of the lake. A detention pond and wetland enhancement will be designed and constructed immediately east of the place where Snake Brook enters the lake. Another detention pond and wetland enhancement will be designed and constructed for the drainage channel in the watershed. Five storm water drainage systems will be designed and constructed within the Snake Brook watershed, and a GIS map of the system will be created. Pre- and post- construction water quality will be monitored and a public education campaign will be started.
SuAsCo Watershed Year 2001 Water Quality Assessment Report Appendix F F282wqar DWM CN92.0
02-10/319 Implementation of TMDL Recommendations at Lake Boon. Lake Boon is a 163-acre great pond located in the towns of Stow and Hudson. The Town of Stow will administer this contract on behalf of the towns of Stow and Hudson and the Lake Management Commission. The 1000-acre watershed is a mix of forest and residential development with many lakefront cottages that have been converted into year-round homes. The lake is divided into four basins, the first and the largest of which is largely natural. The remaining three basins are man-made as a result of damming the outlet pond in the mid-1800’s. The second, third, and fourth basins are overgrown with invasive plants that have spread considerably in the last decade. Lake Boon is 303(d) listed for nuisance aquatic plants and a TMDL for phosphorus is in the final stages of being drafted. Activities proposed have been recommended in at least one of three studies that have been completed for the lake. The project goal is to improve water quality in the lake through installation of storm water treatment devices and to reduce non-point source pollution at the source by encouraging good practices among watershed residents and stakeholders. As aquatic plant replacement program will also be conducted. Project tasks include development of a QAPP for pre- and post- construction water quality monitoring, monitoring, conducting a lake watershed survey, installing 26 storm water BMPs (leaching catch basins), and developing educational programs and brochures.
05-11/319 Dudley Pond Comprehensive Water Quality Improvement Project Dudley Pond is an 84-acre Great Pond in the Concord River watershed. The Pond is listed in Category 5 for turbidity and exotic species. In addition to turbidity from nonpoint watershed sources, nuisance growth of Eurasian milfoil is a serious problem for the Pond. It significantly impairs the pond’s ecological and recreational value. This project is part of a long-term strategy to mitigate water quality impairment in Dudley Pond using both in-lake and watershed BMPs. This project will reduce sediment and nutrient loads to Dudley Pond by implementing low impact development BMPs and restoring a section of eroding riverbank. To help control aquatic vegetation, milfoil weevils will be introduced and diver hand-pulling will be conducted in targeted areas. Targeted pollutants include sediment, nutrients, and Eurasian milfoil. Project tasks include development and implementation of an EPA and MA DEP-approved Quality Assurance Project Plan, construction of a bioretention cell, outlet protection/bank restoration, introduction of milfoil weevils, milfoil hand pulling, and public outreach and education including catch basin stenciling.
MASSACHUSETTS WATERSHED INITIATIVE PROJECTSThe Massachusetts Watershed Initiative was a broad partnership of state and federal agencies, conservation organizations, businesses, municipal officials and individuals that protects and restores natural resources and ecosystems on a watershed basis. The primary goals of the Watershed Initiative were to: improve water quality; restore natural flows to rivers; protect and restore habitats; improve public access and balanced resource use; improve local capacity to protect water resources; and, promote shared responsibility for watershed protection and management. Projects funded under the MWI included hydrologic and water quality monitoring and assessment, habitat assessment, nonpoint source assessment, hydrologic modeling, open space and growth planning, technical assistance and outreach.
99-09/MWI Assabet River Total Maximum Daily Load (TMDL) Investigations. This project will collect information to determine a nutrient TMDL for the Assabet River. A TMDL Advisory Committee will be established and a review of selected water quality models for use as potential tools for allocating nutrient loads. A QAPP will be developed and sampling of nutrients in wet and dry conditions, aquatic plants and algae, and sediment will be performed.
00-02/MWI SuAsCo Total Maximum Daily Load (TMDL) Phase 2 Investigations. This project will continue to collect information to determine a TMDL for nutrients in the Assabet River and begin a sampling program for TMDL analysis of the Sudbury and Concord Rivers. The QAPP for the Assabet River will be updated and a QAPP of the Sudbury and Concord River will be created. Additional water quality and biological sampling will take place in the Assabet while sampling will begin in the Sudbury and Concord Rivers.
01-14/MWI SuAsCo Total Maximum Daily Load (TMDL) Phase 3 Investigations. This project will collect information for use in determining nutrient TMDLs for the Sudbury and Concord Rivers. A QAPP will be created for those two rivers and water quality and biological sampling will be conducted.
02-18/MWI SuAsCo Total Maximum Daily Load (TMDL) Phase 4 Investigations. This project will continue to collect water quality data and other information for use in determining nutrient TMDLs
SuAsCo Watershed Year 2001 Water Quality Assessment Report Appendix F F382wqar DWM CN92.0
for the Sudbury and Concord Rivers. A QAPP will be created for sampling, water quality and biological sampling will take place in selected tributaries of the Sudbury and Concord Rivers.
SOURCE WATER AND TECHNICAL ASSISTANCE/LAND MANAGEMENT GRANT PROGRAMThe Source Water Protection Technical Assistance/Land Management Grant Program provides funds to third party technical assistance organizations that assist public water suppliers in protecting local and regional ground and surface drinking water supplies. There are no source water and technical assistance/land management grants awarded in the SuAsCo Watershed.
WELLHEAD PROTECTION GRANT PROGRAMThe Wellhead Protection Grant Program provides funds to assist public water suppliers in addressing wellhead protection through local projects and education.
99-23/WHP Ashland Wellhead Protection Project. This project will create an inspection program to locate floor drains, holding tanks, and commercial and industrial hazardous material storage to protect the existing water supply and future sites in the Town of Ashland. A catalog of potential sources of contamination and hazardous materials will be developed and kept up-to-date. A Board of Health floor drain regulation and plan for implementation will be put into effect along with a base map, a database for hazardous materials use/storage for local planning and site inspections.
00-04/WHP Acton Wellhead Protection Project. This project will assess high-risk land-use activities within the Zone II’s of the Water Supply District of Acton, including working in surrounding towns that control portions of the District’s Zone II areas. Site investigations will be conducted to verify current information, collect new information, and update GIS layers to enhance source water protection efforts. High-risk activities will be assessed using the Department’s Source Water Assessment Program criteria within the entire Zone II of each well, including facilities that generate, treat, store, or dispose or hazardous materials/waste, large septic systems (2,000-5,000 gpd), farms, rights-of-way, recreational properties managed with pesticides/fertilizers/manure, underground storage tanks, salt/deicing materials storage, etc. Surveys will be conducted to verify current data and collect new information including GPS coordinates of all high-risk land uses within the Zone II’s and map watershed and inventory features in coordination with MassGIS. GIS data layers will be updated or added, as appropriate, to enhance source water protection efforts as well as identify gaps in data in land use information.
00-06/WHP Wayland Wellhead Protection Project. This project will install security fencing around wells in the Town of Wayland and treatment building at the Happy Hollow well site. Wellhead protection signs will be placed along the perimeter of Baldwin Pond and the access road to the Happy Hollow well site between the site and the high school. Three hundred linear feet of six-foot high chain link fence and gates will be installed to protect the pump stations and chemical feed building at the Happy Hollow well site.
01-06/WHP Wayland Wellhead Protection Project- Part II. This project will install a 3,500 gallon tight tank, replacing a septic system located in the Zone I of Wayland’s Well 01G. The new system must be in compliance with Title 5 of the State Environmental Code and the existing system must be properly abandoned. Two hundred fifty linear feet of 6-foot high chain-link fencing with barbed wire, one six-foot gate, and one twelve-foot gate with locks will also be placed around Baldwin Pond Well 3.
01-12/WHP Chelmsford Wellhead Protection Project. This project will develop a comprehensive Wellhead Protection Plan as per Department guidance including a public educational outreach program, conduct two rounds of storm water monitoring of four storm drains in accordance with an approved QAPP, and install 25 wellhead protection signs for the Town of Chelmsford throughout the Zone II area.
02-10/WHP Hudson Wellhead Protection Project. This project will purchase and install intrusion alarms to protect drinking water wells 02G through 06G, purchase and install a fire detector to protect drinking water well 02G. Quarterly Progress Reports will be submitted along with a Final Project Report.
SuAsCo Watershed Year 2001 Water Quality Assessment Report Appendix F F482wqar DWM CN92.0
CLEAN WATER STATE REVOLVING LOAN FUND (SRF) PROGRAMThe Massachusetts State Revolving Loan Fund for water pollution abatement projects was established to provide a low-cost funding mechanism to assist municipalities seeking to comply with federal and state water quality requirements. The SRF Program is jointly administered by the Division of Municipal Services of the MA DEP and the Massachusetts Water Pollution Abatement Trust. Each year the MA DEP solicits projects from the Massachusetts municipalities and wastewater districts to be considered for subsidized loans, which are currently offered at 50% grant equivalency (approximates a two percent interest loan). The SRF Program now provides increased emphasis on watershed management priorities. A major goal of the SRF Program is to provide incentives to communities to undertake projects with meaningful water quality and public health benefits and which address the needs of the communities and the watershed. Recent SRF projects specific to the SuAsCo Watershed include:
99-02/ CW SRF Middle Fort Pond Brook and South Acton Project 00-40/ CW SRF Town of Acton Comprehensive Water Resources Management Plan 00-42/ CW SRF Middle Fort Pond Brook and South Acton Project 00-38/CW SRF Hopkinton Comprehensive Wastewater Management Plan 00-21, 00-22, 00-23, 00-24, 00-25, 00-28/ CW SRF Assabet Consortium Comprehensive
Wastewater Management Plan 01-15 CW/SRF Framingham Stormwater Master Plan 02-24/ CW SRF Framingham Comprehensive Wastewater Management Plan 03-1746/ CW SRF Marlborough Comprehensive Wastewater Management Plan The proposed
plan will address the City's Easterly Sevice Area, covering a 20 year planning period and focusing on improvements needed to comply with the NPDES permit limits, particularly with respect to phosphorous discharged to the Hop Brook system.
MASSACHUSETTS DRINKING WATER STATE REVOLVING FUND PROGRAM The Massachusetts Drinking Water State Revolving Fund (DWSRF) provides low-cost financing to help community public water suppliers comply with federal and state drinking water requirements. The DWSRF Program’s goals are to protect public health and strengthen compliance with drinking water requirements, while addressing the Commonwealth’s drinking water needs. The Program incorporates affordability and watershed management priorities. The DWSRF Program is jointly administered by the Division of Municipal Services of the Department of Environmental Protection and the Massachusetts Water Pollution Abatement Trust (Trust). The current subsidy level is equivalent to a 50% grant, which approximates a two percent interest loan. The Program will initially operate with approximately $50 million in financing capacity. For calendar years 1999 through 2003, up to $400 million may be available through the loan program.
03-725/ DW SRF Billerica Water Treatment Plant This project entails the construction of a new 14-MGD conventional Water Treatment Plant (WTP) on a new site to replace the existing WTP, which is 45 years old. The new WTP will draw raw water from the same water supply source, the Concord River. The existing WTP is poorly laid out, is located on a floodplain surrounded by wetlands, and has process and support equipment (pumps, mixers, instrumentation and controls, electrical, HVAC, plumbing) that are reaching the end of their usability. The new WTP will have identical water treatment processes as the existing one but the processes will be enhanced with new and more efficient designs. This is a multi-year carry-over project that was initially approved for SRF financing in Calendar Year 2000.
03-677/DW SRF MWRA Walnut Hill Water Treatment Plant This project is for the construction of a 405 MGD Water Treatment Plant on Walnut Hill in Marlborough to treat water from the Wachusett Reservoir prior to distribution to more than 40 metropolitan Boston communities. The treatment plant is required pursuant to State and Federal water supply regulations. This project is part of an overall program to meet the requirements of the Source Water Treatment Rule and the Lead and Copper Rule. The treatment plant includes facilities for chlorination, corrosion control and a 50 million gallon finished water storage tank. This is a multi-year carry-over project that was initially approved for SRF financing in calendar year 2000.
SuAsCo Watershed Year 2001 Water Quality Assessment Report Appendix F F582wqar DWM CN92.0
TITLE 5Under the Title 5 Program, the Commonwealth has developed three programs to assist homeowners with wastewater management problems. The Homeowner Septic Loan Program provides low interest loans to homeowners to upgrade systems that will not pass Title 5 inspections. The Comprehensive Community Septic Management Program provides betterment loans to communities to target known or suspected failures or to develop a community-wide management plan. The third option allows homeowners to claim tax credits for septic upgrades. Additional information about the Title 5 Program is available online from the MA DEP website http://www.mass.gov/dep/brp/wwm/t5pubs.htm. In the SuAsCo Watershed the towns of Boylston, Hopkinton, Hudson, Littleton, Maynard, Northborough, Shrewsbury, Southborough, and Westford have participated in the Comprehensive Community Septic Management Program (Casper-Dunne 2004).
SuAsCo Watershed Year 2001 Water Quality Assessment Report Appendix F F682wqar DWM CN92.0
Table G2. 1996 Concord River Watershed Bacteria Data.
OWMID Date Time Fecal Coliform (24hr) Bacteria
(colonies/100mL)UNNAMED TRIBUTARY TO ASSABET RIVERStation: FPB01, Unique ID: W0324Description: Unnamed tributary to the Assabet River downstream from Warners Pond, Commonwealth Avenue bridge, Concord.
82-0003 06/25/96 10:40 3,000FORT POND BROOKStation: FPB04, Unique ID: W0327Description: River Street bridge, Acton.
82-0007 07/18/96 10:00 80FORT POND BROOKStation: FPB05, Unique ID: W0326Description: Central Street bridge, Acton.
82-0009 07/18/96 10:35 20
SuAsCo Watershed Year 2001 Water Quality Assessment Report Appendix G G182wqar DWM CN92.0
Table G2 (Continued). 1996 Concord River Watershed Bacteria DataOWMID Date Time Fecal Coliform
(24hr) Bacteria (colonies/100mL)
NASHOBA BROOKStation: NB01, Unique ID: W0329Description: Wetherbee Street bridge, Acton.
82-0004 06/25/96 11:05 160Unnamed tributary to Fort Pond BrookStation: CB01, Unique ID: W0323Description: Unnamed tributary to Fort Pond Brook, Hosmer Street, Acton. (named Coles Brook on 1987 USGS Quad.)
82-0008 07/18/96 10:20 140Unnamed tributary to Fort Pond BrookStation: PB01, Unique ID: W0325Description: Unnamed tributary to Fort Pond Brook, near mouth at railroad track, Acton. (named Pratts Brook on 1987 USGS Quad.)
82-0006 07/18/96 09:45 140TAYLOR BROOKStation: TB01, Unique ID: W0330Description: Just upstream confluence with Assabet River, Maynard.
82-0001 06/25/96 10:00 100
SuAsCo Watershed Year 2001 Water Quality Assessment Report Appendix G G282wqar DWM CN92.0
John Fiorentino and I attempted to conduct biomonitoring at all 15 sites requested by the team. Where possible, we collected benthic macroinvertebrates for our analysis. Where habitat considerations made it inappropriate to apply our standard monitoring protocol we are able only to provide notes from our field observations, at this time, in the event they may help in your evaluation of the status of these sites.
METHODS
A 100 m reach was evaluated for availability of productive habitat for benthic macroinvertebrates. Ten kicks or jabs (for a total of 2 m2) were apportioned to productive habitats representing at least 10% of such habitat within the reach. For purposes of this sampling, habitats with adequate current velocity passing over rocky substrate, “snags,” aquatic vegetation, or exposed root masses were considered “productive.” A kick-net with an opening approximately 0.45 m wide and with a mesh size of 590 μm was used.
A subsample of 100 macroinvertebrates was separated from the sample, and specimens were identified to family (Rapid Bioassessment Protocol II or RBP II), to the extent their condition allowed. Community health metrics based on family-level taxonomy were calculated and an impairment category was determined. This type of analysis separates sites into three categories: nonimpaired, moderately impaired, and severely impaired.
RESULTS
The taxonomic list of macroinvertebrates obtained in the subsamples from each site and summary tables of the RBP II metrics are attached as appendices “A” and “B,” respectively. Because of the extent of human activity within this watershed it was difficult to find a location that could serve suitably as a reference site for all of the collection sites. We selected two sites to serve as “least impacted” references based on our reconnaissance and the team’s guidance. The metrics were calculated independently against each of these references (Gates Pond Brook, Berlin—Table B1, Appendix B; Fort Pond Brook, Acton—Table B2, Appendix B). An attempt was made to discuss the results only in the context of the reference site that was the best match in terms of stream size and habitat characteristics. The best match is not that straight forward, however, so many of the comparisons were performed against both references. You may wish to recalculate the metrics if your familiarity with the watershed suggests that one of the other sites would have made a more suitable reference. Table B3 in Appendix B compares the upstream/downstream pair in Mill Brook, Concord.
SuAsCo Watershed Year 2001 Water Quality Assessment Report Appendix H H182wqar DWM CN92.0
SAC01—Mill Brook, Concord, MA (1 July 1996)
HABITAT
It was difficult to find suitable habitat to sample in this brook. The intent was to sample at stations bracketing the downtown area to measure any impacts it may have on instream ecosystems. Sites that had been identified as suitable during reconnaissance in May were unsuitable on this date because lower flow conditions left them with virtually standing water. Mill Brook downstream from Cambridge Turnpike is very low gradient and apparently dominated by sandy soils. Selection of sampling sites, therefore, was based on indications of adequate flow velocities and sufficient productive benthos habitat to provide a total of 2 m2 sample area.
The upstream site (SAC01A) was located upstream from the Concord Police station (and the adjacent tributary) behind the Concord Ice Company. This reach was very straight, probably channelized at one time. The bottom substrates were primarily sand and silt. The entire sample came from sweeps of instream vegetation. The reach was bordered by a densely vegetated riparian zone on the north bank (a mix of native cover and “false bamboo”); while the south bank had a thin riparian buffer between the brook and a mowed field. Current velocity was fast enough to be perceptible—fast enough as to be adequate, probably—but nowhere in the reach was fast enough to create riffles. The overall habitat score was 95.
The downstream site (SAC01B) was just upstream from Lowell Road, running adjacent to the Star Market parking lot. This reach was obviously channelized at one time, but greater than 20 years ago (determined from looking at a 1970 USGS quadrangle). The habitat was poor in this reach, yet it represented the best benthos habitat downstream from downtown Concord. The majority of the available productive substrate was in the form of snags and instream vegetation and, while not abundant, there were some cobble substrates available. Current velocity was respectable throughout the reach creating occasional riffles and runs. The overall habitat score was 64.
BENTHOS
When compared against its upstream partner, SAC01B scored in the grey area between nonimpaired and slightly impaired. Compared against the two watershed references both SAC01A and SAC01B scored in the moderately impaired category. The habitat scores were 68% and 46%, respectively, of the Gates Pond Brook habitat score, and 63% and 43%, respectively of the Fort Pond Brook habitat score, indicating that habitat quality is the main problem for the benthos in this stream. This confounds detection of any possible point or nonpoint source pollution impacts. To do so on this brook will require a thoughtfully designed study specifically for this situation.
SAC02—Pine Brook, Wayland, MA (3 July 1996)
HABITAT
The reach sampled here is downstream from Pine Brook Road. Nearly the entire reach was riffle, meandering through woodland and wet bottomland over cobble/gravel substrates. This combination of substrates and flow regime provided very good invertebrate habitat. For the most part it appears there is little potential for erosion or nonpoint source pollution (related to overland flow) except upstream from the reach where Pine Brook Road crosses the brook. The major habitat flaw with this reach was the low volume of water: the stream channel was only about one quarter full on the sampling date; the greatest depth was about 0.3 m. The overall habitat score was 159.
The water temperature feels much colder here than at the other sites sampled in this watershed. The SuAsCo team may wish to investigate whether this stream is classified for, or qualifies for, protection under cold water standards.
BENTHOS
SuAsCo Watershed Year 2001 Water Quality Assessment Report Appendix H H282wqar DWM CN92.0
This site had a better habitat score than either of the reference sites, yet scored as moderately impaired against both of them. This is probably an indication of nonpoint source nutrient loading problems upstream. One of the two branches at the head of this brook comes out of a very nearly putrid pond on Rice Road in Wayland. The pond is adjacent to a cow pasture with clear access for the livestock; I have even seen cows standing in the water up to their bellies. This branch of the brook also passes through a small pond on a horse farm (though it does not appear that any livestock encroach on this pond) before crossing under the aqueduct and subsequently Old Connecticut Path and joining the other branch. It may be worth investigating potential nonpoint sources of pollution and evaluating their magnitude.
SAC03—Gates Pond Brook, Berlin, MA (2 July 1996)
HABITAT
During our reconnaissance in May we walked this brook from about 100 m upstream from the confluence with the Assabet River to within about 500 m of the outlet of Gates Pond. Downstream from Hudson Road the brook flows between the lawns of two adjacent properties into a marshy area (shallowly flooded at that time) and into a dense thicket of shrubs for the remainder of the distance to the point of confluence with the Assabet River. On the upstream side of the road the brook also runs along side of a couple of houses. Proceeding upstream past the houses the rest of the brook lies in woodlands. The flood plain is covered with wetland vegetation, such as skunk cabbage, but the trees provide a nearly complete canopy overhead. Within this woodland portion of the brook’s course we saw only one potential nonpoint source pollution problem. A two-track road, that appears to have been an access road to a sand pit at one time, leads northwesterly from Hudson Road about 200 m. At this point a trail branches off to the west, with no bridge where it crosses the brook (there may have been one at one time). It appears that the only use this trail gets is from dirt bikes, which have caused a great deal of erosion at the point of crossing the brook. Along the trail, where it ascends the gradient from the brook to the sand pit, there is a prominent gully caused by erosion. There may have been some flooding of the sand pit in the past, spilling over and using the trail as a drainage pathway to the brook. We found hay bails, however, staked-out at the two low points at the edge of the pit, evidence of attempts to control runoff from the pit. The slope between the edge of the pit and the brook is generally well vegetated, and so the sand pit likely would not be the cause of on-going erosion. The probable cause of the erosion gully that exists either is current uses of the trail (probably dirt bikes) or a past event (such as runoff from the pit) that started the erosion and caused enough damage that it continues to erode rather than heal over. The benthos samples were collected to bracket this perceived problem area. For lack of a better land mark it was referred to as the “dirt bike crossing” or simply the “crossing.” SAC03A was located about 600 m upstream from the crossing and SAC03B was the 100 m reach immediately downstream from the crossing.
At the time of sampling there was very little water in the brook. Current velocity was respectable but the riffles were very shallow (5 cm or less). Habitat at the two locations was fairly comparable; both had rocky riffles, but downstream snags were a greater proportion of the available habitat. The overall habitat score at SAC03A was 139 and at SAC03B it was 132. Since we did not see the outlet of Gates Pond we cannot determine to what extent any outlet structures there may have been responsible for holding back water from the brook.
BENTHOS
The downstream site on Gates Pond Brook (SAC03B) falls into the moderately impaired category when compared to it’s upstream counterpart (SAC03A). Because there was no evidence of intervening pollution sources between these two sites except the erosion at the “crossing,” the downstream station is probably suffering from the habitat disturbance described above.
SAC04—River Meadow Brook, Carlisle, MA (1 July 1996)
HABITAT
The reach sampled was located approximately 500 to 1000 m upstream from Lowell Street in Carlisle. The brook meanders through woodlands with a wide riparian zone covered with wetland vegetation in the
SuAsCo Watershed Year 2001 Water Quality Assessment Report Appendix H H382wqar DWM CN92.0
understory. This was very nice habitat, characterized by periodic riffles and runs, generally very good cover for fish, lots of cobble/boulder/rubble and occasional snags. Overall habitat score was 186—the highest score assigned to a sampling reach in the SuAsCo watershed.
BENTHOS
The benthic invertebrate community results from this location were a real surprise. I expected that the data from this site would serve as a least impacted reference for this watershed. It is remote, though downstream from a cranberry bog, and offered excellent habitat. The assemblage of macroinvertebrates, however, indicates that something is wrong here. The list of taxa was skewed toward those generally regarded as tolerant (an FBI of 6.66) and there was not a single EPT taxon represented in the subsample! Though there are homes built within this subwatershed, they all appear to be out of the flood plain and there were no obvious nonpoint sources of pollution that we came across. This site ranked moderately impaired against both watershed references. The team may wish to investigate nutrient loads and pesticide residues in this brook’s watershed.
SAC05—Spencer Brook, Concord, MA (5 July 1996)
HABITAT
We searched for sampling locations on Spencer Brook as far upstream as Middlesex School. From the map and from the points where we viewed it, the brook appeared as a low gradient stream flowing through wetlands until reaching Angiers Pond at the Concord Rod and Gun Club off Strawberry Hill Road. The pond’s dam has two spillways nearly side-by-side: a fixed-height easterly outlet and an adjustable (or so it appeared) height, westerly outlet.
During our reconnaissance on 28 May 1996, the smaller, westerly, spillway channel from Angiers Pond flowed only a short distance, filling a small pond with an overflow connection to the easterly channel. We never ventured across this small pond because it seemed clear at the time that the bulk of the discharge from the pond was carried by the easterly channel. There the brook was a fast moving stream meandering through the woodlands below and providing exceptional habitat for both macroinvertebrates and fish. There was an abundance of rocky substrates, there were snags and submerged logs, and a suitable range of water depths. As the brook approached Barrett’s Mill Road a dug channel diverged from the main channel, making a dog-leg (perhaps used at one time for irrigation) and returning to the mainstem a short distance from Barrett’s Mill Road. From the point of divergence down to Barrett’s Mill Road both the side-stream and the main-stream were slow moving and sandy-bottomed. Downstream from Barrret’s Mill Road the current was again swift, passing over gravel substrates near the bridge; but the brook quickly flattened out and became deep and sandy-bottomed.
When we returned on 5 July 1996 to sample, the easterly spillway had little if any water flowing over it; and the channel below was virtually dry except for a very few isolated pools that persisted. The water that did occur in the channel between Angiers Pond and Barrett’s Mill Road was essentially stagnant. The water was flowing out of Angiers Pond via the westerly outlet to the small pond, with no lateral spill-over into the easterly channel. It was at this time we discovered that the small pond had an outlet and all of the water leaving Angiers’s Pond was flowing through the small pond, through a dug channel to the old stone structures remaining from “Barrett’s Mill.” The mill appears to be a private residence now and the water is conducted underground after passing through stone structures on this property. The water rejoins Spencer Brook at the downstream corner of the Barrret’s Mill Road bridge.
If not illegal, this diversion at least strikes me as unconscionable. Nearly 300 m of the brook with superb habitat for aquatic organisms is allowed to dry up while the water is diverted to a private property—and for no apparent use, at that. I would urge the SuAsCo team to try to get the responsible parties to reconstruct the small pond so that there is year-round flow in Spencer Brook itself (the “easterly channel”), and that the “Mill” only receives excess flow.
(Note: Neither the 1969 7.5 minute nor the 1987 15 minute USGS quadrangles represent the stream channel situation accurately.)
SuAsCo Watershed Year 2001 Water Quality Assessment Report Appendix H H482wqar DWM CN92.0
BENTHOS
No benthos were collected. We did extensive reconnaissance on the day we arrived to sample to try to find an alternative sampling reach on Spencer Brook. Our search turned up only marginal habitats for benthic invertebrate sampling between Barrett’s Mill Road and the confluence with the Assabet River.
SAC06—Fort Pond Brook, Acton, MA (2 July 1996)
HABITAT
We sampled a fourth order reach adjacent to Parker Street, across from Parker House Apartments. The habitat here was generally very good. Riffles with gravel/cobble/boulder substrates predominated. The main habitat problem in this reach is the proximity of the road to the brook’s right (east) bank and the steep drop-off to the stream channel. This slope narrowly separates the stream bed from the road and it is sparsely covered with vegetation. The shoulder of the road is covered with low herbaceous cover but the embankment is covered mostly by trees and some shrubs, with little herbaceous understory. This bank has many areas where there is evidence of erosion or there is high erosion potential. Someone (probably the apartments) is disposing of leaf litter along this bank. While this may provide some short-term protection against erosion, during heavy run-off/high flow periods this material probably increases organic loading (hence, BOD) to the brook. The overall habitat score here was 150.
BENTHOS
This site was chosen as a watershed reference because it appears to offer some of the best habitat in the watershed for large-drainage-area streams. It is not ideal, however, from the standpoint of upstream development and the potential influences of nonpoint source pollution. Nevertheless, taken empirically, the data indicate that the benthic community is relatively healthy. The richness was 16, the FBI was 4.54, and the EPT richness was eight. As such, this is probably the best we had for a reference for streams of this size in the SuAsCo watershed.
SAC07—Nashoba Brook, Acton, MA (2 July 1996)
HABITAT
The reach sampled was downstream from the access road to Acton Indoor Sports (off route 2A between Wetherbee St. and Keefe Rd.—near the Concord line). With the exception of a short stretch at the outlet of Ice House Pond our reconnaissance led us to conclude that this reach was the most promising along the Nashoba Brook for applying the rapid bioassessment protocols. The bottom substrates were predominantly sand, with limited patches of gravel and a few bricks providing more stable substrate. Most of the sample was collected from beds of aquatic vegetation (probably Calitriche sp.). Flow velocity appeared to be adequate and the channel appeared to follow a natural pattern of meanders, with little indication of any channelization. Both banks were well vegetated. The overall habitat score was 135.
BENTHOS
Calculated against either reference, this site was determined to be in the moderately impaired category. Inasmuch as the habitat scores were comparable to those of the reference sites it is likely that the results reflect nonpoint source influences.
SAC08—Elizabeth Brook, Stow, MA (5 July 1996)
HABITAT
SuAsCo Watershed Year 2001 Water Quality Assessment Report Appendix H H582wqar DWM CN92.0
Elizabeth Brook flows through a relatively low-population-density area of the watershed dominated by wetlands. The best kick-sampling site we encountered was immediately upstream from route 117 in Stow. Sampling was restricted to the lower one quarter of the reach where the riffles and cobble/gravel substrates were predominant. The remainder of the reach was above the remnants of an old stone dam, and had sluggish flow. The overall habitat score was 170.
BENTHOS
Calculated against either reference, this site was determined to be in the moderately impaired category. This site had one of the highest habitat scores among the sites sampled so it is not likely that there were habitat limitations. With the extensive wetlands and impoundments upstream of this site and the proximity of housing in some stretches of the brook there may well be impacts from nonpoint source nutrient loadings (i.e., septic systems?).
SAC09—Fort Meadow Brook, Hudson, MA (2 July 1996)
HABITAT
This brook was sampled in a reach running roughly parallel with Shay Street through a nicely wooded area. This was generally very good habitat. There was a good frequency of riffles and the bottom substrate included lots of cobble and gravel but with an extensive amount of sand. The high proportion of sand among the bottom substrates appears to be a characteristic of the prevailing soils in the vicinity of this reach, and not the result of erosion, at this time. This area would be particularly vulnerable, however, to habitat destruction in the brook due to careless construction activities. The overall habitat score was 149.
Immediately upstream from the reach sampled trees are being cleared to within feet of the stream bank, presumably for house lots. No attempt has been made to ameliorate the effects of increased runoff that may result from this activity (e.g., silt screens, hay bails). The team may wish to check with the Hudson Conservation Commission, because there was no “file number” posted. Another situation that calls for action from the Conservation Commission occurs at a point well downstream from the sampled reach. There is already severe erosion taking place that is affecting wetland habitat as well as habitat in the brook itself. The cause is construction of new homes on Hosmer Street. Some silt screen has been installed, but not properly. As a result gully erosion is visible across the front yards of these new homes and an extensive amount of soil is deposited along the sides of the street and in the wetlands. This quite possibly may be a violation of the wetlands protection act.
BENTHOS
The RBP II scores calculated for this site indicate that it has a relatively healthy benthic community. This site will be a good one to track through the years, however, because it is clear that it will be receiving pressure from new home construction. It might be useful to engage this community in some sort of education program to alert landowners to land use practices that can minimize impacts and maximize watershed protection.
SAC10—North Brook, Berlin, MA (17 May 1996)
Though I did not conduct a thorough reconnaissance of this brook, the portion of it I did look at did not lend itself to rapid bioassessment protocols. If there is a specific interest in the status of this brook it may require a specially designed study. At the time of our visit there was a lot of activity related to the sand a gravel operation and construction at Solomon Pond Mall, both of which are neighbors of this brook. It was our intention to return to this brook to do further reconnaissance and evaluate habitat quality as well as any potential nonpoint source problems related to the mall or sand and gravel operation. Unfortunately, since we were running into time conflicts with other commitments and this brook was not rated as one of the higher priority concerns in the watershed we did not get back to it.
SuAsCo Watershed Year 2001 Water Quality Assessment Report Appendix H H682wqar DWM CN92.0
SAC11—Pantry Brook, Sudbury, MA (5 July 1996)
HABITAT
Much of Pantry Brook’s drainage is through wetlands. We did not find a suitable sampling location on the mainstem but did sample a small tributary to the brook. The stream comes from the outlet of a small pond in a very new residential development accessed by Julian’s Way, off Haynes Road. The stream flowed through woods that generally provided a wide buffer from the back yards of the nearest houses, those along Greystone Lane. It appeared that any potential for nonpoint source problems would be concentrated in the vicinity of the pond, where stormwater from Julian’s Way contributes to the headwaters. We sampled in a first order reach approximately 250 m downstream from the pond, a position along the stream between the cul-de-sac at the end of Hadley Lane to the east and the cul-de-sac at the end of Greystone Lane to the west (at least 100 m from either of these). The stream was very shallow but the channel had good sinuosity, riffles were present, and there was a lot of cobble and gravel—though about 60% of the stream bottom was sand (apparently consistent with the flood plain soils). About half of the available habitat in this reach was snags, and thus half the sampling effort included snags. The overall habitat score was 143.
BENTHOS
Compared against Gates Pond Brook (SAC03A) as the reference this site ranked as moderately impaired, so there may be nonpoint source influences here. Two factors that may have overstated the relative impairment of this brook were the ratio of scrapers to filtering collectors and the EPT index. Given the dense woodland setting of this brook the relative paucity of scrapers may be understandable. The EPT index for this site calculated out to 88% of the reference—qualifying for only three of six points toward the total—but the real difference was seven vs. eight. I suspect that if there are any significant nonpoint source impacts they are associated with the headwater ponds or road run-off from Julian’s Way.
SAC12—Hop Brook, Sudbury, MA (21 May 1996)
HABITAT
This brook was examined between route 20 and Codjer lane. It did not appear that the rapid bioassessment protocol could be applied here suitably. If benthic data are desired it will probably require a specifically designed study.
At route 20 the water was deep and fast, the bottom was sandy, and the margins were deep, soft muck. Routed aquatic vegetation—notably Potamogeton crispus—was well established even this early in the season. Filamentous algae were prominent along the margins. Clearly, this stream is carrying a heavy nutrient load.
At Union Avenue/Codjer Lane the water was also deep and fast with similar bottom characteristics. There is a water withdrawal at the upstream side of Union Avenue by Cavicchio Greenhouses. This is a big operation. The team may wish to check into whether this withdrawal is, or should be, registered under the Water Management Act.
The only potential for nonpoint sources of pollution I noted on this reconnaissance was the presence of several auto repair and auto body shops and a stone cutting operation, all located near the brook (along Station Road and Union Avenue) in the reach between route 20 and Codjer Lane.
SAC13—Eames Brook, Framingham, MA (3 July 1996)
HABITAT
It was intended that this brook would be sampled upstream and downstream of the Framingham Reduction Plant. The upstream site was designated SAC13A. Running parallel to Dudley Road, a short
SuAsCo Watershed Year 2001 Water Quality Assessment Report Appendix H H782wqar DWM CN92.0
distance (approximately 10 m) upstream was a small reinforced concrete bridge (with no road). Between the two bridges the brook had good current velocity. Amid the riffles bottom substrates were composed of cobble, gravel, and sand; snags provided additional substrate for colonization by benthic macroinvertebrates. Upstream from the small bridge the water appeared to stand stagnant over fine sediments in a straight, wide channel. Though the benthos sampling took place entirely within the riffles between the two bridges the habitat scoring considered the entire 100 m reach upstream from Dudley Road. Lots of bluegills, mats of algae, and filaments of algae were visible looking upstream from the small bridge. The habitat score total was 142.
Downstream from Dudley Road the brook meanders a bit before passing through a control structure (presumably no longer in use). In this stretch sediments are mucky to sandy and oils are released when the sediments are disturbed—especially where the brook borders the reduction plant. A slow current was perceptible through this stretch, and bluegills/pumpkinseeds could be seen swimming about. Even in May (when reconnaissance was conducted) the water was a turbid brown with well established populations of filamentous algae and macrophytes (Potamogeton crispus). Trash is strewn at various points all along from Dudley Road to the confluence with the Sudbury River.
During the reconnaissance in May the current velocity immediately downstream from the control structure was slow and the bottom substrates were mucky, in places deep muck. Closer to the confluence with the Sudbury the brook current was almost fast enough to appear as a riffle and the substrates appeared to be predominantly sand and heavy accumulations of leaf litter. It was expected at that time that this most downstream reach could be paired with the Dudley Road site, relying on the snags in the brook to provide sufficient productive substrate. On the sampling date, however, with water levels lower, there was no stretch of this brook downstream from Dudley Road that appeared to present sufficient macroinvertebrate habitat for a useful assessment. If the team wishes to have macroinvertebrate data that bracket the Reduction Plant I recommend that a study be designed specifically for this application (it will probably require a sampling protocol relying on introduced substrates). Because of the release of the sediment oils that was observed, the team might get more useful information from sampling sediments in the vicinity of the Reduction Plant and having them analyzed for PAHs and other petroleum by-products.
BENTHOS
SAC13A was determined to be moderately impaired when compared against SAC06. There are several possibilities that likely contribute to this, all associated with the fact that the reservoir upstream of this site (Farm Pond) is apparently nutrient rich, and about half of the lake’s shoreline is bordered by urban development in downtown Framingham.
SAC14—Indian Brook, Ashland, MA (3 July 1996)
HABITAT
Indian Brook was selected as a potential reference site because its drainage is about as sparsely populated as any in this watershed. The brook originates in central Hopkinton, winding its way through an extensive wetland area and feeding Hopkinton Reservoirs in Hopkinton State Park. From the outlet of the lower reservoir (swimming area) Indian Brook leaves the park as a sluggish, if not stagnant, stream as seen from the vicinity of Howe Street. Current velocity is sufficient through the 250 m or so approaching Cross Street but this stretch was so straight that it would seem to have been the result of past channelization. As a consequence, the habitat was somewhat monotonous (in terms of substrates, velocity, and water depth) and considered to be unsuitable for reference purposes.
Approximately 200 m or so downstream from Cross Street, however, natural channel sinuosity was evident and steeper gradient created excellent riffles as the brook flowed through a forested setting. The sample reach was located along this part of the brook, with the lower end marked by a small wooden bridge associated with a Boy Scout campground. The bottom substrates were a mix of cobble, gravel, and sand, with frequent boulders and rubble. The overall habitat score was 173.
SuAsCo Watershed Year 2001 Water Quality Assessment Report Appendix H H882wqar DWM CN92.0
BENTHOS
In spite of it’s relatively high habitat score Indian Brook ranked as moderately impaired when compared against Fort Pond Brook (SAC06). This could indicate the influence of the possibly eutrophic waters that flow out of the Hopkinton Reservoirs to make up Indian Brook, or perhaps nonpoint source pollution downstream from Hopkinton State Park.
SAC15—Whitehall Brook, Hopkinton, MA (11 July 1996)
HABITAT
Whitehall Brook traverses an extensive network of wetlands, flowing from Whitehall Reservoir in Hopkinton to Cedar Swamp in Westborough and the head of the Sudbury River. Most of this brook is slow moving, with sand, or finer, bottom substrates. The only reach we could find with a suitable combination of current velocity and productive substrates for macroinvertebrate sampling was at the downstream side of Fruit Street; and it is undoubtedly the road crossing that causes enough of a gradient to create the riffle habitat necessary for applying our kick-sampling methodology. Below this reach the gradient again flattens out, the flow becomes imperceptible, and cover/substrate for both fish and invertebrates is scarce. The overall habitat score for the sample reach was 144.
BENTHOS
The RBP II results indicate that SAC15 was unimpaired compared against either Fort Pond Brook or Gates Pond Brook.
SUMMARY
Ten of 14 sites investigated in this watershed had RBP II scores indicating moderate impairment. This suggests that the team will want to take a closer look at these locations and perhaps gather more information on these sites or target them with specific data collections. Four of the sites surface as most in need of follow-up. These are River Meadow Brook in Carlisle (SAC04), Spencer Brook in Concord (SAC05), Fort Meadow Brook in Hudson (SAC09), and Eames Brook in Framingham (SAC13).
River Meadow Brook (SAC04) by all appearances should have provided the best assemblage of macroinvertebrates, but it scored as moderately impaired. Possibilities to explore are nonpoint sources of pollution or pesticide residues related to the cranberry bogs.
Spencer Brook (SAC05) was a severe case of habitat loss, and it is quite needless. I urge the team to look into requiring that a minimum flow be maintained in Spencer Brook between Angiers Pond and Barrett’s Mill Road year-round.
Fort Meadow Brook (SAC09), though apparently healthy now, appears to be threatened by construction activities in its watershed. Indeed there is already evidence of serious erosion—with sediment loading to the brook—taking place. Proactive attempts at educating the Hudson Conservation Commission, property owners, and contractors on best management practices to minimize impacts and maximize wetland/watershed protection will undoubtedly pay huge dividends over the next several years.
Eames Brook (SAC13) presented problems for conducting benthic macroinvertebrate assessments. As a consequence I was unable to bracket the Framingham Reduction Plant with sampling sites. From my reconnaissance of the reach between the plant and the confluence with the Sudbury River, however, I observed sediment and surface oils, odors, and rusted-out metal drums suggesting that this area has a history of contamination with potentially toxic materials. It would be prudent to follow up with some sediment testing for PAHs, etc. in this reach to determine if it should have status as a hazardous waste site.
cc: A.S. JohnsonE. Chesebrough
SuAsCo Watershed Year 2001 Water Quality Assessment Report Appendix H H982wqar DWM CN92.0
APPENDIX AAquatic Macroinvertebrate Taxa List
Table A1. (Continued.)
Table A1. List of macroinvertebrate taxa collected from stream sites in the Sudbury/Assabet/Concord (SuAsCo) watershed between 1 and 11 July 1996. The sampling sites were in: Mill Brook (01A and 01B), Concord; Pine Brook (02), Wayland; Gates Pond Brook (03A and 03B), Berlin; River Meadow Brook (04), Carlisle; Fort Pond Brook (06), Acton; Nashoba Brook (07), Acton; Elizabeth Brook (08), Stow; Fort Meadow Brook (09), Hudson; Pantry Brook (11), Sudbury; Eames Brook (13A), Framingham; Indian Brook (14), Ashland; Whitehall Brook, Hopkinton—all in Massachusetts.
RBP II calculations for stream sites sampled in the Sudbury/Assabet/Concord (SuAsCo) watershed between 1 and 11 July 1996.
Table B1. Summary of RBP II calculations for stream sites sampled in the Sudbury/Assabet/Concord (SuAsCo) watershed between 1 and 11 July 1996. All comparisons use SAC03A as reference.
Table B2. Summary of RBP II calculations for stream sites sampled in the Sudbury/Assabet/Concord (SuAsCo) watershed between 1 and 11 July 1996. All comparisons use SAC06 as reference.
Table B3. Summary of RBP II calculations for comparison of the downstream (SAC01B) Mill Brook (Concord, MA) site to the upstream (SAC01A) site. Sites sampled on 1 July 1996.
Station SAC01A(Ref.) Points Ratio to
Ref.
SAC01B% of Ref. Points
Taxa Richness 9 6 13/9 144 6
FBI 6.21 6 6.21/6.14 101 6
Scrapers/Filt. Coll. 1 6 0.20/1 20 0
EPT/Chironomidae 0.08 6 0.07/0.08 88 6
% Contribution(dom. fam.)
60 0 54 0
EPT Index 1 6 1/1 100 6
% Similarity (Ref.) 6 56 3
Score 36 27
% of Reference (Ref.) 27/36 75
Ranking (Ref.) non/moderatelyimpaired
Habitat Score 95 64
% of ref. Habitat (Ref.) 64/95 67
HabitatComparability
(Ref.) partiallysupporting
SuAsCo Watershed Year 2001 Water Quality Assessment Report Appendix H H4082wqar DWM CN92.0
APPENDIX I
SMART MONITORING PROGRAM: SuAsCo WATERSHED DATA 2000 - 2001
Please refer to DEP DWM CN 83.0 Data Validation Report For Year 2000 Project Data (March 2003) and CN 149.0 Data Validation Report For Year 2001 Project Data (December 2004) for details on the review and validation of environmental data collected by the SMART program. Additional information on objectives, methods, survey conditions, etc. is available in a technical memorandum by Therese Beaudoin, DEP CERO (in preparation).
[photo removed for web publication]
Concord River downstream of Rogers Street Bridge, Lowell
SuAsCo Watershed Year 2001 Water Quality Assessment Report Appendix I I182wqar DWM CN92.0
SUASCO WATERSHED SMART SAMPLING SUMMARY – 2000 THROUGH 2001
Location and Segment Numbers Station Name Dates Sampled1
Assabet River @ School Street, Northborough MA82B-02 AS04
ASSABET RIVER (Saris: 8246775)Unique_ID: 695 Station: AS04, Mile Point: 28Description: approximately 20 meters upstream/south of School Street, Northborough
Date OWMID Time Depth Temp pH Conductivity @ 25C TDS DO % Saturation(24hr) (m) (C) (SU) (uS/cm) (mg/l) (mg/l) (%)
ASSABET RIVER (Saris: 8246775)Unique_ID: 697 Station: AS18, Mile Point: 7.6Description: approximately 50 meters upstream/southwest of the Route 27/62 bridge, Maynard.
Date OWMID Time Depth Temp pH Conductivity @ 25C TDS DO % Saturation(24hr) (m) (C) (SU) (uS/cm) (mg/l) (mg/l) (%)
SUDBURY RIVER (Saris: 8247650)Unique_ID: 696 Station: SU07, Mile Point: 16.5Description: just upstream/south of Danforth Street, Framingham
Date OWMID Time Depth Temp pH Conductivity @ 25C TDS DO % Saturation(24hr) (m) (C) (SU) (uS/cm) (mg/l) (mg/l) (%)
3/8/2000 SM-0003 10:16 0.2 5.6 6.8u 353 226 12.8 1015/3/2000 SM-0042 10:46 0.3 11.8 6.9 313 200 11.2 1017/12/2000 SM-0096 10:05 0.5 21.9 7.1c 410 262 8.0 908/28/2000 SM-0143 10:51 0.7 22.1 7.0u 422 270 9.5 10711/15/2000 SM-0183 09:59 0.4 8.9 6.9 353 226 11.3 97 i = inaccurate readings from Multi-probe likely; may be due to significant pre-survey calibration problems, post-survey calibration readings outside typical acceptance range for the low ionic check and for the deionized blank water check, lack of calibration of the
SuAsCo Watershed Year 2001 Water Quality Assessment Report Appendix I I382wqar DWM CN92.0
depth sensor prior to use, or to checks against laboratory analyses.c = greater than calibration standard used for pre-calibration, or outside the acceptable range about the calibration standard.
SuAsCo Watershed Year 2001 Water Quality Assessment Report Appendix I I482wqar DWM CN92.0
Table I2. 2001 SMART in situ Hydrolab® data- SuAsCo Watershed.
CONCORD RIVER (Saris: 8246500)Unique_ID: W0679 Station: CO7, Mile Point: 0.8Description: approximately 100 meters downstream/north from Rogers Street, Lowell
Date OWMID Time Depth Temp pH Conductivity @ 25C TDS DO % Saturation(24hr) (m) (C) (SU) (uS/cm) (mg/l) (mg/l) (%)
ASSABET RIVER (Saris: 8246775)Unique_ID: W0695 Station: AS04, Mile Point: 28Description: approximately 20 meters upstream/south of School Street, Northborough
Date OWMID Time Depth Temp pH Conductivity @ 25C TDS DO % Saturation(24hr) (m) (C) (SU) (uS/cm) (mg/l) (mg/l) (%)
ASSABET RIVER (Saris: 8246775)Unique_ID: W0697 Station: AS18, Mile Point: 7.6Description: approximately 50 meters upstream/southwest of the Route 27/62 bridge, Maynard.
Date OWMID Time Depth Temp pH Conductivity @ 25C TDS DO % Saturation(24hr) (m) (C) (SU) (uS/cm) (mg/l) (mg/l) (%)
## = Censored data (i.e., data that has been discarded for some reason). i = inaccurate readings from Multi-probe likely u = unstable readings, due to lack of sufficient equilibration time prior to final readings, non-representative location, highly-variable water quality conditions, etc. c = greater than calibration standard used for pre-calibration, or outside the acceptable range about the calibration standard.
SuAsCo Watershed Year 2001 Water Quality Assessment Report Appendix I I582wqar DWM CN92.0
## = Censored data (i.e., data that has been discarded for some reason). i = inaccurate readings from Multi-probe likely u = unstable readings, due to lack of sufficient equilibration time prior to final readings, non-representative location, highly-variable water quality conditions, etc.
SuAsCo Watershed Year 2001 Water Quality Assessment Report Appendix I I682wqar DWM CN92.0
ASSABET RIVER (Saris: 8246775)Unique_ID: W0695 Station: AS04, Mile Point: 28Description: approximately 20 meters upstream/south of School Street, Northborough
Date OWMID QAQC Time Turbidity Chloride Alkalinity Hardness NH3-N NO3-NO2-N
ASSABET RIVER (Saris: 8246775)Unique_ID: W0697 Station: AS18, Mile Point: 7.6Description: approximately 50 meters upstream/southwest of the Route 27/62 bridge, Maynard.
Date OWMID QAQC Time Turbidity Chloride Alkalinity Hardness NH3-N NO3-NO2-N
SuAsCo Watershed Year 2001 Water Quality Assessment Report Appendix I I782wqar DWM CN92.0
** = Missing data (i.e., data that should have been reported)d = precision of field duplicates (as RPD) did not meet project data quality objectives identified for program or in QAPP. Batched samples may also be affected.
SuAsCo Watershed Year 2001 Water Quality Assessment Report Appendix I I882wqar DWM CN92.0
ASSABET RIVER (Saris: 8246775)Unique_ID: W0695 Station: AS04, Mile Point: 28Description: approximately 20 meters upstream/south of School Street, NorthboroughDate OWMID QAQ
ASSABET RIVER (Saris: 8246775)Unique_ID: W0697 Station: AS18, Mile Point: 7.6Description: approximately 50 meters upstream/southwest of the Route 27/62 bridge, Maynard.Date OWMID QAQC Time Dept
## = Censored data (i.e., data that has been discarded for some reason). -- = No data (i.e., data not taken/not required ** = Missing data (i.e., data that should have been reported). m = method SOP not followed, only partially implemented or not implemented at all, due to complications with sample matrix (e.g., sediment in sample, floc formation), lab error (e.g., cross-contamination between samples), additional steps taken by the lab to deal with matrix complications, lost/unanalyzed samples, and missing data.d = precision of field duplicates (as RPD) did not meet project data quality objectives identified for program or in QAPP. Batched samples may also be affected.
SuAsCo Watershed Year 2001 Water Quality Assessment Report Appendix I I1182wqar DWM CN92.0
Table I5. 2000 SMART Quality Assurance/Quality Control data- SuAsCo Watershed.
ASSABET RIVER (Saris: 8246775)Unique_ID: 695 Station: AS04, Mile Point: 28Description: approximately 20 meters upstream/south of School Street, Northborough
ASSABET RIVER (Saris: 8246775)Unique_ID: 697 Station: AS18, Mile Point: 7.6Description: approximately 50 meters upstream/southwest of the Route 27/62 bridge, Maynard.
d = precision of field duplicates (as RPD) did not meet project data quality objectives identified for program or in QAPP. Batched samples may also be affected.
Field Blank Sample/Field Blank Sample (Palis: 00000)Unique_ID: W00-8 Station: BLANKDescription: QAQC: Field Blank Sample
Relative Percent Difference 0.0% 0.0% 3.0% 1.4% 9.5% 3.5% 7.3% 1.4% 27.3%** = Missing data (i.e., data that should have been reported).-- = No data (i.e., data not taken/not required d = precision of field duplicates (as RPD) did not meet project data quality objectives identified for program or in QAPP. Batched samples may also be affected.
SuAsCo Watershed Year 2001 Water Quality Assessment Report Appendix I I1482wqar DWM CN92.0
APPENDIX J- 21E TIER CLASSIFIED SITES IN THE SUASCO WATERSHED
Table J1. MA DEP Bureau of Waste Site Cleanup 21E Tier Classified Oil and HAZMAT Sites in the SuAsCo Watershed as of 8 March 2004.
Rtn Name Address Town Status2-0000010 WR Grace 50 Independence Rd Acton Tier 1A3-0000216 Nyanza Chemical Megunko Rd Ashland Tier 1A2-0000572 Exxon Station 139 Central St Berlin Tier 1A3-0001205 Silicon Transistor Corporation 27 Katrina Rd Chelmsford Tier 1A3-0000713 Costa S Dump Fmr 89-103 Billerica St Lowell Tier 1A3-0000352 Silresim Chemical Corp 86 Tanner St Lowell Tier 1A3-0002473 Army Research Center Kansas St Natick Tier 1A3-0003672 Clean Corp 229 North Main St Natick Tier 1A3-0000435 Sperry Research Center Fmr 100 North Rd Sudbury Tier 1A2-0000153 Hocomonco Pond Fisher St Westborough Tier 1A3-0001461 Rj Kelly Co 9-11 Executive Park Billerica Tier 1B3-0020242 Paramount Cleaners 20 Boston Rd Chelmsford Tier 1B3-0004275 Mobil Gasoline Station No 01 789 22 Concord Tpke Concord Tier 1B3-0000589 Commonwealth Gas Co 350 Irving St Framingham Tier 1B3-0000166 Auto Brite Car Wash 105 Hollis St Framingham Tier 1B2-0000763 Marlco Facility 98 Mrl Former 279 Maple St Marlborough Tier 1B2-0013156 Commercial Property 222 East Main St Marlborough Tier 1B3-0002423 Mobil Station 432 Boston Post Rd Sudbury Tier 1B3-0013302 Raytheon Company 430 Boston Post Rd Wayland Tier 1B2-0000401 Mobil Station 6aw #Goh Massachusetts Tpke Westborough Tier 1B2-0012713 Pitt Construction 816 Main St Acton Tier 1C3-0014545 Martell Motor Express 11 Brick Kiln Rd Billerica Tier 1C3-0000565 Bill & Andys 30 Chelmsford St Chelmsford Tier 1C3-0014625 Commercial Property 54 Chelmsford St Chelmsford Tier 1C3-0000290 Electrometals Inc Fmr 275 Billerica Rd Chelmsford Tier 1C3-0012928 17 Progress Ave 17 Progress Ave Chelmsford Tier 1C3-0001582 Chelmsford Gulf Fmr Citgo 7 Acton Rd Chelmsford Tier 1C3-0002739 Care Cleaners 28 Central Sq Chelmsford Tier 1C3-0004757 Ampet Gasoline Station 100 Chelmsford St Chelmsford Tier 1C3-0000709 Amoco 1166 Fmr 95 Chelmsford St Chelmsford Tier 1C3-0020002 3m Electrical Products Division 279 Billerica Rd Chelmsford Tier 1C3-0018998 Emerson Hospital 133 Old Rd To 9 Acre Cor Concord Tier 1C
3-0021297Parcel 2322 Debris Area Off Knox Trail Off Knox Trl Concord Tier 1C
3-0019550 Industrial Property 770 Water St Framingham Tier 1C3-0021777 Ellingwood Realty Trust 145 Meadow St Framingham Tier 1C2-0013803 Pyne Sand & Stone Co 66 Fruit St Hopkinton Tier 1C3-0000035 Fmr Raytheon Facility 350 Woburn St Lowell Tier 1C2-0010629 Shell Service Sta 342 Boston Post Rd Marlborough Tier 1C2-0013286 Parcel 27 Commercial Property West Main St Marlborough Tier 1C2-0011001 Shell Service Sta 342 Boston Post Rd Marlborough Tier 1C3-0015672 Intersection With Rte 27 891 Worcester Rd Natick Tier 1C2-0013150 Hop Brook Flood Control Facility Southwest Cutoff Northborough Tier 1C2-0001050 Marane Bulk Terminal Fmr 866 Hartford Tpke Shrewsbury Tier 1C2-0012504 Service Station 626 Great Rd Stow Tier 1C3-0004202 Cumberland Farms/Gulf 470 Boston Post Rd Sudbury Tier 1C3-0010592 Union St 428 Boston Post Rd Sudbury Tier 1C
Rtn Name Address Town Status3-0015951 Rte 20 475 Boston Post Rd Sudbury Tier 1C3-0000074 Coatings Engineering 33 Union Rd Sudbury Tier 1C3-0003325 Shepards Mobil Station 268 Boston Post Rd Wayland Tier 1C3-0017974 Cooks Automotive Of Wayland Inc 356 Boston Post Rd Wayland Tier 1C2-0000865 Deblois Oil 240 Turnpike Rd Westborough Tier 1C2-0013978 Fiba Technologies 97 Turnpike Rd Westborough Tier 1D2-0000493 Powdermill Manufacturing 2 Powdermill Rd Acton Tier 1D2-0012283 Meineke Muffler 263 Main St Acton Tier 1D2-0013519 Intersection Of Rt 111 And Rt 27 Massachusetts Ave Acton Tier 1D2-0014429 Concord Oil Co Facility 68 Central St Acton Tier 1D3-0002459 Gasoline Station Fmr Pond St Kings Plz Ashland Tier 1D3-0000215 Property 11 Mulhall Dr Ashland Tier 1D3-0003617 Commercial Property 230 Eliot St Ashland Tier 1D3-0010908 No Location Aid 32 Nickerson Rd Ashland Tier 1D3-0012610 Fmr Three C Electric Co 280-330 Pleasant St Ashland Tier 1D3-0015667 Nyanza Npl Megunko Rd Ashland Tier 1D2-0011719 Tolman Greenhouses 63 Walnut St Berlin Tier 1D2-0013494 Residence 158 Lyman St Berlin Tier 1D3-0000644 Faulkner Mills 71 Faulkner St Billerica Tier 1D3-0003679 Commercial Property Town Farm La Billerica Tier 1D3-0004080 Rte 4 Sewer Project Nashua Rd Overlook Rd Billerica Tier 1D3-0013453 1/2 Mile South Of Rte 129 Rte 3 N Billerica Tier 1D3-0017475 North Of Concord Rd Exit Rte 3n Billerica Tier 1D3-0020073 In Front Of 371 Acton Rd Acton Rd Rte 27 Chelmsford Tier 1D3-0022222 No Location Aid 27 Katrina Rd Chelmsford Tier 1D3-0000891 Auto Body Shop Fmr 59 Beaver St Framingham Tier 1D3-0010017 No Location Aid Rte 30 Speen St Framingham Tier 1D3-0000568 Delitizer Restaurant 147-149 Cochituate Rd Framingham Tier 1D3-0004755 Manhole Concord St Lincoln St Framingham Tier 1D3-0006011 Property 36 Berkshire Rd Framingham Tier 1D3-0002622 Municipal Property Arthur St Framingham Tier 1D3-0001405 Property 448 Water St Framingham Tier 1D3-0003940 Gmc Settling Lagoon 63 Western Ave Framingham Tier 1D3-0004356 General Motors Beaver Brook 63 Western Ave Framingham Tier 1D3-0000317 Gmc Gm Assmbly Division Fmr 63 Western Ave Framingham Tier 1D3-0003374 Property 19 Ruth Dr Framingham Tier 1D3-0018948 No Location Aid 44 Morton St Framingham Tier 1D3-0001666 Commercial Property 127 Cochituate Rd Framingham Tier 1D3-0002587 Commercial Property 192 Irving St Framingham Tier 1D3-0018613 No Location Aid 69 Brookfield Cir Framingham Tier 1D2-0011806 No Location Aid 85 Hayden Rowe Hopkinton Tier 1D2-0010964 St Johns Cemetery Mt Auburn St Hopkinton Tier 1D2-0013794 In Front Of 85 Hayden Rowe St Hayden Rowe St Hopkinton Tier 1D3-0000349 Commonwealth Chemical Corp 1052 Gorham St Lowell Tier 1D3-0000092 Daley School Flemming St Lowell Tier 1D3-0000754 Undeveloped Property 135-137 Billerica St Lowell Tier 1D3-0017146 No Location Aid Industrial Ave Lowell Tier 1D3-0004511 Scannell Boilerworks 26-50 Tanner St Lowell Tier 1D3-0000353 Spray Tec Inc Fmr 34 Newhall St Lowell Tier 1D2-0000832 Boroughs Tire Co 167 Northboro Rd Marlborough Tier 1D
Rtn Name Address Town Status2-0000086 Acme Glass 134 West Main St Marlborough Tier 1D2-0011998 Frye Tanner 84 Chestnut St Marlborough Tier 1D2-0013965 Millham Brook Glen St And Ripley St Marlborough Tier 1D
2-0013808Rte 495 S North Of Rte 290 Onramp Rte 495 Marlborough Tier 1D
3-0000575 R D Smith Commonwealth Rd Natick Tier 1D3-0002906 Municipal Wells Off Massachusetts Tpke Natick Tier 1D3-0006028 Property 17 Greenleaf Rd Natick Tier 1D3-0003858 Parcel 307 West Central St Natick Tier 1D3-0014932 Framingham Ext Relief Svs 327 West Central St Natick Tier 1D
3-0019723Roadway Utilities Rte 30 Framingham Line Rte 30 @ Speen St Natick Tier 1D
2-0010518 E Of Church St Rte 290 E Northborough Tier 1D2-0012536 Former Volvo Dealer 78 Turnpike Rd Southborough Tier 1D3-0004220 Commercial Property 96 Main St Wayland Tier 1D2-0000982 Burnside Property 22 South St Westborough Tier 1D2-0013004 Assessors Map 30 Parcels 10a & B 160 Flanders Rd Westborough Tier 1D2-0012850 Concord Oil Co 68 Central St Acton Tier II2-0013400 Tosco Corp 289 Main St Acton Tier II2-0014428 Concord Oil Co Facility 68 Central St Acton Tier II3-0001812 Pels Sunoco 126 Pond St Ashland Tier II3-0001365 Perini Corp Property 11 Cordaville Rd Ashland Tier II3-0004669 Middlesex Equipment 2 Megunko Rd Ashland Tier II3-0018035 No Location Aid 205 Main St Ashland Tier II3-0020621 No Location Aid 196 Pond St Ashland Tier II3-0021077 No Location Aid 79 Concord St Ashland Tier II3-0012670 Circle K Store 02515 192 Boston Rd Billerica Tier II3-0012013 Billerica House Of Correction 269 Treble Cove Rd Billerica Tier II3-0017905 No Location Aid 313 Boston Rd Billerica Tier II3-0003747 Mobil Station 01 331 184 Boston Rd Billerica Tier II3-0022226 No Location Aid 301 Boston Rd Billerica Tier II3-0002578 Gasoline Station 18 Lowell St Carlisle Tier II3-0003606 Triangle Service Station 177 Boston Rd Chelmsford Tier II3-0014784 No Location Aid 7-9 Church St Concord Tier II3-0003116 Texaco Service Station Fmr 686 Elm St Concord Tier II3-0001189 Concord Oil 147 Lowell Rd Concord Tier II3-0003844 Pump N Pantry 1089 Concord Tpke Concord Tier II3-0022242 No Location Aid 120 Thoreau St Concord Tier II3-0010090 Albies Oil 3 School St Framingham Tier II3-0013144 300 Ft West Of Natick Town Line 22-24 Waverly St Framingham Tier II3-0012985 Corner Of Lindburgh Rd 472 Concord St Framingham Tier II3-0004045 At&T 825 Waverly St Framingham Tier II3-0016656 No Location Aid 47 Blandin Ave Framingham Tier II3-0004084 Framingham District Court 600 Concord St Framingham Tier II3-0003041 Bishop Terrace Condominiums Bishop Dr Framingham Tier II3-0004674 Sunoco Gasoline Station 506 Concord St Framingham Tier II3-0016580 Beco Station 240 Leland St Framingham Tier II3-0012932 Ellis St 1181-1183 Worcester Rd Framingham Tier II3-0017657 Henry St Garage/Dpw Garage Henry St Framingham Tier II3-0001047 Ludlow Corp Fmr 387-699 Waverly St Framingham Tier II3-0013141 No Location Aid 697-705 Waverly St Framingham Tier II
Rtn Name Address Town Status3-0002361 Aamco Transmission 740 Worcester Rd Framingham Tier II3-0003939 Gmc Fmr Landfill 63 Western Ave Framingham Tier II3-0000691 Property 25 Loring Dr Framingham Tier II3-0017678 No Location Aid 21 Beaver Court Ext Framingham Tier II3-0012507 Gulf Gasoline Station 655 Waverly St Framingham Tier II3-0019689 Old Colony Rail Spur Irving St Framingham Tier II3-0003215 Gasoline Station 7w Ma Tpke Mm 1140 Framingham Tier II3-0002159 Shell Gasoline Station 480 Franklin St Framingham Tier II3-0002100 Shell Service Station 846 Concord St Framingham Tier II3-0006016 Property 200 State St Framingham Tier II3-0019933 Cross St Union Ave 73 Mt Wayte Ave Framingham Tier II3-0020118 Cross St Union Ave 73 Mt Wayte Ave Framingham Tier II3-0021425 No Location Aid 58 Pearl St Framingham Tier II3-0021920 Assessors Map 240 Block 75 Lockland Ave Framingham Tier II2-0000807 Mobil Station 01 323 92 West Main St Hopkinton Tier II2-0013397 Tosco Corp 60 Main St Hopkinton Tier II2-0010526 Hudson Lagoons 12 Wheeler Rd Hudson Tier II2-0000069 Creative Home Furnishings 32 Washington St Hudson Tier II3-0001796 Lincoln Automotive 170 South Great Rd Lincoln Tier II
3-0014478 On Centennial Island852 3 And 852 5 Lawrence St Lowell
Tier II
3-0015650 Northeast Side Of Building 45 Bolt St Lowell Tier II3-0017748 Gorham And Maple Streets Gorham And Maple Lowell Tier II3-0000527 Texaco Service Station Fmr 7 Lincoln Sq Lowell Tier II3-0003828 Gulf Station 365 Chelmsford St Lowell Tier II3-0000601 Jetline/Geochem 263 Howard St Lowell Tier II3-0018305 No Location Aid Gorham And Maple Sts Lowell Tier II3-0019154 No Location Aid 51 Nottingham St Lowell Tier II3-0020194 Near Court St 125 Manchester St Lowell Tier II3-0021342 No Location Aid 1403 Gorham St Lowell Tier II3-0022069 Lowell Used Auto Parts Inc 108 Tanner St Lowell Tier II
3-0021798Washer Concord River At Rr Tracks Bolt St Lowell
Tier II
3-0021267 Mobil Facility 01 795 980 Chelmsford St Lowell Tier II2-0000774 Fossile Construction 329-331 Lincoln St Marlborough Tier II2-0000727 Houde Farm Fmr 399 Berlin Rd Marlborough Tier II2-0000093 Old Colony Gas Station 247 Maple St Marlborough Tier II2-0010699 Bakerly Citgo/King Brakes 146 Maple St Marlborough Tier II2-0013126 Wayside Ford 428 Maple St Marlborough Tier II2-0013738 Marlborough DPW 135 Neil St Marlborough Tier II2-0011486 Shell Service Station 413 Lakeside Ave Marlborough Tier II
2-0014267Mobil Corp Parcel 27 Commercial Property West Main St Marlborough
Tier II
2-0014434 Mobil Station 260 West Main St Marlborough Tier II2-0014341 Fmr B And M Turnaround 56 Jefferson St Marlborough Tier II2-0014246 Rk Pine Tree Shopping Ctr 771 Boston Post Rd Marlborough Tier II2-0014270 Mobil Facility #01-794 529 Boston Post Rd Marlborough Tier II2-0000709 Heled Inc Property 151 Main St Maynard Tier II2-0012751 Maynard Dpw 38 Winter St Maynard Tier II3-0004310 Derosa Florist Inc 54 Highland St Natick Tier II3-0021037 Pegan Cove Property Washington St Natick Tier II
Rtn Name Address Town Status2-0000674 Texaco Service Station 23 Belmont St Northborough Tier II2-0013507 No Location Aid 45 West Main St Northborough Tier II2-0011682 Logan Equipment 800 Hartford Tpke Shrewsbury Tier II2-0010254 Near Sudbury Reservoir 90 Turnpike Rd Southborough Tier II2-0010279 J Melone & Sons Inc 77 White Pond Rd Stow Tier II2-0013854 Nextel Communications 45 White Pond Rd Stow Tier II3-0019132 Rte 117 142 North Rd Sudbury Tier II3-0001594 Public School 41 Cochituate Rd Wayland Tier II3-0004394 Wayland Automotive 322 Commonwealth Rd Wayland Tier II3-0003171 Mobil Station 01 515 315 Commonwealth Rd Wayland Tier II2-0011308 Corrugated Paper Co 111 Milk St Westborough Tier II2-0000220 Carlstrom Pressed Metal 65 Fisher St Westborough Tier II2-0000426 Stedt Hydraulic Crane Corp 27 Washington St Westborough Tier II2-0013490 Westborough State Hosp Lyman St Westborough Tier II2-0014298 Nardone Sand & Gravel 37 Power Rd Westford Tier II
Figure J1. MA DEP Bureau of Waste Site Cleanup 21E Tier Classified Oil and HAZMAT Sites in the SuAsCo Watershed.
APPENDIX K- SOLID WASTE FACILITIES IN THE SUASCO WATERSHED Table K1. MA DEP Bureau of Waste Prevention Solid Waste Landfill Facilities in the SuAsCo Watershed
Site_Name Address Town CAPPED LINER Owner/Operator STATUS TONS/DAY SUBWATERSHE
D
Acton Landfill 14 Forest Rd/Rte 2 Acton Capped Not Lined Town Of Acton Closed 0 MA82B-13 or MA82B-14
Ashland Landfill Howe St Ashland Capped Not Lined Town Of Ashland Closed 0 MA82A-12Bedford Landfill Carlisle Rd Bedford Not Capped Not Lined Town Of Bedford Inactive 0 MA82A-07
Bedford Compost Site Carlisle Rd Bedford Town Of Bedford Active 0 MA82A-07
Berlin Landfill 48 Jones Rd Berlin Not Lined Town Of Berlin Inactive
Berlin Transfer Station 48 Jones Rd Berlin Unknown Town Of Berlin Active 2
Boxborough Transfer Station Codman Hill Rd Boxborough Unknown Town Of Boxborough Active 25 MA82B-12
Boylston Landfill Mile Hill Rd Boylston Capped Not Lined Town Of Boylston/ E.J. Flynn Engineers 0 MA82A-08
Carlisle Landfill 26 Lowell St Carlisle Not Capped Not Lined Town Of Carlisle Inactive 0 MA82A-21Carlisle Transfer Station 26 Lowell St Carlisle Town Of Carlisle Active 0 MA82A-21
Concord Landfill Walden St (Rte 126) Concord Capped Lined Town Of Concord Closed 0 MA82A-20
Concord Compost Site Walden St (Rte 126) Concord Unknown Town Of Concord Active 0 MA82A-20
Corenco Industrial Landfill 525 Woburn St/Billerica Ave Billerica Not Capped Not Lined Baker Commodities Inc. Inactive 0 MA82A-21
E L Harvey Landfill Wood St (Rte 135) Hopkinton Capped Not Lined El Harvey & Sons Closed 0 MA82A-11 or MA82A-01
El Harvey Transfer/ Recycling Facility 68 Hopkinton Rd (Rte 135) Westborough Unknown El Harvey & Sons Inc Active 500 MA82A-11 or
MA82A-01
Fletcher Landfill South Acton Rd Stow Not Lined Wallace M. Fletcher Inactive 0 MA82B-13
Framingham Ash Landfill Rte 9/Old Gates Rd Framingham Capped Not Lined Town Of Framingham Closed 0 Reservoir #3 (MA82046)
Framingham Incinerator Mt Wayte St Framingham Unknown Town Of Framingham Inactive 0 MA82A-13Framingham Landfill Millwood St Framingham Not Lined Inactive 0 MA82A-02Framingham Landfill
Compost Site Dudley Rd Framingham Not Lined Town Of Framingham Inactive 0 MA82A-13
Grafton State Hospital Dump Green St Shrewsbury Not Capped Not Lined Ma Div Of Capital Asset
Mgmt Inactive 0 MA82B-01
Hudson Landfill Gates Pond Rd Berlin Capped Not Lined Town Of Hudson Closed 0 MA82B-04
Hudson Landfill Compost Site Old Stow/Cemetaty Rds Hudson Unknown
Resource Control Inc./United Waste
Systems0 MA82B-05
Marlborough Landfill Hudson/Bolton Sts (Rte 85) Marlborough Capped Not Lined Town Of Marlborough Closed 0 MA82B-11Marlborough Sludge
Landfill 785 Boston Post Road-East Marlborough Not Lined Town Of Marlborough Active MA82A-15
Table K1 (Continued). MA DEP Bureau of Waste Prevention Solid Waste Landfill Facilities in the SuAsCo Watershed
SuA
sCo W
atershed 2001 Water Q
uality Assessm
ent Report
Appendix K
K1
82wqar
DW
M C
N92.0
SuA
sCo W
atershed 2001 Water Q
uality Assessm
ent Report
Appendix K
K
282w
qarD
WM
CN
92.0
Site_Name Address Town CAPPED LINER Owner/Operator STATUS TONS/DAY SUBWATERSHE
DMaynard Landfill Waltham St/Powder Hill Maynard Capped Not Lined Town Of Maynard Closed 0 MA82B-09
Northborough Landfill Southwest Cutoff (Rte 20) Northborough Capped Not Lined Town Of Northborough Closed 0Northborough Landfill Boundary/Church Streets Northborough Not Lined Town Of Northborough Inactive MA82B-03
Old Wayland Dump 195 Main St Wayland Not Lined Town Of Wayland Inactive 0 Dudley Pond MA82029
Old Wayland Landfill Rte 20 Wayland Not Lined Town Of Wayland Inactive 0 MA82A-04 or MA82A-06
Parkerville Landfill Parkerville Rd Southborough Not Capped Not Lined Town Of Southborough Inactive 0 Sudbury Reservoir (MA82106)
Prtr Inc Transfer Station 791 Boston Post Rd (Rte 20) Marlborough Unknown Prtr Inc (WMI) Active 500
Shrewsbury Ash Landfill 640 Hartford Tnpk (Rte 20) Shrewsbury Partially Capped Lined Town Of Shrewsbury/
Wheelabrator Millbury 770 MA82B-01 or MA82B-02
Southborough Dump Mount Vickery Rd Southborough Not Capped Not Lined Private Inactive 0 Sudbury Reservoir (MA82106)
Sudbury Landfill Powder Mill Rd/Rte 117 Sudbury Not Capped Not Lined Town Of Sudbury Inactive 0 MA82B-09
Sudbury Landfill Dakin Rd Sudbury Not Lined Town Of Sudbury/ L. Roy Hawes Inactive 0 MA82A-19
Sudbury Transfer Station 20 Boston Post Rd (Rte 20) Sudbury Unknown Town Of Sudbury Active 0 MA82A-04 or MA82A-06
Wayland Sand Hill Landfill 484 Boston Post Rd (Rte 20) Wayland Partially Capped Lined Town Of Wayland Active 99 MA82A-04 or
MA82A-06
Westborough Landfill 68 Hopkinton Rd (Rte 135) Westborough Not Capped Not Lined El Harvey & Sons Inactive 1 MA82A-11 or MA82A-01