225 Schilling Circle Hunt Valley, MD 21031 Telephone: 410-584-7000 FAX: 410-771-1625 www.eaest.com EA Engineering, Science, and Technology, Inc., PBC 14 January 2015 TECHNICAL MEMORANDUM TO: Andrew Fan (EPA) Barbara Brown (MDE) Madi Novak (Maul Foster & Alongi, Inc.) Dan Silver (Sparrows Point Environmental Trust) FROM: John Morris, Field Lead Samantha Saalfield, Project Geologist Frank Barranco, Project Manager SUBJECT: Round 1 Sediment Investigation and Plan for Round 2 Investigation Sparrows Point Phase I Area Background The Sparrows Point Environmental Trust (the Trust) has contracted EA Engineering, Science, and Technology, Inc., PBC (EA) to plan and implement the Offshore Investigation of the Phase I, Northwest Shoreline study area, adjacent to the Sparrows Point Facility. The first round of sampling for the Offshore Investigation consisted of sediment sampling conducted on 13 and 14 October 2014. All work was conducted in accordance with the Work Plan for Offshore Investigation of the Phase I Area of the Sparrows Point Site, dated September 2014, with minor exceptions noted below. The Phase I area is located approximately 6 miles southeast of Baltimore, Maryland, in the vicinity of I-695 and Bear Creek. The Round 1 sediment investigation included sampling within approximately 1,000 feet of the shoreline in the Phase I area. Sampling Locations During the first round of the offshore investigation, surface sediment was collected from 20 locations, along eight transects (A-H) oriented perpendicular to the shoreline. The locations, chosen to provide good spatial coverage of the Phase I area, are listed on Table 1 and illustrated on Figure 1. Note that for locations where more than one Ponar grab sample was needed to yield sufficient volume for the required analyses, Table 1 presents the coordinates of each grab sample taken at the location. Duplicate grab samples were taken within 10 ft of the target location for each sample. Sediment Sampling and Analysis A 23-ft Monark aluminum hull survey boat was launched from the Turner Station Park boat ramp, directly across Bear Creek from the Phase I area. This vessel was chosen for field sampling due to anticipated weather conditions and necessity for space to collect decontamination water and extra
Transcript
225 Schilling Circle
Hunt Valley, MD 21031 Telephone: 410-584-7000 FAX: 410-771-1625
www.eaest.com
EA Engineering, Science, and Technology, Inc., PBC
14 January 2015
TECHNICAL MEMORANDUM
TO: Andrew Fan (EPA)
Barbara Brown (MDE)
Madi Novak (Maul Foster & Alongi, Inc.)
Dan Silver (Sparrows Point Environmental Trust)
FROM: John Morris, Field Lead
Samantha Saalfield, Project Geologist
Frank Barranco, Project Manager
SUBJECT: Round 1 Sediment Investigation and Plan for Round 2 Investigation
Sparrows Point Phase I Area
Background
The Sparrows Point Environmental Trust (the Trust) has contracted EA Engineering, Science, and
Technology, Inc., PBC (EA) to plan and implement the Offshore Investigation of the Phase I,
Northwest Shoreline study area, adjacent to the Sparrows Point Facility. The first round of
sampling for the Offshore Investigation consisted of sediment sampling conducted on 13 and 14
October 2014. All work was conducted in accordance with the Work Plan for Offshore
Investigation of the Phase I Area of the Sparrows Point Site, dated September 2014, with minor
exceptions noted below.
The Phase I area is located approximately 6 miles southeast of Baltimore, Maryland, in the vicinity
of I-695 and Bear Creek. The Round 1 sediment investigation included sampling within
approximately 1,000 feet of the shoreline in the Phase I area.
Sampling Locations
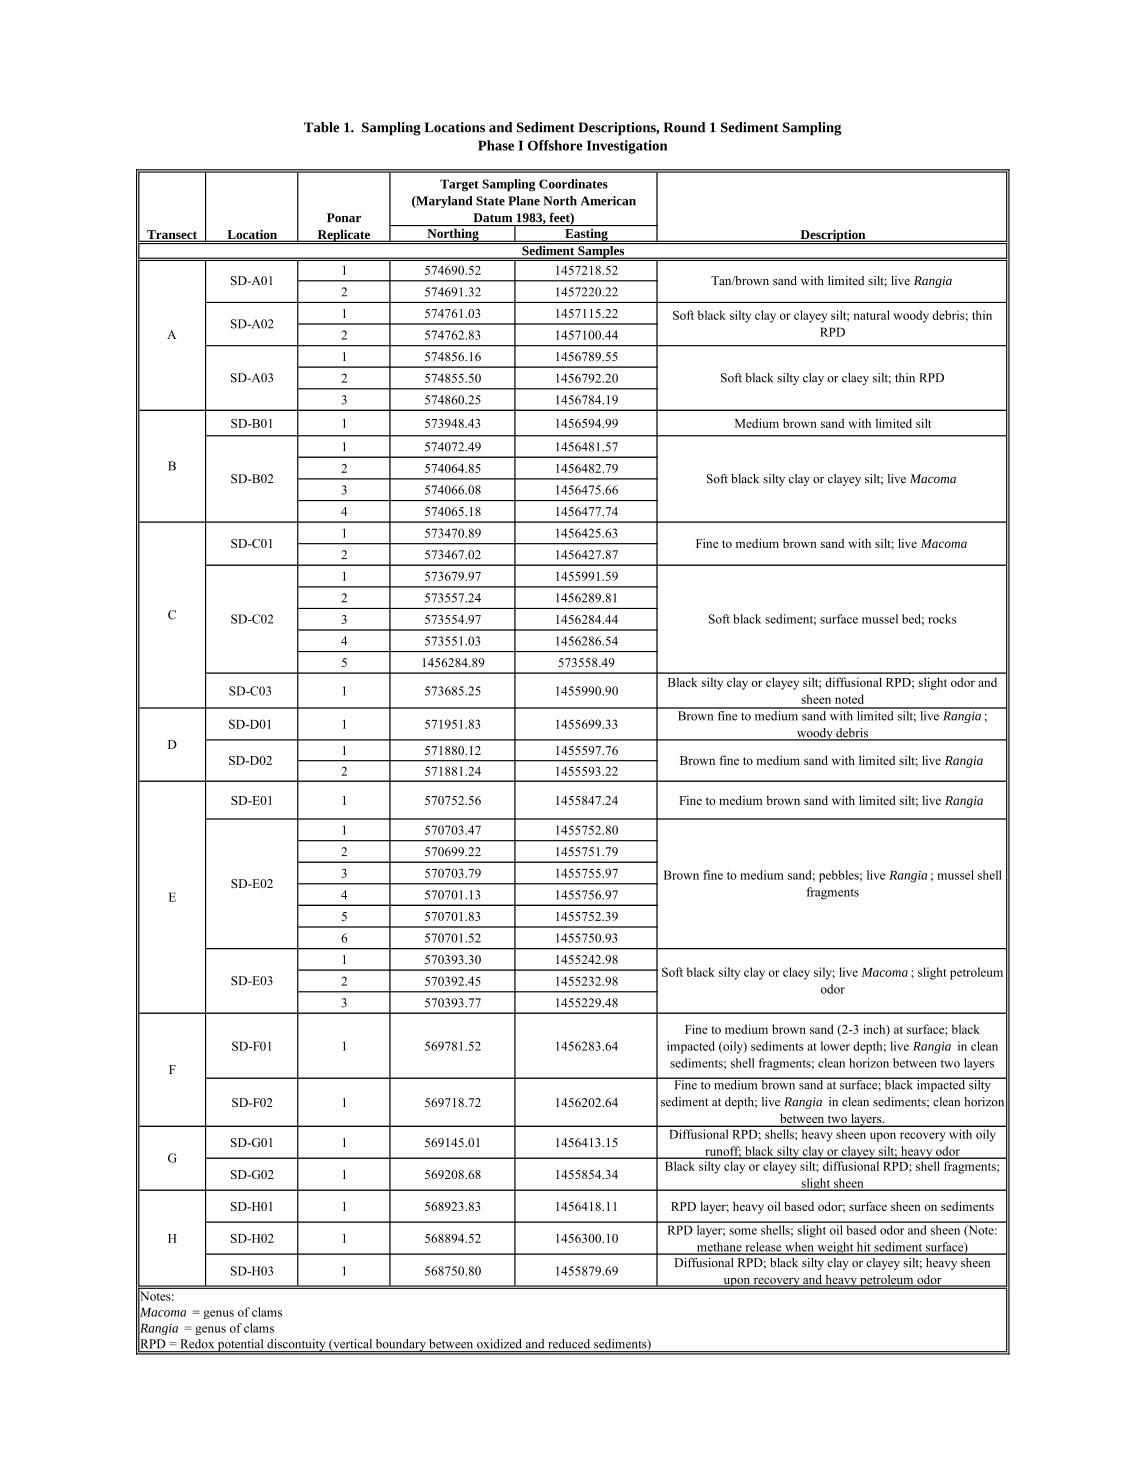
During the first round of the offshore investigation, surface sediment was collected from 20
locations, along eight transects (A-H) oriented perpendicular to the shoreline. The locations,
chosen to provide good spatial coverage of the Phase I area, are listed on Table 1 and illustrated on
Figure 1. Note that for locations where more than one Ponar grab sample was needed to yield
sufficient volume for the required analyses, Table 1 presents the coordinates of each grab sample
taken at the location. Duplicate grab samples were taken within 10 ft of the target location for each
sample.
Sediment Sampling and Analysis
A 23-ft Monark aluminum hull survey boat was launched from the Turner Station Park boat ramp,
directly across Bear Creek from the Phase I area. This vessel was chosen for field sampling due to
anticipated weather conditions and necessity for space to collect decontamination water and extra
NOTES: Bold values represent detected concentrations. RL is reported for non-detected constituentsNA = Not AnalyzedRL = reporting limitB = compound was detected in the method blankJ = compound was detected, but below the reporting limit (value is estimated)U = compound was analyzed, but not detected
Table 4
Concentrations of Inorganic Constituents in Sediment
ACENAPHTHENE UG/KG 399.19 20 U 49 U 300 U 19 U 350 U 310 U 49 U 140 U 360 U 25 U 18 U ACENAPHTHYLENE UG/KG 399.19 20 U 76 110 J 19 U 89 J 310 U 49 U 140 U 120 J 25 U 18 U ANTHRACENE UG/KG 399.19 20 U 73 79 J 19 U 110 J 310 U 49 U 28 J 140 J 25 U 18 U FLUORENE UG/KG 399.19 20 U 29 J 300 U 19 U 350 U 310 U 49 U 140 U 360 U 25 U 18 U NAPHTHALENE UG/KG 399.19 8.7 J 200 310 4.1 J 380 330 7.9 J 74 J 560 25 U 4.2 J
PHENANTHRENE UG/KG 399.19 20 U 120 180 J 19 U 220 J 310 U 49 U 54 J 200 J 25 U 18 U BENZO[A]ANTHRACENE UG/KG 399.19 20 U 160 300 U 19 U 280 J 210 J 49 U 140 U 270 J 14 J 18 U BENZO[A]PYRENE UG/KG 399.19 20 U 210 300 U 19 U 350 U 380 49 U 140 U 500 25 U 18 U BENZO[B]FLUORANTHENE UG/KG 399.19 20 U 310 300 U 19 U 350 U 310 U 49 U 140 U 690 11 J 18 U BENZO[G,H,I]PERYLENE UG/KG 399.19 20 U 260 300 U 19 U 350 U 310 U 49 U 140 U 670 25 U 18 U BENZO[K]FLUORANTHENE UG/KG 399.19 20 U 110 300 U 19 U 350 U 310 U 49 U 140 U 280 J 25 U 18 U CHRYSENE UG/KG 399.19 20 U 210 300 U 19 U 250 J 260 J 49 U 140 U 360 13 J 18 U DIBENZ(A,H)ANTHRACENE UG/KG 399.19 20 U 61 300 U 19 U 350 U 310 U 49 U 140 U 360 U 25 U 18 U FLUORANTHENE UG/KG 399.19 18 J 410 390 7.7 J 490 430 49 U 110 J 680 22 J 14 J
INDENO[1,2,3-CD]PYRENE UG/KG 399.19 20 U 250 300 U 19 U 350 U 310 U 49 U 140 U 470 25 U 18 U PYRENE UG/KG 399.19 14 J 270 380 7.9 J 490 440 49 U 90 J 690 16 J 6.3 J
ACENAPHTHENE UG/KG 399.19 17 U 26 U 730 U 82 U 48 U 880 U 660 U 1200 U 1200 U 1900 U ACENAPHTHYLENE UG/KG 399.19 17 U 8.5 J 320 J 82 U 48 U 880 U 660 U 1200 U 1200 U 1900 U ANTHRACENE UG/KG 399.19 17 U 26 U 730 U 82 U 48 U 880 U 660 U 1200 U 1200 U 1900 U FLUORENE UG/KG 399.19 17 U 26 U 730 U 82 U 48 U 880 U 660 U 1200 U 1200 U 1900 U NAPHTHALENE UG/KG 399.19 17 U 17 J 530 J 34 J 16 J 200 J 430 J 220 J 210 J 4000
PHENANTHRENE UG/KG 399.19 17 U 26 U 730 U 82 U 48 U 880 U 660 U 1200 U 1200 U 1900 U BENZO[A]ANTHRACENE UG/KG 399.19 17 U 26 U 610 J 130 48 U 880 U 2300 1200 U 1200 U 1900 U BENZO[A]PYRENE UG/KG 399.19 17 U 26 U 1300 82 U 48 U 880 U 1700 1200 U 1200 U 1900 U BENZO[B]FLUORANTHENE UG/KG 399.19 17 U 26 U 1700 82 U 48 U 880 U 660 U 1200 U 1200 U 1900 U BENZO[G,H,I]PERYLENE UG/KG 399.19 17 U 26 U 1000 82 U 48 U 880 U 1200 U 1200 U 1900 U BENZO[K]FLUORANTHENE UG/KG 399.19 17 U 26 U 280 J 82 U 48 U 880 U 660 U 1200 U 1200 U 1900 U CHRYSENE UG/KG 399.19 17 U 26 U 720 J 240 48 U 880 U 2200 1200 U 1200 U 1900 U DIBENZ(A,H)ANTHRACENE UG/KG 399.19 17 U 26 U 730 U 82 U 48 U 880 U 660 U 1200 U 1200 U 1900 U FLUORANTHENE UG/KG 399.19 17 17 J 1900 450 75 1200 4900 1400 3200 2600
INDENO[1,2,3-CD]PYRENE UG/KG 399.19 17 U 26 U 730 U 82 U 48 U 880 U 660 U 1200 U 1200 U 1900 U PYRENE UG/KG 399.19 7.1 J 18 J 2000 750 140 1000 2800 1300 2500 5000
HEM (OIL AND GREASE) MG/KG 445.4 --- --- --- 15000 B 2500 B 89000 B 95000 B 90000 B 110000 B 110000 B NOTES: Bold values represent detected concentrations. RL is reported for non-detected constituentsRL = reporting limitJ = compound was detected, but below the reporting limit (value is estimated)U = compound was analyzed, but not detected
Table 5
Concentrations of Polycyclic Aromatic Hydrocarbons and Oil and Grease in Sediment
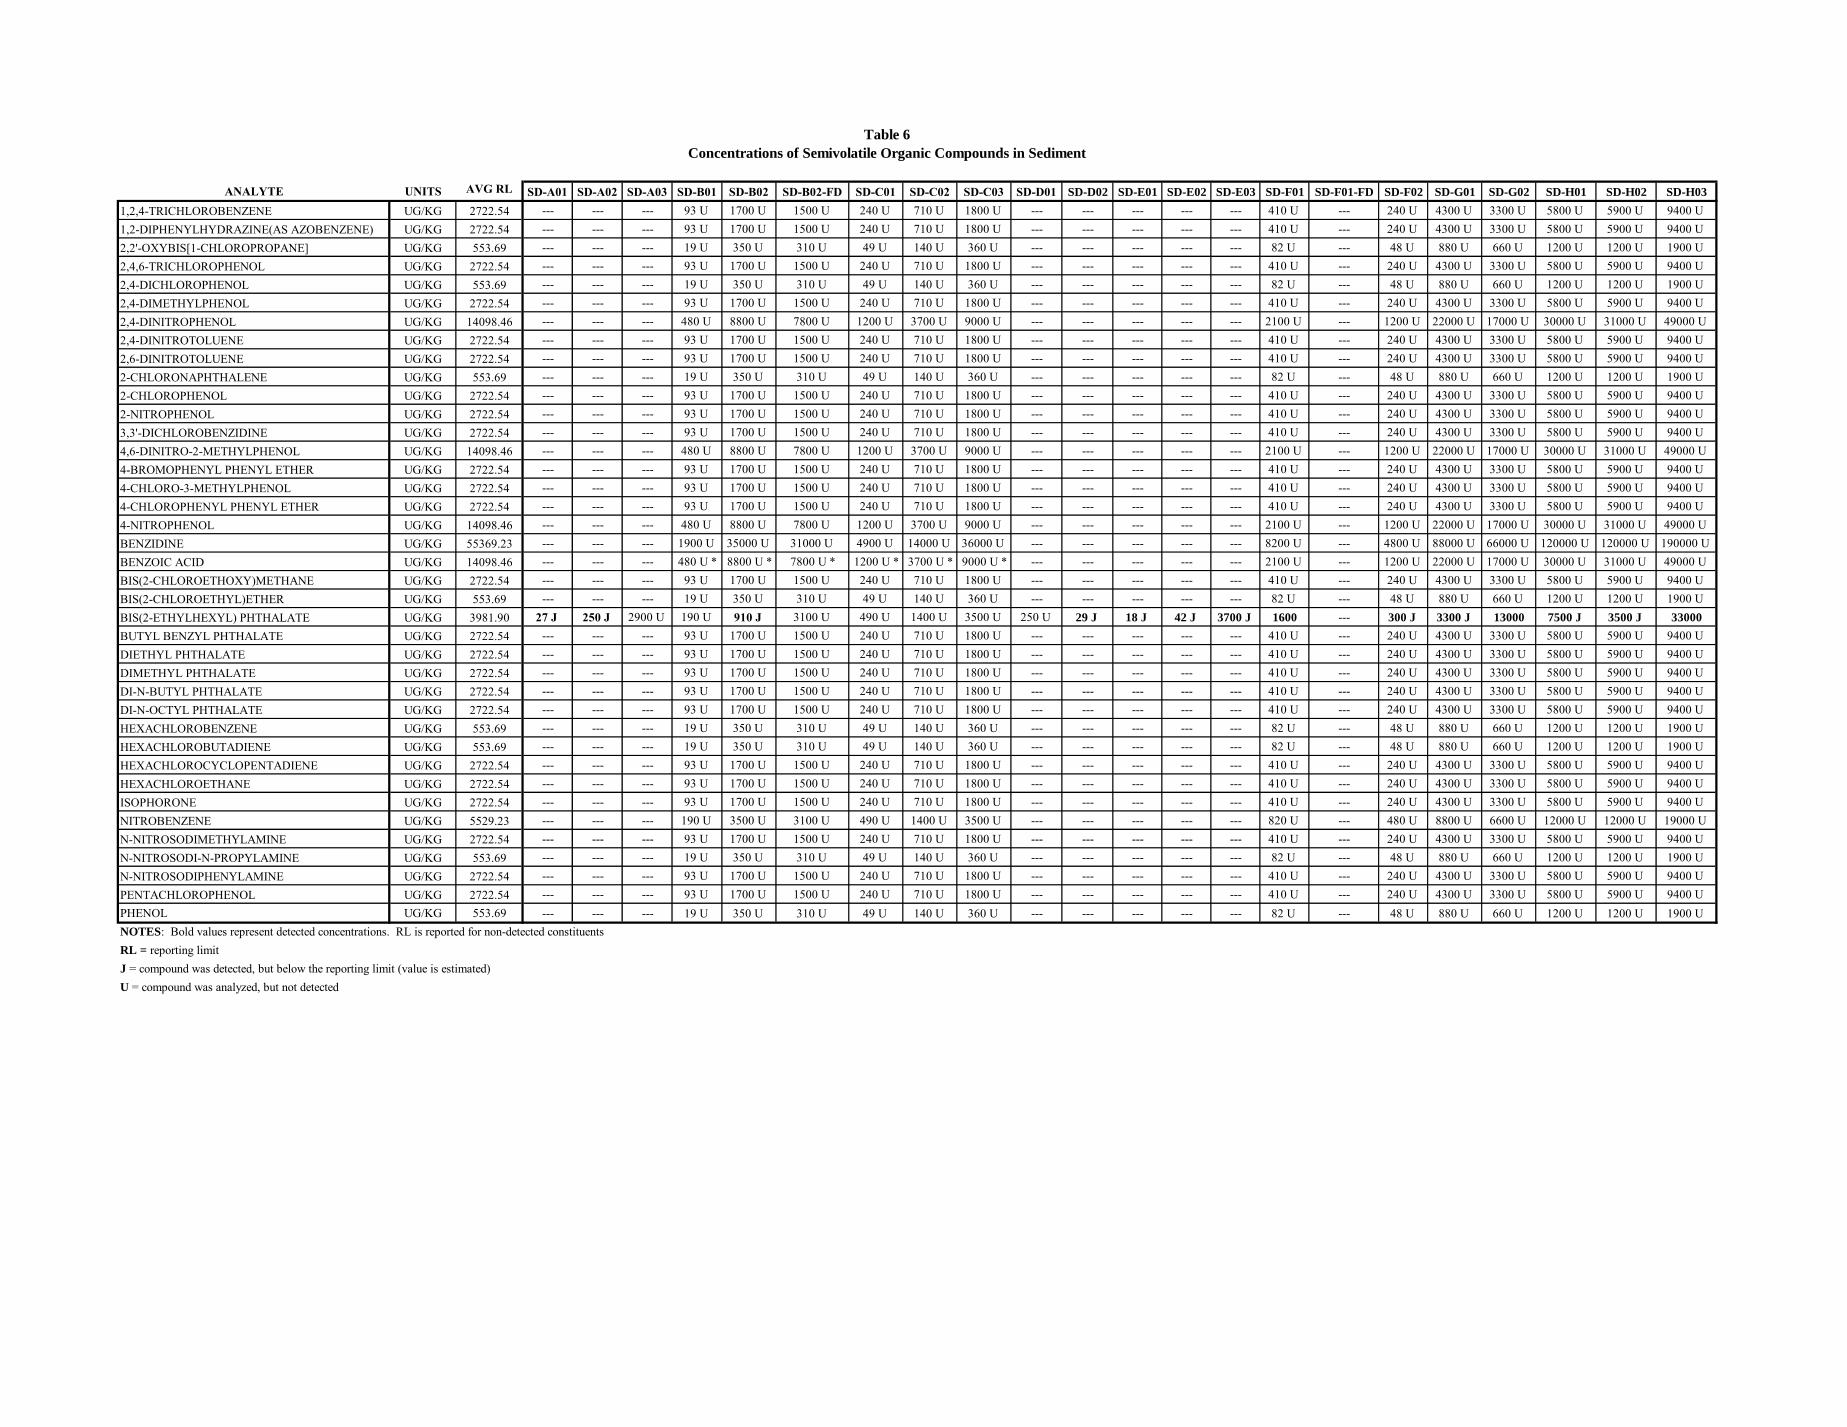
1,2,4-TRICHLOROBENZENE UG/KG 2722.54 --- --- --- 93 U 1700 U 1500 U 240 U 710 U 1800 U --- --- --- --- --- 410 U --- 240 U 4300 U 3300 U 5800 U 5900 U 9400 U 1,2-DIPHENYLHYDRAZINE(AS AZOBENZENE) UG/KG 2722.54 --- --- --- 93 U 1700 U 1500 U 240 U 710 U 1800 U --- --- --- --- --- 410 U --- 240 U 4300 U 3300 U 5800 U 5900 U 9400 U 2,2'-OXYBIS[1-CHLOROPROPANE] UG/KG 553.69 --- --- --- 19 U 350 U 310 U 49 U 140 U 360 U --- --- --- --- --- 82 U --- 48 U 880 U 660 U 1200 U 1200 U 1900 U 2,4,6-TRICHLOROPHENOL UG/KG 2722.54 --- --- --- 93 U 1700 U 1500 U 240 U 710 U 1800 U --- --- --- --- --- 410 U --- 240 U 4300 U 3300 U 5800 U 5900 U 9400 U 2,4-DICHLOROPHENOL UG/KG 553.69 --- --- --- 19 U 350 U 310 U 49 U 140 U 360 U --- --- --- --- --- 82 U --- 48 U 880 U 660 U 1200 U 1200 U 1900 U 2,4-DIMETHYLPHENOL UG/KG 2722.54 --- --- --- 93 U 1700 U 1500 U 240 U 710 U 1800 U --- --- --- --- --- 410 U --- 240 U 4300 U 3300 U 5800 U 5900 U 9400 U 2,4-DINITROPHENOL UG/KG 14098.46 --- --- --- 480 U 8800 U 7800 U 1200 U 3700 U 9000 U --- --- --- --- --- 2100 U --- 1200 U 22000 U 17000 U 30000 U 31000 U 49000 U 2,4-DINITROTOLUENE UG/KG 2722.54 --- --- --- 93 U 1700 U 1500 U 240 U 710 U 1800 U --- --- --- --- --- 410 U --- 240 U 4300 U 3300 U 5800 U 5900 U 9400 U 2,6-DINITROTOLUENE UG/KG 2722.54 --- --- --- 93 U 1700 U 1500 U 240 U 710 U 1800 U --- --- --- --- --- 410 U --- 240 U 4300 U 3300 U 5800 U 5900 U 9400 U 2-CHLORONAPHTHALENE UG/KG 553.69 --- --- --- 19 U 350 U 310 U 49 U 140 U 360 U --- --- --- --- --- 82 U --- 48 U 880 U 660 U 1200 U 1200 U 1900 U 2-CHLOROPHENOL UG/KG 2722.54 --- --- --- 93 U 1700 U 1500 U 240 U 710 U 1800 U --- --- --- --- --- 410 U --- 240 U 4300 U 3300 U 5800 U 5900 U 9400 U 2-NITROPHENOL UG/KG 2722.54 --- --- --- 93 U 1700 U 1500 U 240 U 710 U 1800 U --- --- --- --- --- 410 U --- 240 U 4300 U 3300 U 5800 U 5900 U 9400 U 3,3'-DICHLOROBENZIDINE UG/KG 2722.54 --- --- --- 93 U 1700 U 1500 U 240 U 710 U 1800 U --- --- --- --- --- 410 U --- 240 U 4300 U 3300 U 5800 U 5900 U 9400 U 4,6-DINITRO-2-METHYLPHENOL UG/KG 14098.46 --- --- --- 480 U 8800 U 7800 U 1200 U 3700 U 9000 U --- --- --- --- --- 2100 U --- 1200 U 22000 U 17000 U 30000 U 31000 U 49000 U 4-BROMOPHENYL PHENYL ETHER UG/KG 2722.54 --- --- --- 93 U 1700 U 1500 U 240 U 710 U 1800 U --- --- --- --- --- 410 U --- 240 U 4300 U 3300 U 5800 U 5900 U 9400 U 4-CHLORO-3-METHYLPHENOL UG/KG 2722.54 --- --- --- 93 U 1700 U 1500 U 240 U 710 U 1800 U --- --- --- --- --- 410 U --- 240 U 4300 U 3300 U 5800 U 5900 U 9400 U 4-CHLOROPHENYL PHENYL ETHER UG/KG 2722.54 --- --- --- 93 U 1700 U 1500 U 240 U 710 U 1800 U --- --- --- --- --- 410 U --- 240 U 4300 U 3300 U 5800 U 5900 U 9400 U 4-NITROPHENOL UG/KG 14098.46 --- --- --- 480 U 8800 U 7800 U 1200 U 3700 U 9000 U --- --- --- --- --- 2100 U --- 1200 U 22000 U 17000 U 30000 U 31000 U 49000 U BENZIDINE UG/KG 55369.23 --- --- --- 1900 U 35000 U 31000 U 4900 U 14000 U 36000 U --- --- --- --- --- 8200 U --- 4800 U 88000 U 66000 U 120000 U 120000 U 190000 U BENZOIC ACID UG/KG 14098.46 --- --- --- 480 U * 8800 U * 7800 U * 1200 U * 3700 U * 9000 U * --- --- --- --- --- 2100 U --- 1200 U 22000 U 17000 U 30000 U 31000 U 49000 U BIS(2-CHLOROETHOXY)METHANE UG/KG 2722.54 --- --- --- 93 U 1700 U 1500 U 240 U 710 U 1800 U --- --- --- --- --- 410 U --- 240 U 4300 U 3300 U 5800 U 5900 U 9400 U BIS(2-CHLOROETHYL)ETHER UG/KG 553.69 --- --- --- 19 U 350 U 310 U 49 U 140 U 360 U --- --- --- --- --- 82 U --- 48 U 880 U 660 U 1200 U 1200 U 1900 U BIS(2-ETHYLHEXYL) PHTHALATE UG/KG 3981.90 27 J 250 J 2900 U 190 U 910 J 3100 U 490 U 1400 U 3500 U 250 U 29 J 18 J 42 J 3700 J 1600 --- 300 J 3300 J 13000 7500 J 3500 J 33000
BUTYL BENZYL PHTHALATE UG/KG 2722.54 --- --- --- 93 U 1700 U 1500 U 240 U 710 U 1800 U --- --- --- --- --- 410 U --- 240 U 4300 U 3300 U 5800 U 5900 U 9400 U DIETHYL PHTHALATE UG/KG 2722.54 --- --- --- 93 U 1700 U 1500 U 240 U 710 U 1800 U --- --- --- --- --- 410 U --- 240 U 4300 U 3300 U 5800 U 5900 U 9400 U DIMETHYL PHTHALATE UG/KG 2722.54 --- --- --- 93 U 1700 U 1500 U 240 U 710 U 1800 U --- --- --- --- --- 410 U --- 240 U 4300 U 3300 U 5800 U 5900 U 9400 U DI-N-BUTYL PHTHALATE UG/KG 2722.54 --- --- --- 93 U 1700 U 1500 U 240 U 710 U 1800 U --- --- --- --- --- 410 U --- 240 U 4300 U 3300 U 5800 U 5900 U 9400 U DI-N-OCTYL PHTHALATE UG/KG 2722.54 --- --- --- 93 U 1700 U 1500 U 240 U 710 U 1800 U --- --- --- --- --- 410 U --- 240 U 4300 U 3300 U 5800 U 5900 U 9400 U HEXACHLOROBENZENE UG/KG 553.69 --- --- --- 19 U 350 U 310 U 49 U 140 U 360 U --- --- --- --- --- 82 U --- 48 U 880 U 660 U 1200 U 1200 U 1900 U HEXACHLOROBUTADIENE UG/KG 553.69 --- --- --- 19 U 350 U 310 U 49 U 140 U 360 U --- --- --- --- --- 82 U --- 48 U 880 U 660 U 1200 U 1200 U 1900 U HEXACHLOROCYCLOPENTADIENE UG/KG 2722.54 --- --- --- 93 U 1700 U 1500 U 240 U 710 U 1800 U --- --- --- --- --- 410 U --- 240 U 4300 U 3300 U 5800 U 5900 U 9400 U HEXACHLOROETHANE UG/KG 2722.54 --- --- --- 93 U 1700 U 1500 U 240 U 710 U 1800 U --- --- --- --- --- 410 U --- 240 U 4300 U 3300 U 5800 U 5900 U 9400 U ISOPHORONE UG/KG 2722.54 --- --- --- 93 U 1700 U 1500 U 240 U 710 U 1800 U --- --- --- --- --- 410 U --- 240 U 4300 U 3300 U 5800 U 5900 U 9400 U NITROBENZENE UG/KG 5529.23 --- --- --- 190 U 3500 U 3100 U 490 U 1400 U 3500 U --- --- --- --- --- 820 U --- 480 U 8800 U 6600 U 12000 U 12000 U 19000 U N-NITROSODIMETHYLAMINE UG/KG 2722.54 --- --- --- 93 U 1700 U 1500 U 240 U 710 U 1800 U --- --- --- --- --- 410 U --- 240 U 4300 U 3300 U 5800 U 5900 U 9400 U N-NITROSODI-N-PROPYLAMINE UG/KG 553.69 --- --- --- 19 U 350 U 310 U 49 U 140 U 360 U --- --- --- --- --- 82 U --- 48 U 880 U 660 U 1200 U 1200 U 1900 U N-NITROSODIPHENYLAMINE UG/KG 2722.54 --- --- --- 93 U 1700 U 1500 U 240 U 710 U 1800 U --- --- --- --- --- 410 U --- 240 U 4300 U 3300 U 5800 U 5900 U 9400 U PENTACHLOROPHENOL UG/KG 2722.54 --- --- --- 93 U 1700 U 1500 U 240 U 710 U 1800 U --- --- --- --- --- 410 U --- 240 U 4300 U 3300 U 5800 U 5900 U 9400 U PHENOL UG/KG 553.69 --- --- --- 19 U 350 U 310 U 49 U 140 U 360 U --- --- --- --- --- 82 U --- 48 U 880 U 660 U 1200 U 1200 U 1900 U NOTES: Bold values represent detected concentrations. RL is reported for non-detected constituentsRL = reporting limitJ = compound was detected, but below the reporting limit (value is estimated)U = compound was analyzed, but not detected
Table 6
Concentrations of Semivolatile Organic Compounds in Sediment
PCB-1016 UG/KG 14.77 5.9 U 17 U 15 U 6.1 U 7.2 U 18 U 6.8 U 6 U 22 U 17 U 19 U 20 U 32 U PCB-1221 UG/KG 14.77 5.9 U 17 U 15 U 6.1 U 7.2 U 18 U 6.8 U 6 U 22 U 17 U 19 U 20 U 32 U PCB-1232 UG/KG 14.77 5.9 U 17 U 15 U 6.1 U 7.2 U 18 U 6.8 U 6 U 22 U 17 U 19 U 20 U 32 U PCB-1242 UG/KG 14.77 5.9 U 17 U 15 U 6.1 U 7.2 U 18 U 6.8 U 6 U 22 U 17 U 19 U 20 U 32 U PCB-1248 UG/KG 14.77 5.9 U 78 130 6.1 U 26 140 1600 190 260 230 680 570 910
PCB-1254 UG/KG 14.77 2.9 J 17 U 15 U 3.7 J 7.2 U 18 U 6.8 U 6 U 22 U 17 U 19 U 20 U 32 U PCB-1260 UG/KG 14.77 1.9 J 49 84 1.9 J 21 88 6.8 U 6 U 22 U 17 U 19 U 20 U 1000
Total PCBs ND=0 UG/KG --- 4.8 127 214 5.6 47 228 1600 190 260 230 680 570 1910NOTES: Bold values represent detected concentrations. RL is reported for non-detected constituentsRL = reporting limitJ = compound was detected, but below the reporting limit (value is estimated)U = compound was analyzed, but not detected
Table 7
Concentrations of Polychlorinated Biphenyl Aroclors in Sediment
1,1,1-TRICHLOROETHANE UG/KG 13.42 7.1 U 21 U 18 U 7.4 U 8.6 U 21 U 8.2 U 7.2 U 13 U 20 U 12 U 12 U 19 U 1,1,2,2-TETRACHLOROETHANE UG/KG 13.42 7.1 U 21 U 18 U 7.4 U 8.6 U 21 U 8.2 U 7.2 U 13 U 20 U 12 U 12 U 19 U 1,1,2-TRICHLOROETHANE UG/KG 13.42 7.1 U 21 U 18 U 7.4 U 8.6 U 21 U 8.2 U 7.2 U 13 U 20 U 12 U 12 U 19 U 1,1-DICHLOROETHANE UG/KG 13.42 7.1 U 21 U 18 U 7.4 U 8.6 U 21 U 8.2 U 7.2 U 13 U 20 U 12 U 12 U 19 U 1,1-DICHLOROETHENE UG/KG 13.42 7.1 U 21 U 18 U 7.4 U 8.6 U 21 U 8.2 U 7.2 U 13 U 20 U 12 U 12 U 19 U 1,2-DICHLOROBENZENE UG/KG 13.42 7.1 U 21 U 18 U 7.4 U 8.6 U 21 U 8.2 U 7.2 U 13 U 8.8 J 12 U 12 U 19 U 1,2-DICHLOROETHANE UG/KG 13.42 7.1 U 21 U 18 U 7.4 U 8.6 U 21 U 8.2 U 7.2 U 13 U 20 U 12 U 12 U 19 U 1,2-DICHLOROPROPANE UG/KG 13.42 7.1 U 21 U 18 U 7.4 U 8.6 U 21 U 8.2 U 7.2 U 13 U 20 U 12 U 12 U 19 U 1,3-DICHLOROBENZENE UG/KG 13.42 7.1 U 21 U 18 U 7.4 U 8.6 U 21 U 8.2 U 7.2 U 13 U 20 U 12 U 12 U 19 U 1,4-DICHLOROBENZENE UG/KG 13.42 7.1 U 21 U 18 U 7.4 U 8.6 U 21 U 8.2 U 7.2 U 13 U 20 U 12 U 12 U 19 U 2-CHLOROETHYL VINYL ETHER UG/KG 26.85 14 U 42 U 37 U 15 U 17 U 43 U 16 U 14 U 26 U 40 U 23 U 24 U 38 U ACROLEIN UG/KG 268.46 140 U 420 U 370 U 150 U 170 U 430 U 160 U 140 U 260 U 400 U 230 U 240 U 380 U ACRYLONITRILE UG/KG 268.46 140 U 420 U 370 U 150 U 170 U 430 U 160 U 140 U 260 U 400 U 230 U 240 U 380 U BENZENE UG/KG 13.42 7.1 U 21 U 18 U 7.4 U 8.6 U 21 U 8.2 U 7.2 U 13 U 20 U 12 U 12 U 6.9 J
BROMOFORM UG/KG 13.42 7.1 U 21 U 18 U 7.4 U 8.6 U 21 U 8.2 U 7.2 U 13 U 20 U 12 U 12 U 19 U BROMOMETHANE UG/KG 13.42 7.1 U 21 U 18 U 7.4 U 8.6 U 21 U 8.2 U 7.2 U 13 U 20 U 12 U 12 U 19 U CARBON TETRACHLORIDE UG/KG 13.42 7.1 U 21 U 18 U 7.4 U 8.6 U 21 U 8.2 U 7.2 U 13 U 20 U 12 U 12 U 19 U CHLOROBENZENE UG/KG 13.42 7.1 U 21 U 18 U 7.4 U 8.6 U 21 U 8.2 U 7.2 U 13 U 16 J 12 U 2.4 J 250
CHLORODIBROMOMETHANE UG/KG 13.42 7.1 U 21 U 18 U 7.4 U 8.6 U 21 U 8.2 U 7.2 U 13 U 20 U 12 U 12 U 19 U CHLOROETHANE UG/KG 13.42 7.1 U 21 U 18 U 7.4 U 8.6 U 21 U 8.2 U 7.2 U 13 U 20 U 12 U 12 U 19 U CHLOROFORM UG/KG 13.42 7.1 U 21 U 18 U 7.4 U 8.6 U 21 U 8.2 U 7.2 U 13 U 20 U 12 U 12 U 19 U CHLOROMETHANE UG/KG 13.42 7.1 U 21 U 18 U 7.4 U 8.6 U 21 U 8.2 U 7.2 U 13 U 20 U 12 U 12 U 19 U CIS-1,3-DICHLOROPROPENE UG/KG 13.42 7.1 U 21 U 18 U 7.4 U 8.6 U 21 U 8.2 U 7.2 U 13 U 20 U 12 U 12 U 19 U DICHLOROBROMOMETHANE UG/KG 13.42 7.1 U 21 U 18 U 7.4 U 8.6 U 21 U 8.2 U 7.2 U 13 U 20 U 12 U 12 U 19 U ETHYLBENZENE UG/KG 13.42 7.1 U 21 U 18 U 7.4 U 8.6 U 21 U 8.2 U 7.2 U 2.1 J 5.8 J 12 U 12 U 33
METHYLENE CHLORIDE UG/KG 13.42 7.1 U 21 U 18 U 7.4 U 8.6 U 21 U 8.2 U 7.2 U 13 U 20 U 12 U 12 U 19 U TETRACHLOROETHENE UG/KG 13.42 7.1 U 21 U 18 U 7.4 U 8.6 U 21 U 8.2 U 7.2 U 13 U 20 U 12 U 12 U 19 U TOLUENE UG/KG 13.42 1.7 J B 5.1 J B 4.2 J B 1.9 J B 2.2 J B 5.7 J B 1.8 J 1.6 J 3.6 J 5.3 J 2.6 J 3.3 J B 16 J B
TRANS-1,2-DICHLOROETHENE UG/KG 13.42 7.1 U 21 U 18 U 7.4 U 8.6 U 21 U 8.2 U 7.2 U 13 U 20 U 12 U 12 U 19 U TRANS-1,3-DICHLOROPROPENE UG/KG 13.42 7.1 U 21 U 18 U 7.4 U 8.6 U 21 U 8.2 U 7.2 U 13 U 20 U 12 U 12 U 19 U TRICHLOROETHENE UG/KG 13.42 7.1 U 21 U 18 U 7.4 U 8.6 U 21 U 8.2 U 7.2 U 13 U 20 U 12 U 12 U 19 U VINYL CHLORIDE UG/KG 13.42 7.1 U 21 U 18 U 7.4 U 8.6 U 21 U 8.2 U 7.2 U 13 U 20 U 12 U 12 U 19 U NOTES: Bold values represent detected concentrations. RL is reported for non-detected constituentsRL = reporting limitB = compound was detected in the method blankJ = compound was detected, but below the reporting limit (value is estimated)U = compound was analyzed, but not detected
Table 8
Concentrations of Volatile Organic Compounds in Sediment
NOTES: Bold values represent detected concentrations. RL is reported for non-detected constituentsB = compound was detected in the method blankNC = not calculatedRL = reporting limit
Table 9
Acid Volatile Sulfides and Simultaneously Extracted Metals in Sediment
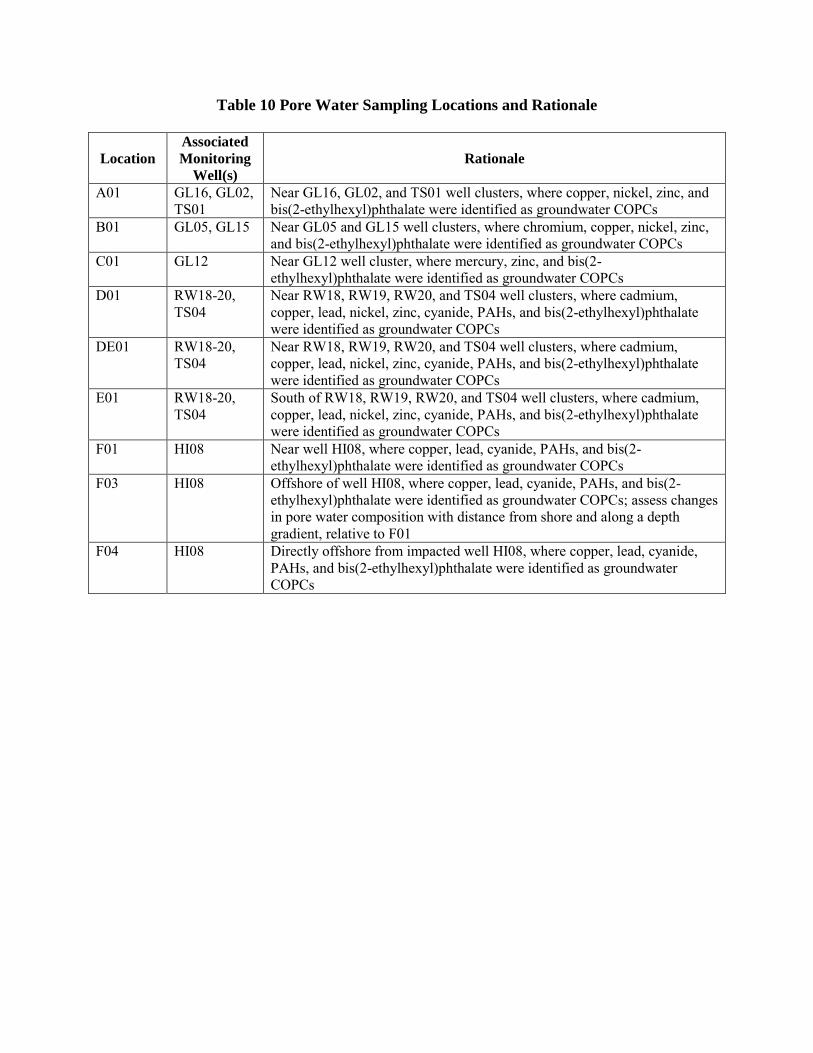
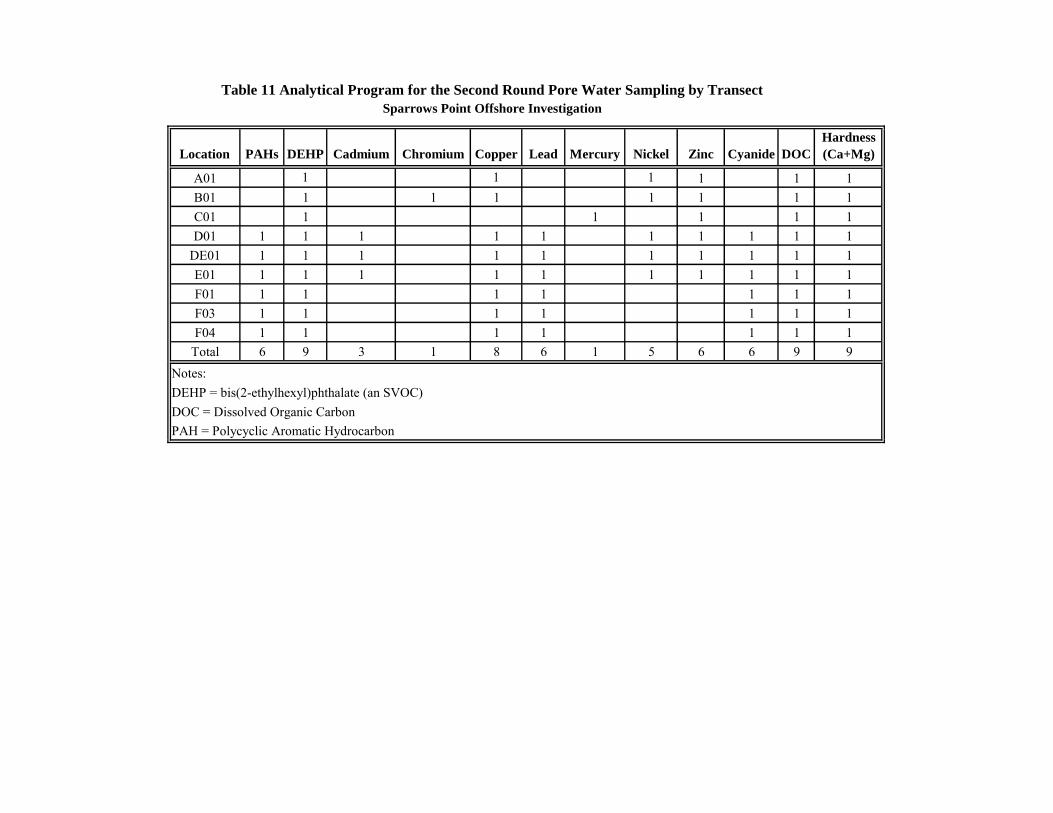
Table 10 Pore Water Sampling Locations and Rationale
Location
Associated
Monitoring
Well(s)
Rationale
A01 GL16, GL02, TS01
Near GL16, GL02, and TS01 well clusters, where copper, nickel, zinc, and bis(2-ethylhexyl)phthalate were identified as groundwater COPCs
B01 GL05, GL15 Near GL05 and GL15 well clusters, where chromium, copper, nickel, zinc, and bis(2-ethylhexyl)phthalate were identified as groundwater COPCs
C01 GL12 Near GL12 well cluster, where mercury, zinc, and bis(2-ethylhexyl)phthalate were identified as groundwater COPCs
D01 RW18-20, TS04
Near RW18, RW19, RW20, and TS04 well clusters, where cadmium, copper, lead, nickel, zinc, cyanide, PAHs, and bis(2-ethylhexyl)phthalate were identified as groundwater COPCs
DE01 RW18-20, TS04
Near RW18, RW19, RW20, and TS04 well clusters, where cadmium, copper, lead, nickel, zinc, cyanide, PAHs, and bis(2-ethylhexyl)phthalate were identified as groundwater COPCs
E01 RW18-20, TS04
South of RW18, RW19, RW20, and TS04 well clusters, where cadmium, copper, lead, nickel, zinc, cyanide, PAHs, and bis(2-ethylhexyl)phthalate were identified as groundwater COPCs
F01 HI08 Near well HI08, where copper, lead, cyanide, PAHs, and bis(2-ethylhexyl)phthalate were identified as groundwater COPCs
F03 HI08 Offshore of well HI08, where copper, lead, cyanide, PAHs, and bis(2-ethylhexyl)phthalate were identified as groundwater COPCs; assess changes in pore water composition with distance from shore and along a depth gradient, relative to F01
F04 HI08 Directly offshore from impacted well HI08, where copper, lead, cyanide, PAHs, and bis(2-ethylhexyl)phthalate were identified as groundwater COPCs
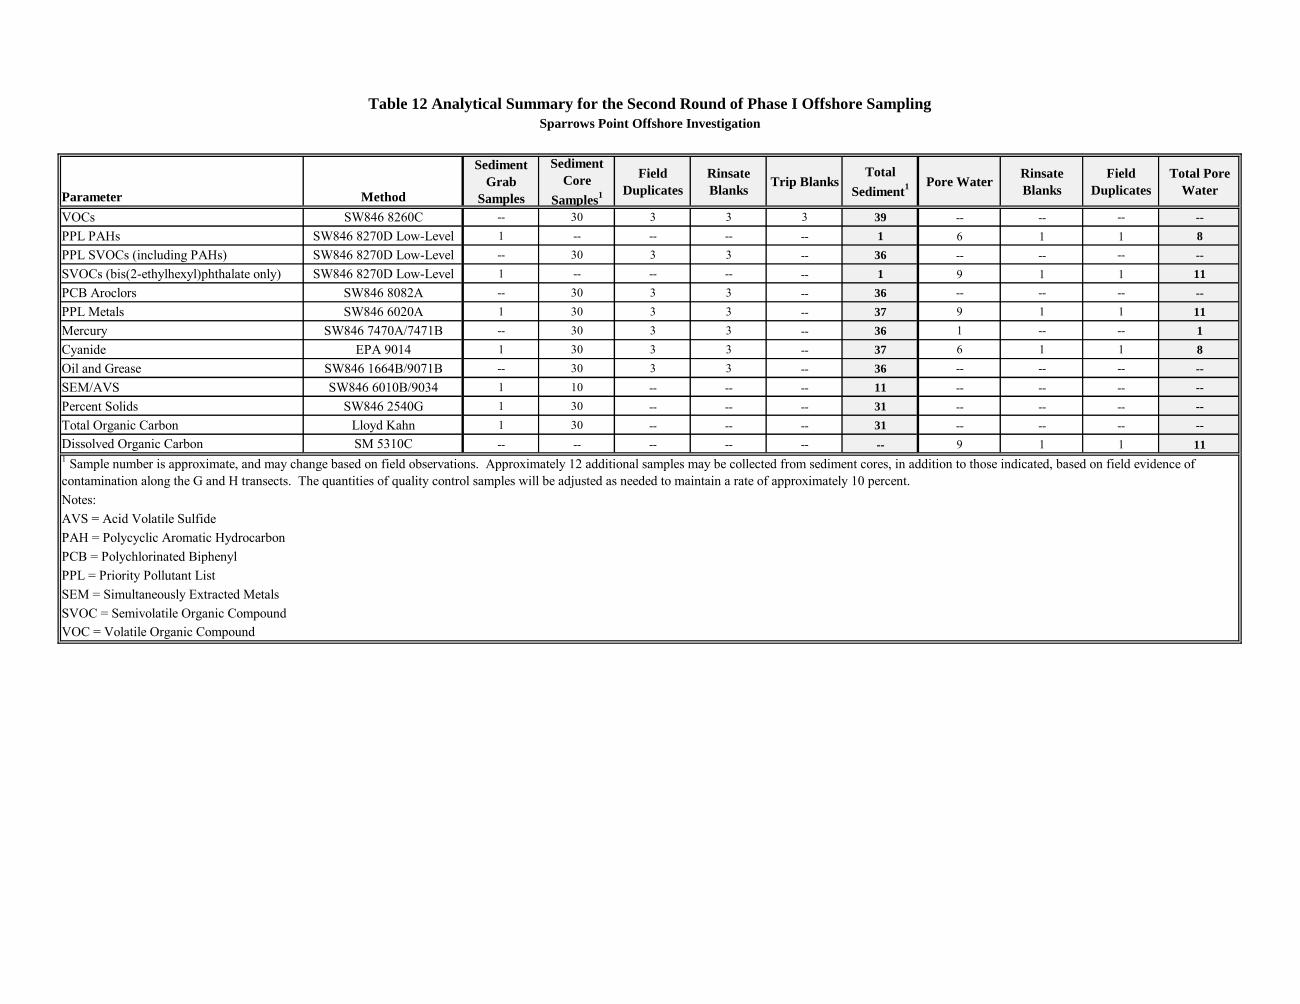
Table 12 Analytical Summary for the Second Round of Phase I Offshore Sampling
Sparrows Point Offshore Investigation
1 Sample number is approximate, and may change based on field observations. Approximately 12 additional samples may be collected from sediment cores, in addition to those indicated, based on field evidence of contamination along the G and H transects. The quantities of quality control samples will be adjusted as needed to maintain a rate of approximately 10 percent.
Table 13 Round 2 Sediment Sampling Locations and Rationale
Transect
Location
Type Rationale
DE DE01 Surface Grab Co-located surface sediment for correlation with pore water
F F03 Vibracore Co-located surface sediment for correlation with pore water
and horizontal and vertical delineation of contaminated sediments north of the G transect. F04 Vibracore
G G01 Vibracore
Horizontal and vertical delineation of contaminated sediments along the G and H transects.
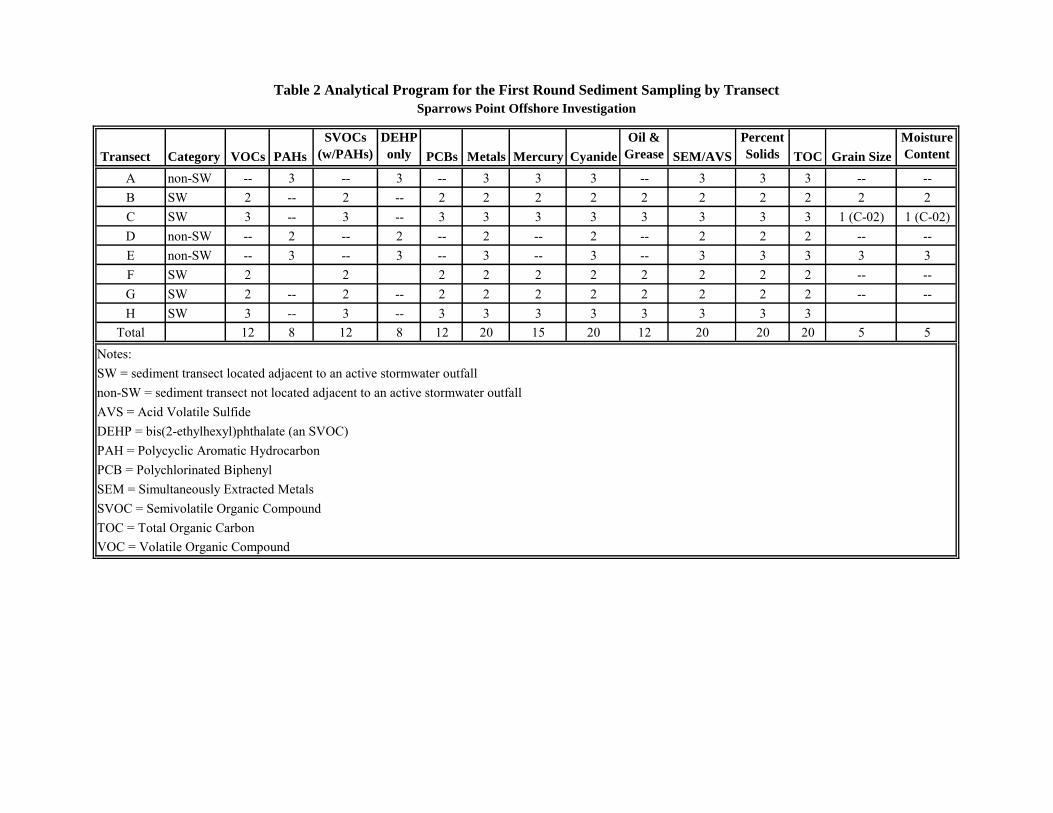
Notes:SW = sediment transect located adjacent to an active stormwater outfallnon-SW = sediment transect not located adjacent to an active stormwater outfallAVS = Acid Volatile SulfideDEHP = bis(2-ethylhexyl)phthalate (an SVOC)PAH = Polycyclic Aromatic HydrocarbonPCB = Polychlorinated BiphenylSEM = Simultaneously Extracted MetalsSVOC = Semivolatile Organic CompoundTOC = Total Organic CarbonVOC = Volatile Organic Compound
2 Approximately 12 additional samples may be collected (from up to 4 cores from contingency locations), in addition to the 30 indicated, based on field evidence of contamination along the G and H transects.
Table 14 Analytical Program for the Second Round Sediment Sampling by Transect
Sparrows Point Offshore Investigation
Surface Sediment Grab Samples
Sediment Core Samples 1
1 Estimates of sample numbers for cores are approximate and are based on an average core depth of 5-6 ft, yielding an average of 3 samples (each on a 2-ft interval) per core.
30 December 2014
8
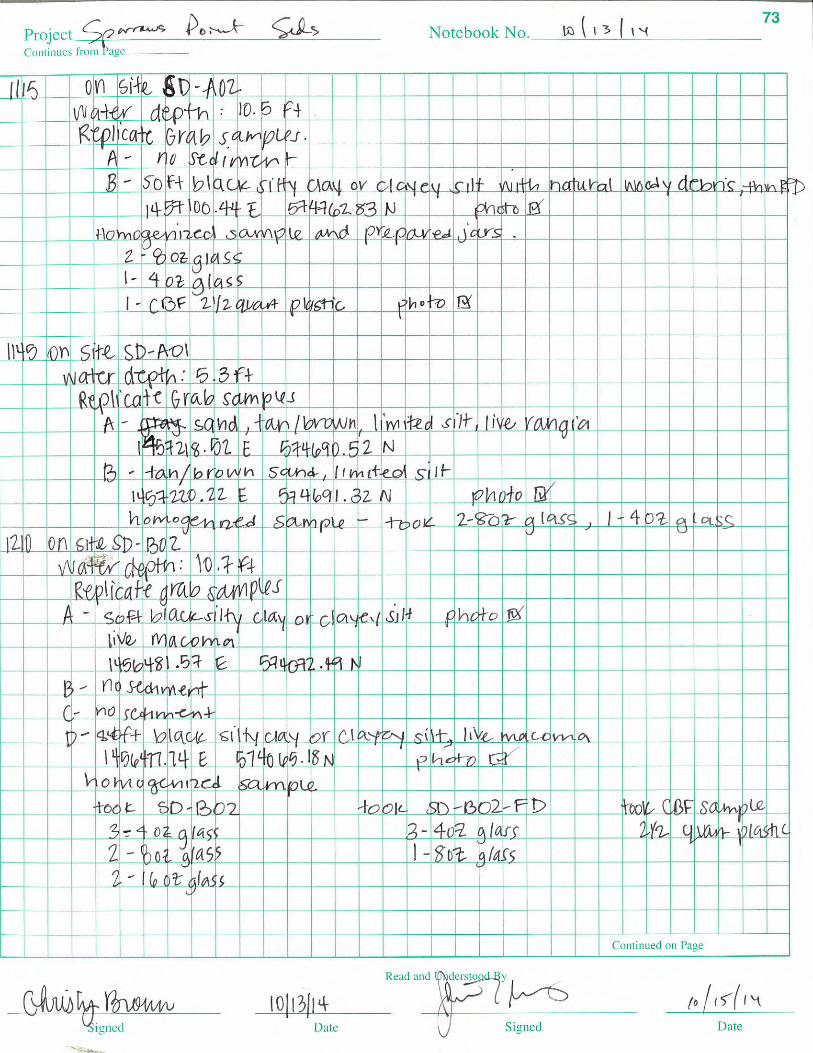
ATTACHMENT A
FIELD LOGBOOK
30 December 2014
9
ATTACHMENT B
PHOTOGRAPHIC LOG
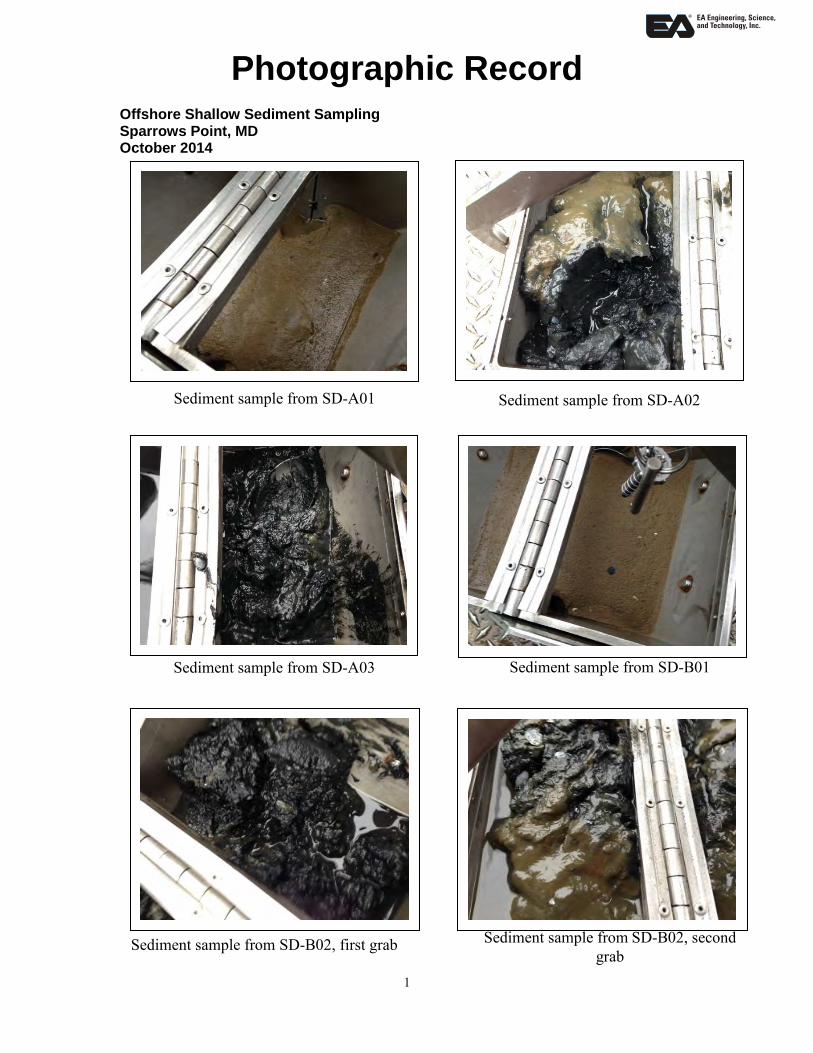
Photographic Record Offshore Shallow Sediment Sampling Sparrows Point, MD October 2014
1
Sediment sample from SD-A01
Sediment sample from SD-A03 Sediment sample from SD-B01
Sediment sample from SD-B02, first grab Sediment sample from SD-B02, second grab
Sediment sample from SD-A02
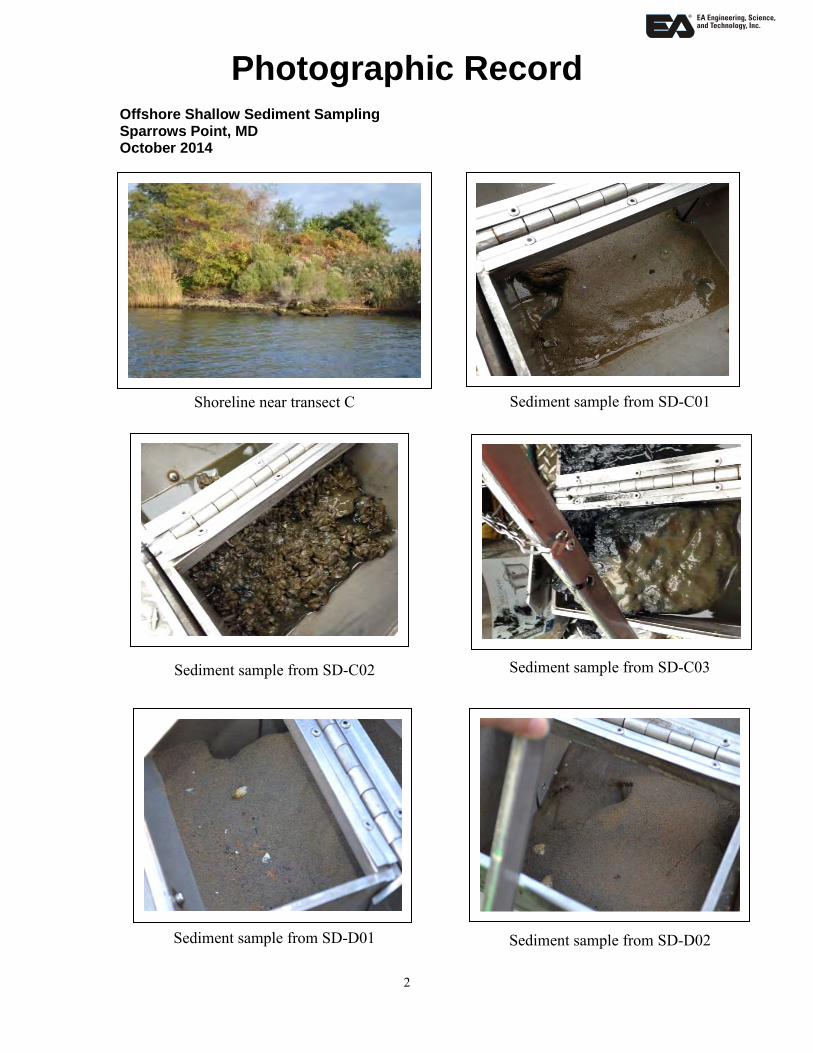
Photographic Record Offshore Shallow Sediment Sampling Sparrows Point, MD October 2014
2
Shoreline near transect C Sediment sample from SD-C01
Sediment sample from SD-C02 Sediment sample from SD-C03
Sediment sample from SD-D01 Sediment sample from SD-D02
Photographic Record Offshore Shallow Sediment Sampling Sparrows Point, MD October 2014
3
Sediment sample from SD-E01
Sediment sample from SD-E01 (zoomed in view) Sediment sample from SD-E02
Sediment sample from SD-F01 Sediment interface from SD-F01
Sediment sample from SD-D02
Photographic Record Offshore Shallow Sediment Sampling Sparrows Point, MD October 2014
4
Sediment interface from SD-F01
Sediment interface from SD-F01
Sediment sample from SD-F02
SD-F02 interface
SD-F02 Interface
Sediment sample from SD-G01
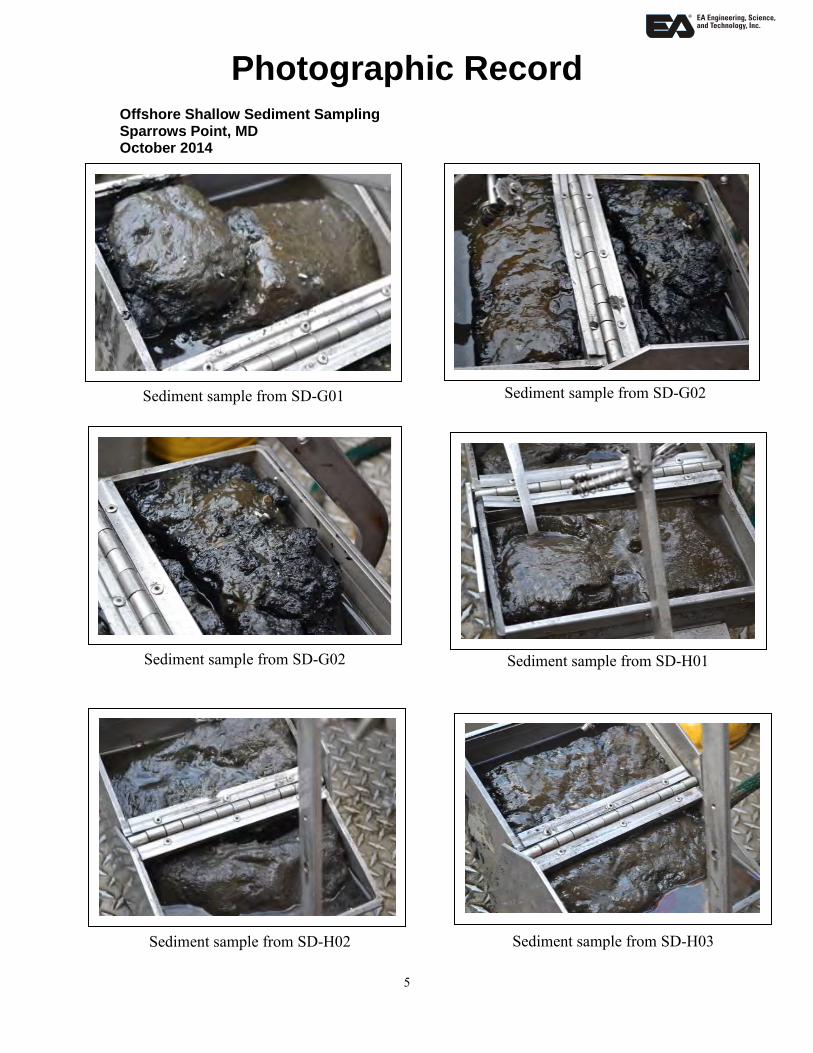
Photographic Record Offshore Shallow Sediment Sampling Sparrows Point, MD October 2014
5
Sediment sample from SD-G01 Sediment sample from SD-G02
Sediment sample from SD-G02 Sediment sample from SD-H01
Sediment sample from SD-H02 Sediment sample from SD-H03
Photographic Record Offshore Shallow Sediment Sampling Sparrows Point, MD October 2014
6
Sample collected in stainless steel pot Homogenized sediment sample in stainless steel pot
Homogenized sediment sample Samples collected for sample location SD-E02
Sampling area with rinsate collection tub Five gallon buckets for collection of extra volume of sediments to be transferred to 55
gallon drums
Photographic Record Offshore Shallow Sediment Sampling Sparrows Point, MD October 2014
7
Rinsate water collection at back of boat Ponar deployment
Ponar deployment
30 December 2014
10
ATTACHMENT C
EPA AND MDE COMMENTS ON THE DRAFT MEMORANDUM
December 5, 2014 Review of Sparrows Point Offshore Investigation Round 1 Sediment Investigation and Plan for Round 2 Investigation Technical Memorandum dated November 25, 2014 Ruth Prince, Toxicologist Land and Chemicals Division EPA Region III Mark Mank, Toxicologist Land Management Administration Maryland Department of the Environment EPA and MDE have reviewed the Offshore Investigation Technical Memorandum, and have the following comments on the Plan for Round 2: First, it is unclear how EA could have formulated plans for additional sediment sampling without screening the initial sediment data. This was, therefore, a deficiency of this Technical Memorandum that the Agencies had to make up for in order to review and comment on the Round 2 locations. Sediment results were initially screened with the BTAG marine sediment screening benchmarks. For final screening, the Probable Effect Concentrations (PECs) were used from Development and Evaluation of Consensus-Based Sediment Quality Guidelines for
Freshwater Ecosystems, MacDonald et al, 2000, Arch. Environ. Contam. Toxicol. 39:20-31. It should be noted that a 1996 MacDonald et al publication for coastal sediment entitled Development and Evaluation of Sediment Quality Guidelines for Florida Coastal Waters is available. While these values (which are similar to the 2000 PECs) may be better suited to estuarine sediment, they are not consensus-based and thus are less widely applicable. Therefore, the 2000 consensus-based PECs were used for final screening. There is no need to revise the Technical Memorandum to demonstrate this screening. Instead, it is recommended that this comment letter be attached to the final Technical Memorandum for documentation purposes. This screening method will be expected in the Offshore Investigation risk assessment. Table 10, Pore Water Sampling Locations and Rationale
The criteria described in this Technical Memorandum for selection of pore water sampling locations includes “locations where sediments were found to be impacted by groundwater COPCs (PAHs, metals, cyanide, bis[2-ethylhexyl]phthalate).” However, there appeared to be no discrimination regarding the particular well contaminant compared to adjacent sediment locations, such that EA proposes to sample all pore water locations for all potential groundwater COPCs. This does not satisfy the goal of this investigation, which is to track contaminants from on-site sources to the offshore environment. In addition, by not screening the sediment results, erroneous statements were made regarding sediment impacts in Table 10.
For proposed pore water locations A02, B01, and C02, there are no groundwater-related
sediment PEC exceedances. The wells in these areas (GL16, GL05, and GL12) only had nickel
and bis(2-ethylhexyl)phthalate groundwater exceedances. None of the sediment concentrations approach the sediment bis(2-ethylhexyl)phthalate or nickel PECs. The only sediment location in the near-shore area that approaches the nickel PEC is B02, which is in fine-grained sediment. Therefore, only the B01 sandy location will be retained for pore water sampling, for nickel analysis only.
The proposed pore water locations D01, DE01, and E01 will be acceptable. Wells RW18
- RW20 and TS04 had cadmium, zinc, cyanide and PAH groundwater exceedances. Locations D01 and E01 had elevated TOC-normalized zinc sediment concentrations. These pore water locations will be analyzed for cadmium, zinc, cyanide and PAHs only.
The proposed pore water locations F01 – F03 are acceptable in concept, since the HI08
well cluster has PAH groundwater exceedances, as well as copper, lead, bis(2-ethylhexyl) phthalate and cyanide, and the F01 and FO2 sediment results included elevated TOC-normalized total PAH concentrations. The F01 and F03 locations will be acceptable, but the F02 location will be shifted to directly offshore of the HI08 well cluster, to better capture potential groundwater discharge. These locations will be analyzed for PAHs, bis(2-ethylhexyl)phthalate, copper, lead, and cyanide only.
The proposed pore water location G01 does not appear to be a wise location for pore
water sampling. Table 1 of the Technical Memorandum describes the sediment sampled from this location as follows: “heavy sheen upon recovery with oily runoff.” This sample also had 89,000 mg/kg oil and grease. Any attempt to sample pore water in this material will undoubtedly sample some oil directly, which is not a component of groundwater originating from the HI08 well cluster. Therefore, this location will not be acceptable for pore water analysis.
It should be noted that the pore water results may necessitate additional follow-up
sampling. Finally, the December 3rd email from EA proposed moving the F01 sandy pore water
sampling location out into the fine-grained offshore area to E03 or H03. This will not be acceptable, since the goal is to sample discharging groundwater which is far more likely in near shore sand.
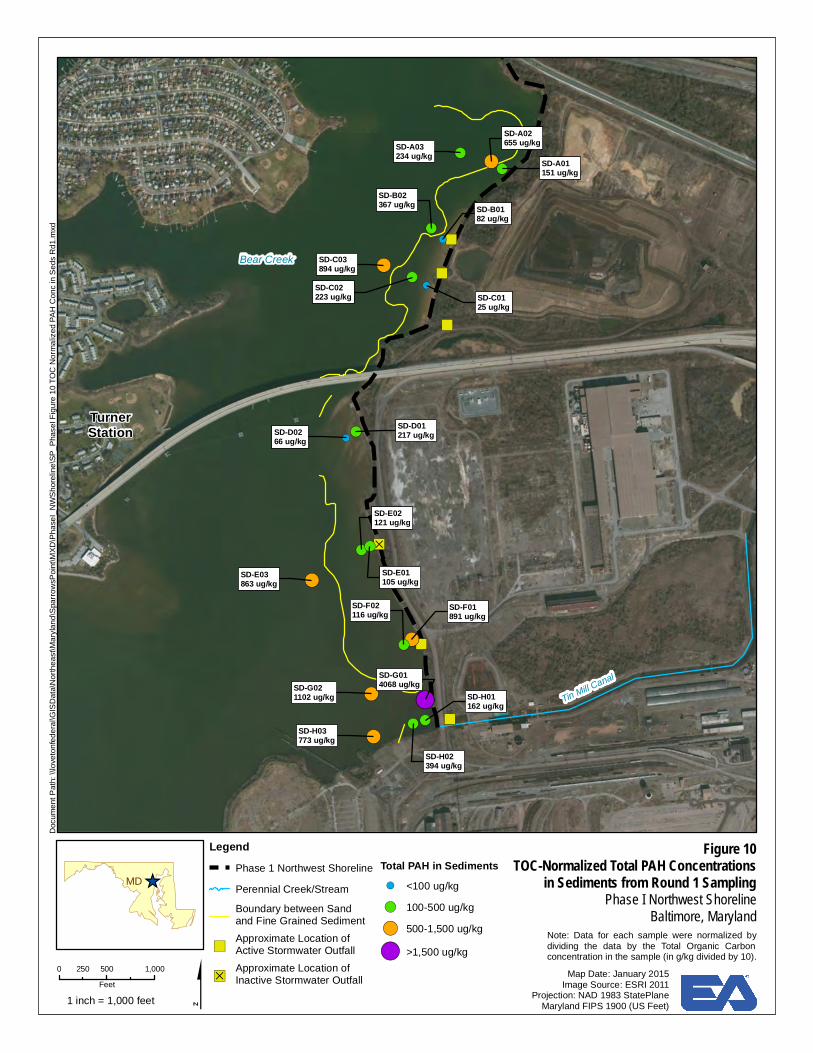
Table 12 Round 2 Sediment Sampling Locations and Rationale As a general statement in reply to the second bullet of the December 3rd email from EA and as guidance in Round 2 sediment sampling, additional samples are necessary only when Round 1 results exceed PEC screening levels for site-related COPCs as found in nearby groundwater and stormwater samples. Unfortunately, there are currently no stormwater results to use. Since the Table 12 rationales were not consistent with this procedure, the proposed locations are generally unacceptable and the majority will not be sampled for sediment. Viewed in combination, the sediment results reveal one area that will require lateral and vertical definition, which is the mouth of Outfall 014, as currently characterized by transects G and H. Although total PAH concentrations did not exceed the sediment PEC at any location, the highest concentrations occurred at these transects, accompanied by extremely high
concentrations of oil and grease, up to 11%. All site-related metals (zinc, cadmium, nickel, copper), cyanide, and bis[2-ethylhexyl]phthalate also exceeded sediment PECs on these transects. While chromium is currently not a site-related COPC, since it is not found in any perimeter wells, the highest chromium sediment concentrations also occurred at transects G and H, possibly representing historical Outfall 014 discharge. The defining characteristic of this area is the very elevated oil and grease, and so oil and grease will also be used as the bounding analyte for lateral and vertical extent. Round 2 sediment samples for this area will include oil and grease, PAHs, bis(2-ethylhexyl)phthalate, metals, and cyanide. Tables 10 – 12 and Figure 11 should be revised according to the comments above. For Round 2 sediment sampling, Figure 11 should only show the additional sediment sample locations necessary to fill in the Outfall 014 mouth currently characterized by the G and H transects. It is also recommended that the actual field sampling include visual assessment of each sample for oil and grease presence, to be used for both lateral and vertical characterization. This method will reduce, if not eliminate, the need for another round of sediment sampling following Round 2.
Sparrows Point Offshore Investigation Round 1 Sediment Investigation and Plan for Round 2 Investigation: Re-screening based on EA comments emailed 12/9/14 December 12, 2014 Ruth Prince, Toxicologist Land and Chemicals Division EPA Region III Mark Mank, Toxicologist Land Management Administration Maryland Department of the Environment This review is in response to the 12/9/14 email from Samantha Saalfield, EA to Ruth Prince, EPA, in which Samantha re-screened the groundwater and sediment data following the process we briefly outlined. She was correct in assuming we originally only considered the groundwater results that exceeded screening criteria by at least 10-fold. This is a common practice to take into account the attenuation and dilution that occurs as groundwater travels through substrate prior to potential discharge to surface waters. Samantha’s re-screening took into account all groundwater exceedances since 2009. In order to apply a more conservative approach, we re-screened the groundwater results at a five-fold factor to take into account attenuation and dilution. Additional screening considerations included excluding prior exceedances if not detected from 2010 – 2014. However, prior exceedances were taken into account if there were no analyses for those chemicals from 2010 – 2014. Also, there were a few instances of including groundwater chemicals that did not exceed screening criteria by five-fold, yet were consistently detected greater than two-fold screening criteria in every sampling event. Sediment PEC exceedances were only identified if the chemical was screened in from nearby groundwater, and if the PEC exceedance was at least two-fold. Samantha included a screening summary table documenting her re-screening in the 12/9/14 email. Footnotes to this table brought up the following issues. It was noted that there are no sediment PECs for cyanide or DEHP. For cyanide, the only available value is the freshwater sediment BTAG value of 0.1 mg/kg, which is used with great uncertainty. For DEHP, the 1996 MacDonald et al coastal sediment quality guideline reference provides a PEC of 2,647 ug/kg. PAHs were identified as sediment PEC exceedances because it was noted that “at least one PAH exceeded the HHRA screening criteria presented in Appendix E of the Work Plan.” However, the only PAHs detected in any well were benzo(a)anthracene, chrysene, and naphthalene. No transect D, E or F sediment concentration for these chemicals exceeded the HHRA screening values in Appendix E. Below are EPA and MDE’s re-screening results compared to Samantha’s results.
Screening Summary Table
Sediment
Sample/Associated
Wells
Groundwater
COPC
Not a Groundwater
COPC
Sediment PEC
Exceedance
A01-A03 GL16, GL02, TS01
copper, DEHP, nickel, zinc
cyanide, lead, silver, thallium
zinc
B01-B02 GL05, GL15
chromium, copper, DEHP, nickel, zinc
arsenic, lead, silver chromium, zinc
C01-C03 GL12
DEHP, mercury, zinc copper, nickel, silver zinc
D01-D02, E01-E03 RW18-20, TS04
cadmium, copper, cyanide, DEHP, lead,
nickel, PAHs, zinc
arsenic zinc
F01-F02 HI08
copper, cyanide, DEHP, lead, PAHs
chromium, nickel, zinc
----
Based on this re-screening, below is a correction to the Porewater Analytical Summary table included in the 12/9/14 email. Note we prefer the sample label F04 instead of FG01 for the new transect F porewater sample location directly offshore of well HI08.
Please incorporate this information into the revised Technical Memorandum for Round 2 sampling. The Round 2 sediment sampling will not include follow-up to the PEC exceedances shown in the revised Screening Summary Table above. Rather, follow-up sampling for those locations are dependent upon the pore water results. Finally, EPA and MDE would like to point out that pore water results are often not straight forward. The in situ water quality measurements in Section 5.5.1 of the Work Plan for the Offshore Investigation must show a distinct difference between the pore water samples and surface water samples to demonstrate that discharging groundwater is actually being sampled. Otherwise, it will be assumed that the sample represents surface water.
From: Prince, RuthTo: Saalfield, Samantha; Barbara Brown -MDE-; Fan, Andrew; pizarro, luis; Mark Mank -MDE-Cc: Barranco, Frank; Madi Novak; Dan SilverSubject: RE: Comments on Sparrows Point Trust Off-Shore Work PlanDate: Tuesday, December 23, 2014 9:57:21 AM
Hi again Samantha – we found an inconsistency in the sampling tables you emailed to us on 12/18. Table 14 categorizes the G and H transects as SW, which is correct, but does not include all SW analytes (essentially a full scan). The Table 12 Analytical Summary does the same. Please revise. Ruth Prince, PhD Toxicologist3LC10Land and Chemicals DivisionU.S. Environmental Protection Agency Region III1650 Arch St.Philadelphia, PA [email protected] From: Prince, Ruth Sent: Tuesday, December 23, 2014 9:33 AMTo: 'Saalfield, Samantha'; Barbara Brown -MDE-; Fan, Andrew; pizarro, luis; Mark Mank -MDE-Cc: Barranco, Frank; Madi Novak; Dan SilverSubject: RE: Comments on Sparrows Point Trust Off-Shore Work Plan Hi Samantha – EPA and MDE have one last revision for Round 2. The Agencies would like to see a little more coring for lateral definition of the oil and grease area. Cores should be collected at F03 and F04 (note Fo1 had an oily black sediment layer with 1.5% oil and grease) instead of the surface grabs. The agencies would also like to see two additional cores midway between G01 and G02, and H01 and H03. Ruth Prince, PhD Toxicologist3LC10Land and Chemicals DivisionU.S. Environmental Protection Agency Region III1650 Arch St.Philadelphia, PA [email protected]
From: Saalfield, Samantha [mailto:[email protected]] Sent: Friday, December 19, 2014 11:59 AMTo: Prince, Ruth; Barbara Brown -MDE-; Fan, Andrew; pizarro, luis; Mark Mank -MDE-Cc: Barranco, Frank; Madi Novak; Dan SilverSubject: RE: Comments on Sparrows Point Trust Off-Shore Work Plan Thank you for sending the preliminary comments, Ruth. The equipment that EA has available is typically only capable of advancing cores to 5-6 ft. In order to achieve a greater depth of coring, we would likely need to obtain a larger boat or barge with a larger vibracorer. This could be done if the findings of the Data Gaps Report indicate that the initial characterization with our equipment does not fully delineate the contamination. We will plan to deliver the revised Technical Memorandum by next Tuesday if possible. thanks,Samantha
From: Prince, Ruth [mailto:[email protected]] Sent: Friday, December 19, 2014 11:53 AMTo: Saalfield, Samantha; Barbara Brown -MDE-; Fan, Andrew; pizarro, luis; Mark Mank -MDE-Cc: Barranco, Frank; Madi Novak; Dan SilverSubject: RE: Comments on Sparrows Point Trust Off-Shore Work Plan Samantha – one more preliminary comment – EA is proposing a vertical depth of 5-6 ft for the transect G and H characterization. Should we consider having a contingency to extend to a greater depth if visual assessment continues to show obvious oil and grease at 5-6 ft? Ruth Prince, PhD Toxicologist3LC10Land and Chemicals DivisionU.S. Environmental Protection Agency Region III1650 Arch St.Philadelphia, PA [email protected] From: Saalfield, Samantha [mailto:[email protected]] Sent: Thursday, December 18, 2014 10:54 AMTo: Prince, Ruth; Barbara Brown -MDE-; Fan, Andrew; pizarro, luis; Mark Mank -MDE-; Horacio Tablada -MDE-Cc: Barranco, Frank; Madi Novak; Dan SilverSubject: RE: Comments on Sparrows Point Trust Off-Shore Work Plan
Hello all - Attached are the revised sampling tables for pore water and sediment, based on EPA and MDE comments and clarifications received on the draft memo. A figure illustrating the sampling locations is also attached. The pore water and co-located surface sediment sampling locations are as discussed in previous communications. The proposed approach for the subsurface sediment investigation is discussed below. As shown in the tables, we propose that up to 10 sediment cores be collected from the area of the G and H transects, where high concentrations of oil and grease (up to 11%), observable sheen and petroleum odor, and metals concentrations exceeding sediment PECs were reported in surface sediment. Although the Work Plan indicated that sediment cores, if required, would be collected using manual push cores to a depth of approximately 2 ft, the Round 1 data indicate that deeper delineation is likely necessary to define the extent of contamination in the targeted area. An electric vibracorer will be deployed from a 28-ft aluminum-hull survey and research vessel and used to advance cores to a penetration depth of 5 to 6 feet below the sediment-water interface or refusal. Cores will be split, described and photographed, and sediment sub-samples will be generated based on 2-foot intervals below the sediment-water interface (0-2 ft, 2-4 ft, 4-6 ft, etc.). Each interval will be homogenized using decontaminated stainless steel mixing equipment and transferred to pre-cleaned jars for analytical testing. Cores from locations G01, G02, H01, and H03 will be collected and sampled first, followed by cores from locations G03 and H04. If no contamination (sheen or petroleum odor) is apparent in cores G03 and H04 (at the edge of the subaqueous survey area), then these cores will also be sampled for laboratory analyses as described above, and no more cores will be collected. The absence of contamination at these locations will be interpreted as the western limit of oil and grease impacts. However, if contamination is apparent in these cores, they will be logged, described, and retained but not sampled, and cores will be advanced at step-out locations G04 and H05. If no contamination (obvious sheen or petroleum odor) is apparent in these cores, then these cores will also be sampled at the described intervals, and no additional step-out cores will be collected. If contamination is apparent in cores from G04 and H05, these cores will be logged, described, and retained but not sampled, and step-out cores will be advanced at locations G05 and H06. If these step-out locations are advanced, the cores from G05 and H06 will be sampled on the intervals described above, regardless of the presence or absence of contamination. Thus, up to ten cores may be collected, but only six cores will be sampled for laboratory analyses. Because oil and grease impacts are readily apparent, field observations will be used to delineate impacts in the absence of analytical data. For planning purposes, it is assumed that an average of three samples will be collected from each core. Note that the contingency step-out locations (G04, G05, H05, H06) would extend the delineation to approximately 2,000 offshore from the Phase I area. If this coring effort does not achieve delineation, EA would need to discuss further expansion of the investigation area and/or whether use of a barge with larger vibracorer to obtain deeper cores. Additionally, we targeted the coring
locations on the G and H transects, as requested in the EPA and MDE comments on the draft memo. However, petroleum odor was noted during sampling of location E03 (the only other fine-grained sediment location sampled in the southern area during Round 1). Based on this, it is possible that the oil and grease contamination extends north toward the Key Bridge. Please let us know if the plans for pore water and co-located surface sediment grab samples (as discussed previously) are acceptable, and whether you would recommend any revisions to the proposed approach to sediment coring. We are planning to begin sampling as soon as December 27, so are hoping to have by then an approved sampling approach as well as CBF feedback on where they require samples. thank you,Samantha
Review of Sparrows Point Offshore Investigation Revised December 30, 2014 Technical Memorandum Round 1 Sediment Investigation and Plan for Round 2 Investigation January 2, 2015 Ruth Prince, Toxicologist Land and Chemicals Division EPA Region III Mark Mank, Toxicologist Land Management Administration Maryland Department of the Environment
1. Results, p. 4 The paragraph on PAHs does not include complete information on the odor and sheen results, only highlighting samples E03, G02, and H03. Please revise to include that G01, H01, and H03 had heavy petroleum odor, H02 and G02 had slight sheen and no odor, and E03 had a slight odor with no sheen.
2. Proposed Sampling Plan for Round 2 Sampling, Pore Water, p. 5 and Table 10 The second bulleted criterion listed in this section for pore water selection is incorrect. Only groundwater results exceeding screening criteria were considered in pore water location and COPC selection. The criterion stated here for sediment PEC exceedances applies to potential future sediment characterization only, pending stormwater and/or pore water results that indicate the site is a source of that chemical. Please correct this section and Table 10 accordingly. Also, for transparency purposes, please include in this section the groundwater screening information provided in the December 12 EPA and MDE comments regarding how groundwater results over time were handled.
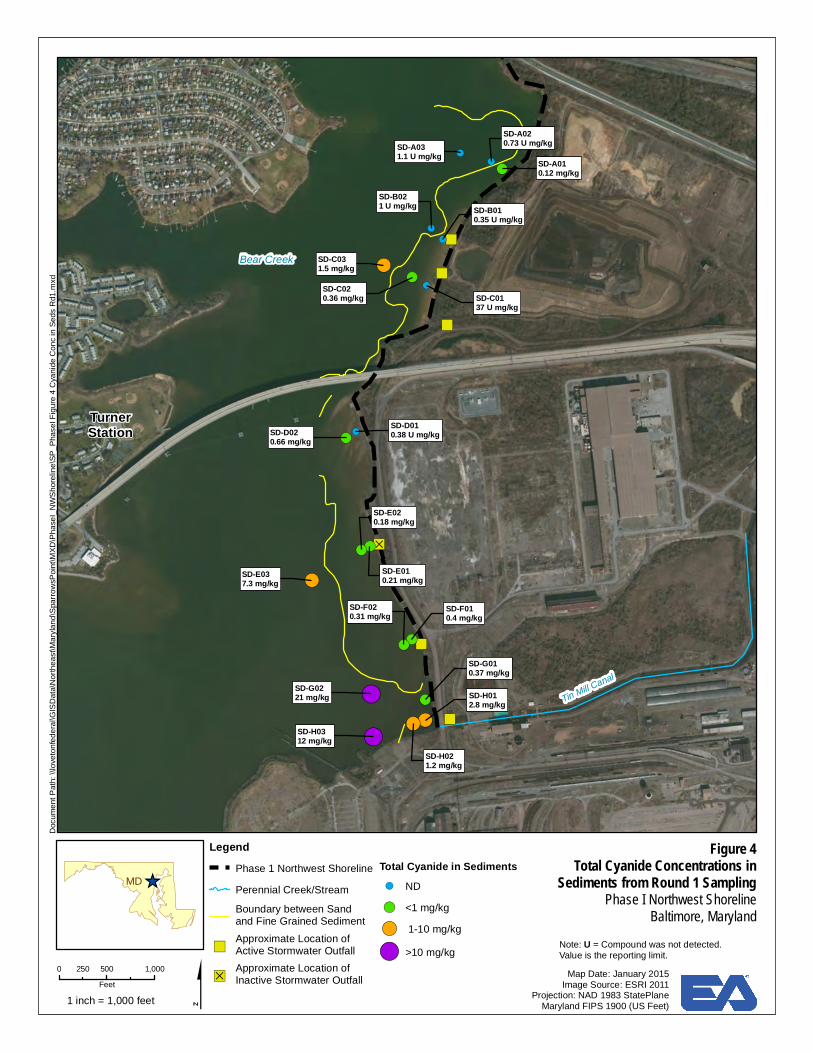
3. Proposed Sampling Plan for Round 2 Sampling, Pore Water, p. 6, and Figures 8, 9, and 10
The top paragraph on this page describing the TOC-normalized sediment results illustrated in Figures 8, 9, and 10 was not actually utilized to select pore water sample locations and so is not relevant to this section. This paragraph may be moved to the Results section.
4. Proposed Sampling Plan for Round 2 Sampling, Sediment, p. 6 - 7 a) This section states on p. 6 that the rationale for sediment sampling locations is in Table
12. Please revise to correct to Table 13. b) On p. 7, this section states that sampling will not occur in cores G03 and H04, and G04
and H05, if contamination is apparent, and instead they will be described and retained. However, since the goal of Round 2 sediment sampling is delineating the lateral and vertical extent of the transect G-H contamination, it would appear that sampling and analysis of these cores should they be visually contaminated would be useful. Please revise accordingly.
c) On p. 7, this section states that parameters to be analyzed in the sediment core samples were selected based on the primary contaminants identified in the area of the G and H
transects in Round 1. Please revise to add that parameters were also selected based upon potential historical Tin Mill Canal releases.
5. All Site Figures
The site figures all label the Tin Mill Canal as Humphrey’s Creek. Please revise to correctly label the Tin Mill Canal.
From: Prince, RuthTo: Saalfield, Samantha; Barranco, Frank; Barbara Brown -MDE-; Fan, Andrew; pizarro, luis; Mark Mank -MDE-Cc: Madi Novak; Dan Silver; Morris, John; Corum, SanitaSubject: RE: Comments on Sparrows Point Trust Off-Shore Work PlanDate: Tuesday, January 13, 2015 10:20:23 AM
Hi Samantha – I think I may be over-thinking at this point, and we haven’t establishedany action levels. See my strikethrough below, let’s just leave it that for cores with noobservable impacts, only the surface interval and the interval directly below that willbe analyzed. Please go ahead and send the revised memo. Ruth Prince, PhD Toxicologist3LC10Land and Chemicals DivisionU.S. Environmental Protection Agency Region III1650 Arch St.Philadelphia, PA [email protected] From: Saalfield, Samantha [mailto:[email protected]] Sent: Tuesday, January 13, 2015 10:02 AMTo: Prince, Ruth; Barranco, Frank; Barbara Brown -MDE-; Fan, Andrew; pizarro, luis; Mark Mank -MDE-Cc: Madi Novak; Dan Silver; Morris, John; Corum, SanitaSubject: RE: Comments on Sparrows Point Trust Off-Shore Work Plan
Ruth – Thank you for your reply. The revised language below reflects your requested change. It may alsobe worth creating a flow chart to convey the various analytical scenarios. Samantha An electric vibracorer will be deployed from a 28-ft aluminum-hull survey and researchvessel and used to advance cores to a penetration depth of 5 to 6 feet below the sediment-water interface or refusal. Upon recovery, the cores will be held at 4°C, transferred to aprocessing facility, then split, described and photographed. Any observable impacts (sheenand/or odor) will be assessed and recorded. Generally, sediment sub-samples will begenerated based on 2-foot intervals below the sediment-water interface (0-2 ft, 2-4 ft, 4-6 ft,etc.). A surface interval sample from every core will be submitted for analysis. If a core hasno observable impacts, then the next deeper interval (2-4 ft) will also be submitted for
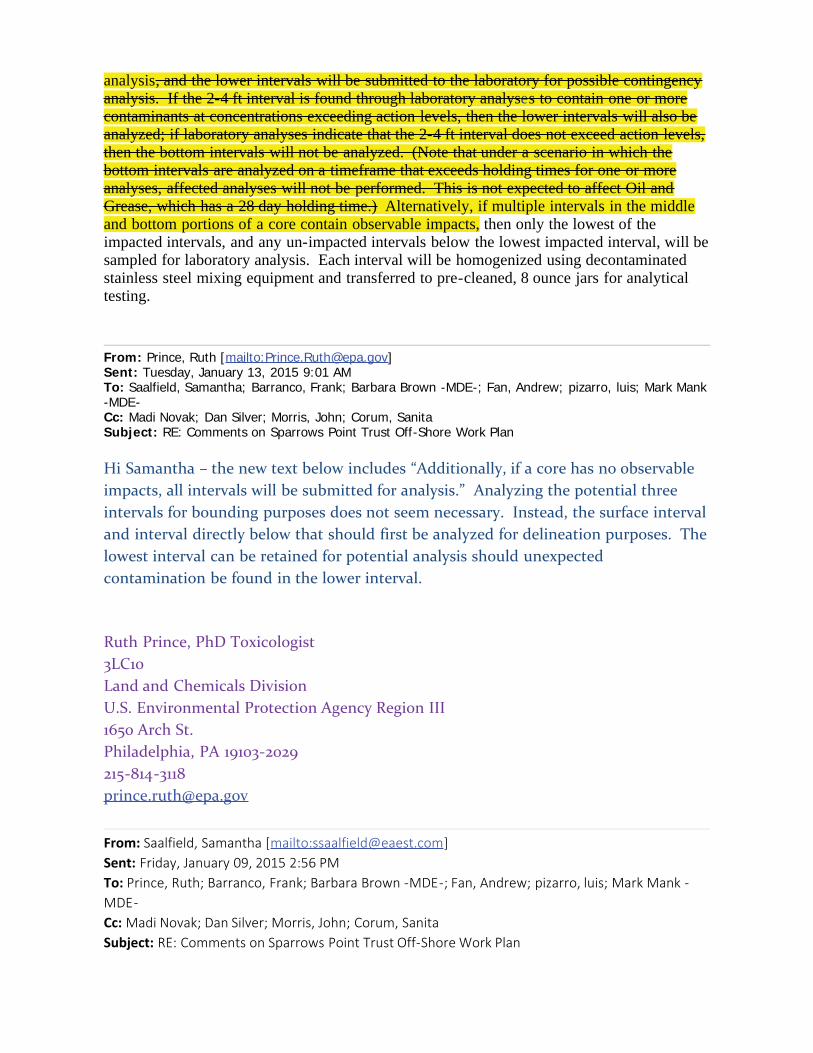
analysis, and the lower intervals will be submitted to the laboratory for possible contingencyanalysis. If the 2-4 ft interval is found through laboratory analyses to contain one or morecontaminants at concentrations exceeding action levels, then the lower intervals will also beanalyzed; if laboratory analyses indicate that the 2-4 ft interval does not exceed action levels,then the bottom intervals will not be analyzed. (Note that under a scenario in which thebottom intervals are analyzed on a timeframe that exceeds holding times for one or moreanalyses, affected analyses will not be performed. This is not expected to affect Oil andGrease, which has a 28 day holding time.) Alternatively, if multiple intervals in the middleand bottom portions of a core contain observable impacts, then only the lowest of theimpacted intervals, and any un-impacted intervals below the lowest impacted interval, will besampled for laboratory analysis. Each interval will be homogenized using decontaminatedstainless steel mixing equipment and transferred to pre-cleaned, 8 ounce jars for analyticaltesting.
From: Prince, Ruth [mailto:[email protected]]Sent: Tuesday, January 13, 2015 9:01 AMTo: Saalfield, Samantha; Barranco, Frank; Barbara Brown -MDE-; Fan, Andrew; pizarro, luis; Mark Mank-MDE-Cc: Madi Novak; Dan Silver; Morris, John; Corum, SanitaSubject: RE: Comments on Sparrows Point Trust Off-Shore Work Plan
Hi Samantha – the new text below includes “Additionally, if a core has no observableimpacts, all intervals will be submitted for analysis.” Analyzing the potential threeintervals for bounding purposes does not seem necessary. Instead, the surface intervaland interval directly below that should first be analyzed for delineation purposes. Thelowest interval can be retained for potential analysis should unexpectedcontamination be found in the lower interval. Ruth Prince, PhD Toxicologist3LC10Land and Chemicals DivisionU.S. Environmental Protection Agency Region III1650 Arch St.Philadelphia, PA [email protected] From: Saalfield, Samantha [mailto:[email protected]] Sent: Friday, January 09, 2015 2:56 PMTo: Prince, Ruth; Barranco, Frank; Barbara Brown -MDE-; Fan, Andrew; pizarro, luis; Mark Mank -MDE-Cc: Madi Novak; Dan Silver; Morris, John; Corum, SanitaSubject: RE: Comments on Sparrows Point Trust Off-Shore Work Plan
Ruth –
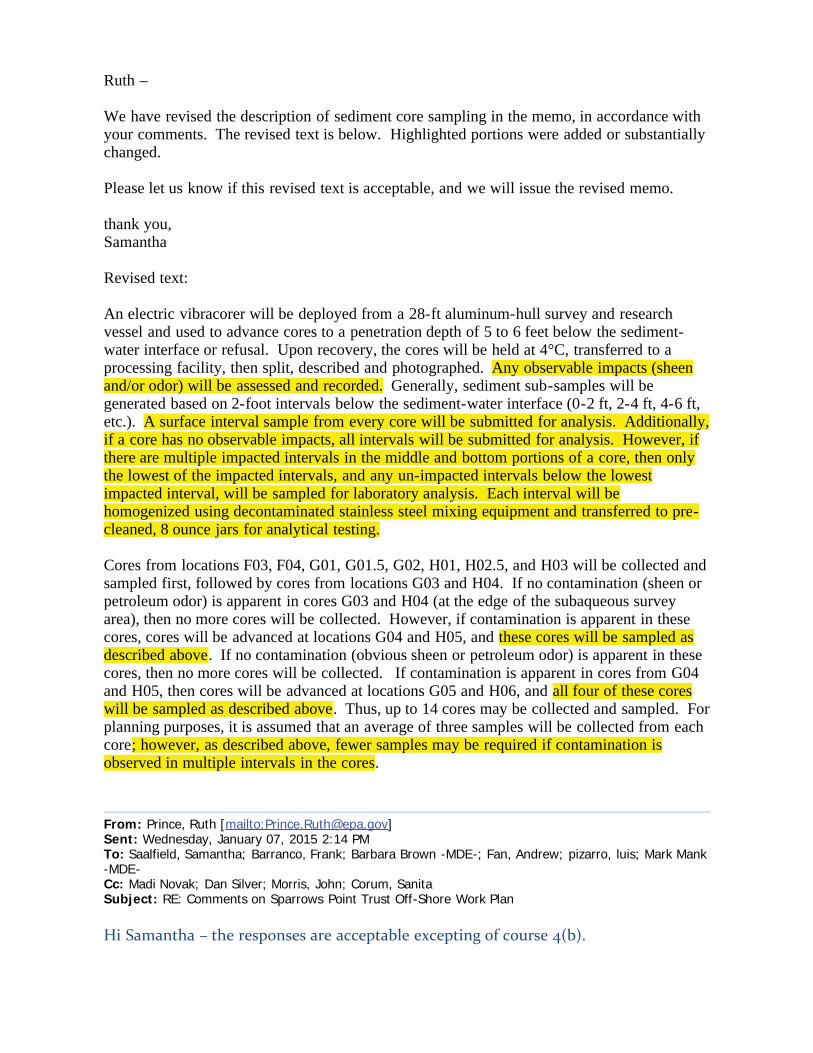
We have revised the description of sediment core sampling in the memo, in accordance withyour comments. The revised text is below. Highlighted portions were added or substantiallychanged.
Please let us know if this revised text is acceptable, and we will issue the revised memo.
thank you,Samantha
Revised text:
An electric vibracorer will be deployed from a 28-ft aluminum-hull survey and researchvessel and used to advance cores to a penetration depth of 5 to 6 feet below the sediment-water interface or refusal. Upon recovery, the cores will be held at 4°C, transferred to aprocessing facility, then split, described and photographed. Any observable impacts (sheenand/or odor) will be assessed and recorded. Generally, sediment sub-samples will begenerated based on 2-foot intervals below the sediment-water interface (0-2 ft, 2-4 ft, 4-6 ft,etc.). A surface interval sample from every core will be submitted for analysis. Additionally,if a core has no observable impacts, all intervals will be submitted for analysis. However, ifthere are multiple impacted intervals in the middle and bottom portions of a core, then onlythe lowest of the impacted intervals, and any un-impacted intervals below the lowestimpacted interval, will be sampled for laboratory analysis. Each interval will behomogenized using decontaminated stainless steel mixing equipment and transferred to pre-cleaned, 8 ounce jars for analytical testing.
Cores from locations F03, F04, G01, G01.5, G02, H01, H02.5, and H03 will be collected andsampled first, followed by cores from locations G03 and H04. If no contamination (sheen orpetroleum odor) is apparent in cores G03 and H04 (at the edge of the subaqueous surveyarea), then no more cores will be collected. However, if contamination is apparent in thesecores, cores will be advanced at locations G04 and H05, and these cores will be sampled asdescribed above. If no contamination (obvious sheen or petroleum odor) is apparent in thesecores, then no more cores will be collected. If contamination is apparent in cores from G04and H05, then cores will be advanced at locations G05 and H06, and all four of these coreswill be sampled as described above. Thus, up to 14 cores may be collected and sampled. Forplanning purposes, it is assumed that an average of three samples will be collected from eachcore; however, as described above, fewer samples may be required if contamination isobserved in multiple intervals in the cores.
From: Prince, Ruth [mailto:[email protected]]Sent: Wednesday, January 07, 2015 2:14 PMTo: Saalfield, Samantha; Barranco, Frank; Barbara Brown -MDE-; Fan, Andrew; pizarro, luis; Mark Mank-MDE-Cc: Madi Novak; Dan Silver; Morris, John; Corum, SanitaSubject: RE: Comments on Sparrows Point Trust Off-Shore Work Plan
Hi Samantha – the responses are acceptable excepting of course 4(b).
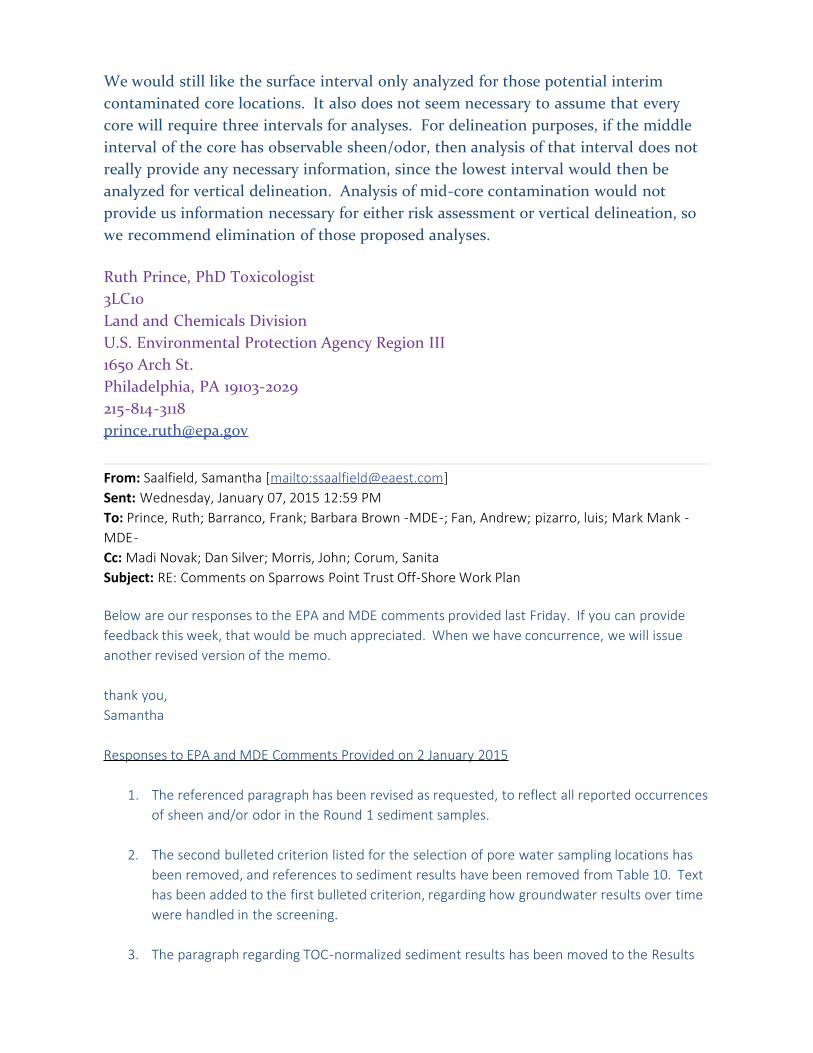
We would still like the surface interval only analyzed for those potential interimcontaminated core locations. It also does not seem necessary to assume that everycore will require three intervals for analyses. For delineation purposes, if the middleinterval of the core has observable sheen/odor, then analysis of that interval does notreally provide any necessary information, since the lowest interval would then beanalyzed for vertical delineation. Analysis of mid-core contamination would notprovide us information necessary for either risk assessment or vertical delineation, sowe recommend elimination of those proposed analyses. Ruth Prince, PhD Toxicologist3LC10Land and Chemicals DivisionU.S. Environmental Protection Agency Region III1650 Arch St.Philadelphia, PA [email protected] From: Saalfield, Samantha [mailto:[email protected]] Sent: Wednesday, January 07, 2015 12:59 PMTo: Prince, Ruth; Barranco, Frank; Barbara Brown -MDE-; Fan, Andrew; pizarro, luis; Mark Mank -MDE-Cc: Madi Novak; Dan Silver; Morris, John; Corum, SanitaSubject: RE: Comments on Sparrows Point Trust Off-Shore Work Plan
Below are our responses to the EPA and MDE comments provided last Friday. If you can providefeedback this week, that would be much appreciated. When we have concurrence, we will issueanother revised version of the memo. thank you,Samantha Responses to EPA and MDE Comments Provided on 2 January 2015
1. The referenced paragraph has been revised as requested, to reflect all reported occurrencesof sheen and/or odor in the Round 1 sediment samples.
2. The second bulleted criterion listed for the selection of pore water sampling locations hasbeen removed, and references to sediment results have been removed from Table 10. Texthas been added to the first bulleted criterion, regarding how groundwater results over timewere handled in the screening.
3. The paragraph regarding TOC-normalized sediment results has been moved to the Results
section.
4. a. The text has been corrected to reference Table 13. b. Oil and grease contamination is observable in the field, as was confirmed during Round 1. All samples with a detected concentration of oil and grease exceeding 1.5% were observedto have an observed sheen and/or odor. Given that oil and grease has been identified as thebounding analyte for lateral and vertical extent, and given that the primary goal of thecoring is to support selection of remedial options in the future CMS, the sampling plan forthe sediment cores has been designed to omit laboratory analysis of sediment that isobserved in the field to be contaminated with oil and grease. Therefore, we propose that ifcores G03, H04, G04, and/or H05 are found to be visually contaminated, it is not necessaryto sample these cores for laboratory analysis in order to meet the goals of the delineation.An additional rationale for omitting analyses of samples from sediment cores at locationsexhibiting visual signs of oil and grease relates to cost savings and budgetary limitations. c. The referenced sentence was revised to indicate that parameters for sediment analysiswere also selected based upon potential historical Tin Mill Canal releases.
5. The site figures have been revised by replacing the “Humphrey’s Creek” label with a “Tin
Mill Canal” label.
From: Prince, Ruth [mailto:[email protected]]Sent: Friday, January 02, 2015 10:39 AMTo: Barranco, Frank; Barbara Brown -MDE-; Fan, Andrew; pizarro, luis; Mark Mank -MDE-Cc: Madi Novak; Dan Silver; Saalfield, Samantha; Morris, John; Corum, SanitaSubject: RE: Comments on Sparrows Point Trust Off-Shore Work Plan
Hi Frank – attached please find EPA and MDE review comments on the revisedTechnical Memo. We will be available next week with the exception of Mondayshould you have any questions. Ruth Prince, PhD Toxicologist3LC10Land and Chemicals DivisionU.S. Environmental Protection Agency Region III1650 Arch St.Philadelphia, PA [email protected] From: Barranco, Frank [mailto:[email protected]] Sent: Tuesday, December 30, 2014 2:05 PM
1
Saalfield, Samantha
From: Barbara Brown -MDE- <[email protected]>Sent: Wednesday, January 14, 2015 2:46 PMTo: Saalfield, SamanthaCc: Prince, Ruth; Barranco, Frank; Fan, Andrew; pizarro, luis; Mark Mank -MDE-; Madi
Novak; Dan Silver; Morris, John; Corum, SanitaSubject: Re: Comments on Sparrows Point Trust Off-Shore Work Plan
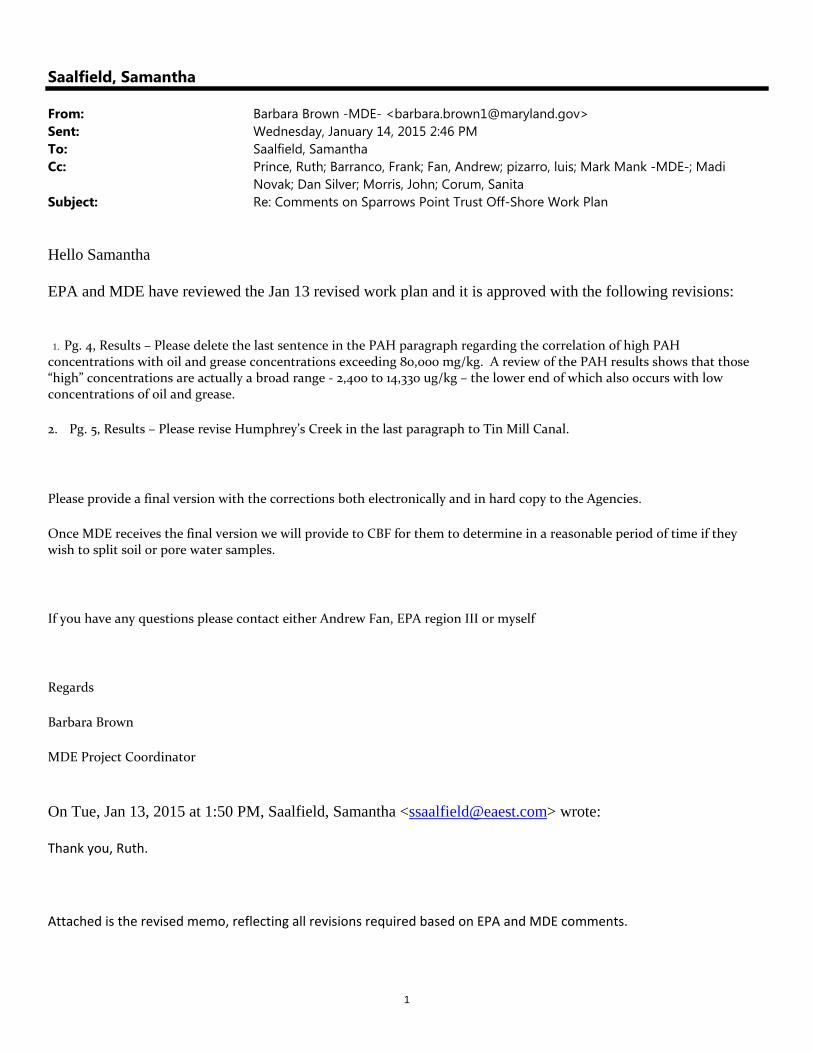
Hello Samantha EPA and MDE have reviewed the Jan 13 revised work plan and it is approved with the following revisions:
1. Pg. 4, Results – Please delete the last sentence in the PAH paragraph regarding the correlation of high PAH concentrations with oil and grease concentrations exceeding 80,000 mg/kg. A review of the PAH results shows that those “high” concentrations are actually a broad range ‐ 2,400 to 14,330 ug/kg – the lower end of which also occurs with low concentrations of oil and grease.
2. Pg. 5, Results – Please revise Humphrey’s Creek in the last paragraph to Tin Mill Canal.
Please provide a final version with the corrections both electronically and in hard copy to the Agencies.
Once MDE receives the final version we will provide to CBF for them to determine in a reasonable period of time if they wish to split soil or pore water samples.
If you have any questions please contact either Andrew Fan, EPA region III or myself
Regards
Barbara Brown
MDE Project Coordinator
On Tue, Jan 13, 2015 at 1:50 PM, Saalfield, Samantha <[email protected]> wrote:
Thank you, Ruth.
Attached is the revised memo, reflecting all revisions required based on EPA and MDE comments.