This work is Copyright. Apart from any use permitted under the Copyright Act 1968 (Cwlth), no part may be
reproduced by any process without prior written permission obtained from the Department of Water, Land and Biodiversity Conservation. Requests and enquiries concerning reproduction and rights should be directed to the Chief Executive, Department of Water, Land and Biodiversity Conservation, GPO Box 2834, Adelaide SA 5001.
Disclaimer
The Department of Water, Land and Biodiversity Conservation and its employees do not warrant or make any
representation regarding the use, or results of the use, of the information contained herein as regards to its correctness, accuracy, reliability, currency or otherwise. The Department of Water, Land and Biodiversity Conservation and its employees expressly disclaims all liability or responsibility to any person using the information or advice. Information contained in this document is correct at the time of writing.
ISBN-13 978-1-921218-49-1
Knowledge and Information Division
25 Grenfell Street, Adelaide
GPO Box 2834, Adelaide SA 5001
Telephone National (08) 8463 6946
International +61 8 8463 6946
Fax National (08) 8463 6999
International +61 8 8463 6999
Website www.dwlbc.sa.gov.au
SALINITY RISK FROM GROUNDWATER EXTRACTIONS IN THE MALLEE REGION
LATERAL INFLOW OF MORE SALINE GROUNDWATER ...............................................3
FROM EAST OF MURRAYVILLE ...................................................................................3 FROM NORTH OF PEEBINGA .......................................................................................5
DOWNWARD LEAKAGE FROM PLIOCENE SANDS AQUIFER ......................................6
STEADY STATE (PRE-IRRIGATION).............................................................................6 CURRENT SITUATION...................................................................................................7 MODELLED 2030 SCENARIO ........................................................................................8
UPWARD LEAKAGE FROM RENMARK GROUP AQUIFER ............................................8
FLUSHING OF UNSATURATED ZONE SALT ...................................................................9
List of Figures Figure 1 Pre-irrigation groundwater flow directions........................................................................3 Figure 2 Observed 2005 groundwater flow directions....................................................................4 Figure 3 Predicted groundwater flow directions for 2030...............................................................5 Figure 4 Extent of pre-irrigation leakage between the TLA and PSA.............................................6 Figure 5. Observed versus predicted results for PS obs well PEB 3..............................................7 Figure 6 TLA groundwater salinities...............................................................................................7 Figure 7 Extent of modelled 2030 leakage between the TLA and PSA .........................................8 Figure 8 Extent of pre-irrigation leakage between the TLA and TCSA ..........................................9 Figure 9 Extent of depressurisation during modelling scenarios..................................................10
Technical note 2007/05 2
INTRODUCTION
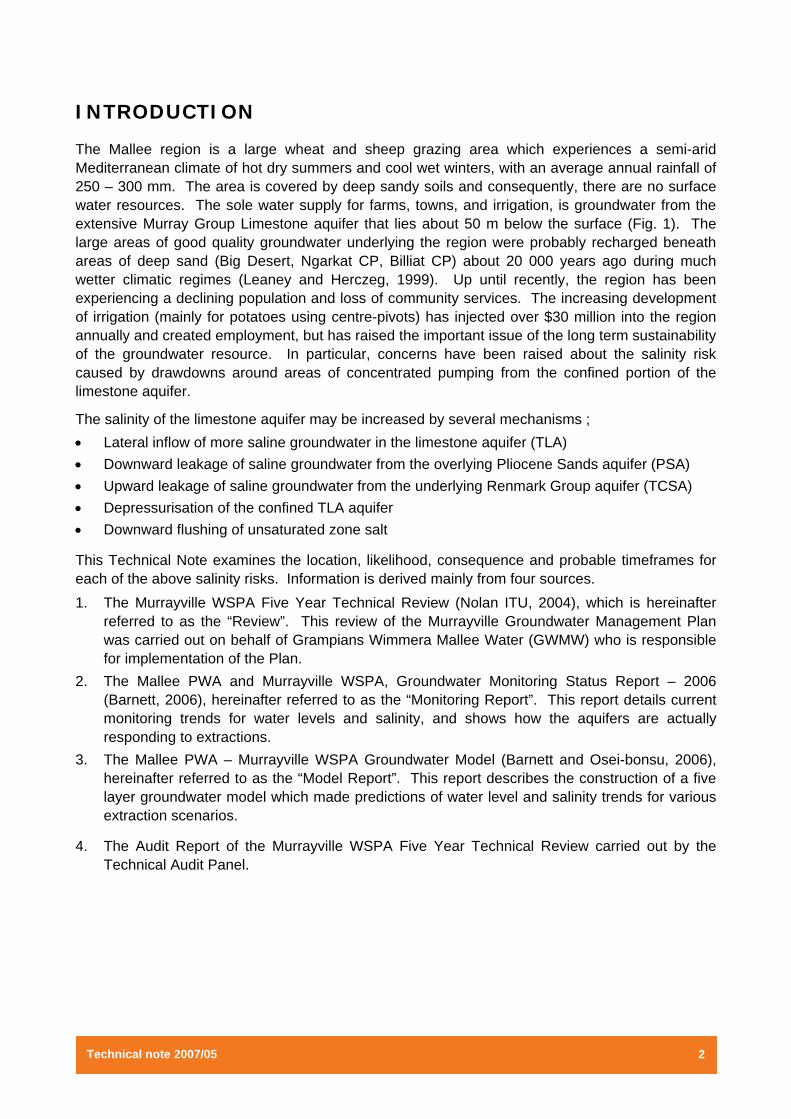
The Mallee region is a large wheat and sheep grazing area which experiences a semi-arid Mediterranean climate of hot dry summers and cool wet winters, with an average annual rainfall of 250 – 300 mm. The area is covered by deep sandy soils and consequently, there are no surface water resources. The sole water supply for farms, towns, and irrigation, is groundwater from the extensive Murray Group Limestone aquifer that lies about 50 m below the surface (Fig. 1). The large areas of good quality groundwater underlying the region were probably recharged beneath areas of deep sand (Big Desert, Ngarkat CP, Billiat CP) about 20 000 years ago during much wetter climatic regimes (Leaney and Herczeg, 1999). Up until recently, the region has been experiencing a declining population and loss of community services. The increasing development of irrigation (mainly for potatoes using centre-pivots) has injected over $30 million into the region annually and created employment, but has raised the important issue of the long term sustainability of the groundwater resource. In particular, concerns have been raised about the salinity risk caused by drawdowns around areas of concentrated pumping from the confined portion of the limestone aquifer.
The salinity of the limestone aquifer may be increased by several mechanisms ; • Lateral inflow of more saline groundwater in the limestone aquifer (TLA) • Downward leakage of saline groundwater from the overlying Pliocene Sands aquifer (PSA) • Upward leakage of saline groundwater from the underlying Renmark Group aquifer (TCSA) • Depressurisation of the confined TLA aquifer • Downward flushing of unsaturated zone salt
This Technical Note examines the location, likelihood, consequence and probable timeframes for each of the above salinity risks. Information is derived mainly from four sources. 1. The Murrayville WSPA Five Year Technical Review (Nolan ITU, 2004), which is hereinafter
referred to as the “Review”. This review of the Murrayville Groundwater Management Plan was carried out on behalf of Grampians Wimmera Mallee Water (GWMW) who is responsible for implementation of the Plan.
2. The Mallee PWA and Murrayville WSPA, Groundwater Monitoring Status Report – 2006 (Barnett, 2006), hereinafter referred to as the “Monitoring Report”. This report details current monitoring trends for water levels and salinity, and shows how the aquifers are actually responding to extractions.
3. The Mallee PWA – Murrayville WSPA Groundwater Model (Barnett and Osei-bonsu, 2006), hereinafter referred to as the “Model Report”. This report describes the construction of a five layer groundwater model which made predictions of water level and salinity trends for various extraction scenarios.
4. The Audit Report of the Murrayville WSPA Five Year Technical Review carried out by the Technical Audit Panel.
Technical note 2007/05 3
LATERAL INFLOW OF MORE SALINE GROUNDWATER
Before irrigation commenced, groundwater flowed through the area from south to the north and northwest, as shown in Figure 1. Drawdowns associated with irrigation extractions have altered groundwater flowpaths which may create a risk of lateral inflow of more saline groundwater from two areas – from east of Murrayville and from north of Peebinga.
Irrigation induced drawdowns to the northwest of Murrayville understandably raised the concern of saline groundwater in the TLA to the east of Murrayville being drawn into the area, rendering supplies unusable for stock and domestic purposes. The Review states that “potential exists for lateral intrusion of poorer groundwater quality in the TLA from the east”. If there was no regional gradient, the drawdowns could indeed lead ultimately to a slow movement of saline groundwater to the west. However, the strong northerly flow gradient overwhelms any westerly flow component.
Figure 2 (from the Monitoring Report) displays the observed potentiometric surface elevation contours and groundwater movement in 2005 as well as the TLA groundwater salinity. This plan shows the situation after 10 years of irrigation in the Murrayville WSPA, with current extractions representing about 40% of the PAV. It shows that the northerly groundwater movement is maintained through the Murrayville WSPA, with no westerly flow component apparent until the Peebinga – Berrook area in the north. Here, the groundwater salinity is less than 3000 mg/L. The Review also points out that observation wells located in the east of the WSPA should provide early warning of any lateral intrusion. So far, they have not shown a rising trend.
The groundwater model predictions for 2030 show that groundwater flow directions do not change markedly from 2005. Figure 3 (from the Modelling Report) depicts the potentiometric surface elevation contours and groundwater flow directions for the worst case scenario – the maximum drawdown during the summer irrigation season with extractions of 16 000 ML/yr from the Victorian Border Zones (compared with the current 4200 ML/yr). The Monitoring Report shows that although extractions in SA have some impact on drawdowns in Victoria, the main influence is local pumping.
Figure 3 Predicted groundwater flow directions for 2030
FROM NORTH OF PEEBINGA
Figure 2 shows a small area of flow reversal to the north of Peebinga at the downgradient extent of irrigation extraction. Reversals in groundwater flow toward centres of concentrated pumping are normally a matter of concern if such reversals lead to salinity increases, or adverse impacts due to reduced discharge downgradient. The situation described above is not yet a cause for concern because; • the water level gradients driving the flow reversal are very small, resulting in groundwater
movement at a rate of 2 - 3 m/year. A recovery of less than a metre is required to eliminate this reversal.
• the groundwater salinity in the area of flow reversal is 1000 – 2000 mg/L.
• the Modelling Report predicted a maximum increase of only 15 mg/L (0.08 %) by 2030.
Murrayville Pinnaroo
Peebinga
Potentiometric surface (m AHD) 40 Groundwater flow direction
Technical note 2007/05 6
DOWNWARD LEAKAGE FROM PLIOCENE SANDS AQUIFER
Downward leakage into from the TLA from the overlying PSA containing saline groundwater as a result of irrigation-induced drawdown, has been a major concern for managers and landholders in Victoria.
STEADY STATE (PRE-IRRIGATION)
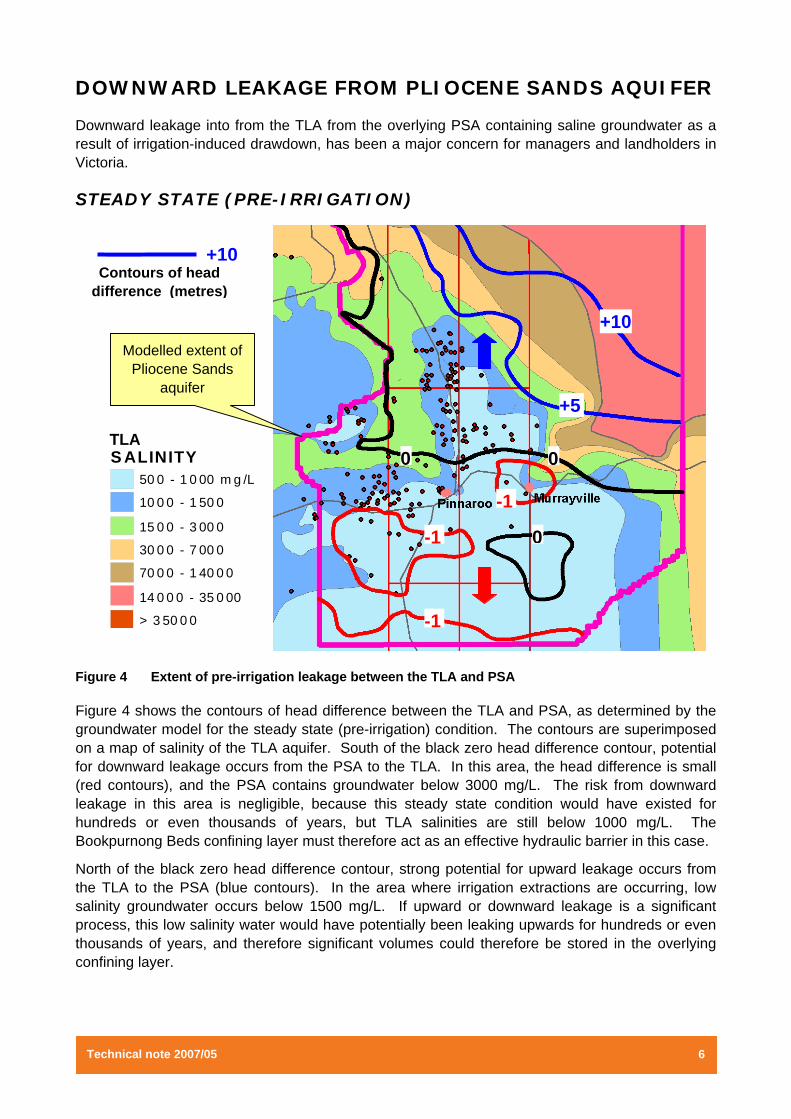
Figure 4 Extent of pre-irrigation leakage between the TLA and PSA
Figure 4 shows the contours of head difference between the TLA and PSA, as determined by the groundwater model for the steady state (pre-irrigation) condition. The contours are superimposed on a map of salinity of the TLA aquifer. South of the black zero head difference contour, potential for downward leakage occurs from the PSA to the TLA. In this area, the head difference is small (red contours), and the PSA contains groundwater below 3000 mg/L. The risk from downward leakage in this area is negligible, because this steady state condition would have existed for hundreds or even thousands of years, but TLA salinities are still below 1000 mg/L. The Bookpurnong Beds confining layer must therefore act as an effective hydraulic barrier in this case.
North of the black zero head difference contour, strong potential for upward leakage occurs from the TLA to the PSA (blue contours). In the area where irrigation extractions are occurring, low salinity groundwater occurs below 1500 mg/L. If upward or downward leakage is a significant process, this low salinity water would have potentially been leaking upwards for hundreds or even thousands of years, and therefore significant volumes could therefore be stored in the overlying confining layer.
S ALINITY50 0 - 1 0 00 m g /L
10 0 0 - 1 50 0
15 0 0 - 3 00 0
30 0 0 - 7 00 0
70 0 0 - 1 40 0 0
14 0 0 0 - 35 0 00
> 3 50 0 0
Modelled extent of Pliocene Sands
aquifer
+10Contours of head
difference (metres)
TLA
0
0 0
-1
-1
-1
+5
+10
Technical note 2007/05 7
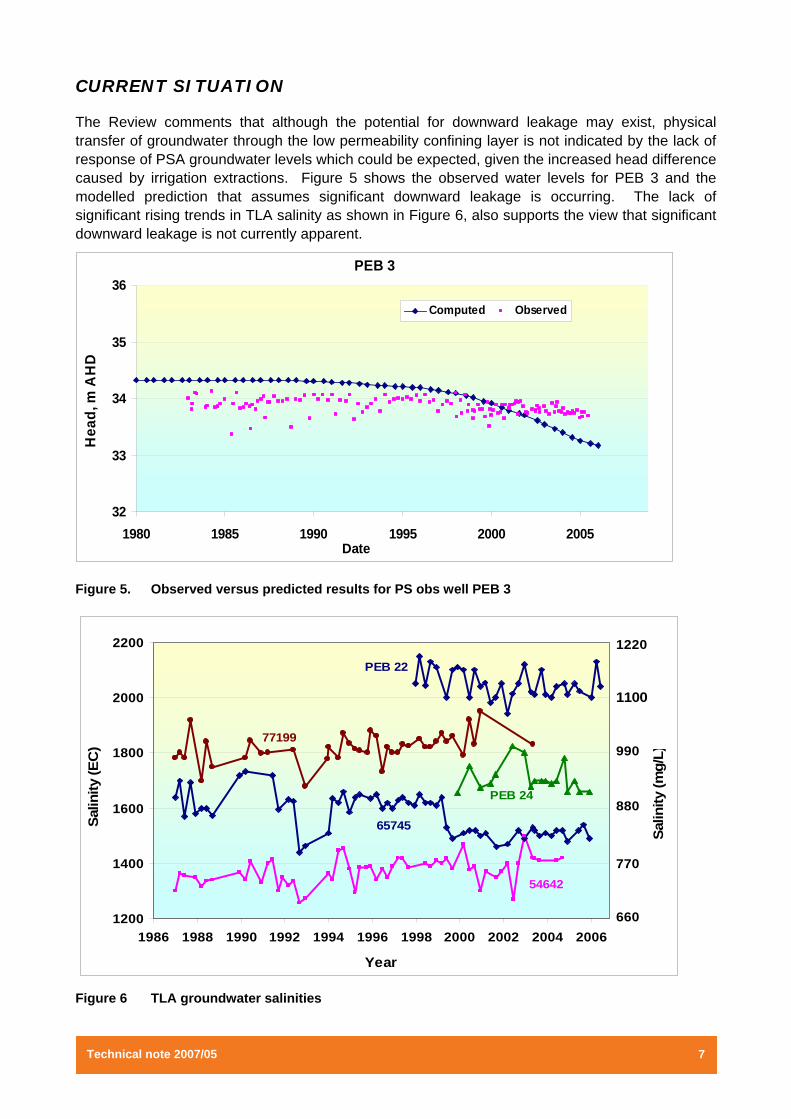
CURRENT SITUATION
The Review comments that although the potential for downward leakage may exist, physical transfer of groundwater through the low permeability confining layer is not indicated by the lack of response of PSA groundwater levels which could be expected, given the increased head difference caused by irrigation extractions. Figure 5 shows the observed water levels for PEB 3 and the modelled prediction that assumes significant downward leakage is occurring. The lack of significant rising trends in TLA salinity as shown in Figure 6, also supports the view that significant downward leakage is not currently apparent.
PEB 3
32
33
34
35
36
1980 1985 1990 1995 2000 2005Date
Hea
d, m
AH
D
Computed Observed
Figure 5. Observed versus predicted results for PS obs well PEB 3
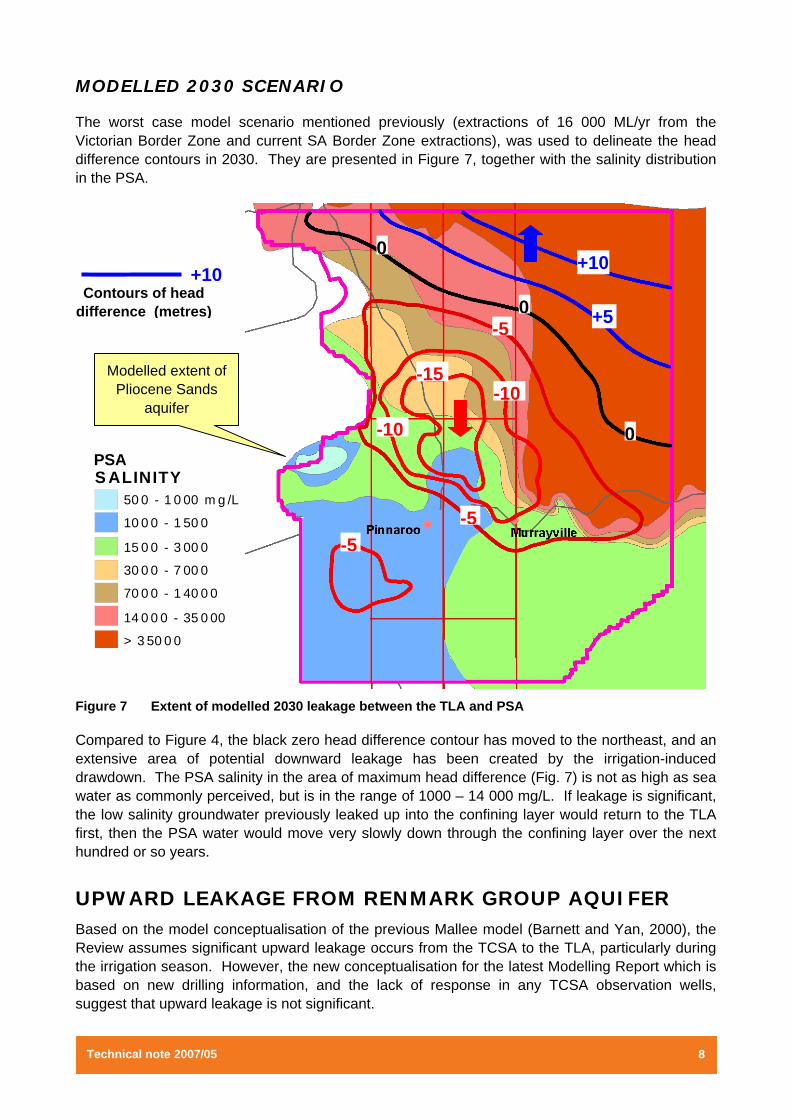
The worst case model scenario mentioned previously (extractions of 16 000 ML/yr from the Victorian Border Zone and current SA Border Zone extractions), was used to delineate the head difference contours in 2030. They are presented in Figure 7, together with the salinity distribution in the PSA.
Figure 7 Extent of modelled 2030 leakage between the TLA and PSA
Compared to Figure 4, the black zero head difference contour has moved to the northeast, and an extensive area of potential downward leakage has been created by the irrigation-induced drawdown. The PSA salinity in the area of maximum head difference (Fig. 7) is not as high as sea water as commonly perceived, but is in the range of 1000 – 14 000 mg/L. If leakage is significant, the low salinity groundwater previously leaked up into the confining layer would return to the TLA first, then the PSA water would move very slowly down through the confining layer over the next hundred or so years.
UPWARD LEAKAGE FROM RENMARK GROUP AQUIFER Based on the model conceptualisation of the previous Mallee model (Barnett and Yan, 2000), the Review assumes significant upward leakage occurs from the TCSA to the TLA, particularly during the irrigation season. However, the new conceptualisation for the latest Modelling Report which is based on new drilling information, and the lack of response in any TCSA observation wells, suggest that upward leakage is not significant.
S ALINITY50 0 - 1 0 00 m g /L
10 0 0 - 1 50 0
15 0 0 - 3 00 0
30 0 0 - 7 00 0
70 0 0 - 1 40 0 0
14 0 0 0 - 35 0 00
> 3 50 0 0
Modelled extent of Pliocene Sands
aquifer
+10 Contours of head
difference (metres)
PSA
0
0
0
-5
-10
-5
+5
+10
-5
-10
-15
Technical note 2007/05 9
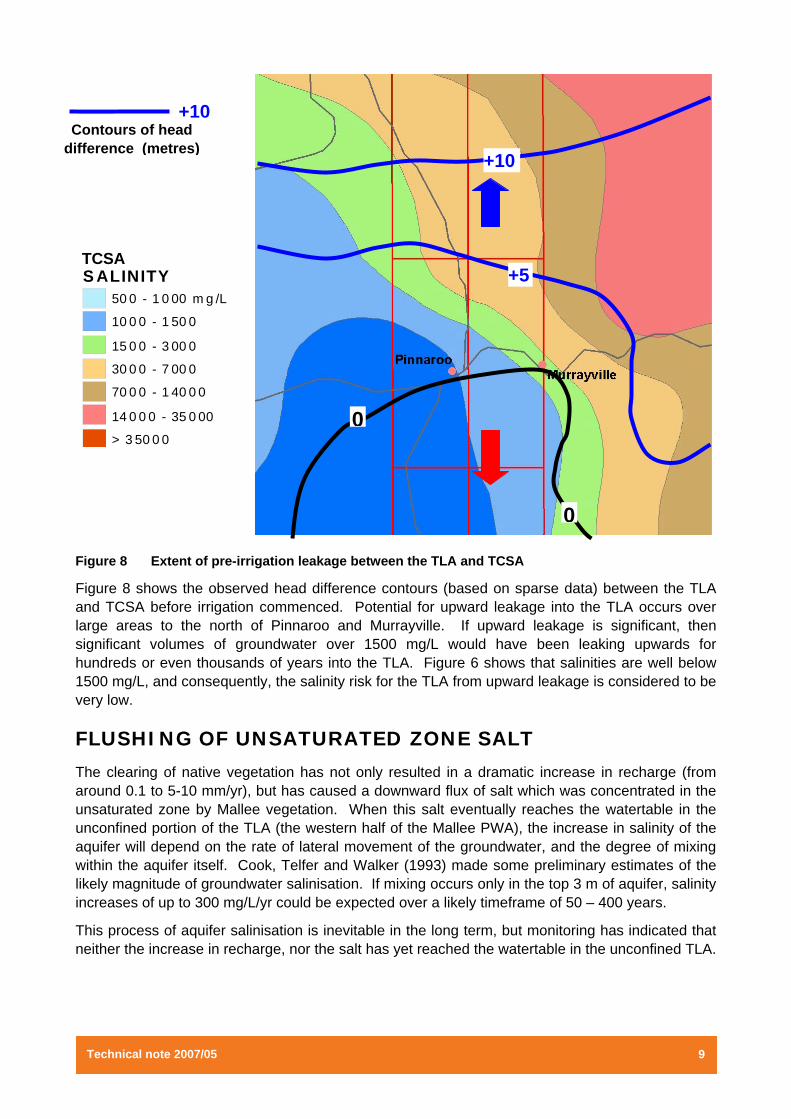
Figure 8 Extent of pre-irrigation leakage between the TLA and TCSA
Figure 8 shows the observed head difference contours (based on sparse data) between the TLA and TCSA before irrigation commenced. Potential for upward leakage into the TLA occurs over large areas to the north of Pinnaroo and Murrayville. If upward leakage is significant, then significant volumes of groundwater over 1500 mg/L would have been leaking upwards for hundreds or even thousands of years into the TLA. Figure 6 shows that salinities are well below 1500 mg/L, and consequently, the salinity risk for the TLA from upward leakage is considered to be very low.
FLUSHING OF UNSATURATED ZONE SALT
The clearing of native vegetation has not only resulted in a dramatic increase in recharge (from around 0.1 to 5-10 mm/yr), but has caused a downward flux of salt which was concentrated in the unsaturated zone by Mallee vegetation. When this salt eventually reaches the watertable in the unconfined portion of the TLA (the western half of the Mallee PWA), the increase in salinity of the aquifer will depend on the rate of lateral movement of the groundwater, and the degree of mixing within the aquifer itself. Cook, Telfer and Walker (1993) made some preliminary estimates of the likely magnitude of groundwater salinisation. If mixing occurs only in the top 3 m of aquifer, salinity increases of up to 300 mg/L/yr could be expected over a likely timeframe of 50 – 400 years.
This process of aquifer salinisation is inevitable in the long term, but monitoring has indicated that neither the increase in recharge, nor the salt has yet reached the watertable in the unconfined TLA.
+10 Contours of head
difference (metres)
S ALINITY50 0 - 1 0 00 m g /L
10 0 0 - 1 50 0
15 0 0 - 3 00 0
30 0 0 - 7 00 0
70 0 0 - 1 40 0 0
14 0 0 0 - 35 0 00
> 3 50 0 0
TCSA
0
0
+5
+10
Technical note 2007/05 10
DEPRESSURISATION
In the Mallee Region, the large seasonal drawdown fluctuations are a pressure response to pumping. In small areas, these fluctuations will gradually reduce until the water level stays permanently below the top of the TLA aquifer, which then becomes unconfined. Although the Victorian Technical Audit Panel listed depressurisation as a threat to the sustainability of the resource, the evidence suggests otherwise.
As a result of depressurisation, seasonal drawdowns will be much smaller because they will be caused by the slow groundwater flow through the aquifer material, rather than an instantaneous pressure response. Downward leakage fluxes will also be reduced by the creation of an unsaturated zone below the confining layer.
Figure 9 from the Modelling Report shows the estimated extent of the areas predicted to become unconfined during the modelling scenarios. Not surprisingly, they occur mostly in the centres of concentrated pumping. Depressurisation also occurs where the confining layer is very thin (1 – 2 m) to the south of Pinnaroo. There are no adverse consequences here because the overlying Pliocene Sands unit is very thin or dry.
Figure 9 Extent of depressurisation during modelling scenarios
Technical note 2007/05 11
SUMMARY The summary of the salinity risk analysis carried out in this Technical Note, and those from the Monitoring and Modelling Reports, are presented below.
SALINITY RISK
Current monitoring supports a conclusion from the Review that currently, “gross inter-aquifer leakage into the TLA from either the PSA or the TCSA, appears not to be demonstrable”. The risk of salinity increases due to lateral inflows is negligible from east of Murrayville, and low from north of Peebinga. All salinity risks are long term (decades to hundreds of years).
GROUNDWATER MONITORING
Generally, in areas where irrigation has been established for some time, drawdowns have reached an equilibrium and the extent of the cone of drawdown remains reasonably constant. Decreases in extraction in the Murrayville WSPA and Zone 11A have reduced drawdown in these areas by several metres, despite increases in extraction in Zone 10A in recent years. This indicates the main influence on drawdown in Victoria is local pumping, not extractions in SA.
Salinity trends are stable, or decreasing in some areas where drawdown is increasing the inflow of lower salinity groundwater from the south.
GROUNDWATER MODELLING
Water extractions in SA do not affect groundwater inflows into the Murrayville WSPA that occur from the south. Only groundwater that is not used in Victoria flows into SA. The modelled cross-border flow into SA during 2004/05 of 1525 ML/yr represents 0.0001 % of the volume of groundwater stored in the TLA aquifer in Zones 10B and 11B.
An increase in Victorian extractions to 16 000 ML/yr to match current SA extractions in the Border Zone, will increase drawdowns in Zone 10B by up to 10 m, and induce flow from SA to Victoria. The pressure level would also drop below the base of the Bookpurnong Beds confining layer in areas of maximum drawdown, leading to unconfined conditions in these areas (Fig. 6).
Over most of the model area, there were no significant salinity changes predicted due to downward leakage or flow reversal in all the modelled scenarios. However, in the area of maximum drawdown (and greatest potential for downward leakage), small increases of 40 mg/L (4 % of current salinity) were predicted after 25 years. This increase is smaller than the variation in observed values.
Because the saline groundwater in both the PSA and TLA is closer to the irrigation areas in Victoria than those in SA, the salinity risk for irrigation extraction is higher in Victoria relative to SA.
CONCLUSION
There is no evidence of adverse impacts on the groundwater resource at current extraction rates, and none is predicted in the medium term. Because of the robust nature of the aquifer and the very slow movement of groundwater, adaptive management based on comprehensive monitoring is appropriate, assisted by groundwater modelling.
Technical note 2007/05 12
REFERENCES
Barnett, S.R., 2006. Mallee PWA and Murrayville WSPA, Groundwater Monitoring Status Report - 2006. South Australia. Department of Water, Land and Biodiversity Conservation, DWLBC Report 2006/29.
Barnett, S.R. and Osei-bonsu, K., 2006. Mallee PWA – Murrayville WSPA Groundwater Model. South Australia. Department of Water, Land and Biodiversity Conservation. DWLBC Report 2006/27.
Barnett, S.R. and Yan, W., 2000. Mallee Region groundwater modelling - Report No.1. South Australia. Department of Primary Industries and Resources. Report Book, 2000/00004.
Cook, P.G., Telfer, A.L. and Walker, G.R., 1993. Potential for salinisation of the groundwater beneath mallee areas of the Murray Basin. Centre for Groundwater Studies. Report 42.
Leaney, F.W.J. and Herczeg, A.L., 1999. The origin of fresh groundwater in the SW Murray Basin and its potential for salinisation. CSIRO Division of Land and Water, Technical report, 7/99.
Nolan ITU, 2004. Murrayville WSPA Five Year Technical Review for Grampians Wimmera Mallee Water. Ref: 1102-04.