TECHNICAL NOTE 3153 6 VARIATION O F LOCAL LIQUID -WATER CONCENTRATION ABOUT AN ELLIPSOID OF FINENESS RATIO 5 MOVING IN A DROPLET FIELD By Robert G. Dorsch and Rinaldo J. Brun Lewis Flight Propulsion Laboratory C leveland, Ohio Washington July 1954 t https://ntrs.nasa.gov/search.jsp?R=19810068690 2020-04-29T18:25:58+00:00Z
Transcript
TECHNICAL NOTE 3153
6
VARIATION O F LOCAL LIQUID -WATER CONCENTRATION ABOUT AN
ELLIPSOID O F FINENESS RATIO 5 MOVING IN A
DROPLET FIELD
By Rober t G . Dorsch and Rinaldo J. Brun
Lewis Fl ight Propulsion Laboratory C leveland, Ohio
VARIATION OF LOCAL LIQUID-WATER CONCENTRATION ABOUT AN ELLIPSOID OF
FINENESS RATIO 5 MOVING I N A DROPWET FIELD
By Robert G. Dorsch and Rinaldo J. Brun
Trajectories of water droplets about an e l l ipso id of revolution with a fineness r a t i o of 5 (which often approximates the shape of an a i r c r a f t fuselage o r missile) were computed with the a id of a d i f f e ren t i a l ana- lyzer. Analyses of these t ra jec tor ies indicate t h a t the loca l concentra- t i on of l iqu id water a t various points about an e l l ipso id i n f l i g h t through a droplet f i e l d varies considerably and under some conditions may be several t i m e s the free-stream concentration. Curves of the loca l con- 4
I centration fac tor as a function of spa t i a l position were obtained and are 3 presented i n terms of dimensionless pavw.eters Reo (free-stream Reynolds
number) and These curves show tha t the loca l concentration factor a t 'any point is very sensit ive t o change i n the dimensionless'parameters Reo and K. These data indicate tha t the expected loca l concentration factors should be considered when choosing the location of, o r when determining an t i - icing heat requirements fo r , water- o r ice-sensitive devices tha t protrude into the stream from an a i r c r a f t fuselage or missile. concentrstion factor should be considered when choosing the location on an a i r c r a f t of instruments t h a t measure liquid-water content o r droplet- s i ze dis t r ibut ion in the atmosphere.
K ( i ne r t i a ) , which contain f l i g h t and atmospheric conditions.
Similarly, the
INTRODUCTION
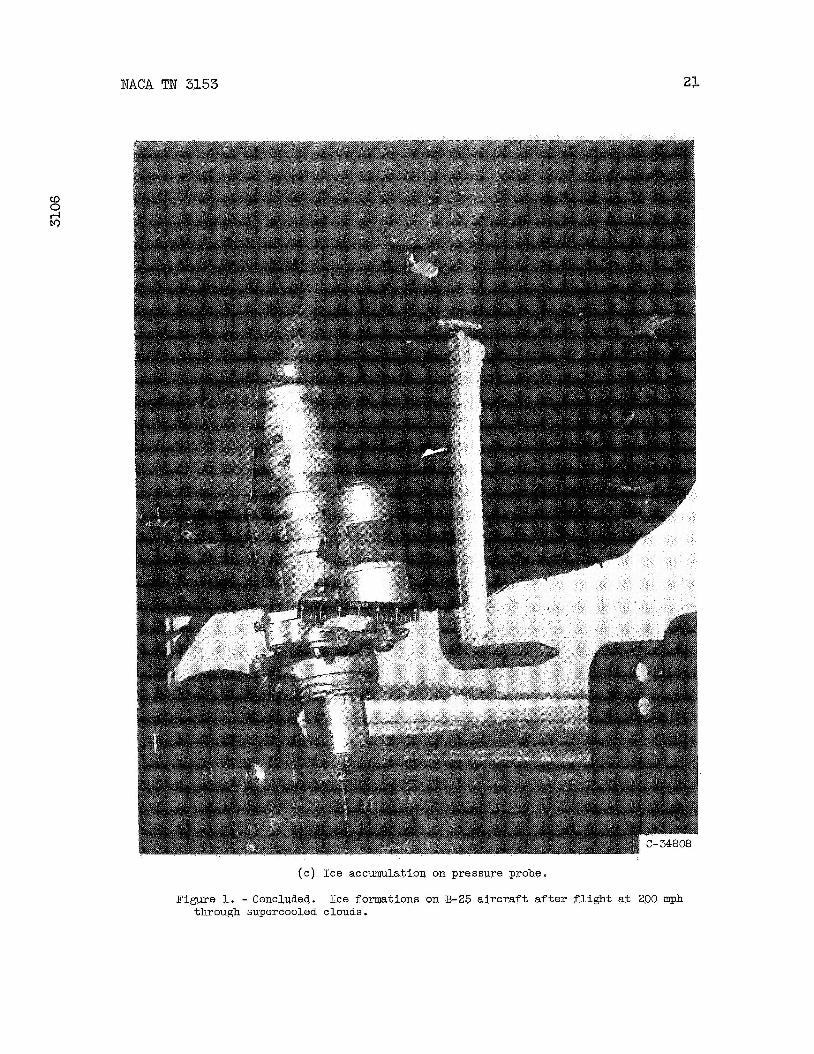
It is generally recognized that an a i r c r a f t moving through a cloud a l t e r s the concentration of cloud droplets i n the imedia te v ic in i ty of the a i r c ra f t . For example, the peculiar dis t r ibut ions of i c e often found on a i r c r a f t antenna support arms or on p i t o t s t a t i c tubes a f t e r f l i g h t through supercooled clouds are indications tha t the concentration of l i q - uid water i n the v ic in i ty of the fuselage is considerably al tered by the air flow about the fuselage. This e f fec t is i l l u s t r a t ed by the photo- graphs of f igure 1, which show ice formed on instrument support rods mounted on t h e s ide and bottom of the fuselage of a B-25 a i r c r a f t during
2 HACA TN 3153
f l i g h t through a supercooled cloud. As indicated by the ice formations of figure 1, there is frequently a region of reduced (or zero) droplet concentration next t o the a i r c r a f t surface, followed by a narrow region of great ly increased droplet concentration far ther out. region of high concentration, the droplet concentration gradually de- creases toward the free-stream value with increase in distance from the surface of the a i r c ra f t .
Beyond the narrow
A knowledge of t h i s s p a t i a l variation of loca l droplet concentration ro 0 Ec)
about an a i r c r a f t or missile during flight through clouds, drizzle, or rl r a i n is often important when choosing the location of devices which pro- trude into the stream o r when determining the heat required t o protect the devices from ice. (1) water- o r ice- sensit ive external accessories and a i r c r a f t instrument sensing elements, ( 2 ) intake ducts and vents, (3) antenna masts, (4) i ce detectors, and (5) instruments f o r measuring liquid-water content and droplet-size d is - t r ibut ion. In addition, a t places where a body of revolution joins an a i r f o i l (e.g., where a rocket pod is attached t o a wing), the loca l im- pingement of cloud droplets on the a i r f o i l , and therefore the heat re - quired for i ce protection, w i l l be a l te red by the e f fec t of the body of revolution on the loca l droplet concentr41ion. Similarly, droplet im- pingement on objects mounted on a wing w i l l be affected by the variation i n droplet concentration caused by the a i r flow about the wing.
Examples of such devices are:
As par t of an evaluation of the effect of the air-flow f i e l d on the droplet concentration about an a i r c ra f t o r missile i n f l ight through a droplet f i e ld , a study of the droplet concentration about a prolate e l - l ipso id of revolution of fineness r a t i o 5 was undertaken. An e l l ipso id of revolution was chosen because it is a good approximation of the shape of the fuselage of many a i r c r a f t and missiles. about the e l l i p so id of fineness r a t i o 5 i n axisyfnmetric, incompressible flow were calculated with the a i d of a d i f f e ren t i a l analyzer a t the NACA L e w i s laboratory. Droplet t ra jec tor ies were calculated as far back as the midpoint of the e l l ipso id and as f a r out in the r ad ia l direction as 1.6 times the semiminor axis . mine the re la t ion between the droplet concentration a t various points i n space and the following variables: e l l ipsoid length and velocity, droplet s ize , and f l i g h t a l t i tude and a i r temperature. ses a re summarized in t h i s report i n terms of the dimensionless parameters Reo and K, which contain these variables. Although the calculations
were made f o r incompressible flow, they should be applicable throughout the subsonic region because of the small’effect of compressibility on droplet t ra jec tor ies ( r e f . 1) and the high f l i g h t c r i t i c a l Mach number of the el l ipsoid.
Droplet t ra jec tor ies
These t ra jec tor ies were analyzed t o deter-
The r e su l t s of the analy-
NACA TN 3153
SYMBOLS
The following symbols are used in this report:
A
C
d
'med F
K
med
L
N
n
0 , rned
r,
rS
' 0
U
U
annular area perpendicular to major axis through which droplet
-12 2 d U/yL, dimensionless [the density of water, 1.94 slugs/cu ft, is included in the constant]
inertia parameter based on volume-median droplet diameter, dimens ionle s s
major axis of ellipsoid, ft
local droplet flux, number/( em2) (see)
local droplet -number density, number/cc
f ree-stream droplet -number ciensity, number/cc
free-stream Reynolds number with respect to droplet, 4.813~ l -O '~ dpaU/p, dimens ionles s
free-stream Reynolds number based on volume-median droplet diameter, dimensionless
cylindrical coordinates, ratio to major axis, dimensionless
ordinate of ellipsoid surface, ratio to major axis, dimensionless
starting ordinate at z = of droplet trajectory, ratio to major axis, dimensionless
free-stream velocity o r flight speed, mph
local air velocity, ratio to free-stream velocity, dimensionless
MACA TN 3153 4
'U ' V
V '
W
wi
wO
IJ.
pa
0
local a i r velocity, mph
local droplet velocity, r a t i o t o free-stream velocity, dimensionless
loca l droplet velocity, mph
local liquid-water content, g/cu m
indicated liquid-water content, g/cu m
free-stream liquid-water content, g/cu m
viscosi ty of air , slugs/( f t ) (see)
density of a i r , slugs/cu f t
difference between loca l a i r - and droplet-velocity components, dimens ionless
Subscripts :
av average of quantity over area A
r rad ia l component
z axia l component
0 free-stream conditions
METHOD OF COMPUTING DR0PI;ET TRAJECTORIES
The droplet t ra jec tor ies about the e l l ipso id of revolution of f ine- ness r a t i o 5 (20 percent thick) were calculated w i t h the a i d of a d i f fe r - e n t i a l analyzer i n the same manner as those of reference 2, except t ha t emphasis w a s placed on the behavior of the droplet t ra jec tor ies in the space around the e l l ipso id rather than on the impingement of droplets upon the e l l ipso id surface. a t as far as the midpoint of the e l l ipso id ( z = 0). culated i n the z , r plane f o r various values of the parameter 0.1 t o 90 and values of free-stream Reynolds nwber
The t ra jec tor ies were computed out t o r = 0.16 z I 0 ( f i g . 2 ) , and a l l nonimpinging t ra jec tor ies were computed back
Trajectories were cal- 1/K from
Reo from 0 t o 8192.
In order t ha t these dimensionless parameters have more physical sig- nificance i n the following discussions, some typical combinations of K and Reo a r e presented i n tab le I i n terms of the length and the velocity
NACA TN 3153 5
of the el l ipsoid, the droplet s i z e , and the f l i g h t ressure altitude and temperature. A typical s e t of t ra jec tor ies f o r 1& = 15 and Reg = 128 is shown i n f igure 3.
The incompressible, nonviscous air-flow f i e l d used in calculating the droplet t ra jec tor ies about the prolate e l l ipso id of revolution w a s obtained from the exact solution of the Laplace equation in prolate e l - l i p t i c coordinates given by Lamb (ref. 3). velocity components in the z,r plane from Iamb's potent ia l function are given in reference 2.
The de ta i l s of obtaining the
RESULTS OF TRAJECTORY COMl?~ATIOl!?S
A se r ies of droplet t ra jec tor ies about an e l l ipso id of revolution with a fineness r a t i o of 5 ( 2 0 percent thick) i n subsonic axisymmetric air flow w a s computed f o r various combinations of the dimensionless pa- rameters 1/K and Reo. (A procedure f o r rapid calculation of 1/K and
Reo From these t ra jec tor ies , the variation of droplet cacen t r a t ion [or f l u x density) with rad ia l distance from the el l ipsoid was determined a t three positions along the axis of the e l l ipso id .
from p rac t i ca l f l i g h t conditions is given i n ref. 4.)
Average Mass Flux Density of Water in Droplet Form
The average mass f lux of water i n droplet form per u n i t area through an annular area of space (of width r2 - rl, ( f ig . 2 ) ) perpendicular t o the major axis of the e l l ipso id is obtained from the l a w of conserva- t i on of matter. Consider the l iquid water in droplet form moving between two surfaces formed by ro ta t ing two neighboring t ra jec tor ies i n the r , z plane about the axis of the e l l ipso id a s shown in f igure 2. Then,
and
The subscript 0 r e fe r s t o conditions a t large distances ahead of the e l l ipso id (free-stream conditions) , and the subscript av re fers t o the average of a quantity over the annular area A. The annular area A is measured i n a plane perpendicular t o the major axis of the e l l ipso id
6 NACA TN 3153
(fig.. 2) e
area A o r a sector of the annular area A can be wri t ten as follows: From equation (2) the average f l u x density through an annular
a 0 rl
The constant 0.33 is a conversion fac tor f o r the units used. 2 2 K)
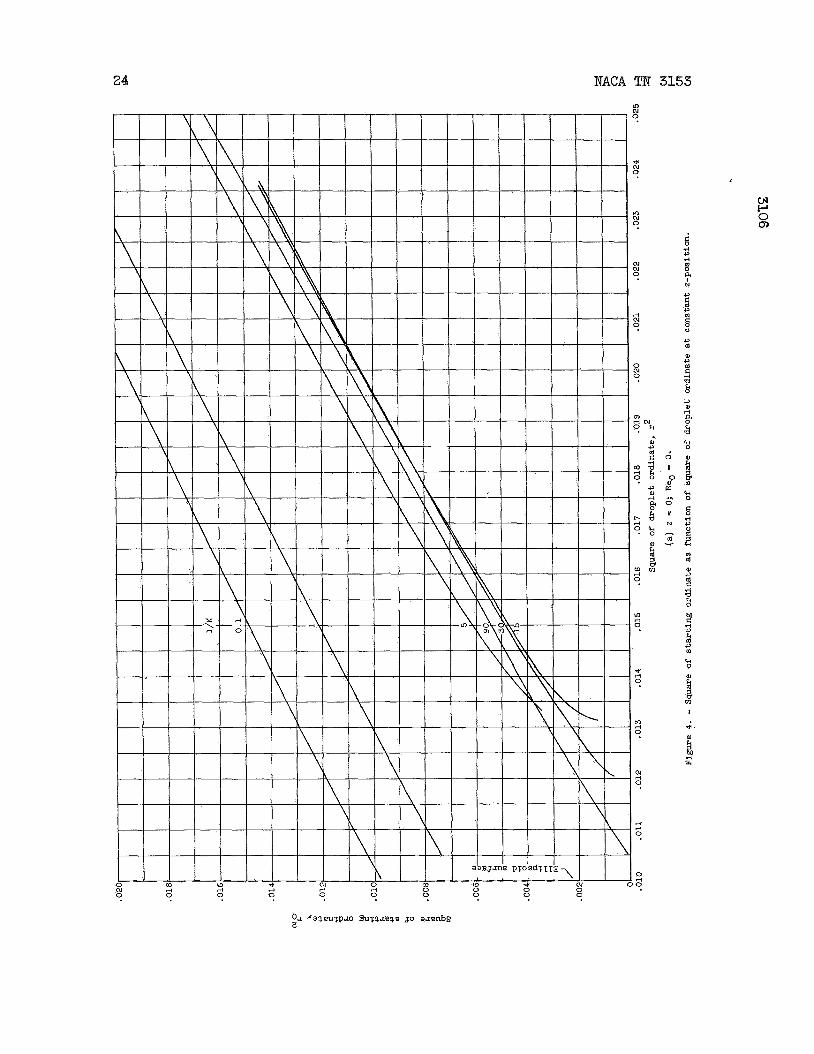
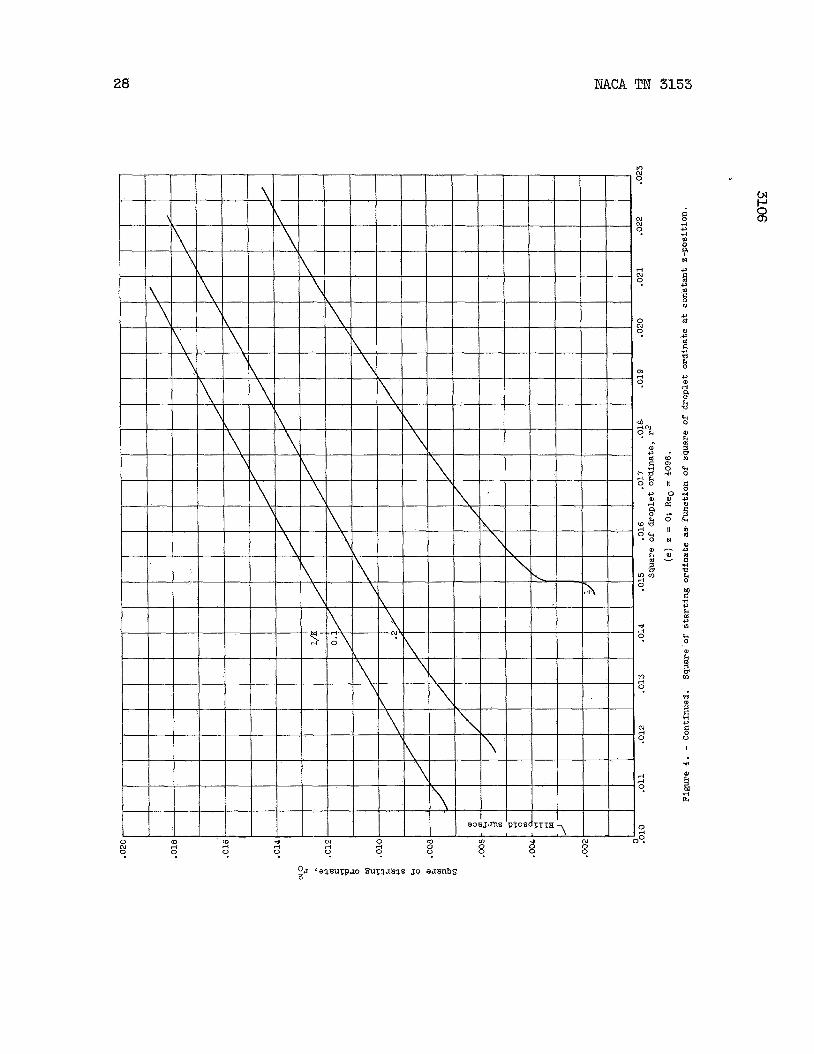
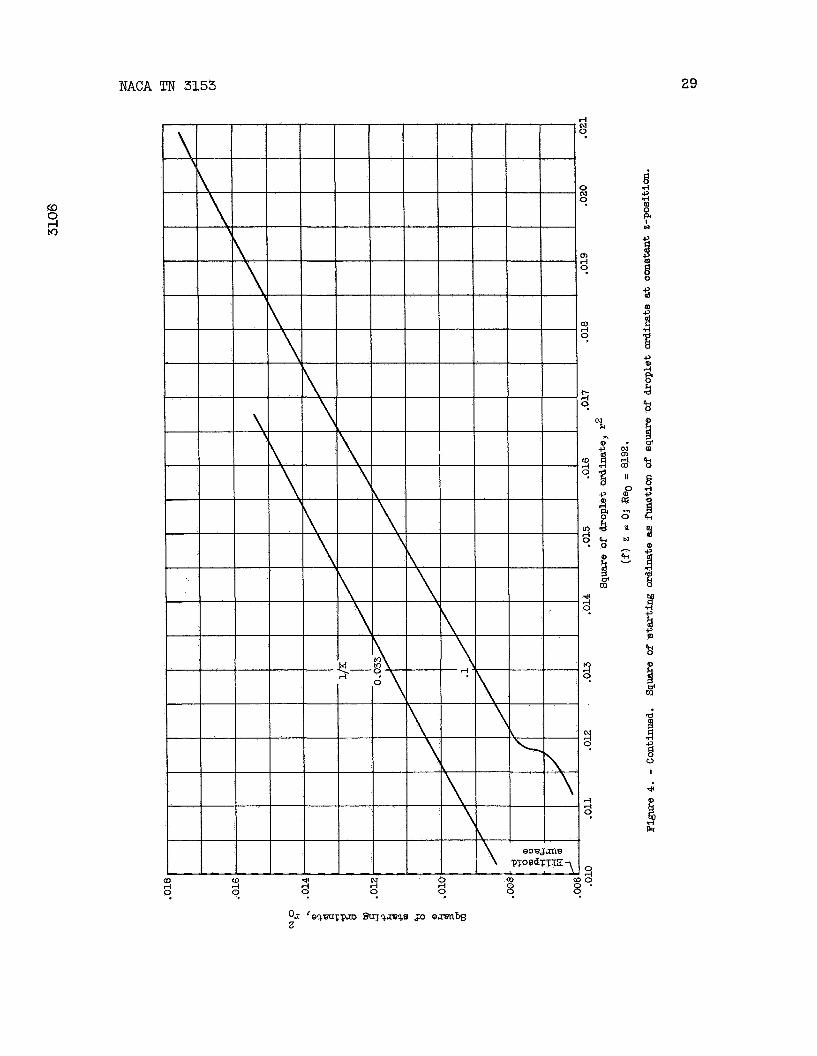
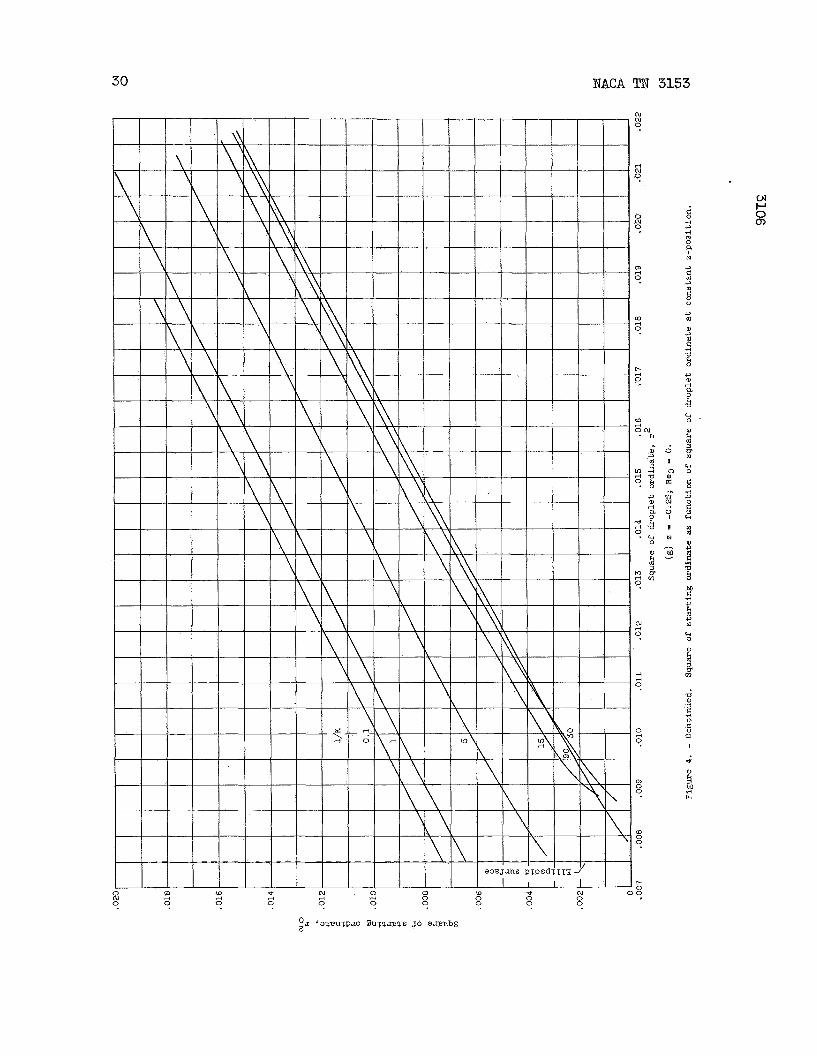
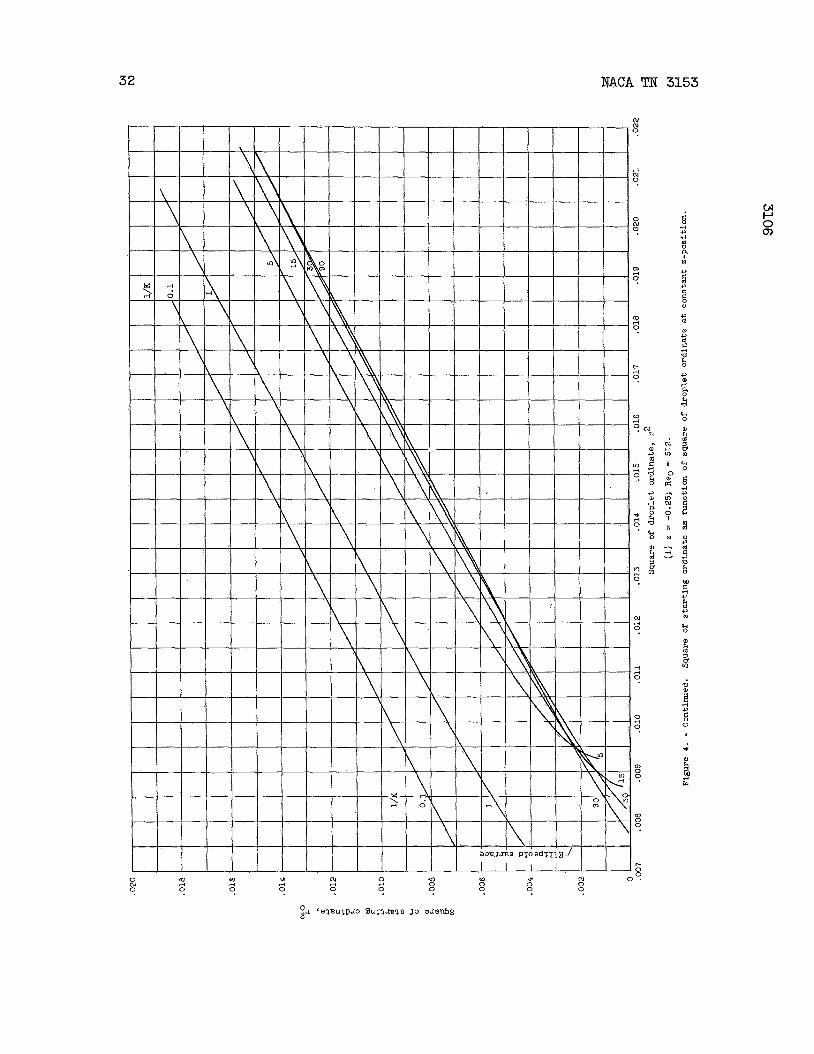
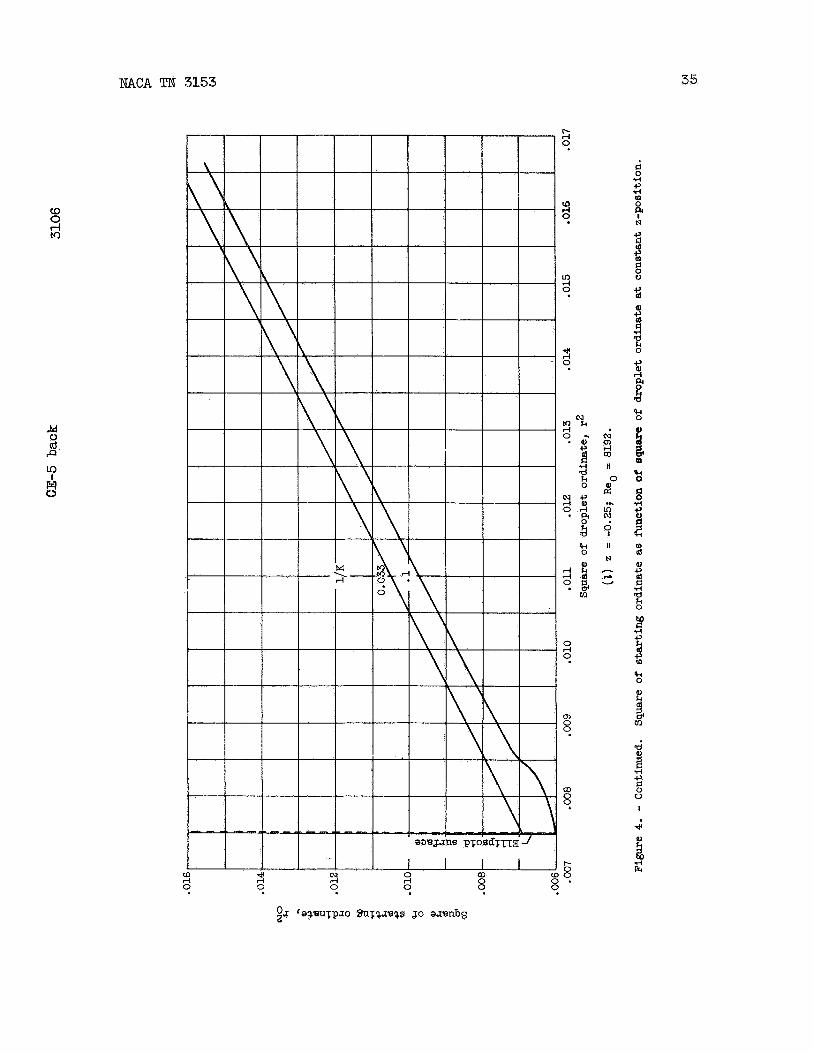
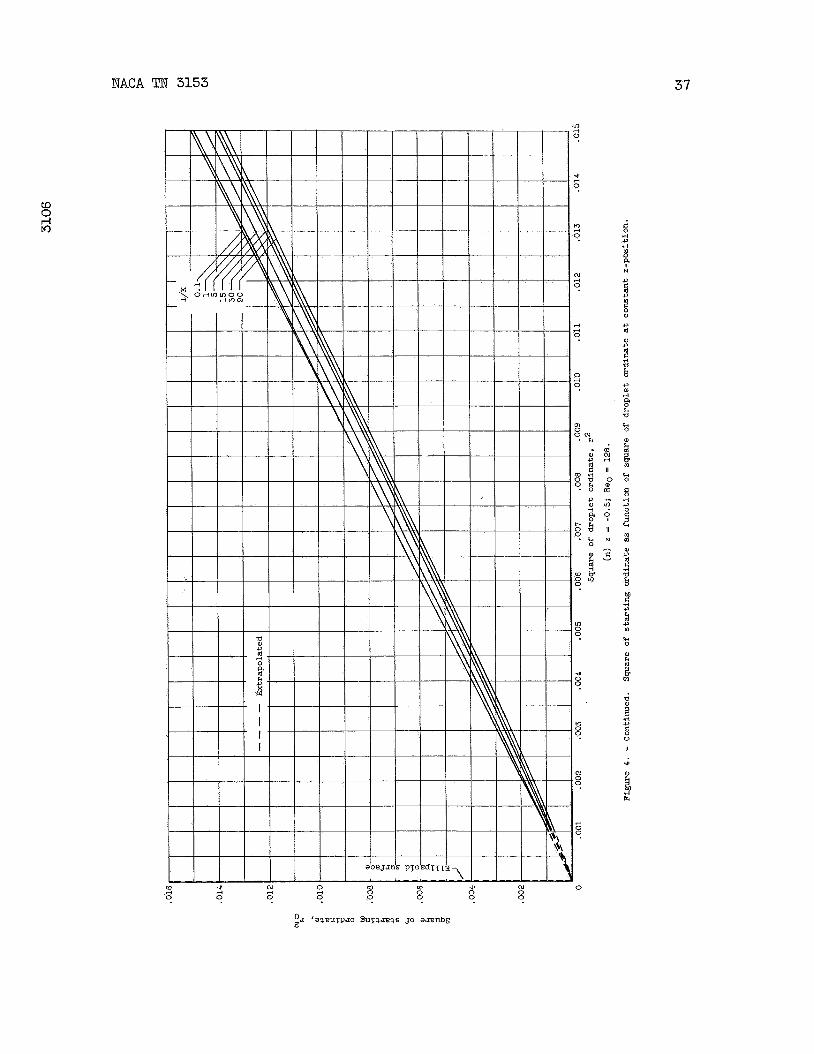
Curves of ro as a function of r f o r various values of Reo and 1/K a t constant z posit ions corresponding t o the midpoint region (z = 0) , a posi t ion 1/4 major axis length from the nose ( z = -0.25), and the nose region ( z = - 0 . 5 ) , which were obtained from the calculated droplet t ra jec tor ies , a re presented in figure 4.
Equation (3) and f igure 4 can be used, f o r example, to determine the average m a s s f l u x density of water in droplet form passing through a sec- t o r of an annular area A such as the entrance area of a s m a l l thin- lipped in l e t (with i n l e t velocity r a t i o y w l t o 1) attached t o the e l - l ipso id moving a t velocity U content of WO.
through a droplet f i e l d with a liquid-water
Local Liquid-Water Flux Density
The l o c a l mass flux of w a t e r i n droplet form per uni t area perpen- dicular t d , t h e major axis a t a point i n the v ic in i ty of the moving e l l i p s - oid can be obtained from equation ( 3 ) by l e t t i n g A ( r 2 ) approach zero. Then
F = 0.33woUC, lb/(hr)(sq f t ) (4)
where
The loca l concentration fac tor C a t a point in space is obtained from
the slope of the curves of r2 as a function of r ( f i g . 4) a t the
point of i n t e re s t fo r the Reo and K combination being considered.
2 0
The concentration fac tor a s a function of r f o r selected values of Reo and K a t z =z 0, z = -0.25, and z = -0.5 is given i n
NACA TN 3153 7
figure 5. approaches 1 (free-stream value) a t large values of r f o r a l l z posi- t ions. A t z = -0.50, the concentration factor decreases t o values l e s s than 1 for s m a l l values of r . A t the z = -0.25 and z = 0 positions, the concentration factor increases from values near 1 a t large values of r t o peak values a t small values of r. In addition, fo r most values of Reo and K a t the z = -0.25 and z = 0 positions, there is a region of zero concentration between the surface of the e l l ipso id and the peak
obtaining values of local concentration factor greater than 4, the average value of c over an r in te rva l of 0.001 or 0.002 uni t s (as indicated by a bracket i n the f igure) is given instead of the peak value whenever the peak value is greater than 4.
Examination of f igure 5 shows tha t the concentration fac tor
w value of the concentration fac tor . Because of re la t ive ly low accuracy i n P 0 m
In order t o determine C f o r various values of Reo and 1/K not given in f igure 5, it is necessary to interpolate or extrapolate the data. The peculiar variation of C with Reo and 1/K makes t h i s interpolation or extrapolation d i f f i c u l t . Therefore, as an a id i n interpolation and extrapolation, the peak value of C of figure 5 for the z = 0 and z = -0.25 positions is plot ted as a fu--,lion of 1 /K fo r constant Reg in figure 6. Although peak values of C greater than 4 were not pre- sented in f igure 5 because of t h e i r re la t ive inaccuracy, they are used i n figure 6 i n order t o f a c i l i t a t e interpolation and extrapolation. t ion, the r posit ion of the peak value of C a t z = 0 and z = -0.25 is plotted as a function of 1/K fo r constant Reo i n figure 7 . With
the use of f igures 6 and 7, the peak value of C and its r posit ion can be determined fo r the value of Reo and 1/K of in te res t . With the position and value of the peak obtained by t h i s method, the remaining portion of the curve of C as a function of r can be obtained by using the shape of the curve corresponding t o the nearest values of
L/K as a guide.
In addi-
Reo and
The loca l liquid-water content i n grams per cubic meter can be ob- tained a t any point in space by dividing the droplet f l u x by the z- component of the loca l droplet velocity a t t ha t point:
Inasmuch as the z-component of the loca l droplet velocity a t a given point in the v ic in i ty of a body of revolution is not readi ly determinable, it is usually necessary t o estimate it from the local a i r velocity. The difference between the dimensionless loca l air- and droplet-velocity com- ponents as a function of r ad ia l distance r a t the z = 0 posit ion of
8 NACA TN 3153
the e l l ipso id is shown in f igure 8. t h a t the dimensionless l oca l air- and droplet-velocity components about an e l l ipso id of fineness r a t i o 5 are often very nearly equal a t the z = 0 posit ion. Examination of the air-flow f i e l d about the e l l ipso id (ref a 2 ) and f igure 8 shows t h a t a t z = 0 the r a t i o U/vk is usually nearly equal t o 1 (within 6 percent).
Examination of t h i s f igure shows
Local Droplet-Nuttiber Flux Density
By reasoning s i m i l a r t o t h a t of the preceding section, the loca l droplet-number flux density a t a point i n the v ic in i ty of the e l l ipso id moving through a droplet f i e ld can be wri t ten in the form
N = 44. 7noUC, number/( cm2) (sec) ( 6 )
The constant 44.7 i s a conversion fac tor f o r the units used. The concentration fac tor C is obtained from figure 5.
If, instead of the droplet-number i i w density, the instantaneous number of droplets per cubic centimeter a t a point i n space i n the vic-b- i t y of the e l l i p so id i s desired, then the loca l f lux density a t the point must be divided by the z-component of the loca l droplet velocity a t the point. That is,
n0U n = - C, number/cc V'
Z
(7)
Again, since the z-component of the loca l droplet velocity i s usually unknown, it must be estimated from the loca l a i r velocity a t t ha t point, as discussed in the preceding section.
Shadow Zone
The region of zero concentration adjacent to the surface of the e l - l ipsoid, which is evident i n figure 5, w i l l be called the shadow zone. This region is protected from droplet penetration by the air-flow char- ac t e r i s t i c s ahead of and in the v ic in i ty of the forward positions of the el l ipsoid. The thickness (r - rs) of the shadow zone a t each z posit ion of the body fo r various Reo and K values is given i n f igure 9 . Gen- eral ly , the thickness of the shadow zone increases as z approaches 0. The shadow-zone thickness is 0 a t the nose f o r all values of and K shown in figure 9 and becomes of f i n i t e thickness a t a z posit ion t h a t depends on Reo and K.
Reo
NACA TN 3153 9
Local Concentration in Clouds w i t h Nonuniform Droplet Size
The data presented i n figures 4 t o 9 apply d i r ec t ly only t o flights i n clouds, ra in , or dr izzle composed of droplets that a re a l l uniform i n s ize . however, be of mixed s izes . Therefore, if the free-stream droplet-size dis t r ibut ion is known or can be estimated, the dsta must be accordingly modified (or weighted) before the local f lux density of l iquid w a t e r a t a point i n the v i c in i ty of the e l l ipso id can be found.
The droplets encountered in the atmosphere a t any instant may,
For nonuniform droplets, the loca l flux density can be determined from equations (4) or (6) by using the weighted value of the concentration factor C t h a t corresponds t o the droplet-size dis t r ibut ion present in the cloud. The weighted value of C can be obtained by p lo t t ing C f o r each droplet s i ze i n the dis t r ibut ion (based on values of 1/K and Reo corresponding t o each droplet diam.) as a function of the cumulative volume ( i n percent) of water corresponding t o each droplet s ize and in- tegrating the resul tant curve. The de ta i l s of t h i s method of weighting a re given i n reference 2.
The e f f ec t of droplet-size distri'-Aion on the concentration fac tor is i l l u s t r a t ed i n figure 10. In t h i s f igure, the var ia t ion with r of the concentration factor about the el l ipsoid, at the z = 0 posit ion f o r flight through clouds w i t h a Langmuir "C" droplet-size dis t r ibut ion ( r e f . 5, reproduced in tab le I1 herein), is compared with that f o r f l i g h t through clouds w i t h uniform droplets having a diameter equal t o the volume- median diameter of the "C" dist r ibut ion i n each of' four cases.
As the droplet-size dis t r ibut ion becomes broader, the peak value of
r) concentration fac- the concentration factor considerably decreases and the former shadow zone becomes an area with a small [but increasing w i t h t o r , rather than one w i t h zero concentration factor .
DISCUSSION OF RESULTS
The var ia t ion of loca l concentration factor w i t h spa t i a l posi t ion and Reo and l / K presented in figure 5 indicates that the droplet con- centration i n the v i c in i ty of the e l l ipso id d i f fe rs considerably from the free-stream concentration. Under some circumstances, the local droplet f l ux per u n i t area may vary from 0 t o many times the free-stream value within a short distance. As shown i n figure 10, this e f fec t is greater fo r droplets of uniform size €han fo r clouds w i t h a dis t r ibut ion of drop- l e t sizes, because of the p a r t i a l "averaging out" of maximum and minimum regions f o r droplets of varying s izes . In addition, the concentration fac tor is very sensit ive t o small changes i n 1/K and Reo, as ca.n be
10 NACA TN 3153
seen from f igure 5. This sens i t iv i ty t o 1/K and Reo is brought out
more clear ly in the variation of peak value of concentration factor with 1/K and Reo presented i n f igure 6. Figure 6 shows tha t a t z = -0.25 and z = 0, there is a narrow region of 1/K f o r each Reo in which the peak value of concentration fac tor is large. For values of 1/K larger o r smaller than those in the narrow-peak region, the peak value of the concentration fac tor decreases rapidly.
The var ia t ion of concentration of liquid-water content with z and r position, droplet-size distribution, and l/Kmea and Reo,med in-
dicates t ha t care should be exercised i n locating instrument sensing ele- ments and small in l e t s o r vents that protrude f romthe surface and are sensi t ive t o impinging water o r ice formation. If possible, they should be located where a minimum concentration fac tor ex is t s . When it is nec- essary t o provide ice protection for these protuberances, consideration should be given t o the concentration fac tors expected. In some cases, par t of the device may accumulate ice a t a r a t e which would be several times tha t expected from the free-stream liquid-water content.
When estimating the e f fec t of a body of revolution on droplet f l ux in i t s v i c in i ty from the data calculated from the el l ipsoid, the degree of aerodynamic and physical s imi la r i ty m u s t be considered. The slope of the surface a t the z posit ion of in te res t , the bluntness of the nose, and sudden changes i n slope, such as those due t o windshields, a re par- t i cu l a r ly important.
Comparison with Observed Icing Deposits
Qualitative observations of ice formations on a i r c r a f t p i t o t tubes, antenna support a r m s , and other shaft-l ike protuberances in to the a i r stream bear out the shape of the curves shown i n figure 10. Inasmuch.as the concentration factor determines the shape of the ice formation on a rod of small diameter (greater than 90-percent collection efficiency) , these curves give d i rec t ly the shape of the expected ice formation on such a rod located a t the indicated positions. The thickness of the ice for - mation would depend, of course, on the velocity, liquid-water content, and time of exposure. of Reo,med, l/qea, and z position comparable t o those exis t ing when the support rods shown in f igure 1 were iced. A comparison of the curve of figure lO(c) with the shape of the ice on the support rods shows tha t there is good qual i ta t ive agreement between the calculated concentration of l iquid water and tha t indicated by an ac tua l ice formation.
The curve of f igure 10(c) was calculated f o r values
NACA TN 3153 11
M 0 cd f2
N Q
Effect of Local Concentration Factor on Liquid-Water-Content and
Droplet-Size-Distribution Measurements
Most atmospheric liquid-water-content and droplet-size-distribution measurements have been made from a i r c r a f t i n f l i gh t . For mechanical rea- sons, the measurements have frequently been made rather close t o the fuse- lage. For t h i s reason, measurements of liquid-water content and droplet- s i ze dis t r ibut ion are affected by the loca l concentration fac tor a t the point of measurement and may not indicate the desired free-stream values.
Liquid-water-content measuring instruments with high collection efficiency. - For liquid-water measuring devices with high collection or sampling eff ic iency (over 95 percent f o r most conditions), which essen- t i a l l y measure local f l u x density direct ly , the indicated liquid-water content obtained by using the free-stream velocity w i l l be high or low i n proportion t o the weighted concentration fac tor , as can be seen from the following re la t ion :
w i = F/0.33U = woC, g/cu m ( 8 )
If the z-component of the local air velocity
of the free-stream velocity in the calculation of liquid-water content, then,
uk is used instead
Equations s i m i l a r i n form t o equation (8) a re often used fo r liquid-water- content calculations, because frequently the only veloci ty known is the airspeed of the a i r c ra f t .
Examples of instruments of t h i s type a re the orifice-type icing-rate meters ( r e f s . 6 and 7 ) , the heated-wire liquid-water-content meter ( r e f . 8 ) , and cloud-droplet cameras ( r e f s . 9 and 10). rangement of these instruments is often such that t he problem of instru- ment location on an a i r c r a f t is par t icular ly important. The point of measurement of these instruments may be as close as 6 t o 1 2 inches from the fuselage. Fortunately, many of the measurements of liquid-water con- t e n t tha t have been taken with instruments of t h i s type have been made from a i r c r a f t of the order of 100 f e e t long a t veloci t ies of t he order of 300 mph. These conditions, along with cloud droplets of the order of 20 microns in diameter, give Reo of 128.7 and 1/K of 165.6 a t a pressure a l t i t ude of 15,000 f ee t and an a i r temperature of 1' F. Examination of figure 5 a t the posit ion (which is comparable t o the position on an a i r c r a f t fuselage a t which the slope of the surface becomes 0) indi- cates tha t , if a l l the droplets are 20 microns, the concentration fac tor
The physical a r -
z = 0
1 2 NACA TH 3153
is 1.26 a t 6 inches from the surface of the e l l ipso id (r = 0.105) and 1.17 a t 1 2 inches from the surface (r = O-ll)* droplet s izes is present with a volume-median droplet s i ze of 20 microns, then the var ia t ion of loca l concentration with r f o r the e l l ipso id would be as given i n f igure lO(d> , which shows tha t the weighted concentration fac tor a t 6 inches f romthe surface is 1.26 and a t 1 2 inches is 1.14. Thus, if a n icing-rate meter w e r e mounted a t the z = 0 posit ion on a 100-foot-long e l l ipso id of fineness r a t i o 5 , it would measure a l iquid- water content of the order of 26 percent high a t 6 inches and 14 t o 1 7 percent high a t 12 inches. In addition, inasmuch as these calculations a re based on axisymmetric flow, any yawing motion of t he e l l ipso id i n f l i g h t w i l l introduce a time-dependent var ia t ion of the l o c a l concentra- t i o n factor t h a t would be d i f f i c u l t t o calculate. While the e f fec t on the concentration factor i n the preceding example w a s modest (of the or- der of 15 t o 30 percent), the picture is a l te red considerably if , f o r the preceding example, the droplet s ize is 60 instead of 20 microns and the droplet-size dis t r ibut ion is uniform. Then, Reo = 386.1 and 1/K = 18.4, and the concentration fac tor a t the z = 0 posit ion and 6 inches from the surface is 0, ax3 a t 1 2 inches from the surface it is about 2.8. Thus, a t the 6-inch posit ion the indicated water content f o r these conditions is 0, and a t the 12-inch posit ion it is 280 percent too high. If, in- stead of uniform droplets, a ''C" dist r ibut ion (table 11) of droplets with a volume-median s i ze of 60 microns is present, , then the concentration fac tor a t the z = 0 posit ion at distances of 6 and 1 2 inches f romthe surface is 0.24 and 1.3, respectively. These examples i l l u s t r a t e t he sens i t iv i ty of the concentration factor near the e l l ipso id surface t o changes i n the physical environment and the importance of avoiding taking measurements of liquid-water content in a comparable region in the vi- c i n i t y of an a i r c r a f t , as the correction of the indicated water content t o free-stream content would be very involved.
If a 'IC" d i s t r ibu t ion of
Rotating multicylinders. - If the liquid-water-content measuring de- vice has a low collection efficiency (which varies with drop s ize and f l i g h t condition), or depends on a difference in collection-efficiency among its component par ts , or both, a s do rotat ing multicylinders (refs. 11 and 1 2 ) , the s i tuat ion is more complicated, because the indicated water content w i l l not necessarily vary d i rec t ly with the weighted concentration factor a t the point of measurement. droplet f lux intercepted by each cylinder depends on i t s collection e f f i - ciency. The collection efficiency i n turn depends on the droplet veloc- i t y , which i s one of the two quantit ies making up f l u x density (eq. ( 2 ) ) . In addition, reference 13 shows tha t a var ia t ion i n droplet concentration over a s e t of rotat ing cylinders introduces a f a l se re la t ion between cyl- inder diameter and re la t ive collection efficiency and thereby af fec ts the droplet-size-distribution and the liquid-water-content measurement. addition, there i s the effect of the change i n local droplet-size d i s t r i - bution (which is discussed i n the following section) on the measurements
This is t rue because the amount of
In
1'JACA TN 3153 13
of liquid-water content by the cylinders. Because rotating-multicylinder measurements of liquid-water content and droplet-s ize d is t r ibu t ion are interrelated, a change i n loca l droplet-size dis t r ibut ion w i l l a l so a l t e r the indicated liquid-water content a t the point of i n t e re s t . These com- pl icat ing factors make the evaluation of liquid-water-content data taken with rotat ing cylinders very d i f f i c u l t if the cylinders are located close t o the a i r c r a f t fuselage.
Fortunately, most liquid-water-content data taken with rotat ing multicylinders a re not too much i n error from these fac tors , because the cylinders are , i n practice, generally located far enough from the fuse- lage so that approximately free-stream conditiorrs prevai l , the average concentration fac tor a t the posit ion of measurement gives a f a i r indication of the degree of error i n measuring liquid-water content. In typical ins ta l la t ions ( r e f . ll), the lowest cylinder is about 16 inches from the a i r c r a f t surface and the top cylinder is about 34 inches from the surface. With the assumed 100-foot e l l ipso id moving a t 300 mph a t 15,000 f e e t with an air temperature of 1' F and a "C" dist r ibut ion with a 20-micron volume-median droplet diameter, the variation of concentration fac tor is given in figure l O ( d ) a (about 10 percent high), and a t 34 inck. high). percent too high. in references 14 and 15 may have a somewhat smaller e r ro r due t o t h i s effect than indicated by t h i s example, because many of the measurements were obtained by using the loca l airspeed rather than the free-stream velocity f o r calculating the t o t a l catch of each cylinder. However, in sp i t e of the re la t ive ly good location of rotat ing multicylinders, ob- servers have reported occasional cases where the lower cylinder caught excessively large o r small amounts of ice . This w a s par t icu lar ly t rue if the aipcraf t had a tendency t o yaw during the measurenlents and thus a l t e r the position of the shadow and peak-concentration zones.
Therefore,
A t 16 inches from the surface C = 1.095 C = 1.04 (about 4 percent
Thus the liquid-water-content measurements would be l e s s than 10 Actually, the values of liquid-water content summarized
Droplet-size-distribution measurements. - Because the loca l concen- t r a t ion fac tor is dependent on droplet s ize , the loca l droplet-size dis- t r ibut ion varies i n the v i c in i ty of a body of revolution. example, that the droplet-size dis t r ibut ion of a cloud is given by
Suppose, f o r
n o = n l + n 2 + n 3 + . . * = droplets/cc
where n = number of droplets in the jth s ize group. Then, since each
droplet-size group w i l l have a different concentration fac tor a t a point i n the v ic in i ty of the body of revolution, there resu l t s from equation (7) (assuming U/vi nearly equal t o 1, as it usually is at the z = 0 and z = -0.25 posit ions)
j
14 NACA TM 3153
or
n =E njCj, droplets/cc j
Thus, both the loca l nmiber of droplets per cubic centimeter and the droplet-size d is t r ibu t ion w i l l be different from the free-stream values. When U/va equation (10) has the form
i s not nearly equal t o 1 (e .g., near the nose region) , then
n = u njCj/v;,j J
Equations (10) and (11) clear ly indicate that care should be exer- cised in the choice of location of droplet-size-distribution measuring instruments, such as a cloud-droplet camera, i n order t o avoid regions i n which e i the r the concentration fac tor or the r a t i o U/v; grea t ly from 1.
d i f f e r s
CONCLUDING REMARKS
The data of t h i s report a re applicable i n ' a quantitative manner only t o e l l ipsoids of revolution w i t h a fineness r a t i o of 5. approximately i n the v i c in i ty of the nose section of a body of revolution t h a t can be physically matched with the nose section of a fineness-ratio- 5 e l l ipso id of a given length. Because many bodies of revolution of in- terest are d i f fe ren t i n shape from an el l ipsoid, the data of t h i s report a r e primarily useful i n pointing out i n a qual i ta t ive manner the type of variation in liquid-water concentration tha t might be kxpected in the v i c in i ty of a body of revolution i n f l i g h t through a droplet f i e l d . The analysis indicates that, f o r some combinations of the dimensionless pa- rameters Reo and K, the value of the loca l concentration of l i qu id
w a t e r may vary from 0 t o several times the free-stream value, depending on the location of the point being considered. show tha t the magnitude of the concentration factor a t any point is very sensi t ive t o change i n the parameters Reo and K.
They a l so apply
Further, the calculations
L e w i s Fl ight Propulsion Laboratory National Advisory Committee f o r Aeronautics
Cleveland, Ohio, April 26, 1954
NACA TN 3153
FUZFERENCES
15
I, Brun, Rinaldo J., Serafini, John S., and Gallagher, Helen Me: Im- pingement of Cloud Droplets on Aerodynamic Bodies as Affected by Compressibility of A i r Flow Around the Body. NACA TN 2903, 1953.
2. Dorsch, Robert G., Brun , Rinaldo, J., and Gregg, John L.: Impingement of Water Droplets on an Ellipsoid with Fineness Ratio 5 i n A x i - symmetric Flow. NACA I I IY 3099, 1954. 5
3. Lamb, Horace: Hydrodynamics. F i r s t Am. ed., Dover Pub., 1945. z 4. Brun, Rinaldo J., Gallagher, Helen M., and Vogt, Dorthea E. : Im-
pingement of Water Droplets on NACA 651-208 and 6E1~-212 Airfoi ls a t 4' Angle of Attack. NACA TN 2952, 1953.
5. Langmuir, Irving, and Blodgett, Katherine B.: A Mathematical Inves- t iga t ion of Water Droplet Trajectories. Tech. Rep. No. 5418, A i r Materiel Command, AAF, Feb. 19, 1946. (Contract No. W-33-038-a~- 9151 with General Electr ic Co.)
B
6. Fraser, D.: Orifice-Type Ice Detector: Preliminary Icing Tunnel Tests of Functioning as Ice Detector, Rate-of-Icing Meter, and Icing- Severity Meter. (Canada), Ju ly 1951.
Lab. Rep. LR-3, N a t . Aero. Establishment, O t t a w a
7 . Perkins, Porter J., McCullough, Stuart , and L e w i s , Ralph D.: A Sim- p l i f i ed Instrument f o r Recording and Indicating Frequency and lh- t ens i ty of Icing Conditions Encountered i n Flight. 1951.
NACA RM E51E16,
8. Neel, Carr B. , Jr., and Steinmetz, Charles P.: The Calculated and Measured Performance Characterist ics of a Heated-Wire Liquid-Water- Content Meter for Measuring Icing Severity. NACA TN 2615, 1952.
9 . McCullough, Stuart , and Perkins, Porter J.: Flight Camera for Photo- graphing Cloud Droplets i n Natural Suspension i n the Atmosphere. NACA RM ESOKOla, 1951.
10. P e t t i t , K. G . : Nephelometric Instnunentation f o r Aircraft Icing Research. Aug. 1950.
Rep. No. MD-33, National R e s . Council of Canada ( O t t a w a ) ,
11. Lewis, W i l l i a m , Perkins, Porter J., and Brun, Rinaldo J.: Procedure fo r Measuring Liquid-Water Content and Droplet Sizes i n Super- cooled Clouds by Rotating Multicylinder Method. 1953.
NACA RM E53D23,
16
1 2 . Brun, Rinaldo J., and Mergler, Rarry We: Impingement of Water Drop- lets on a Cylinder i n an Incompressible Flow Fie ld and Evaluation of Rotating Multicylinder Method f o r Distribution, Volume-Median Droplet Size, and Liquid-Water Content in Clouds. NACA TN 2904, 1953.
asurement of Droplet-Size
13. L e w i s , W i l l i a m , Kline, D w i g h t B., and Steinmetz, Charles P.: A M - ther Investigation of the Meteorological Conditions Conducive t o Aircraft Icing. NACA TN 1424, 1947
3 14. Lewis, W i l l i a m , and Bergrun, Norman R.: A Probabili ty Analysis of M
the Meteorological Factors Conducive t o Aircraft Icing i n the United States . NACA TN 2738, 1952.
15. Hacker , Paul T., and Dorsch, Robert G. : A Swmnary of Meteorological Conditions Associated with Aircraft Icing and a Proposed Method of Selecting Design Criterions fo r Ice-Protection Equipment. NACA TN 2569, 1951.
NACA TN 3153 117
I -
3 m . . 1)M nr- + * - 3 0 Y ) r l M d acu 3 0 0 0
0 . . - 0 0
d * 9 9 m m
-
Y? mr- W m r ld
- r-n MI- oc o c o c 0 . ,
- r-r aoa NCI dr
-
rlr
r l K r-r r l U
-
w a m a * T
m r o c o c 0
- * 7
W U r-i- rlr - o c o c d N -
0 cu -
- n n m d m O r (
3 r l . .
0 m 0 m m r -
O* In d
"1:
* m m m r l a
cu
m m m
?N?
m ?ol 3m i r -
__
3 W O W O N o r l 3 0 3 . . -
3 0 3 0
a * n m . .
-
5 m O W
Dcu i m . .
-
--r- O W 3 N D r l
3 ?? - -r- m a o N N d r l
. .
0,
r-e-N * M N cu*
rl
m m
ocuo r l c u r - 4 4 0 cuoo
0
? ?
0 0 0. . .
* * * r l r l r l M M M
? ? ?
M > M W o m m
nr-cD - m c u 0 0 0 3 0 0 ? ? ? __ D W W O M M ? ? ? - b e -
")
n m m +me- + r l m
r l m
M m O m r l l J m m O a o N m o o 3 0 0
3
-
'199
0 N * O d
N ? ?
?c
0
p:
-cr- 5 W W n n m - I r i r l
. . .
-
3 d o 0 m r - q mcnm * m . . .
r-r-r- r l r l r l m m m M M M
. . .
rl r - r l t -P-0 *e-0, 0 * m . . .
rl
0 r - m m m r l
cu* rl
. . + + m
r- * O
cucut- d 0 W o*o N O 0
0 ? ? ?
m m m ? ? ? NcuN * * *
N W LDdO 0 0 0 O N r l
0 ???
M
N c u N Lr-P
3 0 0 r i r l r l
. . . 0
E 7 3.92 m P-M cum ?N Od
-
e- Me- Me- cu
m m
. .
* cu*
*a4 * C (
01Nr c
-
0 r l a
r l M C m o u o c u c
0 N ? C
rl
d W O , m m M
cum d
?'? d
M d M N M O r i c u d
r l *
r- m m * * m a r l oo 0 0 0
0
m m
m m o
. . .
Mr- M N M cur l * m o o 0 0 0
0
r lmcu
999
r-r-r- **d r i d 4
. . .
?c . . . 0
. . . cu
r l r l r l
w m w Lomm
? ? ? ? ? W W r-r- r l r l
rlrld
d**
NNN
. . . m m m
0
0: m m tucu mIn M M
0 0 0 0 r l M
~
-
0 0 *
M O O M O
I--
M O C M C
r
0 0 r i m
0 0 0 dln0
rl
M O O M O
rl
0 0 0 r l m 0
M
0 cu 0 rl
0 m
0 cu
0 0 m
0 In
0 0 rl
0 0 M
0 0 rn -
1%
Total liquid water in each QrOUP >
percent
5
10
20
30
20
10
5
NACA TN 3153
Ratio of av. drop diam. of each group to volume-median droplet diam . ,
'/%ned
0.42
.61
.77
1.00
1.26
1.51
1.81
TABU3 11. - "C" DROPLET-SIZE DISTRIBUTION
CD 0 rl M
NACA TI? 5155 19
20 NACA T i V 3155
(b) Front view of i c e on 1-inch-thick icing-rate-meter support rods.
Figure 1. - Continued. Ice formations on B-25 a i r c r a f t a f t e r f l i g h t a t 200 mph through supercooled clouds.
HACA TN 3153 23.
(c) Ice accumulation on pressure probe.
Figure 1. -Concluded. Ice formations on B-25 a i r c r a f t after f l i g h t a t 200 mph through supercooled clouds.
22 NACA TH 3153
+a F! 0 d -P a rl s 0 rl a 0
k 0 k
a,
5 *ri
a k 0 0 V
1
(u
0 '1 4
0 k
NACA TN 3153 23
ii
0 a, E
k a, P z
k a oa, a a c d i d o a m x ae, d r i a , rid a ,d
0 c , m 7 oe, P Q d d C
m r l e,,d d k k O 0- c, 0 ( u ' -0 dri k Q k
.!2 a, did a\ O d k
' 9 MaO
(u 0 4 k 3 k b o 0 d k
24 NACA TR 3153
LD Fi
9
4 rl
9
M rl
9
N
?
a rl
0 4
9
w P 0 cn
NACA TN 3153 25
2 NACA TN 5153
, I W rl m
rl
9 9 0 rl N rl
9 9
NACA TN 3153 27
* d
9
M rl
9
N rl
9
rl rl
9
0 rl 0
2% NACA 'I?E 3153
NACA “N 3153 29
CD 0 rl M
30 NACA TN 3153
NACA TN 3153
N N
9
rl N
9
0 N
9
0) a W d 0
c a 10
32 NACA TlV 3153
8 rl U rl m
a N
U
4
k? 8 c
c
0
4 3 ro
a B 8 U
V
NACA TN 3153
a a e j m s prosdrrr3J I I I I
9 9 9 W d N 0 0 0
3
(D rl 0
m rl 0
NACA !FN 3153
NACA TN 3153 35
36 NACA TX 5153
D
?
0
?
c 0 0
d U
? d
? U u ? 3
m 8
QJ 4 N 0
9 Er
NACA ‘I% 3153 37
38 NACA TN 3153
N
I-’
c
m @
“
I
NACA TN 3153 39
in rl
9
d rl
9
M rl
4 c, 4 9 m
B
B 8
c,
U
N rl
9 m
rl 1, Pi
a, I-'
c 4 0
?
0 B
::
- 8 c , o 2
I,
rl a
a
rl 0
m , 0 O N . &
* d m O N m 4 m
g 2 II 4; 0 d Q ? g
1, 4 al .. 13 r l m 0 0 a . :
I t ! o " % 9 , " g
8 . 3 2
F kl
9 G.4
s
O N a, a ) - c ,
3 4 a 0"s 3 9
4 1,
in c, 0 m
aJ
m d m 0 9
T3
2 8 4 c,
V 8
d al
M 0 0
cu 0 ib 9 -I a
Pi 0
9
0
0 NACA TN 3153
n -i
?
4 4
?
ti ? m
0 rl -0 rt
a N
N r( 2
v 2 ? 0
v
0 d 2 -I
2 a 9
9 a
?
0 c, d QJ r(
z % n
- m 0 0 m
4 c 1 - 8
c n o o a 0 8
a 0 2 6 % n 2
9 - a w e ' 8 9
f;i
m r t
9 8 2 3 ztl? 2 c, .*
0 1
9 4 N QJ c, - 0 J Q J e c
e0
d c,
c, m
%
o m
LD 0
9 E 2
9 ,o
B 9 1
E 23
9 FT(
m -8 0
2 4 c,
V K) 0
-8
N 0 d
rl 0
9
0
NACA TN 3153 1
2 NACA TN 3153
N
k
NACA TN 3153
46 RACA TM 3153
h
N
U
G
NACA TEJ 3153
NACA TN 3153
NACA TN 3153 49
50 RACA TN 315
c I- s
CA TN 3153
52 NACA TN 3153
N
rl
rl
id
m
NACA TN 3155 53
N
d
d
Id c,
c1 4 8 c,
E
m 0
.P m d a
4
I
lo
5 NACA TN 3153
N rl
m
H 0 N
rl
H 0 0
E
0
e: 0
0
II N
E
Y 8
'?
U N - c - -
? . .
N
8 4 U 4
0 a rl
d
rd U
U 9 8 U
h
rl rl
0
d4 N
5:
2 n C
0 Ln
0
I N
a - v
55
N
c d u d m 0 a
d
d
m * m u m
5 u m
k
W 0
u m d 5
rt
d 5
o m N k
5
m
I1 3 2 5
2 8 ... 2 Y ” 9 5
d
( r u
d I1 u
56 NACA TM 3153
0
n N
cd c1
v
RACA TN 3155 57
58 NACA TN 3153
NACA TN 3155 59
0 0 0 4
0 s 0 0
0 0 N
0 0 rl
0 ln
0 *
60 EACA TE 3153
.I
.06
.a
* 02
.01
.006
. O M
.002
.001
. ooO€
,0004
. 000;
Free-stream Reynolds Nsnber,
.17 Radial distance, r
(a) Axial component.
Figure 8. - Difference between local air- and droplet-velocity cmponenta against r ad ia l distance r at z = 0 posit ion of e l l ipsoid of f-nees ratio 5.
HACA TN 3153 61
7
(b) Radial component.
Figure 8. - Concluded. Difference between local air- and droplet-velocity components at z = 0 poeition of ellipeoid of fines8 ratio 5. against radial distanoe r