Page 1
Updated on July 11, 2018
Technical Notes on the Dialysis Facility
Compare Quality of Patient Care Star Rating
Methodology for the October 2018 Release
Prepared By:
Kidney Epidemiology and Cost Center
University of Michigan, School of Public Health
1415 Washington Heights, Suite 3645 SPH I
Ann Arbor, MI 48109-2029
CMS Contract Number: HHSM-500-2013-13017I
Page 2
Produced by The University of Michigan Kidney Epidemiology and Cost Center July 2018 CMS Contract Number: HHSM-500-2013-13017I Page 2 of 22
Table of Contents
List of Figures ................................................................................................................................................ 3
List of Tables .................................................................................................................................................. 3
Background and Introduction ........................................................................................................................ 4
Glossary of Key Terminology ......................................................................................................................... 5
1. Summary of Methodology Updates for the October 2018 DFC Release................................................ 6
2. DFC Quality Measures Used in Calculating the Star Ratings .................................................................. 7
Measures Added, Replaced, or Updated for the October 2018 DFC Quality of Patient Care Star Rating
System Release .......................................................................................................................................... 7
Final Set of Quality Measures Used in the Quality of Patient Care Star Rating Calculation ....................... 7
ICH CAHPS Survey of Patients’ Experiences Star Rating Calculation .......................................................... 8
3. Development of Measure Domains ....................................................................................................... 9
4. Measure Scoring in Baseline Period and an Evaluation Period ............................................................ 10
Baseline Period Measure Scoring Methodology ...................................................................................... 10
Evaluation Period Measure Scoring Methodology .................................................................................. 12
Missing Values ......................................................................................................................................... 14
5. Translating Facility Final Scores to Star Ratings ................................................................................... 15
6. An Illustration of the Star Rating Calculation ....................................................................................... 17
Step 1: Apply Suppressions to Baseline Period & Evaluation Period Data .............................................. 17
Step 2: Define Scores in a Baseline Period .............................................................................................. 17
Step 3: Score Values in Evaluation Period Based on Baseline Period Standards ..................................... 18
Step 4: Define Final Score Cutoffs in Baseline Period ............................................................................. 19
Step 5: Apply Final Score Cutoffs in Evaluation Period ........................................................................... 20
Appendix A: Supplementary Notes ............................................................................................................. 21
Detailed Example of Scoring Measures in the Standardized Outcomes Domain .................................... 21
Detailed Example of Scoring Percentage Measures ................................................................................ 21
Page 3
Produced by The University of Michigan Kidney Epidemiology and Cost Center July 2018 CMS Contract Number: HHSM-500-2013-13017I Page 3 of 22
List of Figures
Figure 1: Example of Scoring SMR, CY2016 Cutoff Year .............................................................................. 11
Figure 2: Example of Scoring Kt/V, CY2016 Cutoff Year ............................................................................... 12
List of Tables
Table 1: Spearman Correlation Matrix, Calendar Year 2016 Data* ................................................................ 9
Table 2: Mean Measure Values and Mean Final Facility Scores within each Star Rating Category* ............ 16
Table 3: Cutoff Year Measure Values and Standardized Measure Scores ................................................... 18
Table 4: Current Year Measure Values and Standardized Measure Scores ................................................. 19
Table 5: Cutoff Year Domain Scores & Final Scores ..................................................................................... 19
Table 6: Cutoff Values for Star Rating Categories ........................................................................................ 20
Table 7: Current Year Domain Scores & Final Scores .................................................................................. 20
Table 8: Defining Scores for Kt/V in the Cutoff Year (2015)......................................................................... 21
Table 9: Defining Scores for Kt/V in the Current Year (2016) ...................................................................... 22
Page 4
Produced by The University of Michigan Kidney Epidemiology and Cost Center July 2018 CMS Contract Number: HHSM-500-2013-13017I Page 4 of 22
Background and Introduction
The Centers for Medicare & Medicaid Services (CMS), through a contract with the University of Michigan
Kidney Epidemiology and Cost Center (UM-KECC), developed the Dialysis Facility Compare (DFC) Quality of
Patient Care Star Rating System to rate the overall quality of care provided by dialysis facilities. The original
DFC Star Rating System was implemented in January 2015 on the Medicare DFC website with the goal of
providing patients, their families, caregivers and other consumers, information they can use to easily
compare dialysis facility quality performance. Each facility is rated between one and five stars. Facilities
with five stars are considered to deliver much above the national average quality of care and those with
one star are considered to deliver care that is rated much below average quality. The technical report for
the original Star Rating methodology is available at:
https://dialysisdata.org/sites/default/files/content/Methodology/StarRatings.pdf
Based on feedback from a Technical Expert Panel (TEP) convened in April 2015, an update to DFC Star
Rating System methodology occurred in October 2016. The updated technical report for the DFC Star Rating
System, implemented since the October 2016 release, is available at:
https://dialysisdata.org/sites/default/files/content/Methodology/UpdatedDFCStarRatingMethodology.pdf
Additionally, a DFC Star Rating Technical Expert Panel (TEP) was convened in February 2017. The TEP
recommendations on the candidate and updated measures are described in further detail in the 2017 DFC
Star Rating Summary Report, available at:
https://dialysisdata.org/sites/default/files/content/ESRD_Measures/
ESRD_DFC_Star_Ratings_TEP_Summary_Report_2017.pdf
This technical report describes the updated methodology developed for the DFC Star Rating System, to be
implemented for the October 2018 Star Rating release. The report highlights changes to the methodology
since the October 2016 Star Rating methodology update.
Specifically, this technical report includes: (1) summary of methodology changes beginning with the
October 2018 DFC release, (2) DFC Clinical Quality Measures used in calculating the Star Ratings, (3)
development of measure domains, (4) measure scoring in a baseline period and in an evaluation period, (5)
translation of facility final scores to Star Rating categories, and (6) an example Star Rating calculation.
Page 5
Produced by The University of Michigan Kidney Epidemiology and Cost Center July 2018 CMS Contract Number: HHSM-500-2013-13017I Page 5 of 22
Glossary of Key Terminology
Adjustment Factor: A ratio between the national observed event rate in the evaluation period and the
national observed event rate in the baseline period, which is applied so an adjusted
standardized measure in the evaluation period reflects the same value it would take
on in the baseline period.
Baseline Period: The time period, typically a calendar year, in which data are collected for calculation
of measure results used to define measure scoring criteria and cutoff values for Star
Rating categories.
Evaluation Period: The time period, typically a calendar year, in which data are collected for calculation
of measure results and facility Star Rating scores, reported on DFC.
Domain Score: A standardized score which summarizes a facility’s performance on a set of clinical
quality measures. It is an average of the individual measure scores for the clinical
quality measures determined to be statistically correlated.
Final Score: A continuous score calculated for each facility, which summarizes its performance on
the reported clinical quality measures. It is an average of the three domain scores
containing the clinical quality measures included in the DFC Star Rating.
Measure Score: A standardized score applied to a specific measure, which has mean 0, variance 1, and
takes on values in the range of -2.58 to 2.58.
Measure Value: The original value of a facility’s clinical quality measure as reported on DFC, which
represents a standardized ratio or a percentage.
Probit: A unit of probability based on deviations from the mean of a normal distribution.
Standardization: A process which transforms different measure values to be on the same scale and in
the same direction. After standardization, different measures are directly comparable.
Star Rating: An ordinal summary measure, on a scale from one to five that represents a facility’s
overall clinical quality of care. Facilities with five stars are considered to deliver much
above the national average quality of care and those with one star are considered to
deliver care that is much below the national average.
Truncation: A statistical technique by which any measure scores exceeding a pre-specified upper
or lower bound are set to equal the value of the (upper or lower) bound. This is done
to limit the influence of extreme values on the final summary scores.
Truncated Z-Scores: A standardized score representing the number of standard deviations away from the
mean, truncated at a maximum/minimum allowed value.
Page 6
Produced by The University of Michigan Kidney Epidemiology and Cost Center July 2018 CMS Contract Number: HHSM-500-2013-13017I Page 6 of 22
1. Summary of Methodology Updates for the October 2018 DFC Release
The following changes to the methodology used in calculating dialysis facility Star Ratings are included with
the October 2018 DFC release:
1. The measures used in the October 2018 update to the DFC Star Ratings include some DFC measures
from the original 2015 release of the Star Rating System, several updated or replaced versions of
original DFC measures, and measures new to the Star Rating. See DFC Quality Measures Used in
Calculating the Star Ratings for a list of the current quality measures used in the Star Rating
calculation.
2. In order to maintain the longitudinal continuity of Star Rating performance trends, the October
2018 DFC release will use the April 2018 DFC Star Rating distribution to establish a new set of
cutoffs for the Star Rating categories. The October 2018 release will use the new measure
specifications applied to the April 2018 release data to establish a new set of final score cutoffs.
The cutoffs will reproduce the facility Star Rating distribution previously achieved for the April 2018
release using the prior measures and methodology. These cutoffs will be applied to the Star Ratings
calculated for the October 2018 release. Thus, the April 2018 release serves as an evaluation
period for the old measure methodology and as a baseline period for the new methodology.
3. The six CAHPS® In-Center Hemodialysis Survey (ICH CAHPS) measures currently reported on DFC
will also be calculated and reported as separate Star Ratings. An overall Survey of Patients’
Experience Star Rating will be calculated as a summary of these six measures.
Page 7
Produced by The University of Michigan Kidney Epidemiology and Cost Center July 2018 CMS Contract Number: HHSM-500-2013-13017I Page 7 of 22
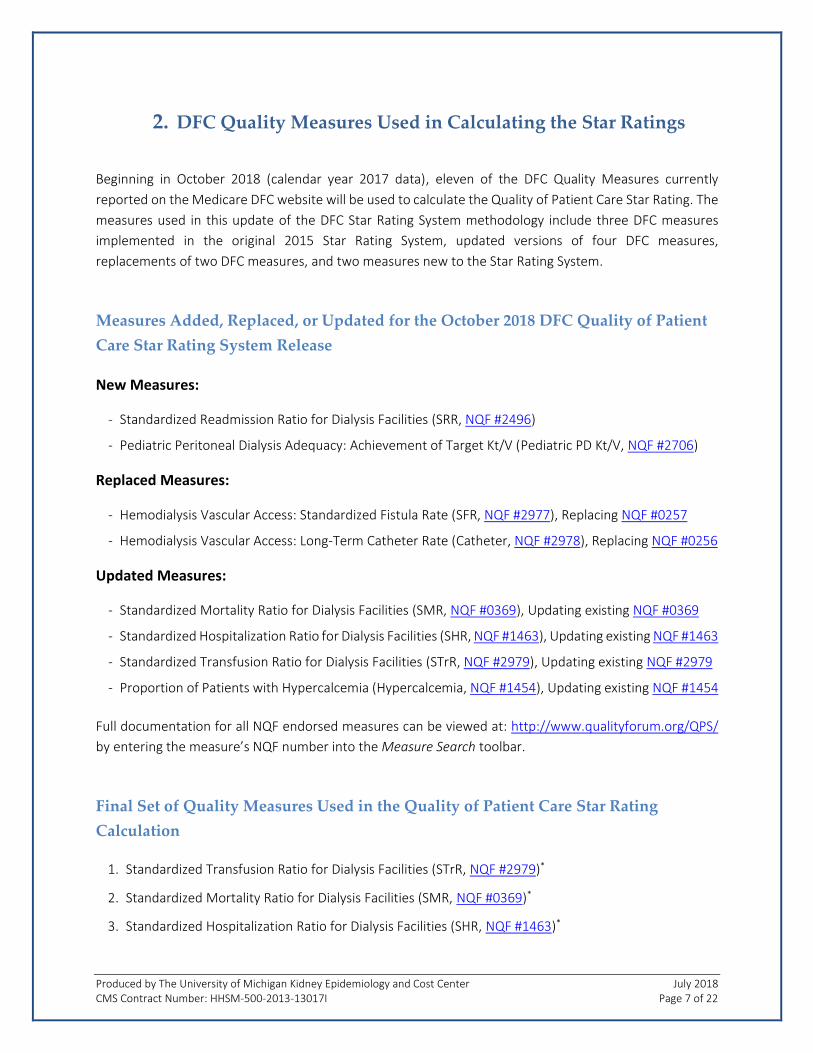
2. DFC Quality Measures Used in Calculating the Star Ratings
Beginning in October 2018 (calendar year 2017 data), eleven of the DFC Quality Measures currently
reported on the Medicare DFC website will be used to calculate the Quality of Patient Care Star Rating. The
measures used in this update of the DFC Star Rating System methodology include three DFC measures
implemented in the original 2015 Star Rating System, updated versions of four DFC measures,
replacements of two DFC measures, and two measures new to the Star Rating System.
Measures Added, Replaced, or Updated for the October 2018 DFC Quality of Patient
Care Star Rating System Release
New Measures:
- Standardized Readmission Ratio for Dialysis Facilities (SRR, NQF #2496)
- Pediatric Peritoneal Dialysis Adequacy: Achievement of Target Kt/V (Pediatric PD Kt/V, NQF #2706)
Replaced Measures:
- Hemodialysis Vascular Access: Standardized Fistula Rate (SFR, NQF #2977), Replacing NQF #0257
- Hemodialysis Vascular Access: Long-Term Catheter Rate (Catheter, NQF #2978), Replacing NQF #0256
Updated Measures:
- Standardized Mortality Ratio for Dialysis Facilities (SMR, NQF #0369), Updating existing NQF #0369
- Standardized Hospitalization Ratio for Dialysis Facilities (SHR, NQF #1463), Updating existing NQF #1463
- Standardized Transfusion Ratio for Dialysis Facilities (STrR, NQF #2979), Updating existing NQF #2979
- Proportion of Patients with Hypercalcemia (Hypercalcemia, NQF #1454), Updating existing NQF #1454
Full documentation for all NQF endorsed measures can be viewed at: http://www.qualityforum.org/QPS/
by entering the measure’s NQF number into the Measure Search toolbar.
Final Set of Quality Measures Used in the Quality of Patient Care Star Rating
Calculation
1. Standardized Transfusion Ratio for Dialysis Facilities (STrR, NQF #2979)*
2. Standardized Mortality Ratio for Dialysis Facilities (SMR, NQF #0369)*
3. Standardized Hospitalization Ratio for Dialysis Facilities (SHR, NQF #1463)*
Page 8
Produced by The University of Michigan Kidney Epidemiology and Cost Center July 2018 CMS Contract Number: HHSM-500-2013-13017I Page 8 of 22
4. Standardized Readmission Ratio for Dialysis Facilities (SRR, NQF# 2496)*
5. Total Kt/V Measure§,:
a. Delivered Dose of Hemodialysis Above Minimum (Adult HD Kt/V, NQF #0249)&, II
b. Minimum spKt/V for Pediatric Hemodialysis Patients (Pediatric HD Kt/V, NQF #1423)&, II
c. Delivered Dose of Peritoneal Dialysis Above Minimum (Adult PD Kt/V, NQF #0318)&, II
d. Pediatric Peritoneal Dialysis Adequacy: Achievement of Target Kt/V
(Pediatric PD Kt/V, NQF# 2706)&
6. Hemodialysis Vascular Access: Standardized Fistula Rate (SFR, NQF #2977)§
7. Hemodialysis Vascular Access: Long-Term Catheter Rate (Catheter, NQF #2978)†
8. Proportion of Patients with Hypercalcemia (Hypercalcemia, NQF #1454)†
* Lower is better, updated yearly § Higher is better, individual measure updated quarterly † Lower is better, updated quarterly & The four Kt/V measurements are combined into a single, Total Kt/V measure. The average percentage of
patients achieving Kt/V greater than the specified thresholds for each of the four respective patient
populations (Adult HD, Adult PD, Pediatric HD, and Pediatric PD), were weighted based on the number of
patient-months of data available for each patient population. The resulting measure (Total Kt/V)
represents the percentage of total dialysis patients eligible for the measure who had enough waste
removed from their blood (Kt/V greater than or equal to the specified threshold). After combining these
measures, eight final Quality Measures are used to calculate the clinical Star Rating. II No changes to measure specifications
ICH CAHPS Survey of Patients’ Experiences Star Rating Calculation
1. CAHPS® In-Center Hemodialysis Survey (ICH CAHPS, NQF #0258)
The ICH CAHPS Survey of Patients’ Experiences Star Rating will be calculated and reported as a separate
Star Ratings. Current measure specifications are available at:
https://ichcahps.org/SurveyandProtocols.aspx
The ICH CAHPS Star Rating Technical Notes are available at:
https://ichcahps.org/ICHCAHPS_Star_Rating_Methodology_Report.docx
Page 9
Produced by The University of Michigan Kidney Epidemiology and Cost Center July 2018 CMS Contract Number: HHSM-500-2013-13017I Page 9 of 22
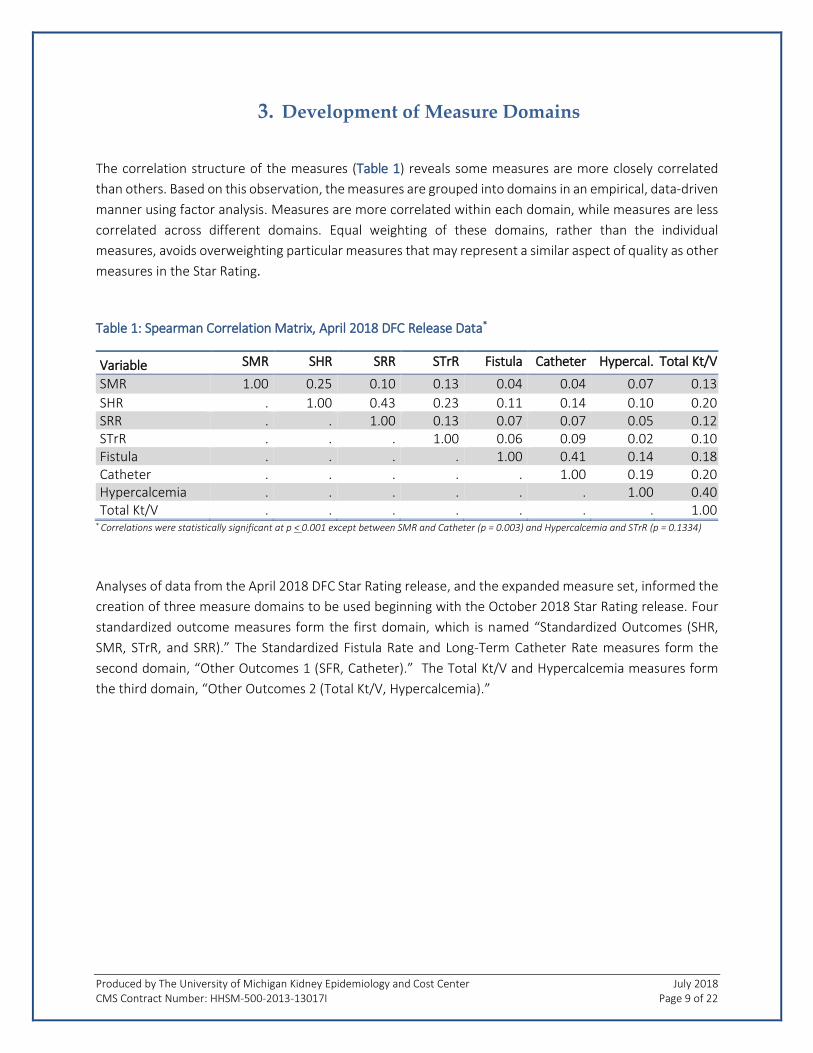
3. Development of Measure Domains
The correlation structure of the measures (Table 1) reveals some measures are more closely correlated
than others. Based on this observation, the measures are grouped into domains in an empirical, data-driven
manner using factor analysis. Measures are more correlated within each domain, while measures are less
correlated across different domains. Equal weighting of these domains, rather than the individual
measures, avoids overweighting particular measures that may represent a similar aspect of quality as other
measures in the Star Rating.
Table 1: Spearman Correlation Matrix, April 2018 DFC Release Data*
Variable SMR SHR SRR STrR Fistula Catheter Hypercal. Total Kt/V
SMR 1.00 0.25 0.10 0.13 0.04 0.04 0.07 0.13
SHR . 1.00 0.43 0.23 0.11 0.14 0.10 0.20 SRR . . 1.00 0.13 0.07 0.07 0.05 0.12 STrR . . . 1.00 0.06 0.09 0.02 0.10 Fistula . . . . 1.00 0.41 0.14 0.18 Catheter . . . . . 1.00 0.19 0.20 Hypercalcemia . . . . . . 1.00 0.40 Total Kt/V . . . . . . . 1.00
* Correlations were statistically significant at p < 0.001 except between SMR and Catheter (p = 0.003) and Hypercalcemia and STrR (p = 0.1334)
Analyses of data from the April 2018 DFC Star Rating release, and the expanded measure set, informed the
creation of three measure domains to be used beginning with the October 2018 Star Rating release. Four
standardized outcome measures form the first domain, which is named “Standardized Outcomes (SHR,
SMR, STrR, and SRR).” The Standardized Fistula Rate and Long-Term Catheter Rate measures form the
second domain, “Other Outcomes 1 (SFR, Catheter).” The Total Kt/V and Hypercalcemia measures form
the third domain, “Other Outcomes 2 (Total Kt/V, Hypercalcemia).”
Page 10
Produced by The University of Michigan Kidney Epidemiology and Cost Center July 2018 CMS Contract Number: HHSM-500-2013-13017I Page 10 of 22
4. Measure Scoring in Baseline Period and an Evaluation Period
The DFC clinical quality measures have different distributions and scales, therefore the values of individual
measures to measure scores are first transformed in order to make them comparable in terms of scale and
direction (scoring methodology is described further below).
Baseline Period Measure Scoring Methodology
The October 2016 DFC Star Rating release used January 2014 to December 2014 data as the baseline period.
This allowed facilities to maintain or improve their Star Rating if they maintained or improved performance
on the quality measures compared to their baseline period score. As new measures are added to the DFC
Star Rating System, one cannot directly compare cutoff scores to the Star Rating cutoffs established for the
October 2016 DFC update using January to December 2014 results. Additionally, several measures are
updated for the October 2018 release (see Summary of Methodology Updates for the October
2018 DFC Release) for information on how this is addressed.
The measure values in the current DFC Star Rating are either standardized ratios or percentages. In
developing scores for the baseline period, different scoring methods are applied, based on the measures’
scales. The most up-to-date data, as of May 2018, were used for each of the measures: January 2016 to
December 2016 data for the standardized measures and July 2016 to June 2017 data for the percent-based
measures. These are the data reported in the April 2018 release.
Standardized Ratio Measures: SMR, SHR, SRR, and STrR
The standardized ratio measures are scored differently than the percentage measures as the quality
associated with a unit change in a ratio measure is not equally spaced. For example, the quality difference
between an SMR of 0.5 versus 1.0 is not the same as the quality difference between an SMR of 1.0 versus
1.5. The former represents a two-fold difference, while the latter represents a difference in mortality that
is only 1.5 times higher. Probit scoring, a ranking approach described below, better accounts for these
spacing differences than z-scores, which assume equal spacing. In addition, since the probit function maps
percentile ranks of the standardized ratio measures to a distribution with mean 0 and variance 1, this type
of scoring can be easily combined with z-scores for the percentage measures, which also have mean 0 and
variance 1. Therefore, probit scoring is used for the ratio measures to define scores in the baseline period.
To calculate probit scores, we input a “percentile rank” / 100 into the probit function, ɸ-1, the inverse
cumulative distribution function for the standard normal distribution. This produces the normal quantile
associated with the input percentile rank. Minimum and maximum values of probit scores are determined
by precision of the percentile input into the probit function. The DFC Star Rating uses percentiles ranging
from 0.5 to 99.5 in increments of 0.5, resulting in 199 distinct percentiles. The associated minimum probit
Page 11
Produced by The University of Michigan Kidney Epidemiology and Cost Center July 2018 CMS Contract Number: HHSM-500-2013-13017I Page 11 of 22
score is ɸ-1 (0.5/100) = -2.58, and the maximum probit score is ɸ-1 (99.5/100) = 2.58.
The probit scores for ratio-based measures and the truncated z-scores for percentage based measures
have the same range of values when scoring. Therefore, the maximum and minimum probit scores (± 2.58)
are chosen as the cutoffs to truncate the z-scores.
Probit scoring algorithm in the baseline period:
- Percentile ranks are calculated for the baseline period measure values.
- The percentile ranks are realigned so that the highest value is 99.5 (representing the best possible
care quality) and the lowest value is 0.5 (representing the worst possible care quality).
- The percentile ranks are then mapped to the probit scores: probit score = ɸ-1(percentile rank / 100),
which has a range of -2.58 to 2.58. After the probit transformation, the standardized measure scores
have mean 0 and variance 1.
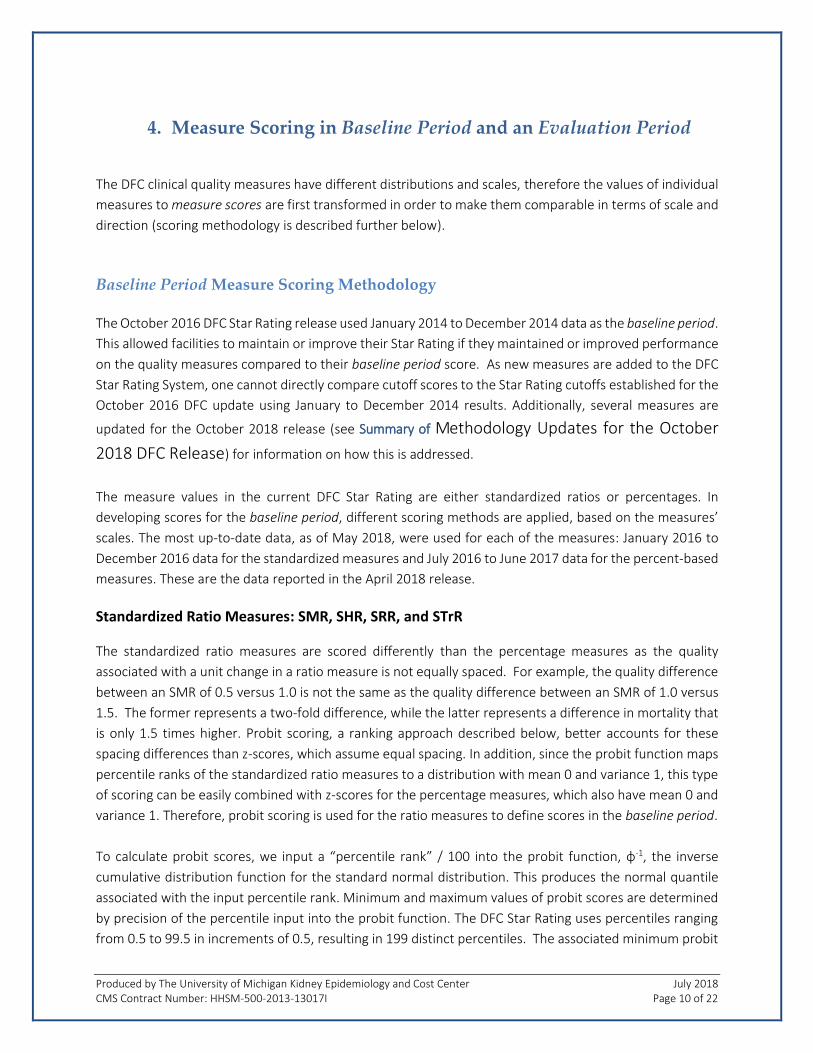
Figure 1 shows the distribution of measure values for SMR on the left (where lower values are better) and
the distribution of probit measure scores for SMR on the right (where higher scores are better).
Figure 1: Example of Scoring SMR, January 2016 to December 2016 Baseline Period
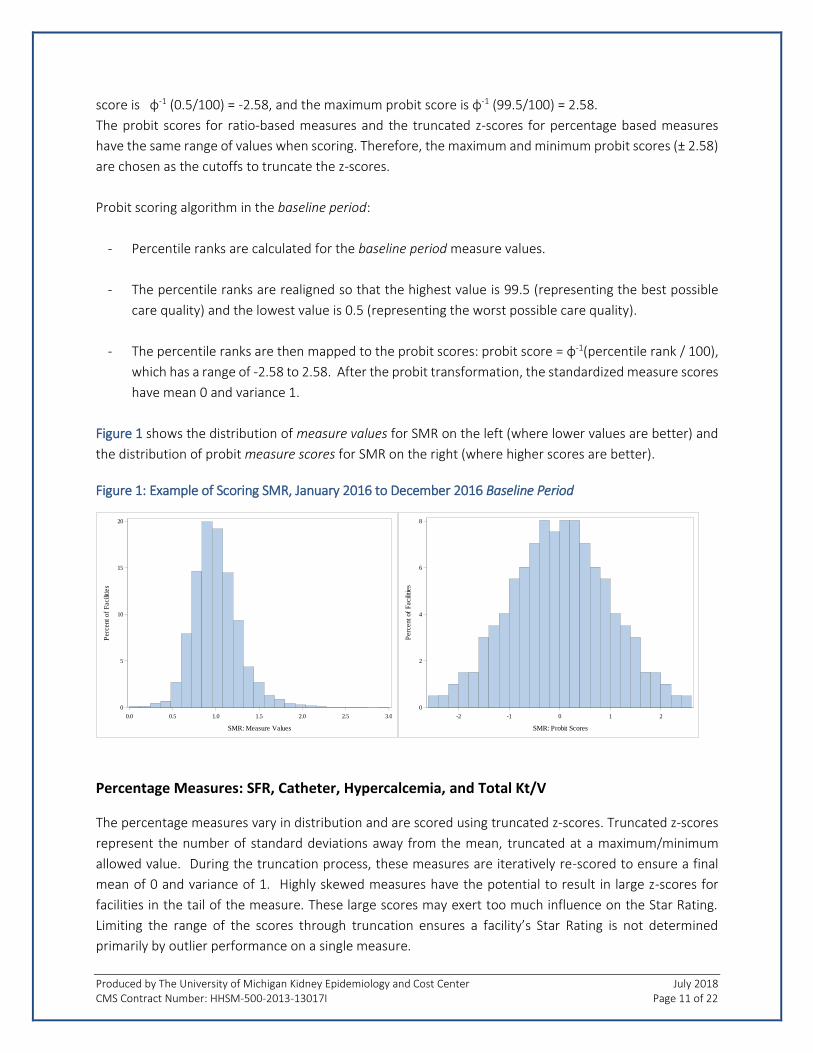
Percentage Measures: SFR, Catheter, Hypercalcemia, and Total Kt/V
The percentage measures vary in distribution and are scored using truncated z-scores. Truncated z-scores
represent the number of standard deviations away from the mean, truncated at a maximum/minimum
allowed value. During the truncation process, these measures are iteratively re-scored to ensure a final
mean of 0 and variance of 1. Highly skewed measures have the potential to result in large z-scores for
facilities in the tail of the measure. These large scores may exert too much influence on the Star Rating.
Limiting the range of the scores through truncation ensures a facility’s Star Rating is not determined
primarily by outlier performance on a single measure.
0.0 0.5 1.0 1.5 2.0 2.5 3.0
SMR: Measure Values
0
5
10
15
20
Perc
ent
of
Facili
ties
-2 -1 0 1 2
SMR: Probit Scores
0
2
4
6
8
Perc
ent
of
Facili
ties
Page 12
Produced by The University of Michigan Kidney Epidemiology and Cost Center July 2018 CMS Contract Number: HHSM-500-2013-13017I Page 12 of 22
The scoring algorithm is as follows:
- Percentage measures in the baseline period are realigned so that the highest value (100) represents
the best possible care quality and the lowest value (0) represents the worst possible care quality. This
is to ensure scored measures have the same directionality before they are combined.
- Z-scores are calculated. All z-scored measures now have mean of 0 and variance of 1 at this step.
- Z-scores are truncated at upper and lower bounds for each measure.
- These truncated scores are then re-standardized to ensure the final truncated z-scores still have mean
of 0 and variance of 1. Though the upper and lower truncation bounds may differ across different
measures, all measure scores have a maximum range of -2.58 to 2.58.
A detailed example of this calculation is shown in Appendix A. Figure 2 shows the distribution of
measure values for Kt/V (left) and the distribution of measure z-scores for Kt/V (right).
Figure 2: Example of Scoring Kt/V, July 2016 to June 2017 Baseline Period
Evaluation Period Measure Scoring Methodology
For the October 2018 DFC release, the Star Rating System has new, replaced, and updated measures in the
measure set. Therefore, it would not be appropriate to directly compare this evaluation period’s data to
the original baseline period (January 2014 to December 2014) criteria established for the October 2016
release of the Star Ratings. Instead, the April 2018 Star Rating distribution will be used to establish a new
set of cutoffs for the October 2018 release of the DFC Star Rating. This will maintain the longitudinal
continuity of the current Star Rating distribution, while using the appropriate score cutoffs established for
the new measure set.
20 40 60 80 100
Total Kt/V: Measure Values
0
10
20
30
40
Perc
ent
of
Facili
ties
-2 -1 0 1
Total Kt/V: Truncated Z-Scores
0
2
4
6
8
Perc
ent
of
Facili
ties
Page 13
Produced by The University of Michigan Kidney Epidemiology and Cost Center July 2018 CMS Contract Number: HHSM-500-2013-13017I Page 13 of 22
Standardized Ratio Measures: SMR, SHR, SRR, and STrR
The standardized ratio measures represent ratios (observed events/expected events) in the evaluation
period. Before applying scores to standardized ratio measures in the evaluation period, we multiply these
ratios by an adjustment factor. The adjustment factor, which accounts for differences in population event
rates between the baseline period and evaluation period data, is applied so that an adjusted evaluation
period ratio value reflects the same value it would have in the baseline period. The adjustment factor
multiplied by the standardized ratio is the same for all facilities in the evaluation period, for that particular
measure. It is the average national observed event rate in the evaluation period divided by the average
national observed event rate in the baseline period. For the October 2018 Star Rating release, the
evaluation period will use data from January 2017 to December 2017.
Below is an example using the April 2018 DFC release data as the evaluation period, adjusted to the October
2016 DFC release data event rates, which is the baseline period. As an illustration, the example below shows
the adjustment that would be made for data collected in 2016 (i.e., evaluation period):
SHR Adjustment = Evaluation Period (Jan. - Dec. 2016) Hospitalizations per Patient-Year
Baseline Period (Jan. - Dec. 2015) Hospitalizations per Patient-Year =
1.81
1.78 = 1.02
Since hospitalization rates were higher in 2016 than in 2015, the expected number of events for the average
facility is higher in 2016. By multiplying SHR in 2016 by a factor of 1.02 to calculate an adjusted SHR, these
facilities are effectively being measured by 2015 criteria, i.e., baseline period criteria. This is interpreted as
how the facility performed in the evaluation period relative to the typical facility in a pre-established
baseline period.
Evaluation period facility ratios are first multiplied by the adjustment factor (as described earlier) in order
to calculate individual facility adjusted ratios. Each adjusted ratio is mapped to the same percentile rank
that the ratio would have been mapped to if it had been observed in the baseline period. The cutoffs used
for the percentile ranks are determined by the best measure value within each percentile rank in the
baseline period. More detail is provided in Appendix A.
Percentage Measures: SFR, Catheter, Hypercalcemia, Total Kt/V
Each measure value is mapped to the same score that the measure value would have been mapped to if it
had been observed in the baseline period (July 2016 to June 2017). Z-scores in the evaluation period are
therefore calculated by subtracting the mean and dividing by the standard deviation of the measure in the
baseline period. These z-scores are then truncated at the same values as truncated in the baseline period
and re-standardized using the mean and the standard deviation of the truncated z-scores in the baseline
period. A detailed example is shown in Table 8 and Table 9 in Appendix A.
Page 14
Produced by The University of Michigan Kidney Epidemiology and Cost Center July 2018 CMS Contract Number: HHSM-500-2013-13017I Page 14 of 22
Combining Measure Scores into Final Facility Scores
The measure scores are combined to calculate a final score for each facility. Each facility is first given
domain scores between -2.58 and 2.58 by averaging the measure scores within each of the three domains.
Facilities are then given a final score between -2.58 and 2.58 by averaging the domain scores. Facilities are
given final scores as long as they have at least one measure value in each domain. Note that facilities that
serve PD patients only (designated as PD-only facilities) do not have values for the “Other Outcomes 1 (SFR,
Catheter)” domain. For the Star Rating, these facilities will be rated based on the average scores for the
other domains.
Missing Values
As noted above, with the exception of PD-only facilities, all facilities will receive a rating if they have at least
one measure value in each domain. Missing values (for facilities eligible for ratings) are assigned the mean
of the scores given to that measure in the evaluation period. This method of imputation ensures one
measure does not exert too much influence on the domain score, and in turn, the final score used to
determine the Star Rating. For example, if one facility had the maximum measure score of 2.58 for STrR
and had missing values for SMR, SRR, and SHR, it would not be appropriate to assume the Standardized
Ratio Measure Domain should be given the maximum score of 2.58 based on the one measure for that
domain (i.e., STrR in this case). By imputing the average score for the SMR, SHR, and SRR measure, we
instead give the domain a submaximal above average score. In this example, this facility is still above
average for this domain, but the domain score will not be based solely on the one observed score for STrR,
and therefore limits the STrR score from being too influential on the final facility score.
Page 15
Produced by The University of Michigan Kidney Epidemiology and Cost Center July 2018 CMS Contract Number: HHSM-500-2013-13017I Page 15 of 22
5. Translating Facility Final Scores to Star Ratings
The ranges of the final score, i.e. the cutoff values, which determine facilities’ five Star Rating categories
are established by data from the baseline period (see Measure Scoring in Baseline Period and an Evaluation
Period).
Defining Final Score Cutoffs in the Baseline Period
Final scores for the baseline period were calculated and used to define Star Rating categories in the
evaluation period Star Rating. The same baseline period and cutoff values will continue to be used in
subsequent Star Ratings releases until a new baseline period and cutoff values are established.
Maintaining Longitudinal Continuity in the Star Rating for the October 2018 Release
This release of the Star Rating system will incorporate the new, replaced, and updated measures described
earlier in this report, and will be based on new Star Rating category cutoff values. The new cutoff values
will preserve the Star Rating distribution from the previous Star Rating release. These cutoffs are
established using the most recent full year of data: January 2016 to December 2016 for the standardized
ratio measures and July 2016 to June 2017 for the percentage-based measures. The final facility score
distribution will use the Star Rating proportions reported in the April 2018 release to establish new cutoffs.
These cutoffs will then be applied to the facility final scores for the October 2018 release.
Assigning Star Ratings in the Evaluation Period
The final score cutoffs that are defined using the April 2018 Star Rating distribution are used to assign Star
Ratings to facilities for the evaluation period. If the population of facilities improves in their measure
performance from the year in which the cutoffs are established, more facilities could be in the higher Star
Rating categories compared to the baseline period, as they are being compared to prior measure
performance in an earlier time period. Table 2 below reports an example distribution of average measure
values for facilities within each Star Rating category. As is shown, better measure values and final scores
correspond with higher Star Rating categories. Note: This table uses the currently available April 2018 DFC
data in order to illustrate this example.
Page 16
Produced by The University of Michigan Kidney Epidemiology and Cost Center July 2018 CMS Contract Number: HHSM-500-2013-13017I Page 16 of 22
Table 2: Mean Measure Values and Mean Final Facility Scores within each Star Rating Category*
Measure ★ ★★ ★★★ ★★★★ ★★★★★
Facility N (%) 228 (4%) 554 (9%) 2262 (43%) 1870 (30%) 1390 (22%) SMR 1.34 1.13 1.06 0.98 0.88
SHR 1.33 1.21 1.09 0.96 0.80
SRR 1.17 1.15 1.05 0.96 0.82
STrR 1.68 1.25 1.00 0.78 0.54
Fistula 45.83 53.55 59.68 65.77 72.08
Catheter 28.45 19.52 13.89 10.33 7.51
Hypercalcemia 13.64 4.25 2.51 1.77 1.11
Total Kt/V 82.46 92.23 94.84 96.38 97.59
Final Score -1.07 -0.39 0.08 0.46 0.85 * April 2018 DFC release data for the evaluation period, October 2016 DFC release data for the baseline period
Page 17
Produced by The University of Michigan Kidney Epidemiology and Cost Center July 2018 CMS Contract Number: HHSM-500-2013-13017I Page 17 of 22
6. An Illustration of the Star Rating Calculation
This section illustrates the updated Star Rating methodology to be implemented beginning with the
October 2018 DFC Star Rating release. The calculation is illustrated using two sample facilities: (1) A
Standard facility, denoted as Facility A, which provides a combination of in-center hemodialysis, home
hemodialysis, and/or peritoneal dialysis, and (2) A PD-Only facility, denoted as Facility B, which provides
only peritoneal dialysis services. This illustrates how PD-only versus all other facilities are treated in the Star
Rating calculation. Note these examples use currently available data, where January 2015 to December
2015 is the baseline period, and the data available from the April 2018 release is the evaluation period to
illustrate this example.
Step 1: Apply Suppressions to Baseline Period & Evaluation Period Data
Facilities that are too new or too small to provide reliable clinical measure values are suppressed and set
to missing. For this example, both Facility A and Facility B are facilities that were not suppressed.
Step 2: Define Scores in a Baseline Period
1. Standardized Ratio Measures: Apply probit scoring to each measure
a. Generate 199 percentile ranks for each measure (0.5 to 99.5)
b. Generate probit scores where the score = ϕ-1(percentile rank / 100)
2. Percentage Measures: Apply iterative truncated Z-score algorithm to each realigned measure
a. Let the measure of interest be 𝑚 and first standardize 𝑚 to get 𝑧 by subtracting the mean
of 𝑚 and dividing by its standard deviation
b. Iteratively truncate 𝑧 at truncation bounds to get 𝑡 and standardize 𝑡 to get 𝑤
3. Impute eligible facility’s missing values with the national average for that measure
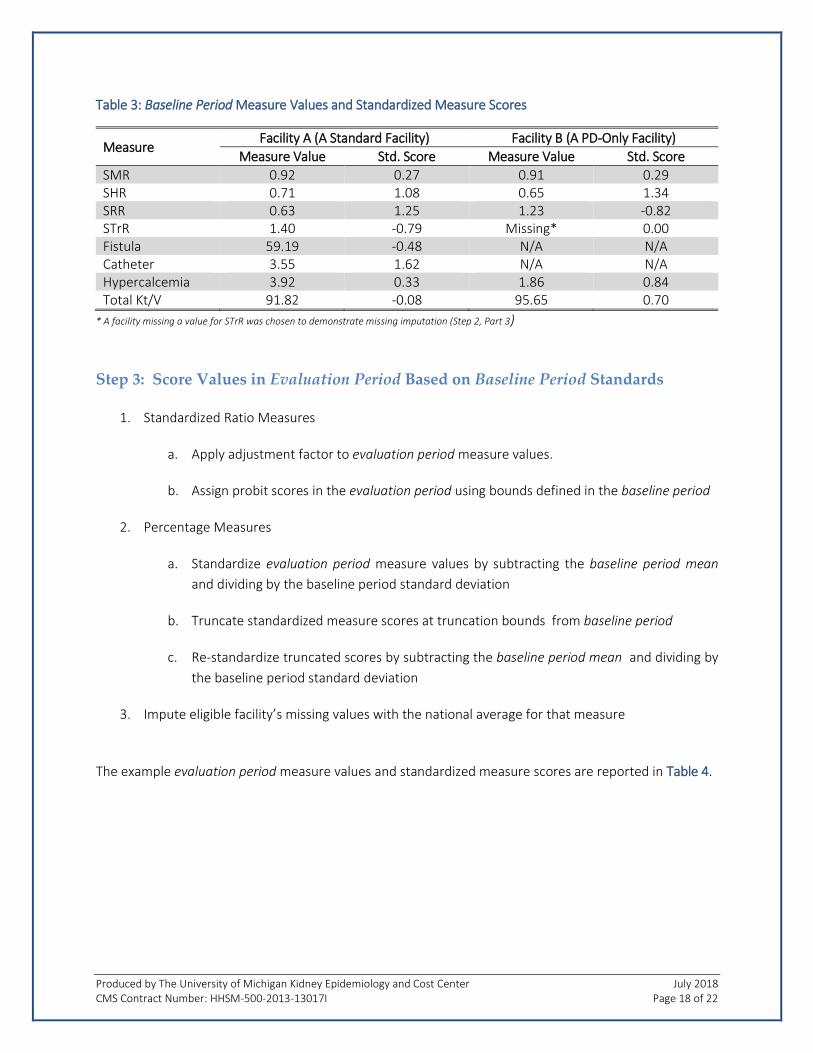
The baseline period measure values and standardized measure scores are reported in Table 3 on the next
page. Here, measure value refers to the value as reported for DFC. Standardized measure scores (Std.
Score) refers to the transformed measure values for each individual metric, after applying Step 2, which
are used to calculate a facility’s final score and subsequent Star Rating.
Page 18
Produced by The University of Michigan Kidney Epidemiology and Cost Center July 2018 CMS Contract Number: HHSM-500-2013-13017I Page 18 of 22
Table 3: Baseline Period Measure Values and Standardized Measure Scores
Measure Facility A (A Standard Facility) Facility B (A PD-Only Facility)
Measure Value Std. Score Measure Value Std. Score
SMR 0.92 0.27 0.91 0.29 SHR 0.71 1.08 0.65 1.34 SRR 0.63 1.25 1.23 -0.82 STrR 1.40 -0.79 Missing* 0.00 Fistula 59.19 -0.48 N/A N/A Catheter 3.55 1.62 N/A N/A Hypercalcemia 3.92 0.33 1.86 0.84 Total Kt/V 91.82 -0.08 95.65 0.70
* A facility missing a value for STrR was chosen to demonstrate missing imputation (Step 2, Part 3)
Step 3: Score Values in Evaluation Period Based on Baseline Period Standards
1. Standardized Ratio Measures
a. Apply adjustment factor to evaluation period measure values.
b. Assign probit scores in the evaluation period using bounds defined in the baseline period
2. Percentage Measures
a. Standardize evaluation period measure values by subtracting the baseline period mean
and dividing by the baseline period standard deviation
b. Truncate standardized measure scores at truncation bounds from baseline period
c. Re-standardize truncated scores by subtracting the baseline period mean and dividing by
the baseline period standard deviation
3. Impute eligible facility’s missing values with the national average for that measure
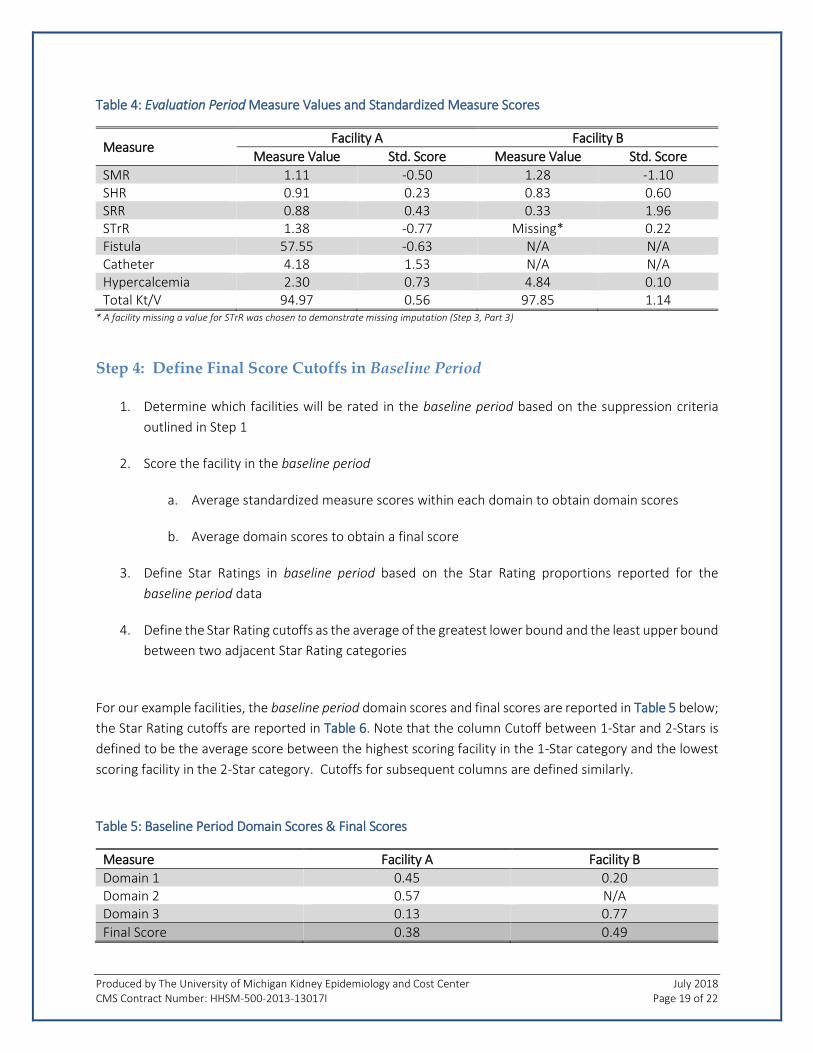
The example evaluation period measure values and standardized measure scores are reported in Table 4.
Page 19
Produced by The University of Michigan Kidney Epidemiology and Cost Center July 2018 CMS Contract Number: HHSM-500-2013-13017I Page 19 of 22
Table 4: Evaluation Period Measure Values and Standardized Measure Scores
Measure Facility A Facility B
Measure Value Std. Score Measure Value Std. Score
SMR 1.11 -0.50 1.28 -1.10 SHR 0.91 0.23 0.83 0.60 SRR 0.88 0.43 0.33 1.96 STrR 1.38 -0.77 Missing* 0.22 Fistula 57.55 -0.63 N/A N/A Catheter 4.18 1.53 N/A N/A Hypercalcemia 2.30 0.73 4.84 0.10 Total Kt/V 94.97 0.56 97.85 1.14
* A facility missing a value for STrR was chosen to demonstrate missing imputation (Step 3, Part 3)
Step 4: Define Final Score Cutoffs in Baseline Period
1. Determine which facilities will be rated in the baseline period based on the suppression criteria
outlined in Step 1
2. Score the facility in the baseline period
a. Average standardized measure scores within each domain to obtain domain scores
b. Average domain scores to obtain a final score
3. Define Star Ratings in baseline period based on the Star Rating proportions reported for the
baseline period data
4. Define the Star Rating cutoffs as the average of the greatest lower bound and the least upper bound
between two adjacent Star Rating categories
For our example facilities, the baseline period domain scores and final scores are reported in Table 5 below;
the Star Rating cutoffs are reported in Table 6. Note that the column Cutoff between 1-Star and 2-Stars is
defined to be the average score between the highest scoring facility in the 1-Star category and the lowest
scoring facility in the 2-Star category. Cutoffs for subsequent columns are defined similarly.
Table 5: Baseline Period Domain Scores & Final Scores
Measure Facility A Facility B
Domain 1 0.45 0.20 Domain 2 0.57 N/A Domain 3 0.13 0.77
Final Score 0.38 0.49
Page 20
Produced by The University of Michigan Kidney Epidemiology and Cost Center July 2018 CMS Contract Number: HHSM-500-2013-13017I Page 20 of 22
Table 6: Cutoff Values for Star Rating Categories
Cutoff Cutoff between 1-Star & 2-Stars
Cutoff between 2-Stars & 3-Stars
Cutoff between 3-Stars & 4-Stars
Cutoff between 4-Stars & 5-Stars
Value -0.67 -0.22 0.30 0.641
Step 5: Apply Final Score Cutoffs in Evaluation Period
1. Determine which facilities will be rated in the evaluation period based on the suppression criteria
2. Score the facility in the evaluation period
a. Average standardized measure scores within each domain to obtain domain scores
b. Average domain scores to obtain a final score
3. Translate final scores to Star Ratings using the Star Rating cutoffs defined in the baseline period
The example evaluation period domain scores and final scores are reported in Table 7 below. Using the
cutoffs reported in Table 6, both the Standard facility and the PD-Only facility would be assigned 4-Stars.
Table 7: Evaluation Period Domain Scores & Final Scores
Measure Facility A Facility B
Domain 1 -0.15 0.42 Domain 2 0.45 N/A Domain 3 0.65 0.62
Final Score 0.31 0.52
Star Rating 4-Star 4-Star
Page 21
Produced by The University of Michigan Kidney Epidemiology and Cost Center July 2018 CMS Contract Number: HHSM-500-2013-13017I Page 21 of 22
Appendix A: Supplementary Notes
Detailed Example of Scoring Measures in the Standardized Outcomes Domain
In order to map the standardized ratio measure values in the evaluation period to the percentile ranks
defined in the baseline period, percentile rank cutoffs must be established. The cutoffs are determined by
the best measure value within each percentile rank in the baseline period. For any measure ratio value in
the evaluation period that falls between the percentile rank cutoffs in the baseline period, the measure
ratio value in the evaluation period will be “rounded up” to the higher of the two percentile rank values. A
higher percentile rank indicates better performance. For example, suppose we are considering a measure
for which a higher ratio indicates poorer performance on the measure. If the lowest value receiving a ratio
measure percentile rank of 47.5 in the baseline period is 1.092 and the highest value receiving the next
higher percentile rank value of 48.0 is 1.089, then the ratio measure in a future year (after applying the
adjustment factor) of 1.090 would be given a percentile rank of 48.0. These “percentile ranks” are input
into the probit function to determine the measure scores for the evaluation period.
Detailed Example of Scoring Percentage Measures
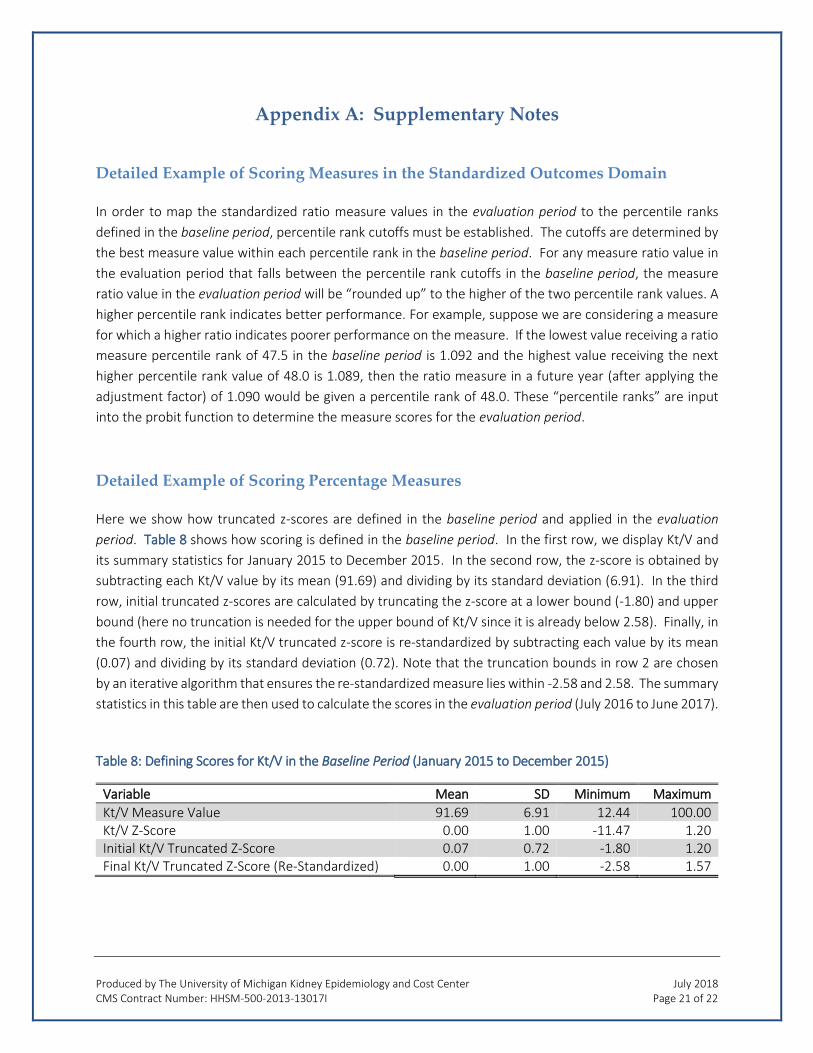
Here we show how truncated z-scores are defined in the baseline period and applied in the evaluation
period. Table 8 shows how scoring is defined in the baseline period. In the first row, we display Kt/V and
its summary statistics for January 2015 to December 2015. In the second row, the z-score is obtained by
subtracting each Kt/V value by its mean (91.69) and dividing by its standard deviation (6.91). In the third
row, initial truncated z-scores are calculated by truncating the z-score at a lower bound (-1.80) and upper
bound (here no truncation is needed for the upper bound of Kt/V since it is already below 2.58). Finally, in
the fourth row, the initial Kt/V truncated z-score is re-standardized by subtracting each value by its mean
(0.07) and dividing by its standard deviation (0.72). Note that the truncation bounds in row 2 are chosen
by an iterative algorithm that ensures the re-standardized measure lies within -2.58 and 2.58. The summary
statistics in this table are then used to calculate the scores in the evaluation period (July 2016 to June 2017).
Table 8: Defining Scores for Kt/V in the Baseline Period (January 2015 to December 2015)
Variable Mean SD Minimum Maximum
Kt/V Measure Value 91.69 6.91 12.44 100.00 Kt/V Z-Score 0.00 1.00 -11.47 1.20 Initial Kt/V Truncated Z-Score 0.07 0.72 -1.80 1.20 Final Kt/V Truncated Z-Score (Re-Standardized) 0.00 1.00 -2.58 1.57
Page 22
Produced by The University of Michigan Kidney Epidemiology and Cost Center July 2018 CMS Contract Number: HHSM-500-2013-13017I Page 22 of 22
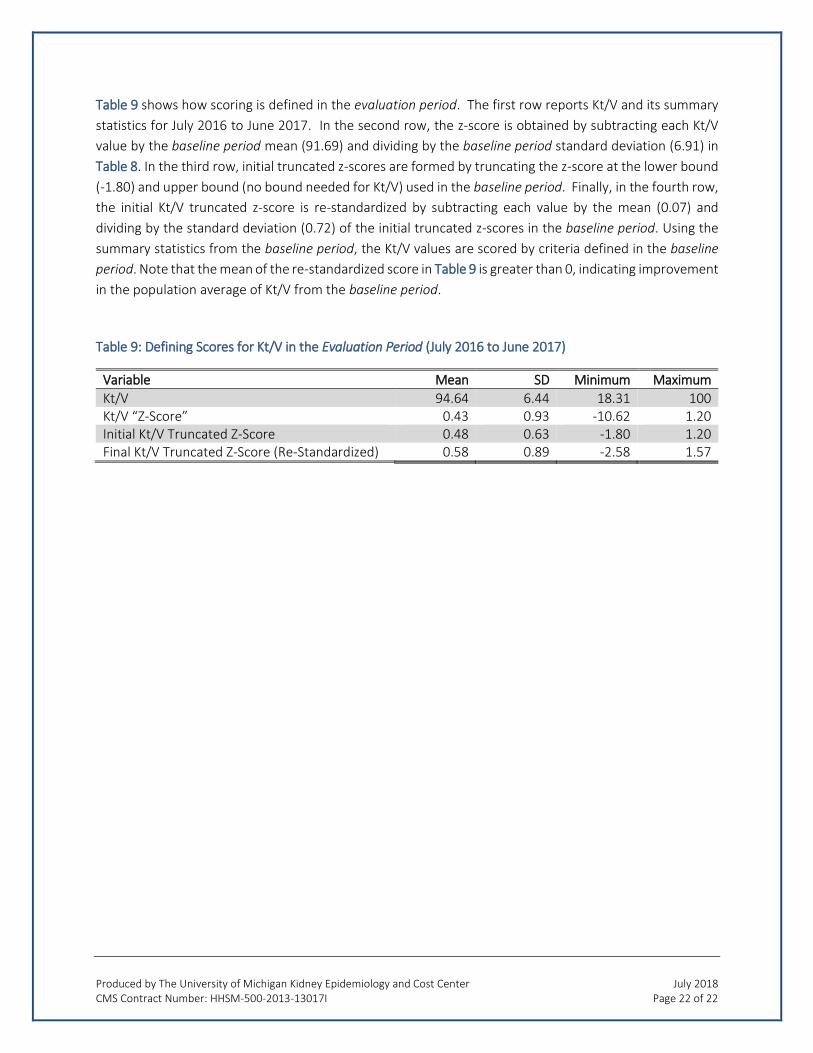
Table 9 shows how scoring is defined in the evaluation period. The first row reports Kt/V and its summary
statistics for July 2016 to June 2017. In the second row, the z-score is obtained by subtracting each Kt/V
value by the baseline period mean (91.69) and dividing by the baseline period standard deviation (6.91) in
Table 8. In the third row, initial truncated z-scores are formed by truncating the z-score at the lower bound
(-1.80) and upper bound (no bound needed for Kt/V) used in the baseline period. Finally, in the fourth row,
the initial Kt/V truncated z-score is re-standardized by subtracting each value by the mean (0.07) and
dividing by the standard deviation (0.72) of the initial truncated z-scores in the baseline period. Using the
summary statistics from the baseline period, the Kt/V values are scored by criteria defined in the baseline
period. Note that the mean of the re-standardized score in Table 9 is greater than 0, indicating improvement
in the population average of Kt/V from the baseline period.
Table 9: Defining Scores for Kt/V in the Evaluation Period (July 2016 to June 2017)
Variable Mean SD Minimum Maximum
Kt/V 94.64 6.44 18.31 100 Kt/V “Z-Score” 0.43 0.93 -10.62 1.20 Initial Kt/V Truncated Z-Score 0.48 0.63 -1.80 1.20 Final Kt/V Truncated Z-Score (Re-Standardized) 0.58 0.89 -2.58 1.57