Wave Measurement Waves - disturbances of water - are a constant presence in the world's oceans. Because waves travel all across the globe, transmitting vast amounts of energy, understanding their motions and characteristics is essential. The forces generated by waves are the main factor impacting the geometry of beaches, the transport ofsand and other sediments in the nearshore region, and the stresses and strains on coastal structures. When waves are large, they can also pose a significant threat to commercial shipping, recreational boaters, and the beachgoing public. Thus for ensuring sound coastal planning and public safety, wave measurement and analysis is of great importance. The discussion below is largely based on Part II, Chapter 1 of the Coastal Engineering Manual (CEM), published by the United States Army Corps of Engineers' Coastal and Hydraulics Laboratory. For more details, we recommend referring directly to the CEM.Wave Generation Waves are generated by forces that disturb a body of water. They can result from a wide range of forces - the gravitational pull of the sun and the moon, underwater earthquakes and landslides, the movements of boats and swimmers. The vast majority of ocean waves, however, are generated by wind. Out in the ocean, as the wind blows across a smooth water surface, air molecules push against the water. This friction between the air and water pushes up tiny ridges or ripples on the ocean surface. As the wind continues to blow, these ripples increase in size, eventually growing into waves that may reach many meters in height. Three factors determine how large wind-generated waves can become. The first factor is wind speed, and the second factor is wind duration, or the the length oftime the wind blows. The final factor is the fetch, the distance over which the wind blows without a change in direction. The faster the wind, the longer it blows, and the larger the fetch, the bigger the waves that will result. But the growth of wind- generated ocean waves is not indefinite. After a certain point, the energy imparted to the waters by a steady wind is dissipated by wave breaking (often in the form ofwhitecaps). When this occurs and the waves can no longer grow, the sea state is said to be a 'fully developed'. When waves are being generated by strong winds in a storm, the sea surface generally looks very chaotic, with lots of short, steep waves of varying heights. In calm areas far from strong winds, ocean waves often have quite a different aspect, forming long, rolling peaks of uniform shape. For this reason, physical oceanographers differentiate between two types of surface waves: seas and swells. Seas refer to short-period waves that are still being created by winds or are very close to the area in which they were generated. Swells refer to waves that have
Waves - disturbances of water - are a constant presence in the world's oceans.
Because waves travel all across the globe, transmitting vast amounts of energy,
understanding their motions and characteristics is essential. The forces generatedby waves are the main factor impacting the geometry of beaches, the transport of
sand and other sediments in the nearshore region, and the stresses and strains on
coastal structures. When waves are large, they can also pose a significant threat to
commercial shipping, recreational boaters, and the beachgoing public. Thus forensuring sound coastal planning and public safety, wave measurement and analysisis of great importance.
The discussion below is largely based on Part II, Chapter 1 of the Coastal
Engineering Manual (CEM), published by the United States Army Corps of Engineers'Coastal and Hydraulics Laboratory. For more details, we recommend referring
directly to the CEM.
Wave Generation
Waves are generated by forces that disturb a body of water. They can result from a
wide range of forces - the gravitational pull of the sun and the moon, underwaterearthquakes and landslides, the movements of boats and swimmers. The vast
majority of ocean waves, however, are generated by wind.
Out in the ocean, as the wind blows across a smooth water surface, air molecules
push against the water. This friction between the air and water pushes up tinyridges or ripples on the ocean surface. As the wind continues to blow, these ripples
increase in size, eventually growing into waves that may reach many meters inheight.
Three factors determine how large wind-generated waves can become. The firstfactor is wind speed, and the second factor is wind duration, or the the length of
time the wind blows. The final factor is the fetch, the distance over which the wind
blows without a change in direction. The faster the wind, the longer it blows, andthe larger the fetch, the bigger the waves that will result. But the growth of wind-
generated ocean waves is not indefinite. After a certain point, the energy impartedto the waters by a steady wind is dissipated by wave breaking (often in the form of
whitecaps). When this occurs and the waves can no longer grow, the sea state is
said to be a 'fully developed'.When waves are being generated by strong winds in a storm, the sea surface
generally looks very chaotic, with lots of short, steep waves of varying heights. In
calm areas far from strong winds, ocean waves often have quite a different aspect,forming long, rolling peaks of uniform shape. For this reason, physicaloceanographers differentiate between two types of surface waves: seas and swells.
Seas refer to short-period waves that are still being created by winds or are very
close to the area in which they were generated. Swells refer to waves that have
moved out of the generating area, far from the influence of the winds that madethem.
In general, seas are short-crested and irregular, and their surface appears muchmore disturbed than for swells. Swells, on the other hand, have smooth, well-
defined crests and relatively long periods. Swell is more uniform and regular thanseas because wave energy becomes more organized as it travel longs distances.
Longer period waves move faster than short period waves, and reach distant sites
first. In addition, wave energy is dissipated as waves travel (from friction,turbulence, etc.), and short-period wave components lose their energy more readilythan long-period components. As a consequence of these processes, swells form
longer, smoother, more uniform waves than seas.
Wave Dynamics
Looking out at the water, an ocean wave in deep water may appear to be a massive
moving object - a wall of water traveling across the sea surface. But in fact thewater is not moving along with the wave. The surface of the water - and anything
floating atop it, like a boat or buoy - simply bobs up and down, moving in a
circular, rise-and-fall pattern. In a wave, it is the disturbance and its associatedenergy that travel from place to place, not the ocean water. An ocean wave is
therefore a flow of energy, travelling from its source to its eventual break-up. This
break up may occur out in the middle of the ocean, or near the coast in thesurfzone.
In order to understand the motion and behavior of waves, it helps to consider
simple waves: waves that can be described in simple mathematical terms.
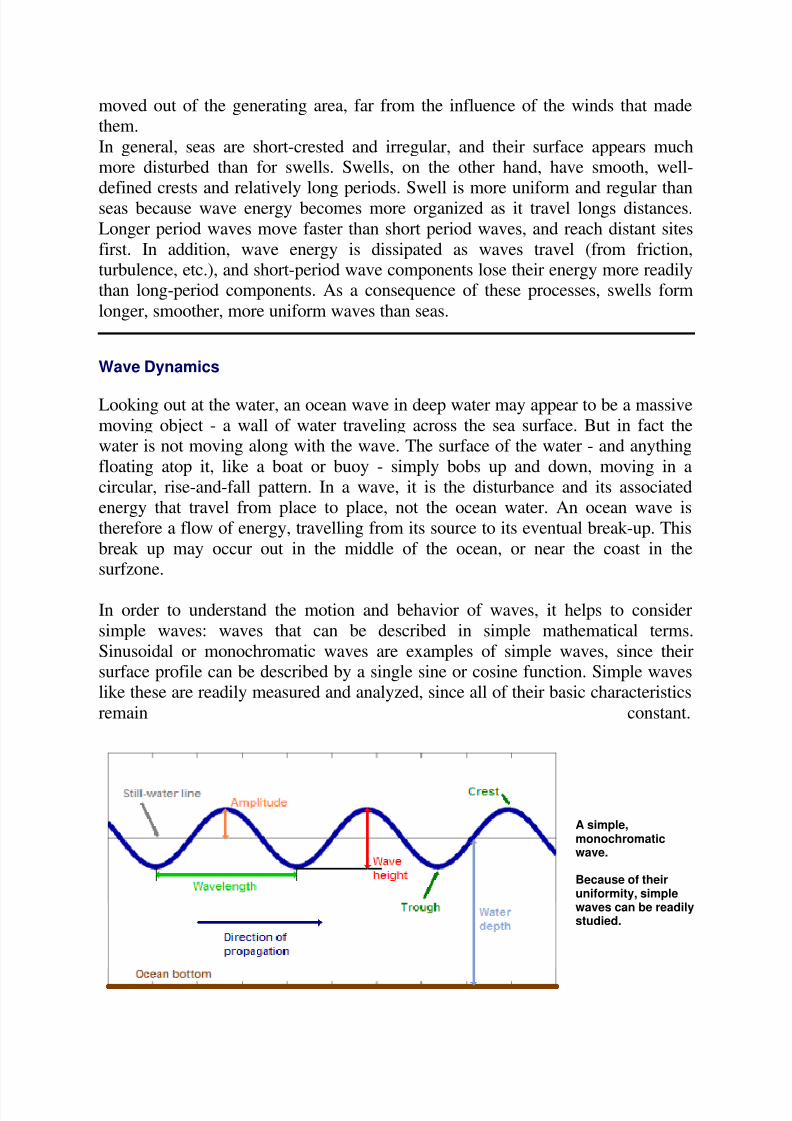
Sinusoidal or monochromatic waves are examples of simple waves, since theirsurface profile can be described by a single sine or cosine function. Simple waveslike these are readily measured and analyzed, since all of their basic characteristics
remain constant.
A simple,monochromaticwave.
Because of theiruniformity, simplewaves can be readilystudied.
Still-Water Line - The level of the sea surface if it were perfectly calm and
flat.
Crest - The highest point on the wave above the still-water line. Trough - The lowest point on the wave below the still-water line. Wave Height - The vertical distance between crest and trough.
Wavelength - The horizontal distance between successive crests or troughs. Wave Period - The time it takes for one complete wave to pass a particular
point. Wave Frequency - The number of waves that pass a particular point in a given
time period.
Amplitude - One-half the wave height or the distance from either the crest or
the trough to the still-water line. Depth - the distance from the ocean bottom to the still-water line.
Direction of Propagation - the direction in which a wave is travelling.
The motion and behavior of simple sinusoidal waves can be fully described when
the wavelength (L), height (H), period (T), and depth (d) are known. For instance,in deep water - when the depth is greater than one-half the wavelength - wavespeed can be determined from the wave size. In shallow water, on the other hand,
wave speed depends primarily on water depth.
Similarly, wave height is limited by both depth and wavelength. For a given water
depth and wave period, there is a maximum height limit above which a wave
becomes unstable and breaks. In deep water this upper limit of wave height - calledbreaking wave height - is a function of the wavelength. In shallow water, however,
it is a function of both depth and wavelength. (Studies suggest the limiting wavesteepness to be H/L = 0.141 in deep water and H/d = 0.83 for solitary waves in
shallow water.)
Irregular Waves
Although simple waves are readily analyzed, in their perfect regularity they do not
accurately depict the variability of ocean waves. Looking out at the sea, one neversees a constant progression of identical waves. Instead, the sea surface is composed
of waves of varying heights and periods moving in differing directions. When the
wind is blowing and the waves are growing in response, the seas tend to beconfused: a wide range of heights and periods is observed. Swell is more regular,but it too is fundamentally irregular in nature, with some variablility in height and
period. In fact, highly regular waves can be generated in the laboratory but are rare
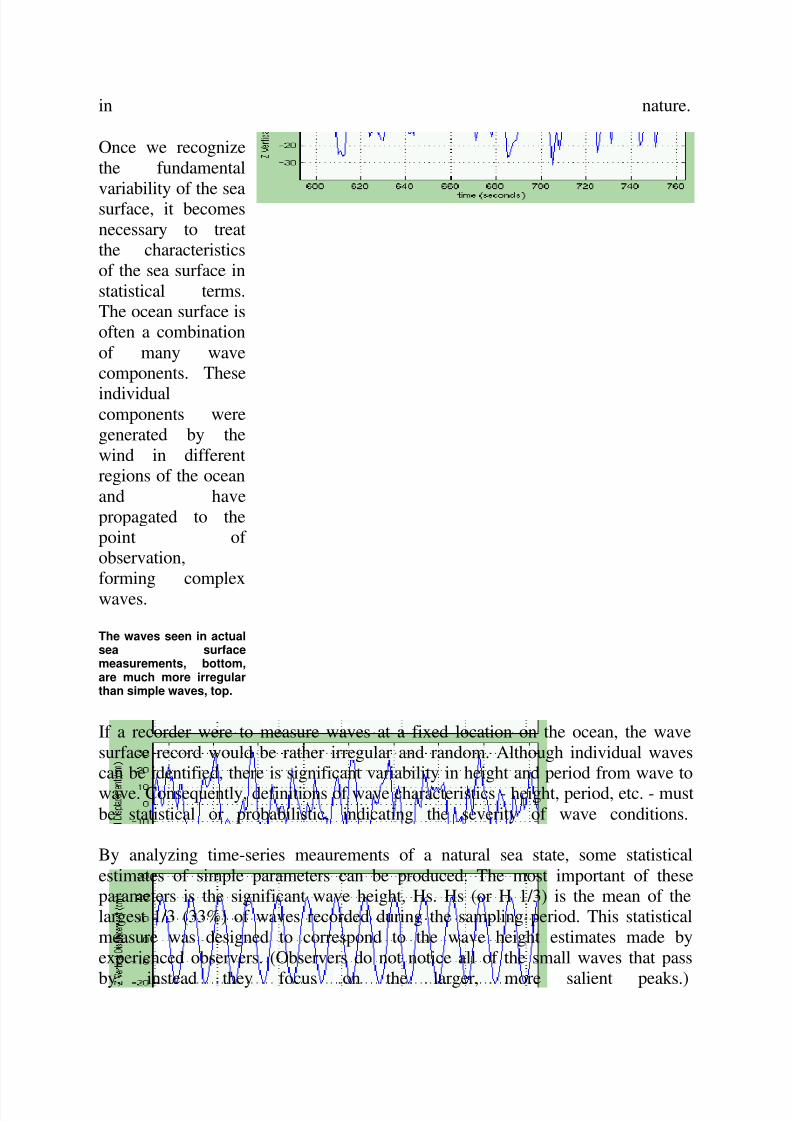
statistical terms.The ocean surface isoften a combination
of many wavecomponents. These
individualcomponents weregenerated by the
wind in differentregions of the ocean
and have
propagated to thepoint of observation,
forming complex
waves.
The waves seen in actualsea surfacemeasurements, bottom,are much more irregularthan simple waves, top.
If a recorder were to measure waves at a fixed location on the ocean, the wave
surface record would be rather irregular and random. Although individual wavescan be identified, there is significant variability in height and period from wave towave. Consequently, definitions of wave characteristics - height, period, etc. - must
be statistical or probabilistic, indicating the severity of wave conditions.
By analyzing time-series meaurements of a natural sea state, some statistical
estimates of simple parameters can be produced. The most important of theseparameters is the significant wave height, Hs. Hs (or H 1/3) is the mean of thelargest 1/3 (33%) of waves recorded during the sampling period. This statistical
measure was designed to correspond to the wave height estimates made by
experienced observers. (Observers do not notice all of the small waves that pass
by; instead they focus on the larger, more salient peaks.)
Since ocean conditions are constantly changing, measures like significant waveheight are short-term statistics, calculated for sample periods that are generally one
hour or less. (The majority of CDIP's parameters are calculated for periods from 26to 30 minutes.) Moreover, it is important to remember that the significant wave
height is a statistical measure, and it is not intended to correspond to any specificwave. During the sampling period there will be many waves smaller than the Hs,
and some that are larger. Statistically, the largest wave in a 1000-wave sample is
likely to be nearly two times (1.86x) the significant wave height!
A number of other wave parameters - like Ta, the average period - are measured to
describe natural sea states. Yet even taken together, the basic wave parameters givevery limited information about wave characteristics and behavior. A single Hsvalue may correspond to a wide range of conditions, combining waves from any
number of different swells. For this reason, phyical oceanographers have
developed analyses that give more detailed, complete meaures of ocean waves.
Spectral Analysis
Two main approaches exist for treating complex waves: spectral anlysis and wave-by-wave (wave train) analysis. The more powerful and popular of these two
approaches is spectral analysis. Spectral analysis assumes that the sea state can be
considered as a combination or superposition of a large number of regularsinusoidal wave components with different frequencies, heights, and directions.
This is a very useful assumption in wave analysis since sea states are in factcomposed of waves from a number of different sources, each with its own
characteristic height, period, and direction of travel.
Mathematically, spectral analysis is based on the Fourier Transform of the seasurface. The Fourier Transform allows any continuous, zero-mean signal - like a
time-series record of the sea surface elevation - to be transformed into a summationof simple sine waves. These sine waves are the components of the sea state, each
with a distinct height, frequency, and direction. In other words, the spectralanalysis method determines the distribution of wave energy and average statistics
for each wave frequency by converting the time series of the wave record into a
wave spectrum. This is essentially a transformation from the time-domain to thefrequency-domain, and is accomplished most conveniently using a mathematicaltool known as the Fast Fourier Transform (FFT).
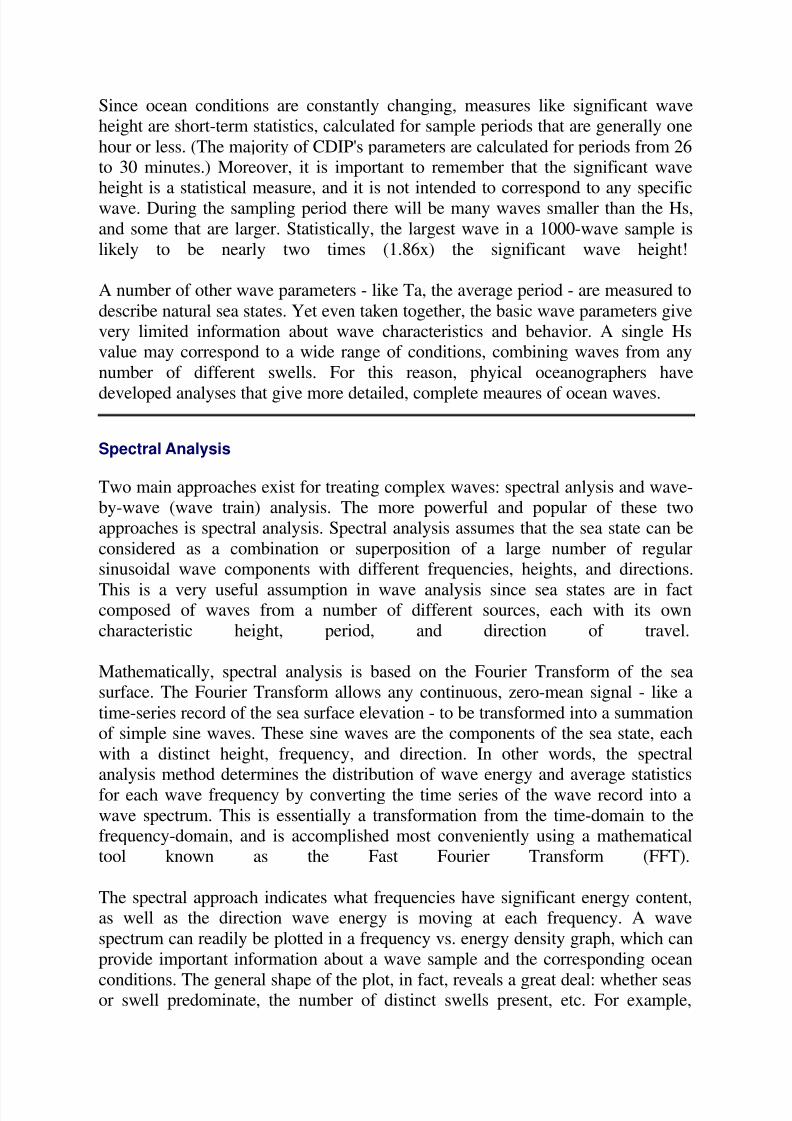
The spectral approach indicates what frequencies have significant energy content,as well as the direction wave energy is moving at each frequency. A wave
spectrum can readily be plotted in a frequency vs. energy density graph, which can
provide important information about a wave sample and the corresponding ocean
conditions. The general shape of the plot, in fact, reveals a great deal: whether seasor swell predominate, the number of distinct swells present, etc. For example,
during strong wind events, the spectrum tends to have a broad central peak. Forswell that has propagated a long distance from the source of generation, on the
other hand, the spectrum tends to have a single sharp, low-frequency (long period)peak.
The area under the frequency/energy density plot is Hmo, the spectral estimate of
significant wave height. In deep water H1/3 and Hm0 are very close in value andare both considered good estimates of Hs. In fact, all modern wave forecast models
report Hm0 as the significant wave height. Similarly, the Hs values reported from
wave gauge records is also Hm0. (It is worth noting, however, that in shallowwater H 1/3 may be significantly larger than Hmo, especially for low-frequency
waves.)
Gauging Waves
All of the valuable information produced by spectral wave analysis is based on one
thing: a time-series record of sea surface elevations. In general, time series are
analyzed over short periods, from 17 to 68 minutes, and are measured at around
There are two main types of sensors used to measure sea surface elevation,pressure sensors and buoys. Pressure sensors are mounted at a fixed position
underwater, and they measure the height of the water column that passes abovethem. As wave crests pass by, the height of the water column increases; when
troughs approach, the water column height falls. By deducting the depth of thesensor from the water column heights, a record of sea surface elevations can be
generated.
Buoys ride atop the surface of the ocean. Equipped with accelerometers to recordtheir own movements, buoys rise with the wave crests and fall with the troughs.
Since buoys are always floating on the sea surface, by recording their ownmovements they are in fact recording the movements of the sea surface. Readingsfrom the accelerometers inside the buoys can be used to calculate the buoys'
vertical displacements; these values are also a record of sea surface elevation.
A record of sea surface elevations from a single point is enough to generate an
energy spectrum. To determine the direction of the waves and generate adirectional spectrum, however, more information is needed. One way to generate a
directional spectrum is to measure the same parameter - such as pressure - at aseries of nearby locations. CDIP's early directional measurements, for instance,were all recorded by square arrays of pressure sensors, measuring 10 meters on a
side.
The other way to produce a directional spectrum is by measuring different
parameters at the same point. This is the approach used in directional buoys, which
measure pitch and roll in addition to vertical heave. Although CDIP has relied onpressure sensor arrays and directional buoys for its directional measurements, other
instruments can also be used. For instance, the p-U-V technique uses a pressuregauge and a horizontal component current meter in almost the same location to
measure the wave field. Other techniques for directional wave measurement
include arrays of surface-piercing wires, triaxial current meters, acoustic dopplercurrent meters, and radars.
Surge and Energy Basin
For measuring sea and swell - wave motions with periods under 40 seconds or so -CDIP's wave gauging is as described above. CDIP's pressure sensors, however,have also been used to measure surge, water level changes with periods between a
minute and an hour. Surge is created by atmospheric and seismic forces, and fallsin between standard wind wave motion and tidal motions.
For gauging surge, the sampling and processing steps are somewhat different.
Initially, the sample rates of pressure sensors intended to detect surge were set to
0.125 Hz (1 sample every 8 seconds) due to the limited space for storing data. Asdata storage became more affordable, sample rates moved to 1 Hz. The pre-
processing of surge data differs from non-surge data due to the long elapsed timeof the data set (approximately 2.3-4.6 hours). For these data we remove the tidal
component. For measurements that took place in areas where the wave height (i.e.energy in the 8-30 second range) is low, such as harbors or protected inlets, many
of the pre-processing data quality checks (developed for open ocean waves) are by-passed.
An important type of surge is basin surge (or 'energy basin'), surge that occurswithin a partially enclosed area such as a man-made harbour or marina. At severallocations (e.g. Barbers Point, Kahalui, and Noyo), studies were done to
simultaneously detect surge inside of a local harbor and outside the harbor in theopen ocean. These studies were able to correlate wave and surge activity of theopen ocean with destructive resonant surge within the harbor basins.
Hurricane events
Hurricanes, tropical cyclones born in the warm waters of the Atlantic Ocean,
Carribean Sea and Gulf of Mexico, are an annual threat to the East and Gulf coasts
of the U.S. The strong winds, large waves, and storm surge associated with thesestorms can cause severe coastal erosion, flooding and damage to property. Data
from CDIP buoys assist in the coastal planning efforts to mitigate the negative
effects of hurricanes. For more details, please refer to our Hurricane Events page.
Tsunami events
All of the discussion above has been directed towards wind-generated waves,
waves which form the focus of CDIP's work. Tsunamis are a separate class of
ocean wave altogether. Generated by undersea earthquakes, landslides, and
volcanic eruptions instead of wind, tsunamis differ greatly in their dynamics. They
have far longer wavelengths and periods than wind-generated waves, and travel at
far greater speeds. Instead of periods of 30 seconds or less, tsunamis have periods
of several minutes to one hour; instead of traveling at speeds under 100 km/hr, theyoften move at speeds of 700 km/hr or more.
Since the dynamics of tsunamis contrast so dramatically with wind-generated
waves, many of CDIP's sensors are not equipped to measure them. Our buoys, for
instance, do not measure wave motions with periods greater than 40 seconds; they
cannot record tsunamis. The underwater pressure sensors used by CDIP, however,
do resolve sea level changes over longer periods, and can be used to study and
analyze the motions of tsunamis. Over the years they have recorded a number of