A Longitudinal Study funded by the DfEE 1997-2003 department for education and skills Technical Paper 4 – June 1999 Parent, family and child characteristics in relation to type of pre-school and socio-economic differences The Effective Provision of Pre-School Education (EPPE) Project
Transcript
A Longitudinal Study funded by the DfEE 1997-2003
department for
education and skills
Technical Paper 4 – June 1999
Parent, family and child characteristics in relation to type of pre-school and socio-economic differences
Th
e Effectiv
e Pro
visio
n o
f Pre-Sch
oo
l Ed
ucatio
n (E
PP
E) P
roject
The Effective Provision of Pre-School
Education [EPPE] Project
A longitudinal Study funded by the DfES
(1997 – 2003)
Technical Paper 4 – June 1999 Parent, family and child characteristics
in relation to type of pre-school and socio-economic differences
Address for correspondence:
EPPE Project University of London Institute of Education Tel:+44 (0) 207 612 6219 20 Bedford Way Fax:+44 (0) 207 612 6230 London WC1H 0AL Email: [email protected]
Technical Paper 4 PARENT, FAMILY AND CHILD CHARACTERISTICS
IN RELATION TO TYPE OF PRE-SCHOOL AND SOCIO-ECONOMIC DIFFERENCES
AUTHORS :
Edward Melhuish Kathy Sylva
Pam Sammons Iram Siraj-Blatchford
Brenda Taggart Anne Dobson
Marjorie Jeavons Katie Lewis
Maria Morahan Sharon Sadler
ACKNOWLEDGEMENT The EPPE project is a major five year study funded by the DfES. The research would not be possible without the support and co-operation of the six Local Authorities (LAs) and the many pre-school centres, primary schools, children and parents participating in the research. The important contribution of the Regional Research Officers Anne Dobson, Isabella Hughes, Marjorie Jeavons, Margaret Kehoe, Katie Lewis, Maria Morahan, Sharon Sadler and our part-time Research Assistants has been vital to the project's completion. We are grateful to both the project's Steering and Consultative Committee for their helpful advice on the study.
THE EPPE RESEARCH TEAM
Principal Investigators Professor Kathy Sylva Department of Educational Studies, University of Oxford
Professor Edward Melhuish Birkbeck, University of London
Professor Pam Sammons Institute of Education, University of London
Professor Iram Siraj-Blatchford Institute of Education, University of London
Research Co-ordinator Brenda Taggart Institute of Education, University of London
Regional Research Officers Anne Dobson Isabella Hughes Marjorie Jeavons Margaret Kehoe Katie Lewis Maria Morahan Sharon Sadler
First Published in September 1999 by the Institute of Education University of London 20 Bedford Way, London WC1H 0AL
Contents Page Number Overview of the Project 1 – 10
Executive Summary i – ii
Introduction 1
The Sample 1
Data collection and analysis 1
The Parents 2
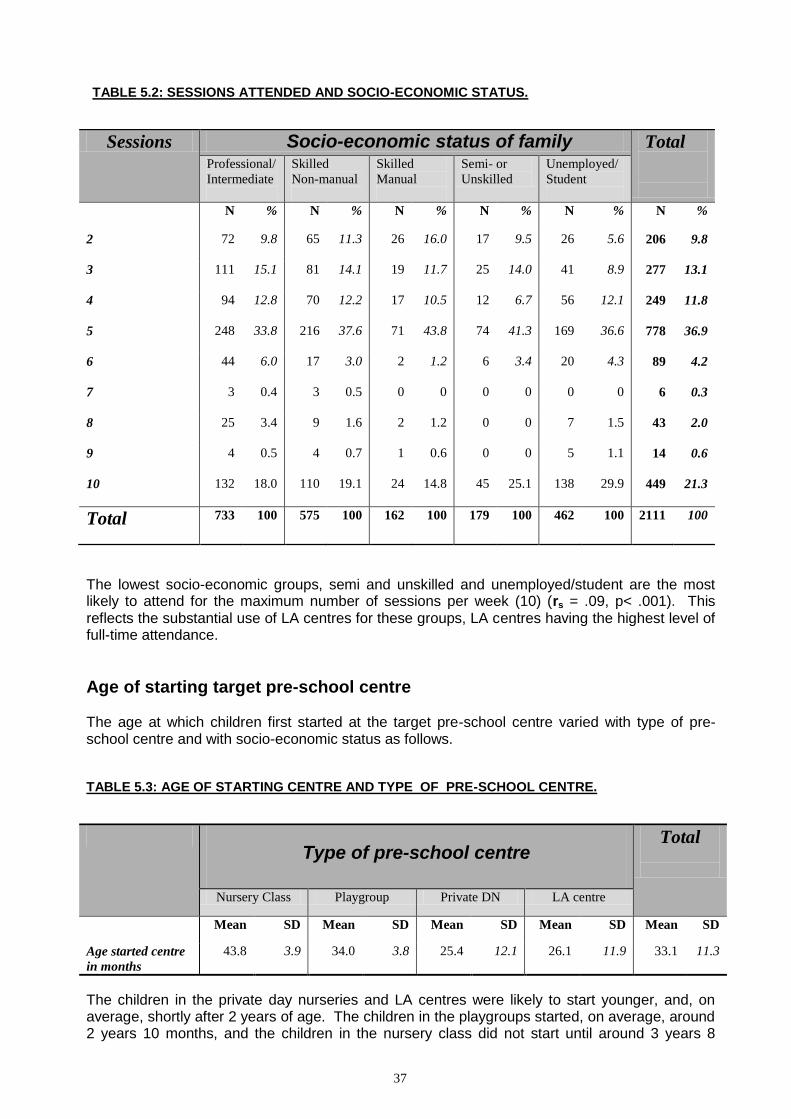
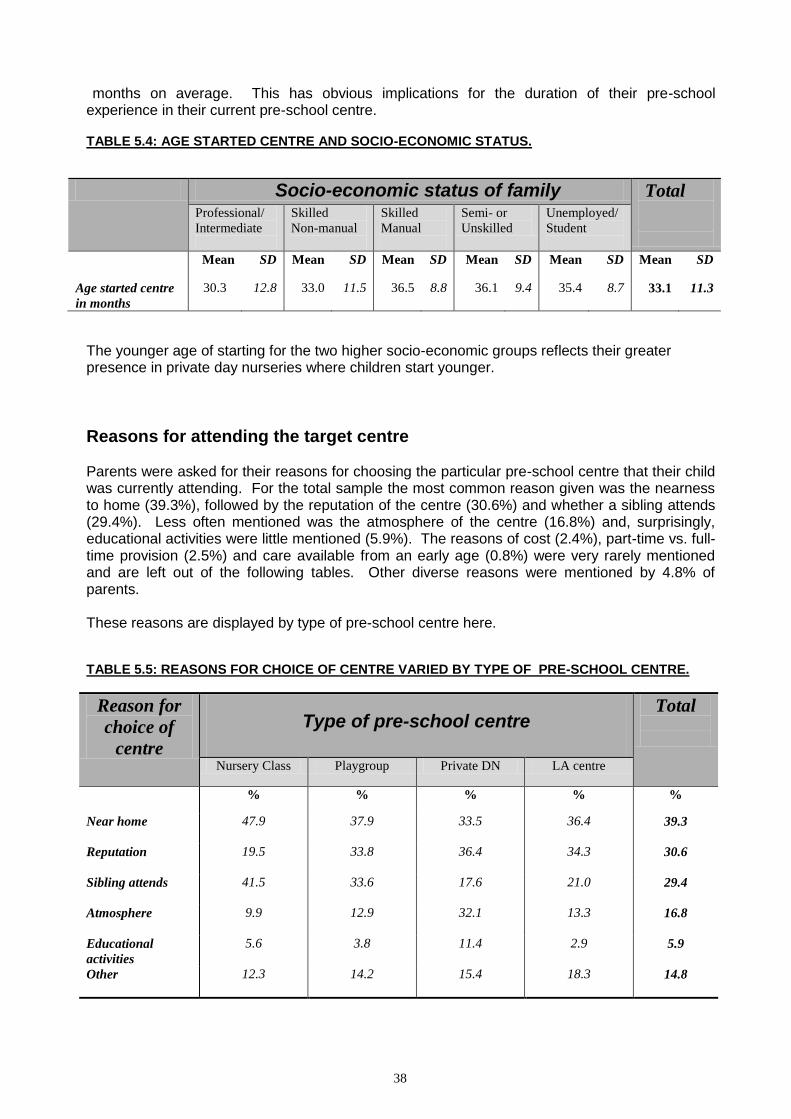
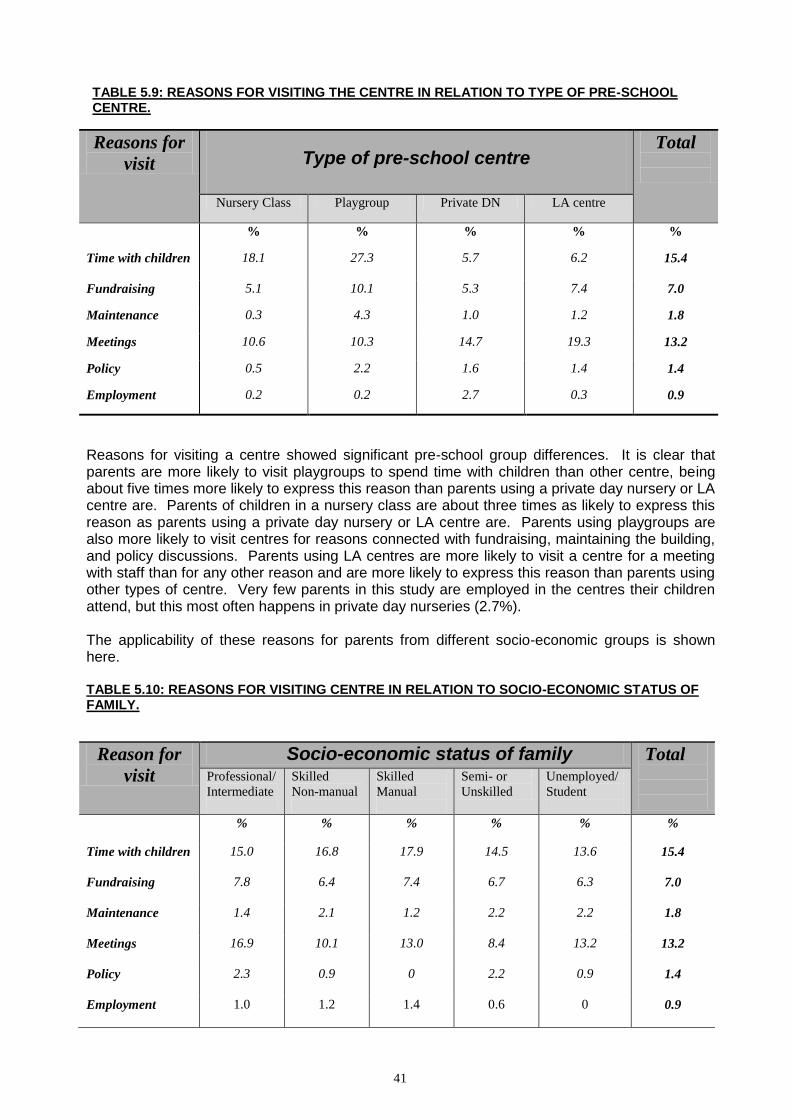
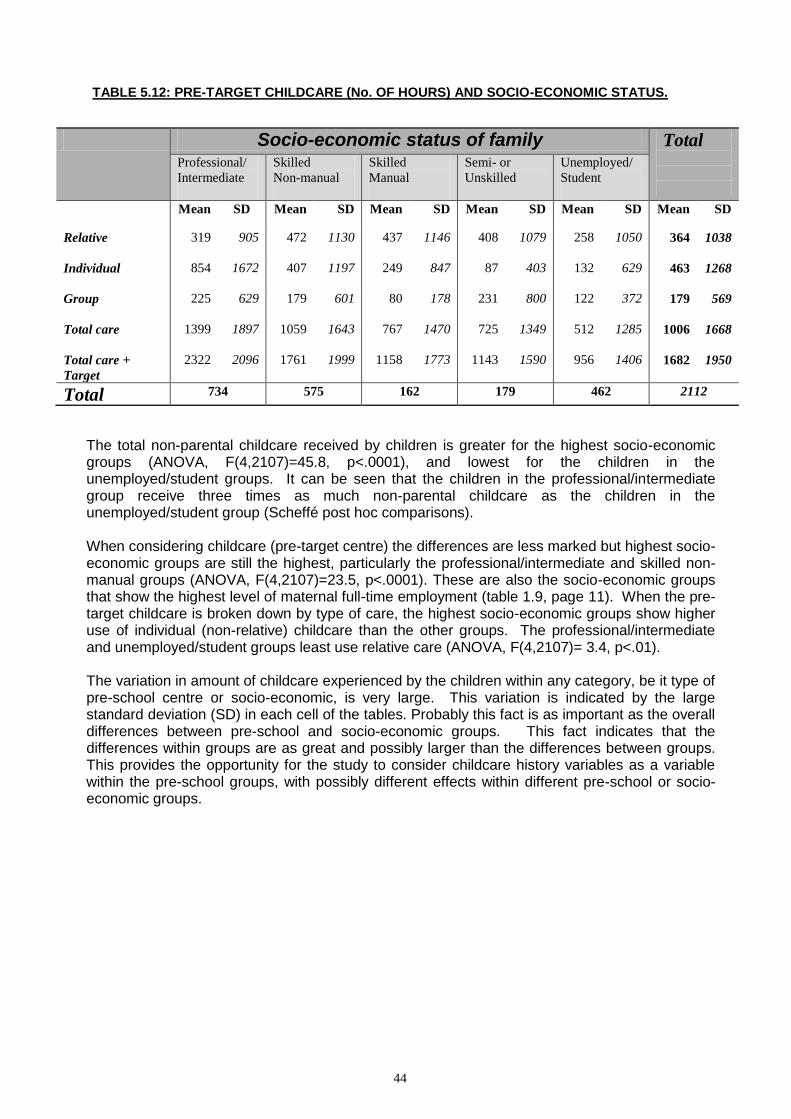
Labour market participation and socio-economic characteristics 2 Comparing the EPPE sample with the UK population 3 Types of pre-school and socio-economic status 5 Level of parental employment 6 Level of parental employment and use of childcare 8 Marital status 11 Parental age 12 Educational qualifications of the parents 15 Summary of parental characteristics 18 The Family 19 Family composition 19 Type of pre-school centre 19 Ethnicity and language 20 Summary of family characteristics 23 Child’s previous health, development and behaviour 24 Perinatal period 24 Health, development and behaviour 25 Physical health since birth 25 Development problems since birth 26 Behaviour problems since birth 27 Total health, developmental and behavioural problems 28 Recent health (last 6 months) 29 Life events for child 30 Summary of health, development and behaviour 31 Children’s activities in the home ` 32 Educational activities 32 Television watching in the home 33 Rules 34 Summary of children’s activities in the home 35 Pre-school provision and childcare history 36 The target pre-school centre 36 Age of starting target pre-school centre 37 Reasons for attending the target centre 38 Parental visits to the pre-school centre 39 Childcare history 42 Type of pre-school centre 42 Total number of non-parental caregivers 45
2
Contents Page Number Summary 46 References 47 Table 1 Socio-economic characteristics of the EPPE sample 2 Table 1.2 Occupational classification of mother 3 Table 1.3 Educational qualifications of mother 3 Table 1.4 Educational qualifications of father 3 Table 1.5 Occupational classification of mother 4 Table 1.6 Comparison with all UK women 16 – 59 years old 5 Table 1.7 Socio-economic status and use of pre-school centres 5 Table 1.8 Maternal employment and type of pre-school centre 6 Table 1.9 Maternal employment and socio-economic status 7 Table 1.10 Paternal employment and type of pre-school centre 7 Table 1.11 Paternal employment and socio-economic status 8 Table 1.12 Correlations between parents’ current hours of paid
employment and previous childcare use 9 Table 1.13 Sessions in centre and level of mother’s employment 10 Table 1.14 Correlations between parent’s hours of paid employment
and use of target pre-school centre 10 Table 1.15 Marital status and type of pre-school centre 11 Table 1.16 Marital status and socio-economic status of family 12 Table 1.17 Mother’s age and type of pre-school centre 12 Table 1.18 Mother’s age and socio-economic status of family 13 Table 1.19 Father’s age and type of pre-school centre 13 Table 1.20 Father’s age and socio-economic status of the family 14 Table 1.21 Educational qualifications of mother and type of pre-school centre 15 Table 1.22 Educational qualifications of mother and socio-economic status
of family 16 Table 1.23 Educational qualifications of father and type of pre-school centre 17 Table 1.24 Father’s qualifications and socio-economic status 18 Table 2.1 Type of pre-school centre and family type 19 Table 2.2 Socio-economic status and family type 20 Table 2.3 First language of child and type of pre-school centre 20 Table 2.4 First language of child and socio-economic status of family 21 Table 2.5 Ethnicity and type of pre-school centre 22 Table 2.6 Ethnicity and socio-economic status 23 Table 3.1 Perinatel period and type of pre-school centre 24 Table 3.2 Perinatel period and socio-economic status of the family 25 Table 3.3 Previous health problems and type of pre-school centre 25 Table 3.4 Previous health problems and socio-economic status 26 Table 3.5 Previous development problems and type of pre-school centre 26 Table 3.6 Previous development problems and socio-economic status 27 Table 3.7 Behaviour problems and type of pre-school centre 27 Table 3.8 Behaviour problems and socio-economic status of the family 28 Table 3.9 Overall previous problems and type of pre-school centre 28 Table 3.10 Overall previous problems and socio-economic status of the family 29 Table 3.11 Health index for last 6 months by type of pre-school centre 29 Table 3.12 Health index for last 6 months by socio-economic group 30
3
Contents Page Number Table 3.13 Number of disruptive life events and type of pre-school centre 30 Table 3.14 Number of disruptive life events and socio-economic status of family 31 Table 4.1 Educational environment and type of pre-school centre 32 Table 4.2 Educational environment and socio-economic status 32 Table 4.3 Amount of TV and type of pre-school centre 33 Table 4.4 Amount of TV and socio-economic status of family 33 Table 4.5 Rules for TV or video and type of pre-school centre 34 Table 4.6 Rules for TV or video and socio-economic status 34 Table 4.7 Rules relating to bedtime and type of pre-school centre 35 Table 4.8 Rules relating to bedtime and socio-economic status of the family 35 Table 5.1 Sessions attended and type of pre-school centre 36 Table 5.2 Sessions attended and socio-economic status 37 Table 5.3 Age of starting centre and type of pre-school centre 37 Table 5.4 Age of starting centre and socio-economic status 38 Table 5.5 Reasons for choice of centre varied by type of pre-school centre 38 Table 5.6 Reasons for choice of centre varied by socio-economic status of family 39 Table 5.7 Parental visits to centre varied with type of pre-school centre 40 Table 5.8 Parental visits to centre varied with socio-economic status 40 Table 5.9 Reasons for visiting the centre in relation to type of pre-school centre 41 Table 5.10 Reasons for visiting the centre in relation to socio-economic status
of family 41 Table 5.11 Pre-target childcare (no. of hours in child’s life) and type of
pre-school centre 43 Table 5.12 Pre-target childcare (no. of hours) and socio-economic status 44 Table 5.13 Total of non-parental caregivers and type of pre-school centre 45 Table 5.14 Total of non-parental caregivers and socio-economic status 45
1
Effective Provision of Pre-school Education
“EPPE”
Overview of the Project
This series of 12 reports describes the research on effective pre-school provision funded by the UK Department for Education & Employment (DfEE). Further details appear in Technical Paper 1 (Sylva, Sammons, Melhuish, Siraj-Blatchford & Taggart 1999). This longitudinal study assesses the attainment and development of children followed longitudinally between the ages of 3 and 7 years. Three thousand children were recruited to the study over the period January 1997 to April 1999 from 141 pre-school centres. Initially 114 centres from four types of provision were selected for the study but in September 1998 an extension to the main study was implemented to include innovative forms of provision, including ‘combined education and care’ (Siraj-Blatchford et al. 1997). Both qualitative and quantitative methods (including multilevel modelling) have been used to explore the effects of individual pre-school centres on children's attainment and social/behavioural development at entry to school and any continuing effects on such outcomes at the end of Key Stage 1 (age 7). In addition to centre effects, the study investigates the contribution to children’s development of individual and family characteristics such as gender, ethnicity, language, parental education and employment. This overview describes the research design and discusses a variety of research issues (methodological and practical) in investigating the impact of pre-school provision on children’s developmental progress. A parallel study is being carried out in Northern Ireland. There have been many initiatives intended to improve educational outcomes for young children. Will these initiatives work? Will they enable children to enter school ‘more ready’ to learn, or achieve more at the end of Key Stage 1? Which are the most effective ways to educate young children? The research project described in this paper is part of the new emphasis on ensuring ‘a good start’ for children.
PREVIOUS RESEARCH ON THE EFFECTS OF EARLY EDUCATION IN THE UK
There has been little large-scale, systematic research on the effects of early childhood education in the UK. The ‘Start Right’ Enquiry (Ball 1994; Sylva 1994) reviewed the evidence of British research and concluded that small-scale studies suggested a positive impact but that large-scale research was inconclusive. The Start Right enquiry recommended more rigorous longitudinal studies with baseline measures so that the ‘value added’ to children’s development by pre-school education could be established. Research evidence elsewhere on the effects of different kinds of pre-school environment on children's development (Melhuish et al. 1990; Melhuish 1993; Sylva & Wiltshire 1993; Schweinhart & Weikart 1997; Borge & Melhuish, 1995; National Institute of Child Health Development 1997) suggests positive outcomes. Some researchers have examined the impact of particular characteristics, e.g. gender and attendance on children's adjustment to nursery classes (Davies & Brember 1992), or adopted cross-sectional designs to explore the impact of different types of pre-school provision (Davies & Brember 1997). Feinstein, Robertson & Symons (1998) attempted to evaluate the effects of pre-schooling on children’s subsequent progress but birth cohort designs may not be appropriate for the study of the influence of pre-school education. The absence of data about children’s attainments at entry to pre-school means that neither the British Cohort Study (1970) nor the National Child Development Study (1958) can be used to explore the effects of pre-school education on children’s progress. These studies are also limited by the time lapse and many changes in the nature of pre-school provision which have
2
occurred. To date no research using multilevel models (Goldstein 1987) has been used to investigate the impact of both type of provision and individual centre effects. Thus little research in the UK has explored whether some forms of provision have greater benefits than others. Schagen (1994) attempted multilevel modelling but did not have adequate control at entry to pre-school. In the UK there is a long tradition of variation in pre-school provision both between types (e.g. playgroup, local authority or private nursery or nursery classes) and in different parts of the country reflecting Local Authority funding and geographical conditions (i.e. urban/rural and local access to centres). A series of reports (House of Commons Select Committee 1989; DES Rumbold Report 1990; Ball 1994) have questioned whether Britain's pre-school education is as effective as it might be and have urged better co-ordination of services and research into the impact of different forms of provision (Siraj-Blatchford 1995). The EPPE project is thus the first large-scale British study on the effects of different kinds of pre-school provision and the impact of attendance at individual centres.
OVERVIEW OF RESEARCH METHODS
The EPPE project is a major study instituted in 1996 to investigate three issues which have important implications for policy and practice:
• the effects on children of different types of pre-school provision, • the ‘structural’ (e.g. adult-child ratios) and ‘process’ characteristics (e.g. interaction styles) of more
effective pre-school centres, and • the interaction between child and family characteristics and the kind of pre-school provision a
child experiences. An educational effectiveness research design was chosen to investigate these topics because this enabled the research team to investigate the progress and development of individual children (including the impact of personal, socio-economic and family characteristics), and the effect of individual pre-school centres on children's outcomes at both entry to school (the start of Reception which children can enter between the ages of 4 and 5 plus) and at the end of Key Stage 1 (age 7 plus). Such research designs are well suited to social and educational research with an institutional focus (Paterson & Goldstein 1991). The growing field of school effectiveness research has developed an appropriate methodology for the separation of intake and school influences on children's progress using so called 'value added' multilevel models (Goldstein 1987, 1995). As yet, however, such techniques have not been applied to the pre-school sector, although recent examples of value added research for younger ages at the primary level have been provided by Tymms et al. 1997; Sammons & Smees 1998; Jesson et al. 1997; Strand 1997; and Yang & Goldstein 1997. These have examined the relationship between baseline assessment at reception to infant school through to Key Stage 1 (age 7 plus years). School effectiveness research during the 1970s and 1980s addressed the question "Does the particular school attended by a child make a difference?" (Mortimore et al. 1988; Tizard et al. 1988). More recently the question of internal variations in effectiveness, teacher/class level variations and stability in effects of particular schools over time have assumed importance (e.g. Luyten 1994; 1995; Hill & Rowe 1996; Sammons 1996). This is the first research to examine the impact of individual pre-school centres using multilevel approaches. The EPPE project is designed to examine both the impact of type of pre-school provision as well as allow the identification of particular pre-school characteristics which have longer term effects. It is also designed to establish whether there are differences in the effects of individual pre-school centres on children's progress and development. In addition, the project explores the impact of pre-school provision for different groups of children and the extent to which pre-schools are effective in promoting different kinds of outcomes (cognitive and social/behavioural).
3
The 8 aims of the EPPE Project
• To produce a detailed description of the 'career paths' of a large sample of children and their
families between entry into pre-school education and completion (or near completion) of Key Stage 1.
• To compare and contrast the developmental progress of 3,000+ children from a wide range of
social and cultural backgrounds who have differing pre-school experiences including early entry to Reception from home.
• To separate out the effects of pre-school experience from the effects of education in the period
between Reception and Year 2. • To establish whether some pre-school centres are more effective than others in promoting
children's cognitive and social/emotional development during the pre-school years (ages 3-5) and across Key Stage 1 (5-7 years).
• To discover the individual characteristics (structural and process) of pre-school education in those
centres found to be most effective. • To investigate differences in the progress of different groups of children, e.g. second language
learners of English, children from disadvantaged backgrounds and both genders. • To investigate the medium-term effects of pre-school education on educational performance at
Key Stage 1 in a way which will allow the possibility of longitudinal follow-up at later ages to establish long-term effects, if any.
• To relate the use of pre-school provision to parental labour market participation.
The sample: regions, centres and children
In order to maximise the likelihood of identifying the effects of individual centres and also the effects of various types of provision, the EPPE sample was stratified by type of centre and geographical location.
• Six English Local Authorities (LAs) in five regions were chosen strategically to participate in the research. These were selected to cover provision in urban, suburban and rural areas and a range of ethnic diversity and social disadvantage. (Another related project covering Northern Ireland was instituted in April 1998 [Melhuish et al. 1997]. This will enable comparison of findings across different geographical contexts.)
• Six main types of provision are included in the study (the most common forms of current
provision; playgroups, local authority or voluntary day nurseries, private day nurseries, nursery schools, nursery classes, and centres combining care and education. Centres were selected randomly within each type of provision in each authority.
In order to enable comparison of centre and type of provision effects the project was designed to recruit 500 children, 20 in each of 20-25 centres, from the six types of provision, thus giving a total sample of approximately 3000 children and 140 centres1. In some LAs certain forms of provision are less common and others more typical. Within each LA, centres of each type were selected by stratified random sampling and, due to the small size of some centres in the project (e.g. rural playgroups), more of these centres were recruited than originally proposed, bringing the sample total to 141 centres and over 3000 children.
1 The nursery school and combined centre samples were added in 1998 and their cohorts will be assessed somewhat later; results will be reported separately and in combined form.
4
Children and their families were selected randomly in each centre to participate in the EPPE Project. All parents gave written permission for their children to participate. In order to examine the impact of no pre-school provision, it was proposed to recruit an additional sample of 500 children pre-school experience from the reception classes which EPPE children entered. However in the five regions selected a sample of only 200+ children was available for this ‘home’ category. The progress and development of pre-school children in the EPPE sample is being followed over four years until the end of Key Stage 1. Details about length of sessions, number of sessions normally attended per week and child attendance have been collected to enable the amount of pre-school education experienced to be quantified for each child in the sample. Two complicating factors are that a substantial proportion of children have moved from one form of pre-school provision to another (e.g. from playgroup to nursery class) and some will attend more than one centre in a week. Careful records are necessary in order to examine issues of stability and continuity, and to document the range of pre-school experiences to which individual children can be exposed.
Child assessments
Around the third birthday, or up to a year later if the child entered pre-school provision after three, each child was assessed by a researcher on four cognitive tasks: verbal comprehension, naming vocabulary, knowledge of similarities seen in pictures, and block building. A profile of the child’s social and emotional adjustment was completed by the pre-school educator who knew the child best. If the child changed pre-school before school entry, he or she was assessed again. At school entry, a similar cognitive battery was administered along with knowledge of the alphabet and rhyme/alliteration. The Reception teacher completed the social emotional profile. Further assessments were made at exit from Reception and at the end of Years 1 and 2. In addition to standardised tests of reading and mathematics, information on National Assessments will be collected along with attendance and special needs. At age 7, children will also be invited to report themselves on their attitudes to school.
Measuring child/family characteristics known to have an impact on children’s development
1) Information on individual ‘child factors’ such as gender, language, health and birth order was
collected at parent interview. 2) Family factors were investigated also. Parent interviews provided detailed information about parent
education, occupation and employment history, family structure and attendance history. In addition, details about the child's day care history, parental attitudes and involvement in educational activities (e.g. reading to child, teaching nursery rhymes, television viewing etc) have been collected and analysed.
Pre-school Characteristics and Processes
Regional researchers liaised in each authority with a Regional Coordinator, a senior local authority officer with responsibility for Early Years who arranged ‘introductions’ to centres and key staff. Regional researchers interviewed centre managers on: group size, child staff ratio, staff training, aims, policies, curriculum, parental involvement, etc.
5
‘Process’ characteristics such as the day-to-day functioning within settings (e.g. child-staff interaction, child-child interaction, and structuring of children's activities) were also studied. The Early Childhood Environment Rating Scale (ECERS) which has been recently adapted (Harms, Clifford & Cryer 1998) and the Caregiver Interaction Scale (Arnett 1989) were also administered. The ECERS includes the following sub-scales:
• Space and furnishings • Personal care routines • Language reasoning • Activities • Interaction • Programme structure • Parents and staffing
In order that the more educational aspects of English centres could be assessed, Sylva, Siraj-Blatchford, Taggart & Colman (unpublished) developed four additional ECERS sub-scales describing educational provision in terms of: Language, Mathematics, Science and the Environment, and Diversity.
Setting the centres in context
In addition to describing how each centre operated internally, qualitative interviews were conducted with centre managers to find out the links of each setting to local authority policy and training initiatives. Senior local authority officers from both Education and Social Services were also interviewed to find out how each local authority implemented Government early years policy, especially the Early Years Development Plans which were established to promote education and care partnerships across providers in each local authority.
Case Studies
In addition to the range of quantitative data collected about children, their families and their pre-school centres, detailed qualitative data will be collected using case studies of several “effective” pre-school centres (chosen retrospectively as ‘more effective’ on the basis of the multilevel analyses of intake and outcome measures covering the period baseline to entry into reception). This will add the fine-grained detail to how processes within centres articulate, establish and maintain good practice. The methodology of the EPPE project is thus mixed. These detailed case studies will use a variety of methods of data gathering, including documentary analysis, interviews and observations and the results will help to illuminate the characteristics of more successful pre-school centres and assist in the generation of guidance on good practice. Particular attention will be paid to parent involvement, teaching and learning processes, child-adult interaction and social factors in learning. Inevitably there are difficulties associated with the retrospective study of process characteristics of centres identified as more or less effective after children in the EPPE sample have transferred to school and it will be important to examine field notes and pre-school centre histories to establish the extent of change during the study period.
ANALYTIC STRATEGY
The EPPE research was designed to enable the linking of three sets of data: information about children's attainment and development (at different points in time), information about children's personal, social and family characteristics (e.g. age, gender, SES etc), and information about pre-school experience (type of centre and its characteristics).
6
Identifying individual centre effects and type of provision at entry to school
Longitudinal research is essential to enable the impact of child characteristics (personal, social and family) to be disentangled from any influence related to the particular pre-school centre attended. Multilevel models investigate the clustered nature of the child sample, children being nested within centres and centres within regions. The first phase of the analysis adopts these three levels in models which attempt to identify any centre effects at entry to reception class. Given the disparate nature of children's pre-school experience it is vital to ensure that the influences of age at assessment, amount and length of pre-school experience and pre-school attendance record are accounted for when estimating the effects of pre-school education. This information is also important in its own right to provide a detailed description of the range of pre-school provision experienced by different children and any differences in the patterns of provision used by specific groups of children/parents and their relationship to parents' labour market participation. Predictor variables for attainment at entry to reception will include prior attainment (verbal and non-verbal sub scales), social/emotional profiles, and child characteristics (personal, social and family). The EPPE multilevel analyses will seek to incorporate adjustment for measurement error and to examine differences in the performance of different groups of children at entry to pre-school and again at entry to reception classes. The extent to which any differences increase/decrease over this period will be explored, enabling equity issues to be addressed. After controlling for intake differences, the estimated impact of individual pre-school centres will be used to select approximately 12 ‘outlier’ centres from the 141 in the project for detailed case studies (see ‘Case Studies’ above). In addition, multilevel models will be used to test out the relationship between particular process quality characteristics of centres and children's cognitive and social/behavioural outcomes at the end of the pre-school period (entry to school). The extent to which it is possible to explain (statistically) the variation in children's scores on the various measures assessed at entry to reception classes will provide evidence about whether particular forms of provision have greater benefits in promoting such outcomes by the end of the pre-school period. Multilevel analyses will test out the impact of measures of pre-school process characteristics, such as the scores on various ECERS scales and Pre-School Centre structural characteristics such as ratios. This will provide evidence as to which measures are associated with better cognitive and social/behavioural outcomes in children.
Identifying continuing effects of pre-school centres at KS1
Cross-classified multilevel models have been used to examine the long term effects of primary schools on later secondary performance (Goldstein & Sammons, 1997). In the EPPE research it is planned to use such models to explore the possible mid-term effects of pre-school provision on later progress and attainment at primary school at age 7. The use of cross classified methods explicitly acknowledges that children's educational experiences are complex and that over time different institutions may influence cognitive and social/behavioural development for better or worse. This will allow the relative strength of any continuing effects of individual pre-school centre attendance to be ascertained, in comparison with the primary school influence.
THE LINKED STUDY IN NORTHERN IRELAND 1998-2003 The Effective Pre-school Provision in Northern Ireland (EPPNI) is part of EPPE and is under the directorship of Professor Edward Melhuish, Professor Kathy Sylva, Dr. Pam Sammons, and Dr. Iram Siraj-Blatchford. The study explores the characteristics of different kinds of early years provision and examines children’s development in pre-school, and influences on their later adjustment and progress at primary school up to age 7 years. It will help to identify the aspects of pre-school provision which have a positive impact on children’s attainment, progress, and development, and so provide guidance on good practice. The research involves 70 pre-school centres randomly selected throughout Northern Ireland. The study investigates all main types of pre-school provision attended by 3 to 4 year olds in Northern
7
Ireland: playgroups, day nurseries, nursery classes, nursery schools and reception groups and classes. The data from England and Northern Ireland offer opportunities for potentially useful comparisons.
SUMMARY
This “educational effectiveness” design of the EPPE research study enables modelling of the complicated effects of amount and type of pre-school provision (including attendance) experienced by children and their personal, social and family characteristics on subsequent progress and development. Assessment of both cognitive and social/behavioural outcomes has been made. The use of multilevel models for the analysis enables the impact of both type of provision and individual centres on children's pre-school outcomes (at age 5 and later at age 7) to be investigated. Moreover, the relationships between pre-school characteristics and children's development can be explored. The results of these analyses and the findings from the qualitative case studies of selected centres can inform both policy and practice. A series of 12 technical working papers will summarise the findings of the research. .
8
EPPE Technical Papers in the Series Technical Paper 1 – An Introduction to the Effective Provision of Pre-School Education (EPPE) Project ISBN: 0 85473 591 7 Published: Autumn 1999 Price £3.50 Technical Paper 2 – Characteristics of the Effective Provision of Pre-School Education (EPPE) Project sample at entry to the study ISBN: 0 85473 592 5 Published: Autumn 1999 Price £4.00 Technical Paper 3 – Contextualising EPPE: Interviews with Local Authority co-ordinators and centre managers ISBN: 0 85473 593 3 Published: Autumn 1999 Price £3.50 Technical Paper 4 – Parent, family and child characteristics in relation to type of Pre-School and socio-economic differences ISBN: 0 85473 594 1 Published: Autumn 1999 Price £4.00 Technical Paper 5 – Report on centre characteristics in the EPPE Study : (Interviews) ISBN: 0 85473 595 X Published: Autumn 2000 Price £5.00 Technical Paper 6 – Characteristics of the Centres in the EPPE Sample: Observational Profiles
ISBN: 0 85473 596 8 Published: Autumn 1999 Price £5.00 Technical Paper 6A – Characteristics of Pre-School Environments
ISBN: 0 85473 597 6 Published: Autumn 1999 Price £3.50 Technical Paper 7 – Social/behavioural and cognitive development at 3–4 years in relation to family background ISBN: 0 85473 598 4 Published: Spring 2001 Price £5.00 Technical Paper 8a – Measuring the Impact of Pre-School on Children's Cognitive Progress over the Pre-School Period ISBN: 0 85473 599 2 Published : Autumn 2002 Price £8.00 Technical Paper 8b – Measuring the Impact of Pre-School on Children's Social Behavioural Development over the Pre-School Period ISBN: 0 85473 684 2 Publication Date: Spring 2003 Technical Paper 9 – Report on age 6 assessment ISBN: 0 85473 600 X Publication Date: Summer 2003 Technical Paper 10 – Case Studies ISBN: 0 85473 601 8 Publication Date: Summer 2003 Technical Paper 11 – Report on the continuing effects of pre-school education at age 7
ISBN: 0 85473 602 6 Publication Date: Autumn 2003 Technical Paper 12 – The final report ISBN: 0 85473 603 4 Publication Date: Spring 2004 The Early Years Transition and Special Educational Needs (EYTSEN) is a linked project which draws on data from the EPPE study . EYTSEN Papers : Technical Paper 1 – Special needs across the Pre-School Period ISBN 085473 680 8
Published Autumn -2002 Price £6.00 Technical Paper 2 – Special needs in the Early Years at Primary School ISBN 085473 681 6
Publication Date Summer 2003. Technical Paper 3 – Special needs in the Early Years : The Parents’ Perspective ISBN 085473 682 4
Publication Date Summer 2003.
Ordering information The Bookshop at the Institute of Education. 20, Bedford Way. London WC1H OAL. Tel: 00 44 (0) 207 612 6050 Fax: 0207 612 6407 Email: [email protected] website: www.johnsmith.co.uk/ioe or The EPPE Office. The University of London, Institute of Education. 20 Bedford Way, London. WC1H OAL. U.K. Tel: 00 44 (0) 207 612 6219 Fax: 00 44 (0) 207 612 6230 Email: [email protected] Website: http://www.ioe.ac.uk/projects/eppe Please note : Prices will vary according to size of publication and quantities ordered.
Arnett, J. (1989) Caregivers in Day-Care Centres: Does training matter? Journal of Applied Developmental Psychology, 10, 541-552.
Ball, C. (1994) Startright: The Importance of Early Learning, London: RSA. Borge, A., & Melhuish, E., (1995) A Longitudinal Study of Childhood Behaviour Problems, Maternal Employment
and Day-care in Rural Norwegian Community, International Journal of Behavioural Development, 18, 23-42.
Davies, J. & Brember, I. (1992) The Effects of Gender, Attendance Period and Age on Children's Adjustment to
Nursery Classes, Research in Education, 47, 89-103. Davies, J, & Brember, I. (1997) The Effects of Pre-School Experience on Reading Attainment: a four year cross-
sectional study, Educational Psychology, 178, 3, 255-266. Department of Education & Science (1990) The Report of the Committee of Inquiry into the Quality of the
Educational Experience offered to 3- and 4-year olds (Rumbold, A), London: HMSO. Feinstein, L., Robertson, D. & Symons, J. (1998) Pre-school Education and Attainment in the NCDS and BCSI
Centre for Economic Performance, London Goldstein, H. (1987) Multilevel Models in Educational and Social Research, London: Charles Griffin and Co. Goldstein, H. (1995) Multilevel Statistical Models (2nd Edition), London: Edward Arnold. Goldstein, H. & Sammons, P. (1997) The Influence of Secondary and Junior Schools on Sixteen Year
Examination Performance: A Cross-Classified Multilevel Analysis, School Effectiveness and School Improvement, 8, (2): 219-230.
Harms, T., Clifford, R. & Cryer, D. (1998) Early Childhood Environment Rating Scale Revised, New York and
London: Teachers' College Press. Hill, P. & Rowe, K. (1996) Multilevel Modelling in School Effectiveness Research, School Effectiveness and
School Improvement, 7, (1): 1-34. House of Commons Select Committee (1989) The Education of Children 3-5, London: HMSO. Jesson, D., Bartlett, D., & Machon, C., (1997) Baseline Assessment and School Improvement - the use of data
from the assessment of children on entry to school to support the raising of standards, paper presented to the annual conference of the British Educational Research Association, University of York, September 1997.
Luyten, H. (1994) Stability of School Effects in Dutch Secondary Education: The impact of variance across
subjects and years, International Journal of Educational Research, 21, (2): 197-216. Luyten, H. (1995) Teacher Change and Instability Across Grades, School Effectiveness and School Improvement,
1, (1): 67-89. Melhuish, E.C. (1993) Pre-school care and education: Lessons from the 20th and the 21st century, International
Journal of Early Years Education, 1, 19-32. Melhuish, E.C., Lloyd, E., Martin, S. & Mooney, A. (1990) Type of day-care at 18 months: ii Relations with
Cognitive and Language Development, Journal of Child Psychology and Psychiatry, 31, 861-870. Melhuish, E.C., Sylva, K., Sammons, P. & Siraj-Blatchford, I. (1997) Effective Pre-School Provision in Northern
Ireland, proposal to the DfEE for research linked to the Effective Provision of Pre-school Education Project. Mortimore, P., Sammons, P., Stoll, L., Lewis, D. & Ecob, R. (1988) School Matters: The Junior Years, Wells:
Open Books. National Institute of Child Health & Development (1997) The effects of infant child care on infant-mother
attachment security: Restuls of the NICHD study of early child care, Child Development, 68, (5): 860-879.
10
Paterson, L. & Goldstein H. (1991) New statistical methods of analysing social structures: an introduction to
multilevel models, British Educational Research Journal, 17, (4): 387-393. Sammons, P. (1996) Complexities in the judgement of school effectiveness. Educational Research and Evaluation,
Vol. 2 113 – 149 Sammons, P. & Smees, R. (1998) Measuring Pupil Progress at Key Stage 1: using baseline assessment to
investigate value added. School Leadership and Management, Vol. 18, No. 3, pp.389 – 407 Schweinhart, L.J. & Weikart, D.P., (1997) Lasting Differences, The High/Scope preschool curriculum comparison
through age 23. High/Scope Press, Ypsilanti, Michigan. Siraj-Blatchford, I. (1995) Expanding Combined Nursery Provision: Bridging the gap between care and
education, in P Gammage and J Meighan The Early Years: The Way Forward, Nottingham: Education New Books.
Siraj-Blatchford, I., Sylva, K., Melhuish, E. & Sammons, P. (1997) Studying the Effects of Innovations in Nursery
School Provision, a proposal to the DfEE for research linked to the Effective Provision of Pre-school Education Project
Strand, S. (1997) Pupil Progress during Key Stage 1: A value added analysis of school effects, British
Educational Research Journal, 23, (4): 471-487. Sylva, K., Sammons, P., Melhuish, E., Siraj-Blatchford, I. & Taggart, B. (unpublished) Technical Paper 1. An
Introduction to the EPPE Project Sylva, K., Siraj-Blatchford, I., Taggart, B. & Colman, P. (forthcoming) The Early Childhood Environment Rating
Scales: 4 Curricular Subscales, London: Institute of Education. Sylva, K. (1994) A Curriculum for Early Learning. In Ball, C. (Ed.) Startright: The Importance of Early Learning,
London: RSA. Sylva, K. & Wiltshire, J. (1993) The Impact of Early Learning on Children's Later Development. A review
prepared for the RSA enquiry 'Start Right', European Early Childhood Education Research Journal, 1, (1): 17-40.
Tizard, P., Blatchford, P, Burke, J., Farquhar, C. & Plewis, I. (1988) Young Children at School in the Inner City,
Hove: Lawrence Erlbaum Associates Ltd. Tymms, P., Merrell, C. & Henderson, B. (1997) The First Year at School: A quantitative Investigation of the
Attainment and Progress of Pupils, Educational Research and Evaluation, 3, (2): 101-118. Yang, M. & Goldstein, H. (1997) Report on Value Added Analysis for Primary Schools in Hampshire County,
Mathematical Sciences, Institute of Education, University of London, August 1997.
i
Technical Paper 4 Parent, family and child characteristics in relation to type of
pre-school and socio-economic differences EXECUTIVE SUMMARY
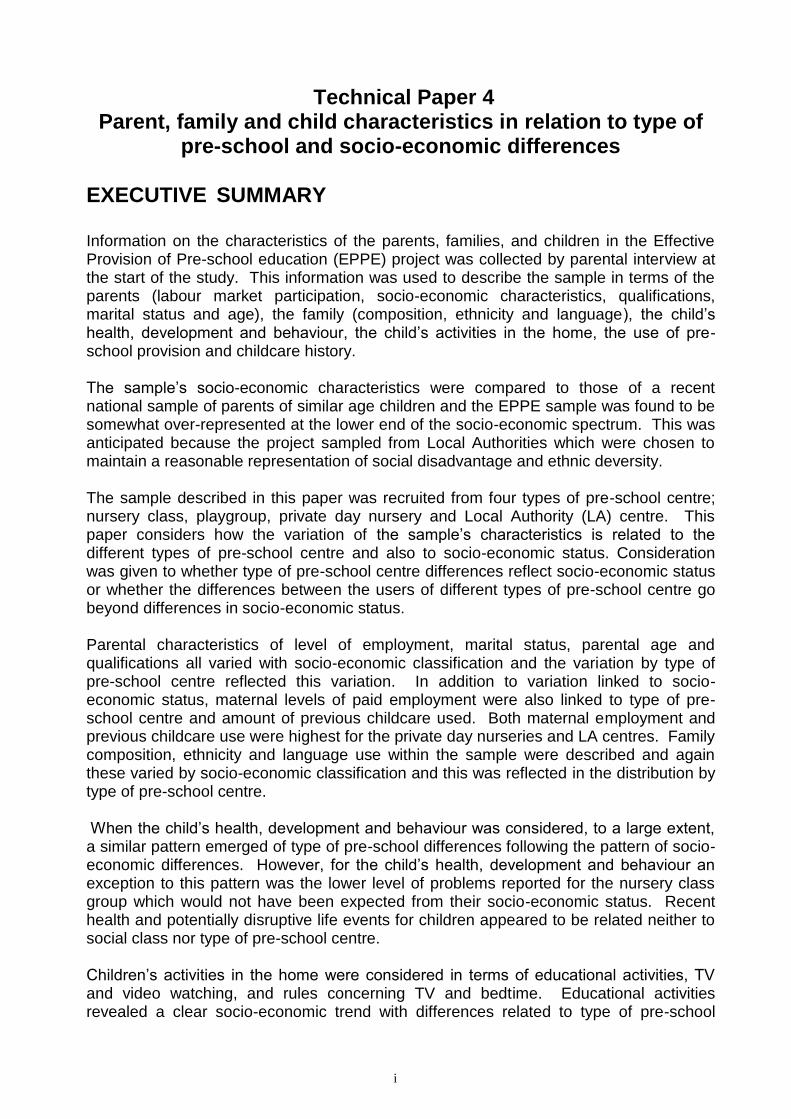
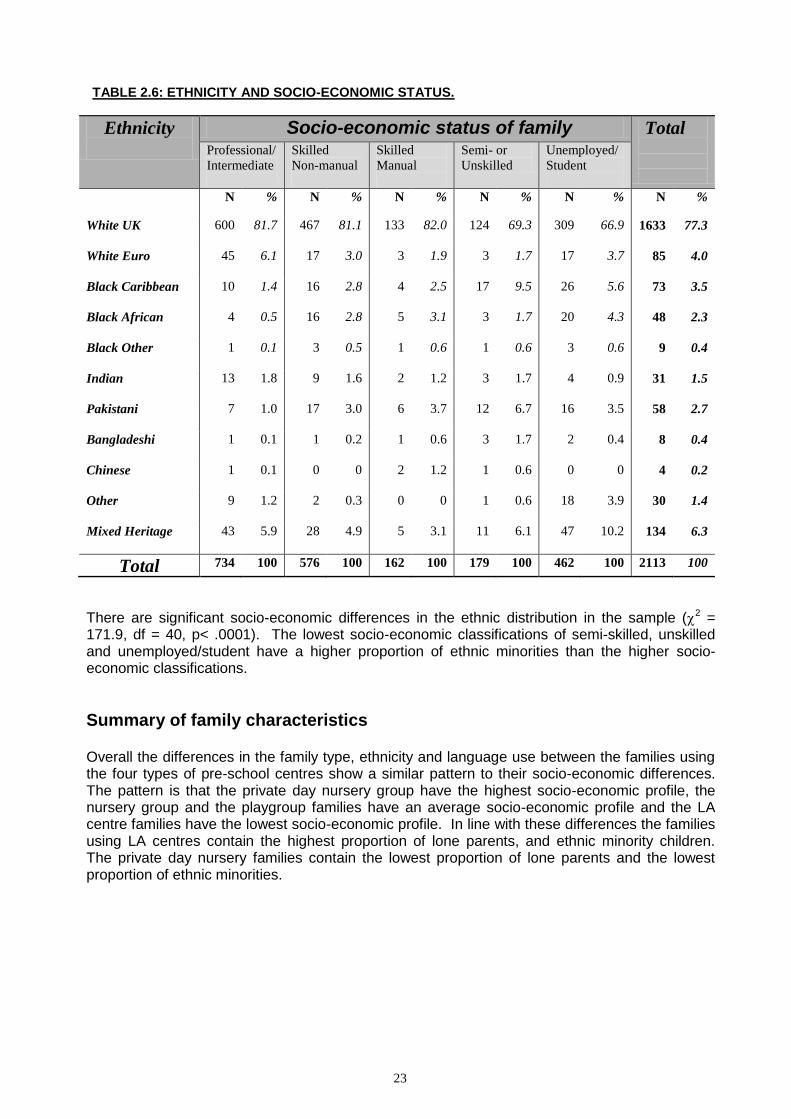
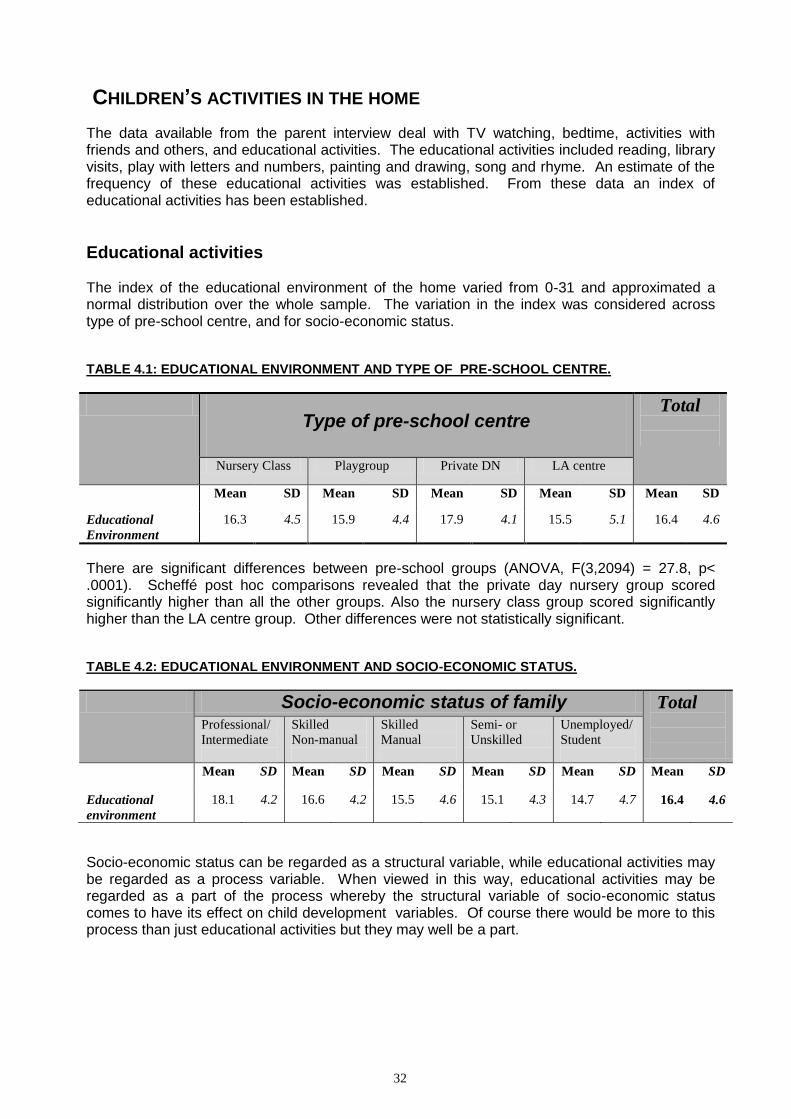
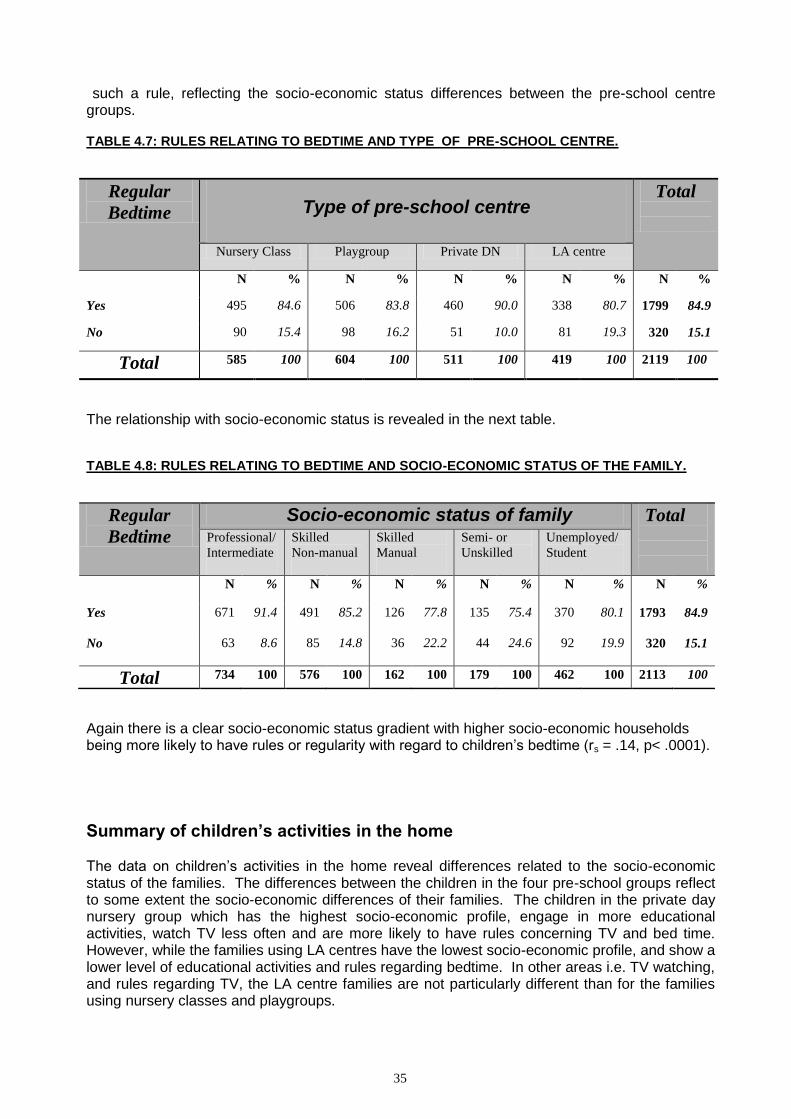
Information on the characteristics of the parents, families, and children in the Effective Provision of Pre-school education (EPPE) project was collected by parental interview at the start of the study. This information was used to describe the sample in terms of the parents (labour market participation, socio-economic characteristics, qualifications, marital status and age), the family (composition, ethnicity and language), the child’s health, development and behaviour, the child’s activities in the home, the use of pre-school provision and childcare history. The sample’s socio-economic characteristics were compared to those of a recent national sample of parents of similar age children and the EPPE sample was found to be somewhat over-represented at the lower end of the socio-economic spectrum. This was anticipated because the project sampled from Local Authorities which were chosen to maintain a reasonable representation of social disadvantage and ethnic deversity. The sample described in this paper was recruited from four types of pre-school centre; nursery class, playgroup, private day nursery and Local Authority (LA) centre. This paper considers how the variation of the sample’s characteristics is related to the different types of pre-school centre and also to socio-economic status. Consideration was given to whether type of pre-school centre differences reflect socio-economic status or whether the differences between the users of different types of pre-school centre go beyond differences in socio-economic status. Parental characteristics of level of employment, marital status, parental age and qualifications all varied with socio-economic classification and the variation by type of pre-school centre reflected this variation. In addition to variation linked to socio-economic status, maternal levels of paid employment were also linked to type of pre-school centre and amount of previous childcare used. Both maternal employment and previous childcare use were highest for the private day nurseries and LA centres. Family composition, ethnicity and language use within the sample were described and again these varied by socio-economic classification and this was reflected in the distribution by type of pre-school centre. When the child’s health, development and behaviour was considered, to a large extent, a similar pattern emerged of type of pre-school differences following the pattern of socio-economic differences. However, for the child’s health, development and behaviour an exception to this pattern was the lower level of problems reported for the nursery class group which would not have been expected from their socio-economic status. Recent health and potentially disruptive life events for children appeared to be related neither to social class nor type of pre-school centre. Children’s activities in the home were considered in terms of educational activities, TV and video watching, and rules concerning TV and bedtime. Educational activities revealed a clear socio-economic trend with differences related to type of pre-school
ii
reflecting these socio-economic differences in the pre-school groups. Rules regarding TV and bedtime, however, did not entirely follow this pattern. Parents use of and involvement with pre-school centres, demonstrated relationships with socio-economic differences. For example, parents from higher socio-economic groups were more likely to visit centres and more likely to be attending meetings with staff and to be involved in policy discussions. Parents from higher socio-economic groups were also more likely to be concerned with the atmosphere and educational activities in their choice of pre-school centre. However, there were a number of differences which were related to type of pre-school centre rather than deriving from parental socio-economic differences. These included: - the age of starting which was lower for both private day nurseries and LA centres. - the number of sessions attended which showed a different pattern for each type of
pre-school centre. - the relationship between maternal level of paid employment was linked to use of the
target pre-school centre for private day nurseries and LA centres but not for nursery classes or playgroups.
- also visits to centres were more likely in playgroups than other types of centre and for playgroups, visits by parents included spending time with children and fundraising activities more often than for the other types of pre-school centre.
The childcare histories of the children revealed enormous diversity across the whole sample and for children within each type of pre-school centre. Overall the children using private day nurseries and LA centres had more than twice as much non-parental care as the children in the nursery classes and playgroups. This difference was largely accounted for by the time spent at their current pre-school centre where they had started earlier and were attending for more sessions and hours per week. There was also a strong association between level of maternal paid employment and previous childcare use. Those mothers who were employed for longer hours had a history of using greater amounts of childcare. The socio-economic differences in childcare histories largely reflect the differential use of types of pre-school centre and differential levels of maternal paid employment by the different socio-economic groups. For further details concerning the relationship between children’s personal and family characteristics and their cognitive attainment at entry to the EPPE study see Technical Paper 2, Characteristics of the EPPE Project : sample at entry to the study. (Sammons et al, 1999). The EPPE researchers will be studying the developmental progress of the children until age seven. This range of differences within the sample will need to be considered in explaining children’s progress through pre-school and into primary school. Some of these factors may be related to developmental outcomes and later stages of the study can investigate this possibility and where necessary allow for such factors in evaluating
the contribution of pre-school to developmental progress.
ACKNOWLEDGEMENT We are grateful to Tony Martin, Head of Analytical Services at the DfES for allowing us to access a database on a nationally representative sample of parents with pre-school children.
1
INTRODUCTION The Effective Provision of Pre-School Education (EPPE) project is a research study of children's progress and development from age three to seven years, and how progress relates to their pre-school centre experience and family background. An overview of the study including the aims is contained in Overview of the Project at the beginning of this technical paper. Further details are provided in the first technical paper of this series. The Effective Provision of Pre-School Education (EPPE) Project : Technical paper One (Sylva et al., 1999) . In the first stage of the study parents were interviewed concerning child and family characteristics. A central focus of this project is the development and progress of the children in the study. Children’s development may be influenced by the pre-school environment and it will certainly be influenced by family background. Hence any study which has the aim of investigating the possible effects of pre-school experience must firstly consider the variation in family background of children who use different types of pre-school provision. Hence this paper describes the socio-economic characteristics of the sample included in the first stage of the project, and relates the sample in terms of these characteristics to nationally representative data. Subsequently variations in parental, family and child characteristics between the groups of parents and children using different types of pre-school centre are examined. Consideration is given to the extent to which differences can be understood in terms of the socio-economic variation between users of different types of pre-school, and to what extent the variation reflects other differences linked to the type of pre-school centre used. This information will be used to inform the later analyses and interpretation of results which will occur later in the project and which will be the subject of later Technical Papers in this series. However understanding the variation in parental, family and child characteristics amongst users of different types of pre-school centres may well be useful in the planning of future provision.
THE SAMPLE
The focus of the EPPE study is on the effectiveness of pre-school centres. The EPPE sample was stratified by type of centre and geographical location, as described in the overview. The first stage of the study involved 2146 children recruited from 114 pre-school centres, including 588 children from nursery classes, 609 children from playgroups, 516 children from private day nurseries and 433 children from Local Authority centres. The children were aged between 3 years and 4 years 3 months (mean 40.4 months; s.d. =4.3 months) at the beginning of the study. For 26 families, parents were unavailable for interview. Hence this paper is based on the analysis of data from 2120 parental interviews.
DATA COLLECTION AND ANALYSIS The first stage of the EPPE project involved the collection of baseline data on the development of the children, and also information from the parents concerning the family, parents and children. The baseline developmental data on the children is reported in a separate paper in the series, Technical paper 2: Characteristics of the Effective Provision of Pre-school Education (EPPE) Project Sample at Entry to the Study (Sammons et al.,1999). This report is concerned with the data deriving from the parental interview conducted shortly after the children were recruited to the study.
2
Parents were interviewed either in person when they were at the pre-school centre, or by telephone. The interview followed a semi-structured format with answers to most questions being coded into an established set of categories, and a small number of open-ended questions that were coded post-hoc. The length of the interviews varied, depending on the complexity of the information to be collected, the conciseness of the parents and other factors. A typical interview might take between fifteen and forty minutes of the parent’s time depending upon the complexity of the information supplied by the parent. The interview contained questions dealing with the parents, the family, the child’s health, development and behaviour, the child’s activities in the home, the use of pre-school provision and the childcare history. These topics are considered in terms of the type of pre-school centre used i.e. nursery class, playgroup, private day nursery or Local Authority (LA) centre, and also in terms of the socio-economic status of the family
THE PARENTS Labour market participation and socio-economic characteristics The parental interview collected information on the employment of the parents. The occupations of the parents were classified according to the OPCS (1995) occupational classification. Hence the paternal and maternal occupational classifications are available as a basis for a classification of socio-economic status. The socio-economic characteristics of the sample based upon father’s and mother’s current or last job is shown in table 1.1. While in much research the father’s occupational status is used for the classification of the socio-economic status of the family, in this study there are many fathers (501, 23% of the sample) for whom data are unavailable, often these are absent fathers. An alternative is to use the occupational classification of the mother, but many mothers live in households with the father as sole breadwinner. A way of overcoming these problems is to assign to the family a socio-economic classification based upon the occupation of the parent with the highest occupational status. This strategy has been adopted here based upon employment at the start of the study. The sample’s socio-economic characteristics formulated according to his method are shown in the last column of table 1.1.
TABLE 1.1: SOCIO-ECONOMIC CHARACTERISTICS OF THE EPPE SAMPLE
Socio-economic
classification
Based on father’s
occupation
Based on mother’s
occupation
Based on parents’
occupations
N % N % N %
Professional (I)
173 10.5 108 5.2 197 9.3
Intermediate (II)
430 26.1 435 20.8 537 25.4
Skilled (III NM)
non-manual
270 16.4 811 38.7 576 27.3
Skilled (III M)
Manual
451 27.4 108 5.2 162 7.7
Semi-skilled (IV)
263 16.0 431 20.6 163 7.6
Unskilled (V)
37 2.2 81 3.9 16 0.8
Unemployed
/student
21 1.3 119 5.6 462 21.9
Total 1645 100 2093 100 2113 100
Missing data 501 53 33
TOTAL
2146
3
Note that the unemployed/student category includes families where neither parent was in employment at the start of the study and includes some cases where a parent was a student. This category does not take into account where the parents were claiming unemployment benefit. In subsequent discussion analysis will be based on a sample of 2120 due to 26 parents
being unavailable for interview. Comparing the EPPE sample with the UK population While the EPPE sample was not designed to be wholly representative of the population of the UK, it is useful to know the relationship between the sample and the wider population. Recently, a nationally representative sample of parents with a pre-school child has been surveyed for the DfES (Prior et al., unpublished). Using this survey as the basis for statistics on a national sample, it is possible to compare the EPPE sample with a national sample of parents of 3-4 year old children. Table 1.2 shows such a comparison for maternal occupational status, where mothers have been employed. Occupation is either current occupation or last occupation if currently unemployed. TABLE 1.2: OCCUPATIONAL CLASSIFICATION OF MOTHER Occupational classification EPPE Sample National Sample % % Professional/ Intermediate I&II 27.5 26.9 Skilled non-manual IIInm 41.1 46.3 Skilled manual IIIm 5.5 20.9 Semi-skilled and Unskilled IV&V 25.9 5.9
It is possible to construct similar comparisons for mother’s and father’s educational qualifications as shown in table 1.3 and 1.4. TABLE 1.3: EDUCATIONAL QUALIFICATIONS OF MOTHER Qualification EPPE Sample National Sample
% % Degree or higher 19.1 12.9 HND, 18+ vocational 13.0 12.1 A level 8.8 12.7 O level 38.2 44.1 Less than O level 19.8 16.2 Other miscellaneous 1.1 1.9 TABLE 1.4: EDUCATIONAL QUALIFICATIONS OF FATHER Qualification EPPE Sample National Sample
% % Degree or higher 25.2 23.9
HND, 18+ vocational 13.0 17.2
A level 10.1 16.6 O level 30.5 28.6 Less than O level 20.1 12.7 Other miscellaneous 1.1 1.0
On the basis of maternal occupation, the EPPE sample is over-represented (as compared with a national sample) at the bottom end of the socio-economic spectrum. A similar pattern emerges
4
from the comparisons based on father’s qualifications. The EPPE sample does not appear to be as over-represented at the bottom end of the educational qualification spectrum when the comparison is based on mother’s qualifications. Mother’s qualifications indicate a slight over-representation at the top end and bottom end of the spectrum. However, the comparison based on father’s qualifications clearly shows a very similar pattern to maternal occupational status with a larger over-representation at the bottom end of the socio-economic spectrum. Specifically there is an under-representation of the skilled non-manual occupations and an over-representation of the semi-skilled and unskilled occupations.
The national sample is drawn from all parents of 3-4 year old children, regardless of whether their child attends a pre-school centre. The EPPE sample is specifically drawn from users of four types of pre-school centre; nursery classes, playgroups, private day nurseries and LA centres. The classification by mother’s occupational status, where mothers have been employed, for these centres is compared with the National Sample in table 1.5. TABLE 1.5: OCCUPATIONAL CLASSIFICATION OF MOTHER
Occupational
classification Type of pre-school centre National
Sample (Prior et al.)
Nursery Class Playgroup Private DN LA centre
% % % % %
Professional/
Intermediate I&II 19.9 16.9 51.1 23.2 26.9
Skilled
non manual IIInm 38.4 49.6 35.8 39.1 46.3
Skilled manual
IIIm 6.0 5.5 4.4 6.1 20.9
Semi-skilled/
Unskilled IV&V 35.8 27.9 8.7 31.7 5.9
It is clear that mothers who use private day nurseries are frequently of higher occupational status. Mothers from the other three groups (nursery class, playgroups and LA centres) are more likely to have been in the semi-skilled or unskilled occupations than the mothers in the national sample. On the basis of comparisons with the national sample reported by Prior et al. (unpublished), for all pre-school groups, mothers who have been in the skilled manual occupations are under-represented and women who have been in semi-skilled and unskilled occupations are over-represented. The consequence of these variations is that the EPPE sample is over-represented at the lower end of the socio-economic spectrum. This would appear to be a direct result of the strategic sampling of Local Authorities. For two of these types, nursery classes and LA centres it is often the local authority’s policy to target such provision in areas of socio-economic disadvantage. Hence over-representation at the bottom end of the socio-economic spectrum is not unexpected.
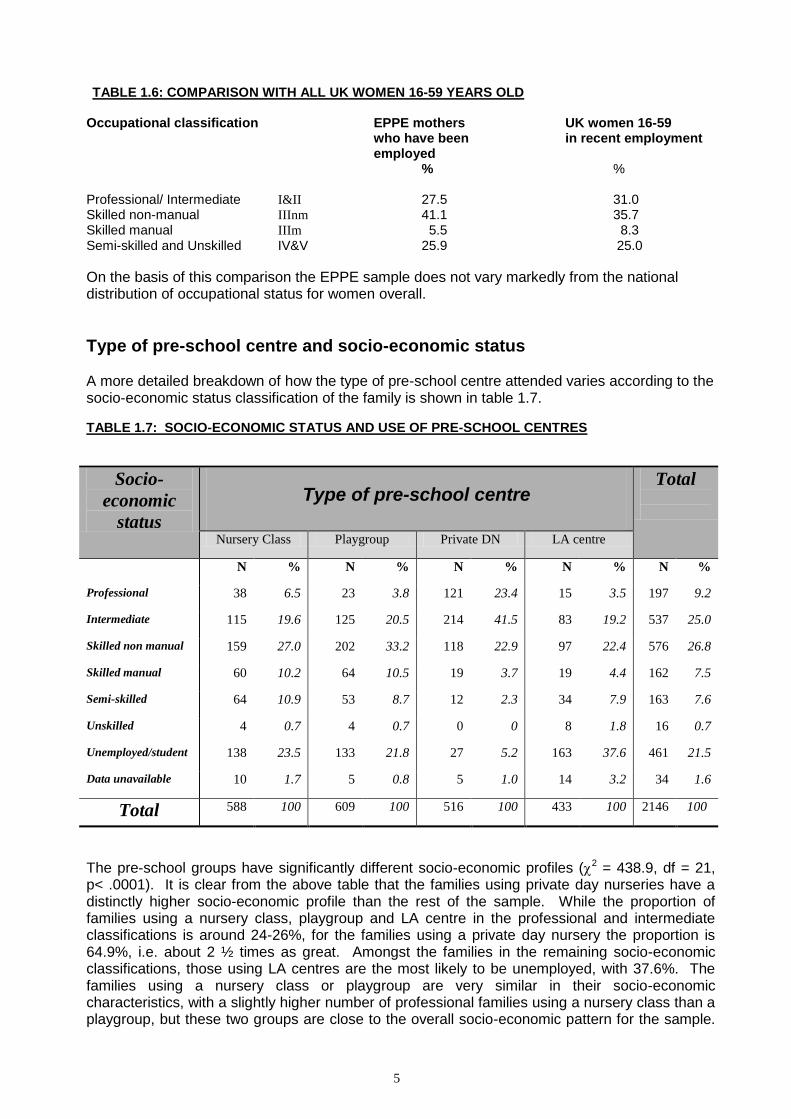
However, the mothers in the EPPE sample can also be compared with all UK women (Office of National Statistics, 1999). Table 1.6 shows this comparison.
5
TABLE 1.6: COMPARISON WITH ALL UK WOMEN 16-59 YEARS OLD
Occupational classification EPPE mothers UK women 16-59 who have been in recent employment employed % % Professional/ Intermediate I&II 27.5 31.0 Skilled non-manual IIInm 41.1 35.7 Skilled manual IIIm 5.5 8.3 Semi-skilled and Unskilled IV&V 25.9 25.0
On the basis of this comparison the EPPE sample does not vary markedly from the national distribution of occupational status for women overall.
Type of pre-school centre and socio-economic status A more detailed breakdown of how the type of pre-school centre attended varies according to the socio-economic status classification of the family is shown in table 1.7.
TABLE 1.7: SOCIO-ECONOMIC STATUS AND USE OF PRE-SCHOOL CENTRES
The pre-school groups have significantly different socio-economic profiles (2 = 438.9, df = 21, p< .0001). It is clear from the above table that the families using private day nurseries have a distinctly higher socio-economic profile than the rest of the sample. While the proportion of families using a nursery class, playgroup and LA centre in the professional and intermediate classifications is around 24-26%, for the families using a private day nursery the proportion is 64.9%, i.e. about 2 ½ times as great. Amongst the families in the remaining socio-economic classifications, those using LA centres are the most likely to be unemployed, with 37.6%. The families using a nursery class or playgroup are very similar in their socio-economic characteristics, with a slightly higher number of professional families using a nursery class than a playgroup, but these two groups are close to the overall socio-economic pattern for the sample.
6
Thus the socio-economic ordering is that the highest are the users of the private day nursery group, the nursery class and playgroup users are next and very similar to each other, and then the families using LA centres have the lowest socio-economic profile.
The consequences of these socio-economic differences between the families using different types of pre-school are that many differences associated with type of pre-school will actually derive from socio-economic differences. In particular where differences in a characteristic mirror the differences revealed in table 1.7 then this strongly indicates that the cause of the difference may be socio-economic.
Level of parental employment Information from questions concerning the hours of employment for the mother and father were used to consider the issue of level of employment for parents. Firstly mothers’ paid employment was considered.
TABLE 1.8: MATERNAL EMPLOYMENT AND TYPE OF PRE-SCHOOL CENTRE.
The overall differences in pre-school groups are significant (2 = 734.9, df = 28, p< .001). The mothers in the private day nursery group show the highest levels of paid employment, followed by the mothers in the LA centre group. The nursery class and playgroup mothers show similar levels of paid employment. The LA centre mothers are as likely to be unemployed as the nursery class and playgroup mothers, but if employed are more likely to be employed full-time. The private day nursery mothers show the least unemployment and the highest levels of employment when employed.
7
TABLE 1.9: MATERNAL EMPLOYMENT AND SOCIO-ECONOMIC STATUS.
Note the unemployment/student group contains parents seeking work but unemployed, not seeking work and students. The level of maternal employment in the sample shows a clear socio-economic trend such that higher socio-economic groups have higher levels of maternal employment (Spearman’s rs = .439, p< .0001). This pattern holds when only those in employment are considered. However, it is clear that part-time employment (less than 30 hours per week) is more common overall, and even for the highest socio-economic groups, that have the highest levels of full-time employment, the level of part-time employment is almost equal to the level of full-time employment.
TABLE 1.10: PATERNAL EMPLOYMENT AND TYPE OF PRE-SCHOOL CENTRE.
Full time 381 79.9 407 85.1 425 95.9 150 67.9 1363 84.2
Total 477 100 478 100 443 100 221 100 1619 100
The fathers in the private day nursery group show the highest levels of employment, followed by the playgroup fathers and nursery class fathers. The fathers in the LA centre group show the highest levels of unemployment. Part-time employment for fathers is at a low level throughout.
8
TABLE 1.11: PATERNAL EMPLOYMENT AND SOCIO-ECONOMIC STATUS.
There is a clear socio-economic trend in paternal employment (rs = .106, p< .0001, for employed fathers only), but not as marked as for maternal employment. The differences in the level of employment for mothers and fathers are very great, with part-time employment a rarity for fathers, but more common than full-time for mothers. While the level of father’s employment for families using different types of pre-school centre appear to follow socio-economic differences, the same is only partly true for mother’s level of paid employment. Mother’s level of full-time employment is greatest for the private day nursery and LA centre groups. While the private day nursery group clearly has a much higher proportion of mothers in higher status jobs, the same is not true of the LA centres. However private day nurseries and LA centres offer the highest level of provision, usually up to full time. It is rare for nursery classes and playgroups to offer full-time provision, and when they do the actual hours of provision are still less than for private day nurseries and LA centres. Hence the higher level of maternal employment associated with private day nurseries and LA centres is linked to the higher level of provision. The next section considers the level of parental employment and the use of childcare.
Level of parental employment and use of childcare
The parental interview contained a section dealing with the use of childcare before the target children entered the study. This information was used to establish several measures of previous childcare including the total number of hours that the child had been in childcare up to the start of the study. These different aspects of childcare are considered in a later section of this paper. The level of paid employment by the parents was correlated with the total amount of childcare used before entering the EPPE study. The correlations are shown in table 1.12.
9
TABLE 1.12: CORRELATIONS BETWEEN PARENTS’ CURRENT HOURS OF PAID EMPLOYMENT AND PREVIOUS CHILDCARE USE.
Type of pre-school centre
Total
Nursery Class Playgroup Private DN LA centre
Mother’s hours X
Hours of previous
childcare
0.42
0.40
0.57
0.53
0.52
Father’s hours X
Hours of previous
childcare
0.15
0.08
0.006
0.30
0.13
There are significant substantial correlations across all pre-school groups between mother’s current hours of paid employment and total childcare used up to the start of the study. The relationships are most pronounced for the private day nursery and LA centre groups. Clearly, mother’s level of current paid employment is strongly related to previous childcare use. The pattern of correlations between father’s paid employment and previous use of childcare is rather different. There is no significant relationship for the playgroup and private day nursery parents. There is a slight relationship (r = 0.15) for the nursery class parents and there is a stronger relationship for the LA centre parents (r = 0.30). This pattern follows the pattern of correlations between mother’s and father’s hours of paid employment. There is no significant relationship between mother’s and father’s hours of paid employment for the playgroup and private day nursery parents. There are significant relationships for the nursery class parents (r = 0.22) and the LA centre parents (r = 0.41). Overall, there are strong relationships between mother’s hours of paid employment and previous childcare. These relationships are strongest for the private day nursery and the LA centre parents. It would appear that the relationships between father’s hours of paid employment and previous childcare are a consequence of the pattern of correlations between mother’s and father’s hours of paid employment. The relationship between level of paid employment and use of the target pre-school centre at the start of the study was examined. The number of sessions and number of hours were related to parents’ level of paid employment.
10
TABLE 1.13: SESSIONS IN CENTRE AND LEVEL OF MOTHER’S EMPLOYMENT.
This table reveals a trend whereby where the mother works longer hours, the child attends more
sessions (Spearman’s rs =0.1, p 0.001). The major exceptions to this trend are the 208 cases where the mother is not in paid employment yet the child attends 10 sessions a week. Of these 208 cases, 126 are in LA centres, 68 are in nursery classes, 10 are in private day nurseries and 4 are in a playgroup, i.e. over half are using LA centres. The relationship between the parents’ number of hours of paid employment and the number of hours the child attends the target pre-school centre was examined by means of Pearson correlations. Table 1.14 shows these correlations. TABLE 1.14: CORRELATIONS BETWEEN PARENTS’ HOURS OF PAID EMPLOYMENT AND USE OF TARGET PRE-SCHOOL CENTRE.
Type of pre-school centre
Total
Nursery Class Playgroup Private DN LA centre
Mother’s hours X
Hours in centre
-0.04
-0.03
0.48
0.40
0.31
Father’s hours X
Hours in centre
-0.18
-0.19
-0.14
+0.13
0.10
11
The correlations reveal that there are significant substantial correlations between mother’s hours of paid employment and the time the child spends in the target pre-school centre for the private day nursery and LA centre groups. There is no significant relationship for the nursery classes or playgroups. Therefore only for the private day nurseries and LA centres is mother’s level of paid employment a significant factor in the amount of use of the target centre. Table 1.8 reveals that there are 13-16% of mothers using nursery classes or playgroups who are employed full-time. It is probable that these families have additional childcare arrangements to that provided by the target centres. When the relationship between father’s hours of paid employment and hours the child spends in the target pre-school centre is considered, a very different pattern emerges. For three groups, nursery classes, playgroups or private day nurseries, there is a significant but small negative correlation, implying that where fathers work fewer hours, the child spends more time in the LA centre. However, for the LA centres, there is a significant but small positive correlation, implying that where fathers work more hours, the child spends more time at the target centre. This different pattern for the LA centres may be linked to the substantially higher correlation between mother’s hours of paid employment and father’s hours of paid employment for the LA centre parents (r = 0.41). The correlations between mother’s and father’s hours of paid employment for the other groups are nursery class (r = 0.22), playgroup (r = 0.08) and private day nursery (r = 0.06), i.e. while the nursery class parents show a slight relationship in hours of work, there is none for the playgroup and private day nursery parents. In a later section of this paper the use of pre-school provision and childcare history is considered in terms of type of pre-school centre currently used and socio-economic status of the family.
Marital status Parents were asked to describe their marital status during the interview.
TABLE 1.15: MARITAL STATUS AND TYPE OF PRE-SCHOOL CENTRE.
Pre-school groups differ significantly in marital status (2 = 219.1, df = 15, p< .0001). Lone
parents are most common within the LA centre group, and least common amongst the private day nursery group. Nursery class and playgroup parents show similar patterns.
12
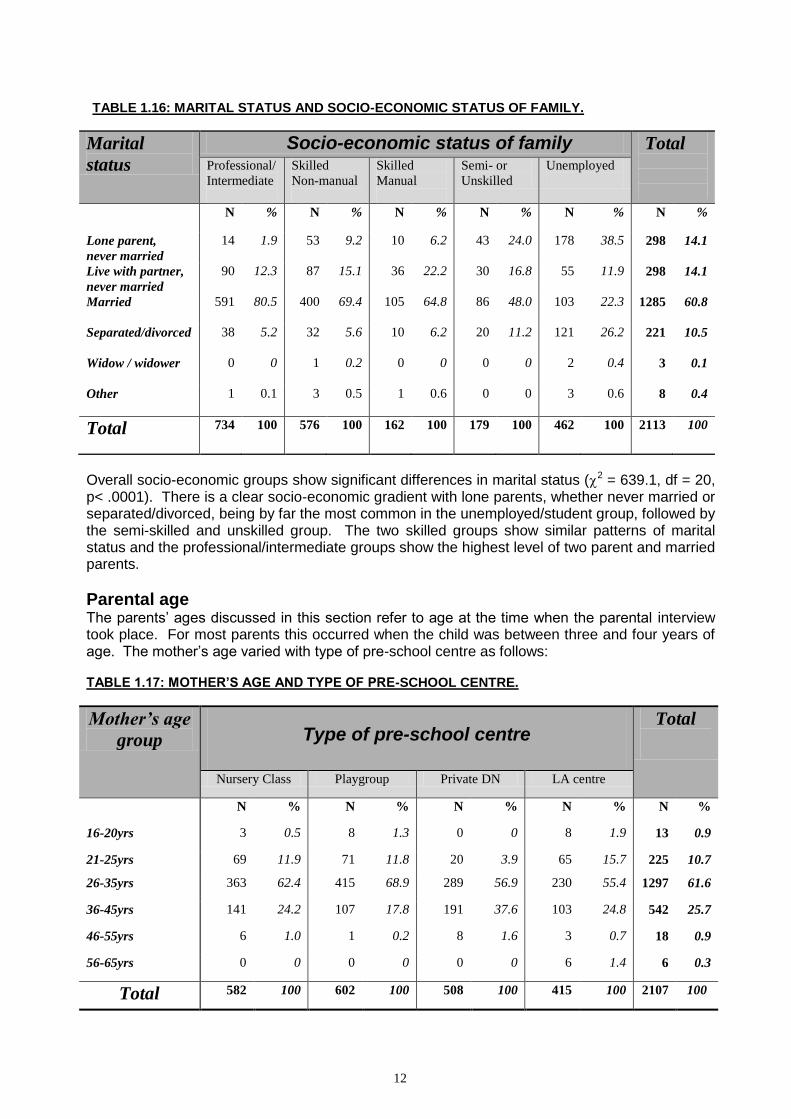
TABLE 1.16: MARITAL STATUS AND SOCIO-ECONOMIC STATUS OF FAMILY.
Overall socio-economic groups show significant differences in marital status (2 = 639.1, df = 20, p< .0001). There is a clear socio-economic gradient with lone parents, whether never married or separated/divorced, being by far the most common in the unemployed/student group, followed by the semi-skilled and unskilled group. The two skilled groups show similar patterns of marital status and the professional/intermediate groups show the highest level of two parent and married parents.
Parental age The parents’ ages discussed in this section refer to age at the time when the parental interview took place. For most parents this occurred when the child was between three and four years of age. The mother’s age varied with type of pre-school centre as follows:
TABLE 1.17: MOTHER’S AGE AND TYPE OF PRE-SCHOOL CENTRE.
Maternal age differs significantly across pre-school groups (2 = 128.5, df = 15, p< .001). The mothers in the private day nursery group tended to be older with over a third over 36 years of age. The other groups were rather similar with regard to maternal age.
TABLE 1.18: MOTHER’S AGE AND SOCIO-ECONOMIC STATUS OF FAMILY.
Socio-economic status is related to maternal age (rs = .333, p< .0001). The professional/intermediate group had over 40% of mothers over 36 years of age; a proportion that was more than twice that of the rest of the sample. There is a socio-economic trend that the higher the group, the higher the proportion of mothers in the older age groups.
TABLE 1.19: FATHER’S AGE AND TYPE OF PRE-SCHOOL CENTRE.
Father’s age differs amongst the pre-school groups significantly (2 = 64.1, df = 15, p< .0001). Younger fathers are more prevalent for the nursery class and playgroup children. However, the total number of fathers in the LA group is half that of the other groups reflecting the large number of ‘unavailable’ fathers for this group. It is quite likely that the ‘unavailable’ fathers may well be in the younger age groups bearing in mind the age distribution of the LA centre mothers.
TABLE 1.20: FATHER’S AGE AND SOCIO-ECONOMIC STATUS OF THE FAMILY.
Socio-economic status is related to paternal age (rs = .235, p< .0001). There is a socio-economic trend for fathers to be younger in the lower socio-economic groups. This trend would probably be more pronounced if it were not for the large number of ‘unavailable’ fathers in the lower socio-economic groups.
15
Educational qualifications of the parents Parents were asked about their education and the highest qualification that they had achieved. Comparisons are based on parents’ higher educational qualification.
TABLE 1.21: EDUCATIONAL QUALIFICATIONS OF MOTHER AND TYPE OF PRE-SCHOOL CENTRE.
Educational
Qualification
of mother
Type of pre-school centre Total
Nursery Class Playgroup Private DN LA centre
N % N % N % N % N %
None
130 22.4 108 18.0 27 5.3 116 28.3 381 18.2
16 vocational
12 2.1 11 1.8 6 1.2 6 1.5 35 1.7
16 academic
252 43.4 279 46.4 157 31.0 113 27.6 801 38.2
18 vocational
67 11.6 77 12.8 42 8.3 65 15.9 251 12.0
18 academic
37 6.4 49 8.2 69 13.6 28 6.8 183 8.7
Degree
Or equivalent
58 10.0 55 9.2 122 24.1 59 14.4 294 14.0
Higher degree
17 2.9 10 1.7 66 13.0 16 3.9 109 5.2
Other professional
2 0.3 7 1.2 8 1.6 3 0.7 20 1.0
Other misc.
5 0.9 5 0.8 9 1.8 4 1.0 23 1.1
Total 580 100 601 100 506 100 410 100 2097 100
Pre-school groups differ significantly (2 = 283.6, df = 24, p< .0001). The mothers in the private day nursery group show a higher level of educational qualifications than the rest of the sample. The LA centre mothers have the highest proportion with no qualifications, but also the second highest proportion with a degree or better qualifications suggesting that there may be considerable diversity in this group. This reflects the admissions policies of several local authorities to their pre-school centres, where they maintain a quota of fee-paying places, usually used by parents with higher socio-economic status and educational qualifications than the non fee-paying parents in these centres. The nursery class and playgroup mothers show similar levels of qualifications. These differences show great similarity to the socio-economic differences of the groups just described and follow the general pattern found in much research of the high correlation between socio-economic classification and educational qualifications. The small numbers within the sample whose highest qualifications are classified as other professional and other miscellaneous do not affect this overall pattern. Usually these qualifications would be categorised just below degree level.
16
TABLE 1.22: EDUCATIONAL QUALIFICATIONS OF MOTHER AND SOCIO-ECONOMIC STATUS OF FAMILY.
Maternal educational qualifications show a very strong association with socio-economic status (rs = 0.58, p< .0001). Almost half of the professional/intermediate group have a degree or higher degree qualification, while more than 40% of the unemployed/student group have no qualifications. Apart from the other professional and miscellaneous categories, where there are small numbers, there is a clear trend across socio-economic classifications for all qualifications.
17
TABLE 1.23: EDUCATIONAL QUALIFICATIONS OF FATHER AND TYPE OF PRE-SCHOOL CENTRE.
Qualification
of father Type of pre-school centre Total
Nursery Class Playgroup Private DN LA centre
N % N % N % N % N %
None
100 21.8 119 25.1 23 5.3 59 26.7 301 18.9
16 vocational 5 1.1 4 0.8 5 1.1 4 1.8 18 1.1
16 academic
160 34.9 162 34.2 109 24.9 54 24.4 485 30.5
18 vocational
50 10.9 65 13.7 56 2.8 28 2.7 199 12.5
18 academic
50 10.9 41 8.6 50 11.4 20 9.0 161 10.1
Degree 64 19.9 57 12.0 114 26.1 39 17.6 274 17.2
Higher degree
25 5.4 17 3.6 71 16.2 14 6.3 127 8.0
Other professional
0 0 2 0.4 5 1.1 1 0.5 8 0.5
Other misc.
5 1.1 7 1.5 4 0.9 2 0.9 18 1.1
Total 459 100 474 100 437 100 221 100 1591 100
Pre-school groups differ significantly on father’s qualifications (2 = 169.2, df = 26, p< .0001).
Father’s qualifications are highest in the private day nursery group with 42% having a degree or higher degree qualification. The results for the LA centre fathers are greatly affected by the large number of ‘unavailable’ fathers in this group. It may well be that the pattern of fathers’ qualifications for this group would be lower had the data on the fathers been available, but this is speculation. As the data stand, the fathers of children using LA centres show the highest level of no qualifications (26.7%) which is slightly higher than for the fathers of children using playgroups (25.1). However, the LA centre fathers also have almost 24% who have a degree or higher degree qualification, which is higher than playgroup fathers (15.6%). As with mother’s qualifications, this reflects admission quotas to LA centres. This suggests considerable diversity in the LA centre sample, and possibly two rather different social groups using this type of provision. This is an issue for subsequent papers.
18
TABLE 1.24: FATHER’S QUALIFICATIONS AND SOCIO-ECONOMIC STATUS
As with mother’s qualifications, there is a very strong association between father’s qualifications and socio-economic status (rs = 0.61, p< .0001). This is attenuated somewhat by the large number of ‘unavailable’ fathers in the lowest socio-economic groups.
Summary of parental characteristics Parental characteristics in terms of levels of employment, marital status, age and educational qualifications all show associations with the socio-economic status of the family. The differences in these parental characteristics between the four pre-school groups very closely parallel the socio-economic differences. Hence, such differences can be regarded as part of the variation in the sample associated with socio-economic variation. A partial exception to this pattern concerns the level of degree or better qualifications for mothers using LA centres which is higher than would be expected from socio-economic characteristics. Another exception to this pattern is the relationship between level of maternal employment and use of pre-school centres. The relationship is distinctly greater for the mothers using private day nurseries and LA centres, and does not reduce to socio-economic differences. There is a qualification concerning the ‘unavailable’ fathers to these conclusions. The distribution of ‘unavailable’ fathers varies by type of pre-school. There are 197 for the LA centre families, 121 and 126 for the nursery class and playgroup families and 72 for the private day nursery families. Hence the statistics for the LA centres are most affected, in that for almost half the families data on the child’s father are not available, while the figure for families using nursery class and playgroup is around 20%, and for families using a private day nursery, 14%. Hence the comparisons using father’s data may well be biased particularly for the families using LA centres, in that ‘unavailable’ fathers are probably not randomly distributed in their socio-economic and demographic characteristics.
19
THE FAMILY
Family composition The interviewer asked who lived in the same household as the study child. From the answers given, a typology of families was constructed. These family types were: 1. Lone parent – one parent and no other adult living with the study child 2. Two parent – both parents and no other adult living with the study child. 3. Extended family – one or both parents and other adult living with child. 4. Foster/grandparent – a foster parent or grandparent lives with child, but neither parent does. 5. Adoptive family – child living with adoptive parents. 6. Family information unavailable*
*Note that the families for whom information is unavailable were families where there had been many repeated attempts to interview a parent. Very extensive efforts have been made to acquire a parental interview and these parents present significant problems with regard to access to family information.
The proportion of children with a lone parent in the sample is 21%, which is close to the 20% of UK households with dependent children that are lone parent families (Office for National Statistics, 1999).
Type of pre-school centre Family type varied between the pre-school groups as shown in table 18, the overall differences
are significant (2 = 182.6, df = 15, p< .0001). TABLE 2.1: TYPE OF PRE-SCHOOL CENTRE AND FAMILY TYPE.
differences in their use of pre-school centres to two-parent families. Foster/grandparent families were three times more likely to use a LA centre than two parent families. Half of the families where all family information was unavailable used LA centres. The largest family type was the two-parent families who made up 69% of the sample. Comparing the other family types to this majority group revealed several differences. Two-parent families were equally likely to use a nursery class, playgroup or private day nursery, but only half as likely to use a LA centre. Lone
20
parent families used LA centres more than any other type of pre-school centre and were the least likely to use a private day nursery. Approximately a quarter of lone parents used a nursery class and a quarter a playgroup. However only an eighth used a private day nursery. Extended families showed only slight
Family type varied with socio-economic status of the family as shown in table 2.2. TABLE 2.2: SOCIO-ECONOMIC STATUS AND FAMILY TYPE.
The overall differences are significant (2 = 571.4, df = 16, p< .0001). Two-parent families were the family type least likely to be in the unemployed/student group (apart from the very small adoptive group where there was no unemployment). Lone parent families were frequently in the unemployed/student group (58.3%) and overall were of lower socio-economic status than two-parent families. The major differences between extended families and two parent families were the higher level of unemployment for extended families and their lower presence in the skilled classifications.
Ethnicity and language The language used by the child in the home was regarded as the child’s first language. For 92.8% of the children this language was English. For those children whose first language was not English, there were 47 different languages used by children in the study. Language varied with type of pre-school as shown in table 2.3. TABLE 2.3: FIRST LANGUAGE OF CHILD AND TYPE OF PRE-SCHOOL CENTRE.
There are significant overall differences (2 = 32.5, df = 3, p< .0001). The lowest representation of children whose first language was not English was amongst the private day nurseries. All the other pre-school groups had similar levels of children whose first language was not English. Children whose first language was English and whose first language was not English were distributed across the socio-economic groups as shown in table 2.4.
TABLE 2.4: FIRST LANGUAGE OF CHILD AND SOCIO-ECONOMIC STATUS OF FAMILY.
Socio-economic differences are significant overall (2 = 31.1, df = 4, p< .0001). The children whose first language was not English make up a higher proportion of the sample for the lower socio-economic groups. The top three socio-economic groups contain a lower proportion of these children. The lower representation for private day nurseries reflects the higher socio-economic profile of families using this type of pre-school. The ethnic distribution of the children in the sample included 77% of children of white UK heritage and 23% of children were of ethnic minorities. There were 4% of children of white European heritage and 6% of children were of black heritage (Caribbean, African or other black), 4.5% of south Asian heritage (Indian, Pakistani, or Bangladeshi), and 6.5% of mixed heritage. There were only two children of Chinese heritage (0.2%) and 1.4% belonged to other ethnic
minorities. Ethnicity varied significantly between the pre-school centres (2 = 292.5, df = 30, p< .0001).
22
TABLE 2.5. ETHNICITY AND TYPE OF PRE-SCHOOL CENTRE
Ethnicity
Type of pre-school centre Total
Nursery Class Playgroup Private DN LA centre
N % N % N % N % N %
White UK 472 80.3 482 79.1 460 89.3 242 55.9 1656 77.2
LA centres had the highest proportions of ethnic minority children (44.1%), while the private day nursery children were least likely to belong to an ethnic minority (10.7%) and for those in an ethnic minority using private day nurseries, half were of white European heritage. There is little difference in the representation of ethnic minority children between nursery classes and playgroups, whose representation is close to that of the total sample, being around 20%.
There are significant socio-economic differences in the ethnic distribution in the sample (2 = 171.9, df = 40, p< .0001). The lowest socio-economic classifications of semi-skilled, unskilled and unemployed/student have a higher proportion of ethnic minorities than the higher socio-economic classifications.
Summary of family characteristics Overall the differences in the family type, ethnicity and language use between the families using the four types of pre-school centres show a similar pattern to their socio-economic differences. The pattern is that the private day nursery group have the highest socio-economic profile, the nursery group and the playgroup families have an average socio-economic profile and the LA centre families have the lowest socio-economic profile. In line with these differences the families using LA centres contain the highest proportion of lone parents, and ethnic minority children. The private day nursery families contain the lowest proportion of lone parents and the lowest proportion of ethnic minorities.
24
CHILD’S PREVIOUS HEALTH, DEVELOPMENT AND BEHAVIOUR Parents were asked a series of questions concerned with the child’s health, development and behaviour since birth. The data from these questions have been used to compute a series of indices reflecting the child’s health and development history. These indices deal with the perinatal period, health development and behaviour since birth up to the interview, and health in the last six months.
Perinatal period Questions concerned with birthweight, prematurity, and early medical care were used to construct an index of perinatal health which takes account of prematurity (less than 2.5kgs.), and early breathing, stomach, hearing or other difficulties. This index ranged from 0 (no difficulties to 6 (most difficulties). This index varied with type of pre-school centre as shown in table 3.1.
TABLE 3.1: PERINATAL PERIOD AND TYPE OF PRE-SCHOOL CENTRE.
Perinatal
problems Type of pre-school centre Total
Nursery Class Playgroup Private DN LA centre
N % N % N % N % N %
0 487 83.2 484 80.3 410 80.4 330 78.8 1711 80.8
1 63 10.8 92 15.3 76 14.9 57 13.6 288 13.6
2 32 5.5 23 3.8 18 3.5 26 6.2 99 4.7
3 1 0.2 3 0.5 6 1.2 4 1.0 14 0.7
4 1 0.2 1 0.2 0 0 2 0.5 4 0.2
6 1 0.2 0 0 0 0 0 0 1 0.0
Total 585 100 603 100 510 100 419 100 2117 100
There were no significant differences between the children in the four pre-school centre groups with regard to perinatal health. The variation with socio-economic status is considered next.
25
TABLE 3.2: PERINATAL PERIOD AND SOCIO-ECONOMIC STATUS OF THE FAMILY.
The children in the unemployed/student group appear very slightly below the other groups but there are no statistically significant differences.
Health, Development and Behaviour Data were collected on the incidence and help/treatment received for health, developmental and behaviour problems since birth. From these data indices were calculated based upon incidence weighted by help/treatment received. Also parents were asked about the occurrence of life events that might have been potentially disruptive to the child’s development.
Physical health since birth TABLE 3.3: PREVIOUS HEALTH PROBLEMS AND TYPE OF PRE-SCHOOL CENTRE.
The children in the different pre-school centre groups show very small significant differences (2 = 20.4, df = 9, p< .05) in terms of their previous health problems. The nursery class children
26
have slightly fewer previous health problems and the LA centre children slightly more than the children in private day nurseries and playgroups. The variation in terms of socio-economic status was then dealt with.
TABLE 3.4: PREVIOUS HEALTH PROBLEMS AND SOCIO-ECONOMIC STATUS.
The professional/intermediate groups are marginally better in their previous health history, but the differences are slight (rs = 0.05, p< .05).
Developmental problems since birth
TABLE 3.5: PREVIOUS DEVELOPMENTAL PROBLEMS AND TYPE OF PRE-SCHOOL CENTRE.
Previous
development
problems
Type of pre-school centre Total
Nursery Class Playgroup Private DN LA centre
N % N % N % N % N %
None
537 92.0 535 88.6 467 91.4 368 87.6 1907 90.0
Low 6 1.0 5 0.8 10 2.0 0 0 21 1.0
Moderate 39 6.7 53 8.8 27 5.3 47 11.2 166 7.8
High 2 0.3 11 1.8 7 1.4 5 1.2 25 1.2
Total 584 100 604 100 511 100 420 100 2119 100
There are overall significant differences between pre-school groups (2 = 27.6, df = 9, p< .001). The nursery class and private day nursery children have slightly lower scores for previous developmental problems. The children using LA centres show a higher level of previous developmental problems. All of these differences involve small numbers of children, with the great majority of children (90%) reported as having no previous developmental problems
27
TABLE 3.6: PREVIOUS DEVELOPMENTAL PROBLEMS AND SOCIO-ECONOMIC STATUS.
The unemployed/student groups are slightly worse on this index of previous developmental problems and as with the previous health index, the two highest socio-economic groups reported fewer problems (rs = .09, p< .001). While the differences involve small numbers of children the unemployed/student group shows twice the level of moderate/high problems to the professional/intermediate and skilled non-manual groups. These differences may become important later in the study when considering children who are at the lower end of the developmental distribution.
Behaviour problems since birth Parents were asked whether the child had presented any behaviour problems up to the present, and whether any professional help was sought for the problem. This information was used to produce the categorisation shown in tables 3.7 and 3.8.
TABLE 3.7: BEHAVIOUR PROBLEMS AND TYPE OF PRE-SCHOOL CENTRE.
Previous
behaviour
problems
Type of pre-school centre Total
Nursery Class Playgroup Private DN LA centre
N % N % N % N % N %
None
524 89.7 535 88.7 460 90.0 348 82.9 1867 88.1
Low 20 3.4 19 3.2 18 3.5 20 4.8 77 3.6
Moderate 32 5.5 41 6.8 25 4.9 43 10.2 141 6.7
High 8 1.4 8 1.3 8 1.6 9 2.1 33 1.6
Total 584 100 603 100 511 100 420 100 2118 100
There are borderline significant differences between pre-school groups (2 = 16.6, df = 9, p< .05). The LA centre children appear to have a higher level of behaviour problems noted by parents
28
than the other children in the study with about twice as many behaviour problems being recorded. The other groups are very similar in the incidence of recorded behaviour problems.
TABLE 3.8: BEHAVIOUR PROBLEMS AND SOCIO-ECONOMIC STATUS OF THE FAMILY.
The lowest socio-economic groups have higher levels of behaviour problems noted by their parents than the higher socio-economic groups (rs = .09, p< .001). The lowest socio-economic groups reported about twice as many behaviour problems as the highest socio-economic groups. 17% of the unemployed/student parents reported some level of behaviour problem with their children. These differences may be important in considering later social and emotional developments.
Total health, developmental and behaviour problems
A summary index of all health, developmental and behaviour problems was computed and used to compare the pre-school centre groups.
TABLE 3.9: OVERALL PREVIOUS PROBLEMS AND TYPE OF PRE-SCHOOL CENTRE.
There are overall significant differences between pre-school groups (2 = 36.3, df = 9, p< .0001). The children in the LA centres show a higher overall level of previous problems than the other children with children in the nursery class showing least problems. TABLE 3.10: OVERALL PREVIOUS PROBLEMS AND SOCIO-ECONOMIC STATUS OF THE FAMILY.
There is a clear but small socio-economic gradient with lower socio-economic groups showing a higher level of overall previous problems (rs = 0.1, p< .0001).
Recent Health (last 6 months) In addition to previous health more detailed questions dealt with health in the last six months. The answers to these questions were used to construct an index based upon weighting the incidence of an illness by the treatment received and summating for all illnesses. Table 33 shows the comparison for type of pre-school centre and table 34 that for socio-economic status. In both cases the differences between groups appear to be minimal but with large variation indicated by the large standard deviations.
TABLE 3.11. HEALTH INDEX FOR LAST 6 MONTHS BY TYPE OF PRE-SCHOOL CENTRE
Type of pre-school centre
Total
Nursery Class Playgroup Private DN LA centre
Mean SD Mean SD Mean SD Mean SD Mean SD
Health for last
6 months
14.6 19.0 17.0 25.7 15.3 20.2 15.2 28.2 15.6 23.3
An analysis of variance reveals that the differences between the groups are statistically significant (F = 4.23, df = 3, 2115, p< .005) and Scheffé post hoc companies reveal that this result is due to the difference between children using playgroups and LA centres. This was the only significant paired comparison.
30
TABLE 3.12. HEALTH INDEX FOR LAST 6 MONTHS BY SOCIO-ECONOMIC GROUP
This index is based upon the number of days of illness, another index based upon separate illness bouts revealed a similar pattern. There is no variation related to socio-economic status. This was confirmed by a one way ANOVA, which produced no significant differences between socio-economic groups.
Life events for child One question asked whether the child had experienced any event that may have adversely affected the child’s development. Events included bereavement, moving house, birth of sibling, divorce/separation, parental illness, problems with sibling, transition between home/pre-school, birth trauma, family violence, accident/hospitalisation, parental absence, and other. The total of such events was calculated for each child, and used to compare children from the different pre-school centre and socio-economic status groups as shown in the following tables. For the majority of children (67%) parents did not report any event which they may have had some influence on the child child’s development. About a quarter of the sample reported one or two potentially disruptive events and 7.2% reported three or more such events. Partly these data reflect the memories and reporting tendencies of parents as well as the actual occurrence of such events. TABLE 3.13: NUMBER OF DISRUPTIVE LIFE EVENTS AND TYPE OF PRE-SCHOOL CENTRE.
No. of
disruptive
life events
Type of pre-school centre Total
Nursery Class Playgroup Private DN LA centre
N % N % N % N % N %
0 412 70.7 413 68.4 334 65.4 262 62.5 1421 67.0
1 1 0.2 6 1.0 4 0.8 8 1.9 19 0.9
2 129 22.1 142 23.5 141 27.6 112 26.7 523 24.8
3 33 5.7 34 5.6 26 5.1 29 6.9 122 5.8
4 + 8 1.4 9 1.5 6 1.2 8 1.8 32 1.5
Total 583 100 604 100 511 100 419 100 2117 100
31
TABLE 3.14: NUMBER OF DISRUPTIVE LIFE EVENTS AND SOCIO-ECONOMIC STATUS OF FAMILY.
There were no significant differences between either pre-school centre groups or socio-economic groups.
Summary of health, development and behaviour When the information concerning the period from birth to the time of the interview is considered, there is a trend for more problems for lower socio-economic groups. The small differences between pre-school groups only partly reflect socio-economic variation. The higher incidence of problems in physical health, development and behaviour for the LA centre group may well reflect their socio-economic characteristics. However, the level of previous problems for the nursery class group, which is lower than that of the other groups, is not to be expected from the average socio-economic standing of this group. Considering the last six months, the data on recent health reveals no significant differences either related to type of pre-school centre or socio-economic status. The data on potentially disruptive life events reveal only very slight differences between either pre-school groups or socio-economic groups
32
CHILDREN’S ACTIVITIES IN THE HOME
The data available from the parent interview deal with TV watching, bedtime, activities with friends and others, and educational activities. The educational activities included reading, library visits, play with letters and numbers, painting and drawing, song and rhyme. An estimate of the frequency of these educational activities was established. From these data an index of educational activities has been established.
Educational activities The index of the educational environment of the home varied from 0-31 and approximated a normal distribution over the whole sample. The variation in the index was considered across type of pre-school centre, and for socio-economic status.
TABLE 4.1: EDUCATIONAL ENVIRONMENT AND TYPE OF PRE-SCHOOL CENTRE.
Type of pre-school centre
Total
Nursery Class Playgroup Private DN LA centre
Mean SD Mean SD Mean SD Mean SD Mean SD
Educational
Environment
16.3 4.5 15.9 4.4 17.9 4.1 15.5 5.1 16.4 4.6
There are significant differences between pre-school groups (ANOVA, F(3,2094) = 27.8, p< .0001). Scheffé post hoc comparisons revealed that the private day nursery group scored significantly higher than all the other groups. Also the nursery class group scored significantly higher than the LA centre group. Other differences were not statistically significant. TABLE 4.2: EDUCATIONAL ENVIRONMENT AND SOCIO-ECONOMIC STATUS.
Socio-economic status can be regarded as a structural variable, while educational activities may be regarded as a process variable. When viewed in this way, educational activities may be regarded as a part of the process whereby the structural variable of socio-economic status comes to have its effect on child development variables. Of course there would be more to this process than just educational activities but they may well be a part.
33
Television watching in the home The amount of TV watching in the home was compared across pre-school centre groups.
TABLE 4.3: AMOUNT OF TV AND TYPE OF PRE-SCHOOL CENTRE.
Amount of
TV Type of pre-school centre Total
Nursery Class Playgroup Private DN LA centre
Hours per day N % N % N % N % N %
0 hours 5 0.9 12 2.0 14 2.7 14 3.3 45 2.1
Up to 1 hour 164 28.0 155 25.7 247 48.4 183 43.7 749 35.4
There is less TV watching recorded for the children in the private day nursery group than for other children, but the difference is small. These differences are small but statistically significant
(2 = 114.6, df = 9, p< .0001). The variation by socio-economic status was also examined.
TABLE 4.4: AMOUNT OF TV AND SOCIO-ECONOMIC STATUS OF THE FAMILY.
There is a gradient of increasing TV watching as the socio-economic status groups become lower in status (rs = .21, p< .0001). Overall around half of the children are reported to be watching TV or video for 1-3 hours daily.
34
Rules In addition to asking about TV watching, the interview enquired whether the household had rules for children watching TV or video. Also parents were asked about regular bedtimes for children. Regarding TV and video, the pre-school centre groups results are shown here.
TABLE 4.5: RULES FOR TV OR VIDEO AND TYPE OF PRE-SCHOOL CENTRE.
Rules
TV/video Type of pre-school centre Total
Nursery Class Playgroup Private DN LA centre
N % N % N % N % N %
Yes 315 53.8 306 50.7 306 59.9 217 51.8 1144 54.0
No 270 46.2 298 49.3 205 40.1 202 48.2 975 46.0
Total 585 100 604 100 511 100 419 100 2119 100
There were borderline significant differences between pre-school groups (2 = 14.7, df = 6, p< .01). The private day nursery group were slightly more likely to have such rules than the other groups, reflecting the socio-economic status differences between pre-school centre groups. However, the LA centre families who have the lowest socio-economic profile show a similar likelihood of such a rule as nursery class and playgroup families. The relationship with socio-economic status is shown in the next table.
TABLE 4.6: RULES FOR TV OR VIDEO AND SOCIO-ECONOMIC STATUS.
There is a clear gradient with higher socio-economic groups being more likely to have rules concerning children watching TV or video (rs =.15, p< .0001). Another topic covered within the context of the home environment was rules or regularity with regard to children’s bedtime. There were overall significant differences between pre-school
groups (2 = 16.9, df = 3, p< .0001). The relationship with type of pre-school centre used was similar to the previous result with the private day nursery group being slightly more likely to have
35
such a rule, reflecting the socio-economic status differences between the pre-school centre groups. TABLE 4.7: RULES RELATING TO BEDTIME AND TYPE OF PRE-SCHOOL CENTRE.
Regular
Bedtime Type of pre-school centre Total
Nursery Class Playgroup Private DN LA centre
N % N % N % N % N %
Yes 495 84.6 506 83.8 460 90.0 338 80.7 1799 84.9
No 90 15.4 98 16.2 51 10.0 81 19.3 320 15.1
Total 585 100 604 100 511 100 419 100 2119 100
The relationship with socio-economic status is revealed in the next table.
TABLE 4.8: RULES RELATING TO BEDTIME AND SOCIO-ECONOMIC STATUS OF THE FAMILY.
Again there is a clear socio-economic status gradient with higher socio-economic households being more likely to have rules or regularity with regard to children’s bedtime (rs = .14, p< .0001).
Summary of children’s activities in the home The data on children’s activities in the home reveal differences related to the socio-economic status of the families. The differences between the children in the four pre-school groups reflect to some extent the socio-economic differences of their families. The children in the private day nursery group which has the highest socio-economic profile, engage in more educational activities, watch TV less often and are more likely to have rules concerning TV and bed time. However, while the families using LA centres have the lowest socio-economic profile, and show a lower level of educational activities and rules regarding bedtime. In other areas i.e. TV watching, and rules regarding TV, the LA centre families are not particularly different than for the families using nursery classes and playgroups.
36
PRE-SCHOOL PROVISION AND CHILDCARE HISTORY.
This section deals with the use of the target pre-school centre and the childcare history of the child before the start of the study.
The target pre-school centre The centre that children were currently attending and from which they had been recruited to the study was regarded as the target centre for a child. Children attended their pre-school centre between 2 and 10 sessions a week and the variation across type of pre-school centre was considerable as shown in table 5.1.
TABLE 5.1: SESSIONS ATTENDED AND TYPE OF PRE-SCHOOL CENTRE.
Sessions Type of pre-school centre
Total
Nursery Class Playgroup Private DN LA centre
N % N % N % N % N %
2 0 0 139 22.8 68 13.2 1 0.2 208 9.7
3 0 0 173 28.4 76 14.8 30 6.9 279 13.0
4 1 0.2 106 17.4 105 20.4 40 9.2 252 11.8
5 486 82.8 173 28.4 92 17.9 40 9.2 252 11.8
6 0 0 1 0.2 46 8.9 42 9.7 89 4.2
7 1 0.2 1 0.2 5 1.0 0 0 7 0.3
8 0 0 0 0 26 5.1 18 4.2 44 2.1
9 0 0 11 1.8 3 0.6 0 0 14 0.6
10 99 16.9 5 0.8 93 18.1 262 60.5 459 21.4
Total 587 100 609 100 514 100 433 100 2143 100
There were significant differences between pre-school groups (Kruskal-Wallis, 2 = 79.7, df = 3, p< .0001). The children at playgroup had the lowest levels of attendance, while the LA centre children had by far the highest level of attendance. The great majority (82.8%) of nursery class children attended half time, with almost all the remainder attending full-time. The patterns of attendance within the other types of pre-school centre were more diverse. The majority of playgroup children attended for less than half-time, and only 3% of playgroup children attend for more than half-time. To some extent these differences in attendance reflect the demands of parents for particular amounts of provision. However, they also reflect restrictions upon sessions available. This latter point particularly applies to nursery classes and playgroups that are often only open half-time and, in the case of rural playgroups, often open for less than half-time.
37
TABLE 5.2: SESSIONS ATTENDED AND SOCIO-ECONOMIC STATUS.
The lowest socio-economic groups, semi and unskilled and unemployed/student are the most likely to attend for the maximum number of sessions per week (10) (rs = .09, p< .001). This reflects the substantial use of LA centres for these groups, LA centres having the highest level of full-time attendance.
Age of starting target pre-school centre The age at which children first started at the target pre-school centre varied with type of pre-school centre and with socio-economic status as follows.
TABLE 5.3: AGE OF STARTING CENTRE AND TYPE OF PRE-SCHOOL CENTRE.
Type of pre-school centre
Total
Nursery Class Playgroup Private DN LA centre
Mean SD Mean SD Mean SD Mean SD Mean SD
Age started centre
in months
43.8 3.9 34.0 3.8 25.4 12.1 26.1 11.9 33.1 11.3
The children in the private day nurseries and LA centres were likely to start younger, and, on average, shortly after 2 years of age. The children in the playgroups started, on average, around 2 years 10 months, and the children in the nursery class did not start until around 3 years 8
38
months on average. This has obvious implications for the duration of their pre-school experience in their current pre-school centre. TABLE 5.4: AGE STARTED CENTRE AND SOCIO-ECONOMIC STATUS.
The younger age of starting for the two higher socio-economic groups reflects their greater presence in private day nurseries where children start younger.
Reasons for attending the target centre Parents were asked for their reasons for choosing the particular pre-school centre that their child was currently attending. For the total sample the most common reason given was the nearness to home (39.3%), followed by the reputation of the centre (30.6%) and whether a sibling attends (29.4%). Less often mentioned was the atmosphere of the centre (16.8%) and, surprisingly, educational activities were little mentioned (5.9%). The reasons of cost (2.4%), part-time vs. full-time provision (2.5%) and care available from an early age (0.8%) were very rarely mentioned and are left out of the following tables. Other diverse reasons were mentioned by 4.8% of parents. These reasons are displayed by type of pre-school centre here.
TABLE 5.5: REASONS FOR CHOICE OF CENTRE VARIED BY TYPE OF PRE-SCHOOL CENTRE.
Reason for
choice of
centre
Type of pre-school centre Total
Nursery Class Playgroup Private DN LA centre
% % % % %
Near home
47.9 37.9 33.5 36.4 39.3
Reputation
19.5 33.8 36.4 34.3 30.6
Sibling attends
41.5 33.6 17.6 21.0 29.4
Atmosphere
9.9 12.9 32.1 13.3 16.8
Educational
activities
5.6 3.8 11.4 2.9 5.9
Other
12.3 14.2 15.4 18.3 14.8
39
There were significant differences between pre-school groups mentioned. Being near to home and sibling attending were reasons mentioned more often by the nursery class group than by the other groups. The parents in the nursery class group were less likely to mention the reputation or atmosphere of the centre as a reason for choice. The playgroup parents also mentioned a sibling’s attendance more often as a reason for choice, but were less likely to mention atmosphere or educational activities as a reason. The parents in the private day nursery group did not mention a sibling’s attendance as often as other parents but were twice as likely to mention atmosphere and educational activities as the rest of the sample. The parents in the LA centre group were least likely to mention educational activities but otherwise followed the general pattern of the total sample.
Here the differences related to socio-economic status are considered.
TABLE 5.6: REASON FOR CHOICE OF CENTRE VARIED BY SOCIO-ECONOMIC STATUS OF FAMILY.
Reason for
choice of
centre
Socio-economic status of family Total
Professional/
Intermediate
Skilled
Non-manual
Skilled
Manual
Semi- or
Unskilled
Unemployed/
Student
% % % % % %
Near home
37.2 39.4 45.1 48.0 36.4 39.1
Reputation
34.2 30.6 29.0 23.5 27.9 30.5
Sibling attends
26.0 30.6 30.9 27.9 33.1 29.3
Atmosphere
26.7 16.5 9.3 6.7 8.4 16.9
Educational
activities
10.1 4.0 6.8 1.7 3.2 6.0
Other
14.7 15.5 13.0 15.6 14.5 14.8
Socio-economic groups did show significant differences in reasons given for choice of centre. The most striking difference related to socio-economic status is that atmosphere and educational activities show a clear socio-economic status gradient, being most often mentioned the higher the socio-economic status group. The other reasons do not show marked socio-economic status variation. However, the skilled manual and semi-skilled/unskilled groups appear to be more concerned with the pre-school centre being near to home. This may reflect differences in travel to work patterns.
Parental visits to the pre-school centre Parents were asked whether they had visited the centre in the last month other than to drop off or pick up their child. Table 5.7 shows how such visits varied with type of pre-school centre.
40
TABLE 5.7: PARENTAL VISITS TO CENTRE VARIED WITH TYPE OF PRE-SCHOOL CENTRE.
Parental
Visits to
Centre
Type of pre-school centre Total
Nursery Class Playgroup Private DN LA centre
N % N % N % N % N %
Yes 164 28.0 242 40.1 148 29.0 129 30.9 683 32.3
No 421 72.0 362 59.9 362 71.0 288 69.1 1433 67.7
Total 585 100 604 100 510 100 417 100 2116 100
There were overall pre-school group differences (2 = 24.4, df = 3, p< .0001). Parents are more likely to visit playgroups than any other type of centre. The other three types of centre show similar levels of parental visits other than to drop off and pick up children. TABLE 5.8: PARENTAL VISITS VARIED WITH SOCIO-ECONOMIC STATUS.
The differences between socio-economic groups were small but significant (2 = 9.5, df = 4, p< .05). The lower socio-economic groups tend to be less likely to visit centres than in the professional/intermediate or skilled socio-economic groups.
Parents were also asked the reasons for their visits to the centre. Specifically they were asked whether the visits had involved: 1. time with the children 2. fundraising activities 3. maintaining the physical setting of the pre-school centre. 4. Meetings with staff and/or others. 5. Policy discussions. 6. The parent being employed at the centre. The applicability of these reasons for parents using different types of pre-school centre is shown in the following table.
41
TABLE 5.9: REASONS FOR VISITING THE CENTRE IN RELATION TO TYPE OF PRE-SCHOOL CENTRE.
Reasons for
visit Type of pre-school centre Total
Nursery Class Playgroup Private DN LA centre
% % % % %
Time with children
18.1 27.3 5.7 6.2 15.4
Fundraising 5.1 10.1 5.3 7.4 7.0
Maintenance 0.3 4.3 1.0 1.2 1.8
Meetings 10.6 10.3 14.7 19.3 13.2
Policy 0.5 2.2 1.6 1.4 1.4
Employment 0.2 0.2 2.7 0.3 0.9
Reasons for visiting a centre showed significant pre-school group differences. It is clear that parents are more likely to visit playgroups to spend time with children than other centre, being about five times more likely to express this reason than parents using a private day nursery or LA centre are. Parents of children in a nursery class are about three times as likely to express this reason as parents using a private day nursery or LA centre are. Parents using playgroups are also more likely to visit centres for reasons connected with fundraising, maintaining the building, and policy discussions. Parents using LA centres are more likely to visit a centre for a meeting with staff than for any other reason and are more likely to express this reason than parents using other types of centre. Very few parents in this study are employed in the centres their children attend, but this most often happens in private day nurseries (2.7%).
The applicability of these reasons for parents from different socio-economic groups is shown here. TABLE 5.10: REASONS FOR VISITING CENTRE IN RELATION TO SOCIO-ECONOMIC STATUS OF FAMILY.
Reason for
visit
Socio-economic status of family Total
Professional/
Intermediate
Skilled
Non-manual
Skilled
Manual
Semi- or
Unskilled
Unemployed/
Student
% % % % % %
Time with children
15.0 16.8 17.9 14.5 13.6 15.4
Fundraising
7.8 6.4 7.4 6.7 6.3 7.0
Maintenance
1.4 2.1 1.2 2.2 2.2 1.8
Meetings
16.9 10.1
0.9
13.0 8.4 13.2 13.2
Policy
2.3 0 2.2 0.9 1.4
Employment
1.0 1.2 1.4 0.6 0 0.9
42
The socio-economic groups are similar in terms of visiting a centre to spend time with children, fundraising and maintenance of buildings. The reasons of meetings with staff and policy discussions are more likely to apply to parents from the higher socio-economic groups, particularly the professional/intermediate parents. These latter differences were statistically significant ( p< .0001). Overall the most common reason was to spend time with children (5.4%), followed by attendance at meetings (13.2%), and then fundraising activities (7%). The other reasons were all referred to by less than 2% of parents.
Childcare History Parents were asked about their use of childcare from the child’s birth. For each childcare arrangement, the child’s age at the start and end of the period of childcare, and the number of hours per week were recorded. From this record the child’s experience of childcare was established in terms of: Total amount of relative care. Total amount of other individual care Total amount of group care Total care besides attending target centre Amount of care in target centre before entering the study Total amount of care including target centre before entering study These data are rather course measures of previous childcare as they ignore patterns of use, timing of starting and stopping, and other aspects which would merit further study. At the time of entering the study, some children would have had considerable experience of the target pre-school centre (i.e. their current centre), while others would have recently started at the target centre. To allow for this, the calculations for childcare experience were done both including the time at the target centre and excluding this time.
For 37 children in the study, there had been varying degrees of foster care, where the child was cared for 24 hours a day by a non-parent. This aspect of childcare was qualitatively different from the other forms of childcare, and therefore the childcare figures were calculated to remove foster care.
Type of pre-school centre The childcare data were analysed in relation to the children’s current pre-school centre (target centre). This breakdown is shown overleaf.
43
TABLE 5.11: PRE-TARGET CHILDCARE (No. OF HOURS IN CHILD’S LIFE) AND TYPE OF PRE-SCHOOL CENTRE.
Total Care 1178 1838 761 1409 1278 1856 845 1558 1017 1689
Total Care +
target
1261 1835 918 1405 2595 2079 2295 2065 1690 1965
Total N 584 604 511 420 2119
The differences between the pre-school groups in the use of relative care (e.g. grandmother, aunt) are statistically significant (ANOVA, F(3,2115) = 3.5, p< .05) but not dramatic and post-hoc paired comparisons (Scheffé test) do not reveal any particular pairs to be significantly different.
However, the differences in the use of individual non-relative care (e.g. childminder, nanny) are more substantial. The overall differences are statistically significant (ANOVA, F(3,2115) = 16.6, p< .0001) and Scheffé post-hoc paired comparisons reveal that the private day nursery group has
significantly greater use of such childcare than any other group. The nursery class, playgroup and LA centre group are not significantly different. The use of group care (e.g. crèche, nursery) show significant differences overall (ANOVA, F(3,2115) = 9.1, p< .0001). Scheffé post-hoc
comparisons reveal that the play group children have received significantly less group care than all the other children in the study. Considering all childcare other than the target centre, there are significant pre-school group differences overall (ANOVA, F (3,2115) = 12.0, p< .0001). Scheffé post-hoc comparisons reveal that the pattern in the private day nursery and nursery class
children have significantly more childcare than the playgroup and LA centre children. Finally, when the total childcare including the target centre (pre-study) is considered, there again are significant overall differences (ANOVA, F (3,2115) = 104.2, p< .0001). Scheffé post-hoc
comparisons reveal that the LA centre and private day nursery children receive more total childcare than the nursery class and playgroup centre children. The total non-parental childcare (including target centre) received by the children in the private day nursery and LA centres is over twice that received by the nursery class children and three times that received by the playgroup children. While the overall levels for pre-target centre care are similar, it should be considered that the private day nursery and LA centre children typically start at their target centres at younger ages. Hence the pre-target childcare is compressed into a shorter span of time. The childcare history data were then considered in relation to socio-economic status of the family
44
TABLE 5.12: PRE-TARGET CHILDCARE (No. OF HOURS) AND SOCIO-ECONOMIC STATUS.
The total non-parental childcare received by children is greater for the highest socio-economic groups (ANOVA, F(4,2107)=45.8, p<.0001), and lowest for the children in the unemployed/student groups. It can be seen that the children in the professional/intermediate group receive three times as much non-parental childcare as the children in the unemployed/student group (Scheffé post hoc comparisons). When considering childcare (pre-target centre) the differences are less marked but highest socio-economic groups are still the highest, particularly the professional/intermediate and skilled non-manual groups (ANOVA, F(4,2107)=23.5, p<.0001). These are also the socio-economic groups that show the highest level of maternal full-time employment (table 1.9, page 11). When the pre-target childcare is broken down by type of care, the highest socio-economic groups show higher use of individual (non-relative) childcare than the other groups. The professional/intermediate and unemployed/student groups least use relative care (ANOVA, F(4,2107)= 3.4, p<.01). The variation in amount of childcare experienced by the children within any category, be it type of pre-school centre or socio-economic, is very large. This variation is indicated by the large standard deviation (SD) in each cell of the tables. Probably this fact is as important as the overall differences between pre-school and socio-economic groups. This fact indicates that the differences within groups are as great and possibly larger than the differences between groups. This provides the opportunity for the study to consider childcare history variables as a variable within the pre-school groups, with possibly different effects within different pre-school or socio-economic groups.
45
Total of non-parental caregivers From the childcare histories, it was possible to extract the number of separate non-parental care giving arrangements experienced by the child since birth. TABLE 5.13: TOTAL OF NON-PARENTAL CAREGIVERS AND TYPE OF PRE-SCHOOL CENTRE.
Total of non-
parental
caregivers
Type of pre-school centre Total
Nursery Class Playgroup Private DN LA centre
N % N % N % N % N %
0 161 27.5 285 47.2 154 30.1 191 45.5 791 37.3
1 214 36.6 192 31.8 184 36.0 152 36.2 742 35.0
2 110 18.8 94 15.6 104 20.4 61 14.5 369 17.4
3 63 40.8 23 3.8 42 8.2 12 2.9 140 6.6
4 + 37 6.3 10 1.7 27 4.3 4 1.0 78 3.7
Total 585 100 604 100 511 100 420 100 2120 100
The children in the nursery class group have experienced a larger number of non-parental caregivers and this probably reflects their later starting age, i.e. more time has passed where they could have had non-parental care.
TABLE 5.14: TOTAL OF NON-PARENTAL CAREGIVERS AND SOCIO-ECONOMIC STATUS.
There is a trend across the socio-economic groups for lower socio-economic groups to have had a smaller number of non-parental caregivers before starting at their current pre-school centre. This appears to be related to neither starting age, in that number of non-parental caregivers and starting age were uncorrelated, nor the type of care used.
46
SUMMARY
In the EPPE study, parental interviews yielded considerable information about the parents, families and children who are part of the study. Using this data, firstly the socio-economic characteristics of the sample were derived from information on parental occupations. The socio-economic differences for the groups using different types of pre-school centre were then described. Parental characteristics of level of employment, marital status, parental age and qualifications all varied with socio-economic classification and the variation by type of pre-school centre reflected this variation. Maternal level of paid employment was also linked to type of pre-school centre and amount of previous childcare used. Family types, ethnicity and language use within the sample were described and again these varied by socio-economic classification and this was reflected in the distribution by type of pre-school centre. When the child’s health, development and behaviour was considered, to a large extent, a similar pattern emerged of type of pre-school differences following the pattern of socio-economic differences. However, for the child’s health, development and behaviour an exception to this pattern was the lower level of problems reported for the nursery class group which would not have been expected from their socio-economic status. Recent health and potentially disruptive life events for children appeared to be related neither to social class nor type of pre-school centre. Children’s activities in the home were considered in terms of educational activities, TV and video watching, and rules concerning TV and bedtime. Educational activities revealed a clear socio-economic trend with differences related to type of pre-school reflecting these socio-economic differences in the pre-school groups. Rules regarding TV and bedtime, however, did not entirely follow this pattern. In considering the use and involvement with the pre-school centres, there were some relationships with socio-economic differences. For example, parents from higher socio-economic groups were more likely to visit centres and more likely to be attending meetings with staff and to be involved in policy discussions. Parents from higher socio-economic groups were also more likely to be concerned with the atmosphere and educational activities in their choice of pre-school centre. However, there were a number of differences which were related to type of pre-school centre rather than deriving from parental socio-economic differences. These included: - the age of starting which was lower for both private day nurseries and LA centres. - the number of sessions attended which showed a different pattern for each type of pre-school
centre. - the relationship between maternal level of paid employment was linked to pre-school centre
use for private day nurseries and LA centres but not for nursery classes or playgroups. - also visits to centres were more likely in playgroups than other types of centre and for
playgroups, spending time with children and fundraising activities were also more common than for the other types of pre-school centre.
The childcare histories of the children revealed enormous diversity across the whole sample and for children within each type of pre-school centre. Overall the children using private day nurseries and LA centres had more than twice as much time non-parental care as the children in the nursery classes and playgroups. This difference was largely accounted for by their time spent in their current pre-school centre where they had started earlier and were attending for more sessions and hours per week. There was also a strong association between level of maternal paid employment and previous childcare use. Those mothers who were employed for longer hours had a history of using greater amounts of childcare. The socio-economic differences in childcare histories largely reflect the differential use of types of pre-school centre and differential levels of maternal paid employment by the different socio-economic groups, see
Technical Paper 2, Characteristics of the EPPE Project : sample at entry to the study. (Sammons et al, 1999).
47
This range of differences within the sample will need to be considered in dealing with children’s progress through pre-school and into primary school. Some of these factors may be related to developmental outcomes and later stages of the study can investigate this possibility and where necessary allow for such factors in evaluating the contribution of pre-school and other factors to developmental progress.
REFERENCES Office of Population, Censuses and Surveys (1995), Classification of occupations and coding index. London: HMSO. Office for National Statistics (1999), Social Trends, 29. London: HMSO. Prior, G., Courtenay, G., & Charkin, E. . Report on a survey of parents of three and four-year-olds. Unpublished report to DfES, March, 1999. Sammons, P., Sylva, K., Melhuish, E., Siraj-Blatchford, Taggart, B., Smees, R, Dobson, A., Jeavons, M., Lewis, K., Morahan, M., & Sadler, S. (1999). The Effective Provision of Pre-School Education (EPPE) Project. Technical Paper 2. Characteristics of the Effective Provision of Pre-school Education (EPPE) Project Sample at Entry to the Study. Institute of Education, University of London. London. Sylva, K., Sammons, P., Melhuish, E., Siraj-Blatchford, I., & Taggart, B. (1999). The Effective Provision of Pre-School Education (EPPE) Project. Technical Paper 1. An Introduction of EPPE. Institute of Education, University of London. London.
Ordering Information: The Bookshop at the Institute of Education,