TECHNICAL PAPER SPECIAL EVENT PLANNING AND MANAGEMENT: MICRO OPERATIONS IN THE MACRO LANDSCAPE. A CASE STUDY OF THE SINGAPORE GRAND PRIX. Authors: Julian Laufer also Presenter ([email protected]), Nick Fellows, Subramanian Gopalakrishnan and Zuraidi bin Mohamed Saifollah About the Authors Julian Laufer is a Principal Transport Planner in PTV’s Melbourne office with more than ten years of transportation consulting, urban planning and modelling experience. Julian’s broad experiences in transport planning cover town planning, micro-simulation of traffic and transport, public transport planning, capacity and signal analysis, pedestrian planning and simulation and economic cost benefit appraisal. Julian has qualifications in Geography and demographics and has Master’s degrees in both Economics and Transport Engineering. Julian is both a Chartered Professional Engineer and a Certified Practising Planner. Nick Fellows is a Director of PTV Asia-Pacific with twenty years experience transport and traffic planning. Nick is a member of Chartered Institute of Logistics and Transport. Nick has recently managed a number of high profile transport and traffic studies in Singapore including travel characteristic assessment and accessibility and circulation design and impact assessments for numerous landmark developments in Singapore including Maritime Square, Resorts World Sentosa, Marina Boulevard and Circle Line MRT. Subramanian (Subbu) Gopalakrishnan is the manager of the PTV Dubai office and holds qualifications in Engineering and Master’s degrees is both Planning and Transportation Systems Engineering. Subbu is a member of the Institute of Transportation Engineers (USA) and recently completed a similar investigation for the first Grand Prix in Abu Dhabi. Zuraidi (Aidi) bin Mohamed Saifollah is a Senior Transport Consultant and is an accredited PTV Trainer of VISUM and VISSIM. Aidi has considerable experience in developing multi- modal transportation models and has experience in a variety of public and private sector transportation projects in Singapore. ABSTRACT The first Grand Prix to be held in Singapore in recent times took place in 2008. The circuit utilised the road network throughout the Central Business District including the sites of the conference centre and several congested arterial routes. Managing this landscape for commuters, public transport services, tourists and race personnel consequently provided operational and managerial planning considerations in the lead in and during event days. To investigate methods of amelioration within the Singapore network, PTV developed a VISUM network incorporating all major land uses and junction detail within the study area. The transport setting also incorporated significant public transport services that deliver tens of thousands of persons to the city each day. Transport operations were then exported directly into VISSIM for simulation modelling, allowing for accurate representation of signal phasing, pedestrian behaviour at crossings and route choice for traffic through the network. This approach ensured direct consistency of decisions made by drivers in the strategic VISUM model when simulating the behavioural choices through the VISSIM network. The modelling methodology allowed for accurate scenario testing and evaluation of schemes in the lead up to the event, including road closures and re-routing of public transport services to alleviate network delay.
Transcript
TECHNICAL PAPER SPECIAL EVENT PLANNING AND MANAGEMENT:
MICRO OPERATIONS IN THE MACRO LANDSCAPE. A CASE STUDY OF THE SINGAPORE GRAND PRIX.
Authors: Julian Laufer also Presenter ([email protected]), Nick Fellows, Subramanian Gopalakrishnan and Zuraidi bin Mohamed Saifollah
About the Authors Julian Laufer is a Principal Transport Planner in PTV’s Melbourne office with more than ten years of transportation consulting, urban planning and modelling experience. Julian’s broad experiences in transport planning cover town planning, micro-simulation of traffic and transport, public transport planning, capacity and signal analysis, pedestrian planning and simulation and economic cost benefit appraisal. Julian has qualifications in Geography and demographics and has Master’s degrees in both Economics and Transport Engineering. Julian is both a Chartered Professional Engineer and a Certified Practising Planner.
Nick Fellows is a Director of PTV Asia-Pacific with twenty years experience transport and traffic planning. Nick is a member of Chartered Institute of Logistics and Transport. Nick has recently managed a number of high profile transport and traffic studies in Singapore including travel characteristic assessment and accessibility and circulation design and impact assessments for numerous landmark developments in Singapore including Maritime Square, Resorts World Sentosa, Marina Boulevard and Circle Line MRT.
Subramanian (Subbu) Gopalakrishnan is the manager of the PTV Dubai office and holds qualifications in Engineering and Master’s degrees is both Planning and Transportation Systems Engineering. Subbu is a member of the Institute of Transportation Engineers (USA) and recently completed a similar investigation for the first Grand Prix in Abu Dhabi.
Zuraidi (Aidi) bin Mohamed Saifollah is a Senior Transport Consultant and is an accredited PTV Trainer of VISUM and VISSIM. Aidi has considerable experience in developing multi-modal transportation models and has experience in a variety of public and private sector transportation projects in Singapore.
ABSTRACT The first Grand Prix to be held in Singapore in recent times took place in 2008. The circuit utilised the road network throughout the Central Business District including the sites of the conference centre and several congested arterial routes. Managing this landscape for commuters, public transport services, tourists and race personnel consequently provided operational and managerial planning considerations in the lead in and during event days.
To investigate methods of amelioration within the Singapore network, PTV developed a VISUM network incorporating all major land uses and junction detail within the study area. The transport setting also incorporated significant public transport services that deliver tens of thousands of persons to the city each day. Transport operations were then exported directly into VISSIM for simulation modelling, allowing for accurate representation of signal phasing, pedestrian behaviour at crossings and route choice for traffic through the network. This approach ensured direct consistency of decisions made by drivers in the strategic VISUM model when simulating the behavioural choices through the VISSIM network. The modelling methodology allowed for accurate scenario testing and evaluation of schemes in the lead up to the event, including road closures and re-routing of public transport services to alleviate network delay.
Special Event Planning and Management Laufer et al Page 1
IPENZ Transportation Group Conference Christchurch, March 2010
INTRODUCTION Planning for transport and traffic operations of major events is a complex and divisive topic in the urban landscape, where a diverse mix of regular and irregular trip purposes can overlap. This can lead to a significant issue for managing the event and the behaviour of the residual community who continue to pursue daily activities. This paper provides an interesting opportunity to explore the capabilities and systems in place by users across the globe for assessment of best practice systems.
Excluding the peripheral activities associated with major events, such as accommodation and tourism activities, major events provide a myriad of complexity for organising authorities. Some major events are limited to a single location and timeframe, with direct connections to transportation services. Other events such as the Australian Moto Grand Prix (Phillip Island, Victoria), British Formula One (Silverstone) or Abu Dhabi Formula One (Yas Marina) are located in the regions and while encountering various planning issues, avoid the competing demands of an urban transportation system.
The Singapore Grand Prix provides the complexity of operations in a road circuit within the Central Business District, in a similar measure to that of Monaco. This measure provides competing demands and requirements for event organisers against the transport needs of regular journey to work trips. The Singapore Grand Prix circuit has additional dimensions as a street circuit. The event is operated as the world’s first night race and provides both a longer and wider street track than the Monaco event.
To investigate planning and preparation for this event, PTV and the Singapore Land Transport Authority utilised a mesoscopic VISUM transportation model of the northern Central Business District (the Suntec area). This VISUM mesoscopic model was developed to assess traffic management solutions for the inner city and incorporates an area covering the entire Grand Prix Circuit, the Singapore International Convention and Exhibition Centre (SICEC), Esplanade Theatres on the Bay, Raffles City Tower and the Padang where various celebrations occur. The model examines the complexity of traffic operations, including public transport services and several major arterials of the Central Business District. Implementation of suitable traffic management mitigation measures assists in ameliorating the traffic congestion during such events.
The VISUM transport model developed for the Suntec area incorporates intersection configurations, including geometric features and turn controls with a capacity focus provided on the model nodes rather than simply the links. This approach also allows for direct export of demand, network and control systems to the PTV VISSIM micro-simulation software for detailed investigation of specific locations. VISSIM allows for the simulation and analysis of multi-modal transport services including consideration for pedestrian interactions, on street parking measures and SCATS signal operations including adaptive controls.
The Suntec area transportation models were developed for the two busiest periods of demand during the course of the week. These time periods are the Friday evening peak period, and the Saturday afternoon peak. While these time periods are less conventional than the more regular journey to/from work investigations, this approach allows for the different trip purposes in the landscape to be reflected.
The PTV VISION SUITE The PTV Group provides cutting-edge software and technology to enable agencies to plan and manage their traffic and transportation systems. PTV provides software development and innovation with tight links to research and educational institutions.
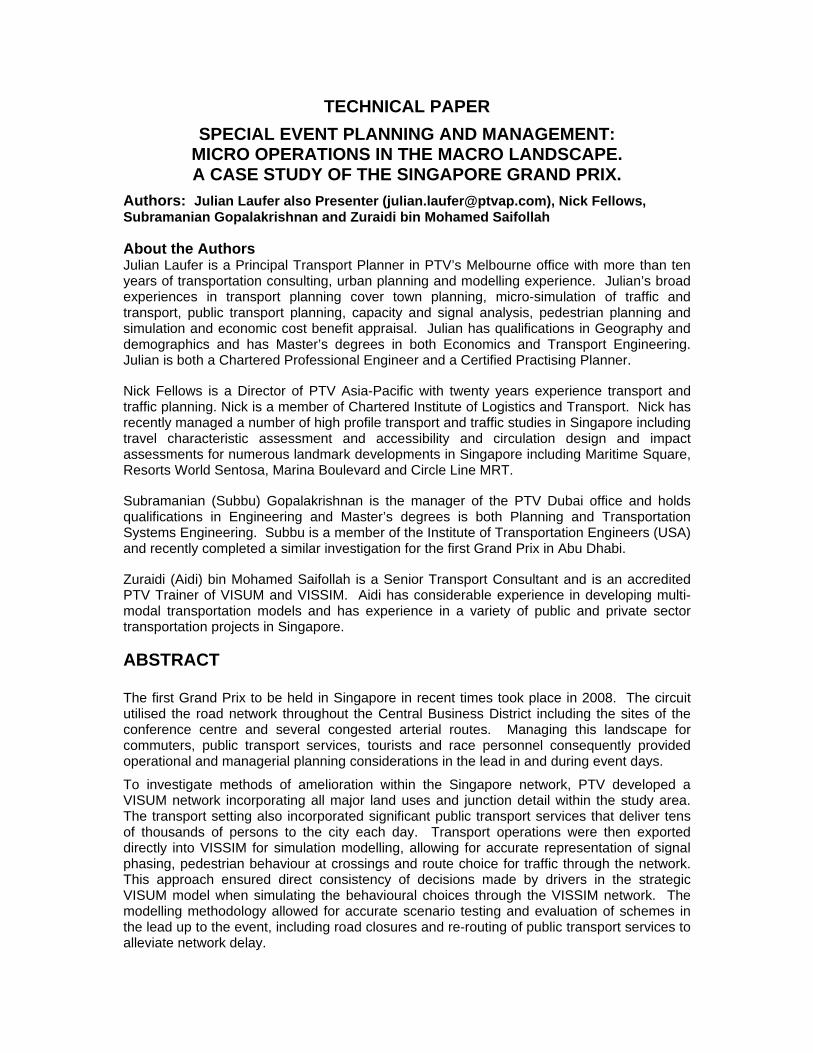
The PTV Vision suite contains the VISUM software for traffic planning (PTV 2009a) and VISSIM for simulation purposes (PTV 2009b). The PTV Vision suite shown in Figure 1 is the world’s only system that covers the entire range of transportation infrastructure planning and traffic engineering tasks, solving current problems in an efficient manner in order to meet
Special Event Planning and Management Laufer et al Page 2
IPENZ Transportation Group Conference Christchurch, March 2010
future challenges. The integrated solutions within the PTV VISION suite has allowed for successful model development and analysis within this investigation.
Figure 1: The PTV Vision Suite VISUM is a transportation planning software package for all sizes of infrastructure planning at both macroscopic and mesoscopic scales. This application can be integrated with the VISSIM micro-simulation software to provide more detailed analytical assessments of capacity from a traffic engineering perspective as well as crowding and ‘level of service’ conditions from a passenger perspective.
VISUM is a comprehensive, flexible software system for strategic planning, travel demand modelling and network data management. The system is used on all continents for metropolitan, regional, and national infrastructure planning applications. Designed for multimodal analysis, VISUM integrates all relevant modes of transportation into one consistent network model. The system provides a number of assignment and four-stage transport modelling components, which include both trip-end based and activity based approaches.
VISSIM is a microscopic simulation software and is the most powerful tool available for simulating multi-modal conditions including cars, trucks, buses, heavy rail, LRT, cyclists and pedestrians. The simulation software is particularly useful for assessing detailed operations of transportation performance in urban locations. The flexible network structure provides the user with the opportunity to model any geometric configuration or unique operational /driver behaviour encountered within the transportation system.
VISSIM is based on decades of intensive research and includes algorithms for car following, lane changing and a response to the introduction of amber signals. The link-connector topology allows the highest versatility combined with vehicle movements up to the detail of 1/10s resolution. The PTV Vision suite has been the first of its kind to integrate microscopic simulation with strategic transport planning/travel demand modelling. PTV can extract directly from a strategic planning network, for detailed review and refinement of operational conditions at a local level of planning. This proves to be of significant value when examining the details of strategic planning initiatives. The open interfaces provide compatibility with external software applications including SCATS and SCOOT control systems, plus programming options.
The enhanced traffic simulation functionality within the VISSIM software includes representation of on-street and angled parking as well as the interaction of pedestrians and traffic at intersections. The VISSIM simulation can accurately represent constraints to the traffic network to show true interaction of traffic, transport and pedestrian interaction within the urban landscape.
Special Event Planning and Management Laufer et al Page 3
IPENZ Transportation Group Conference Christchurch, March 2010
SPECIAL EVENT PLANNING PTV has a long history in special event planning and transport management, an occurrence that has been further reflected within recent years. Such approaches include provision of software and management systems for the evaluation and mitigation of solutions, through to the interaction with corporate, management and investment teams.
Since 1993, PTV has provided technical solutions to the City of Leipzig in Saxony (Friderich, 2006). The PTV VISUM Information Server was used to examine travel patterns and behaviour and publish information for the public during the FIFA Confederations Cup in 2005. This approach analysed the macroscopic landscape with the planning of deviations such as road works and construction staging to minimise the obstruction.
Similar pursuits were undertaken with the FIFA World Cup in 2006 in Berlin. The Traffic Management Centre in Berlin utilises state of the art technology to manage and coordinate the impacts of strategic and operational measures across the metropolitan network (Mohl, 2007). The Berlin centre utilises the PTV Traffic Platform to adaptively evaluate congestion, travel demand, security and costs for private and public transport systems with the urban landscape. The centre manages control systems, including signals and adaptive signage across the network. A transportation model containing 18,000 links and 1,000 travel zones, with provision of a scenario manage was used to investigate mitigation schemes for event such as the 2006 World Cup. This model also included a blocking back algorithm to reflect the reduction in capacity across various links from of congestion or incidents. In order to account for information spread, the blocking back effect is applied with a temporal gradient during route choice (Mohl et al, 2009).
PTV investigated the closing of roads for supporter events while also operating with a higher level of travel demand in motorised private transport from event related trips. The combination of a dynamic network model connected to a high end processor, with demand flows and traffic control measures allowed the team to quickly investigate scenarios and develop successful strategies before the event.
PTV has also undertaken investigations to assist the organisation of the 2010 Winter Olympics in Canada. Congestion mitigation and multi-modal analysis was developed to assess schemes for Vancouver (Meschini et al, 2009). The VISUM dynamic traffic assignment model also included traffic and pedestrian interaction, to examine the reduction of capacity with large volumes of passengers spilling over from the footpaths.
Similar actions have been undertaken for the 2010 FIFA World Cup in South Africa. PTV has assisted the organising committee by simulating the pedestrian behaviour of crowds leaving the Green Point Stadium in Cape Town (Ahuja, 2009). A broader series of actions are also currently underway to assist with the European Football Championship 2012 (Schomborg, 2009) including enhancements to the public transport systems, the data collection and management systems and dissemination of information through public systems (Reinhardt, 2009).
In addition to the above, the PTV VISION suite has been applied across the Asia-Pacific region by a number of users for the investigation, planning and mitigation of special events.
THE SUNTEC STUDY LOCATION The Suntec study location is the northern half of the Singapore Central Business District and incorporates a number of significant land uses within the area:
• the Singapore International Convention and Exhibition Centre (SICEC) – a 93,000 m² conference area;
• Esplanade Theatres at the Bay, • the Marina precinct; • Raffles City Tower - IM Pei design of three towers including two hotels and an office
tower and a retail mall; and
Special Event Planning and Management Laufer et al Page 4
IPENZ Transportation Group Conference Christchurch, March 2010
• the Padang - open field for national events adjacent to civic buildings.
This study area hosts a number of major events at the above centres and across the road network, which requires significant special event planning and management (including traffic and transport operations within the adjacent area). The study area, as depicted in Figure 2 is bounded Singapore River to the south and east and contains the East Coast Parkway (motorway). A number of significant very high volume traffic corridors run through the study area, including the following:
• Nicholl Highway; • Beach Road; • North Beach Road; • Victoria Street; • Stamford Road; • Middle Road; • Bras Basah Road; • Rochor Road and • Ophir Road.
A large number of highly complex intersections are located within close proximity to each within this study area. This provides for a complex arrangement of signal co-ordination with the high demand volumes observed throughout this region. The southern half of the Central Business District has immediate access to this study area via the connections to Victoria Street and Bridge Road and Esplanade Dr.
Figure 2: Suntec Study Area
The site area includes a number of Singapore MRT Rail stations including City Hall and Bugis as well as series of bus services operating within this study area. Consequently there
Special Event Planning and Management Laufer et al Page 5
IPENZ Transportation Group Conference Christchurch, March 2010
is also a very high volume of pedestrian interaction on the street network interacting with vehicle operations.
The river was deemed to provide a suitable cordon for the study area, in the development of a base VISUM mesoscopic model. This approach ensured that the complexity of various land use activities and traffic operations and management schemes were contained within the northern Central Business District. An extension of this area would result in significant data collection and analysis for the southern half of the Singapore Central Business District.
MESOSCOPIC TRANSPORT MODELLING Mesoscopic transportation modelling is a refinement on traditional land use/ transportation modelling processes with further detail provided. These additional details can include intersection considerations, or site specific refinements in the generic capacity values typically applied in macroscopic modelling. This approach continues to utilise a flow bundle approach for the trip assignment including volume-delay functions. This approach uses less detail than the vehicle by vehicle interaction that occurs in micro-simulation. However, with such refinements, the network and assignment can easily be exported from VISUM and brought into VISSIM for simulating each individual vehicle or pedestrian within the landscape. This approach can also utilise a subarea network to investigate the particulars in an area of interest.
The scale of investigations of mesoscopic modelling studies are typically smaller than those for macroscopic style land use/ transportation models. PTV commonly apply such investigations to local council considerations or to business districts or complex grid networks. Mesoscopic modelling is undertaken in the VISUM software and uses the same functionality and assignment procedures as utilised for larger scale modelling. However, additional features of the software are incorporated for analysis, some of which include the graphical editor for the representation of intersection operations, as depicted within Figure 3.
Rather than simply representing nodes with impedance (delay and/or capacity) across a transportation network, a VISUM mesoscopic model can include the following within a model:
• Specific link and turn attributes including number of lanes and turn capacity; • Inclusion of pedestrian crossings, as a further measure of impedance on flow; • Signal phasing, including cycle time and phase operations
Figure 3: Intersection turns within VISUM for mesoscopic modelling
Special Event Planning and Management Laufer et al Page 6
IPENZ Transportation Group Conference Christchurch, March 2010
PTV is currently investigating techniques to automatically import such intersection information directly into a VISUM transportation model for entire metropolitan networks.
VISUM transportation models need not be limited to refinements in volume delay functions in order to reflect such capacity limitations. The release of VISUM 11.0 includes functionality for Intersection Capacity Analysis (ICA) as documented in the US Highway Capacity Manual (Transport Research Board, 2000) including Level of Service performance indicators and additional deterministic measures such as queuing and delay. In a mesoscopic transport network, signal coordination and platoon behaviour for each approach can be accurately modelled.
The option to model this investigation only using micro-simulation capabilities was initially downplayed for this study area. Such analysis of individual vehicle by vehicle movements through this high demand network would require significant data storage capabilities and strong graphical measures to visualise the movements. Although achievable, this would reduce the focus on the traffic management aspect and provide greater emphasis on the individuality of operations. In a larger scale network, the iterative assignment process in VISSIM would build up a notion of available paths, which could be achieved instantly from a mesoscopic model. A stand alone micro-simulation model would also forgo the connections required for a transportation/ land use assessment model
VISUM MODEL DEVELOPMENT A mesoscopic scale VISUM transportation model for the Suntec area was developed for the Singapore Land Transport Authority to test traffic management schemes within the northern Central Business District. The model was not developed for a single event, but as a multi-purpose network wide model to evaluate the detail of traffic management, including various occasions at the arts, civic and commercial attractions. Such schemes include examination of selected closures of lanes or roads in the lead up to and operation of the Singapore Grand Prix, while maintaining the access for other users of this precinct.
Two time periods were modelled for the study area to represent the times that the network is busiest:
• Friday Evening Peak (1800 to 2000 Hours); and • Saturday Afternoon Peak (1230 to 1430 Hours).
The model development process involved collection of a number of data sources including: • Road network and intersection layouts; • Lane marking and speed limits; • Traffic signal data • Location of parking lots within the study area; • Derivation of public transport services across the study location – includes service
paths, schedules and stop locations;
In addition, PTV undertook a number of traffic flow surveys for calibration and validation purposes including:
• Manual Classified Turn and Link Counts; • Queue Length Surveys; • Trip Generation Surveys – undertaken at car parks, taxi stands, loading /unloading
areas and coach drop-off / pick-up locations; • Origin Destination Surveys - surveys of the registration numbers of black cars used to
determine trip distribution within the study; • Journey Time Surveys; • Pedestrian Surveys - counting of directional pedestrian flows at signalised junctions
where vehicular surveys were undertaken; and • Vehicles Characteristic Surveys. - Five vehicle classes were surveyed: car, taxi,
goods vehicles, company buses and motorcycles.
Special Event Planning and Management Laufer et al Page 7
IPENZ Transportation Group Conference Christchurch, March 2010
Travel zones that were not surveyed for this study used standard trip rates generated from the land uses on site. This takes into consideration the zone type and quantum of the zone (with car parking spaces used as the proxy of zone quantum).
The connectors within the VISUM model were coded to reflect the directions of the access roads to/from each zone, as depicted in Figure 4. For those zones with multiple connectors, input proportions were derived based on the data collected during traffic surveys.
Figure 4: VISUM mesoscopic model of Suntec area
As an initial measure, mid-block link capacity on the major arterial and regional links have been input with an introductory capacity of 1,800 veh/hour/lane Minor access roads have been given an introductory capacity of 600 veh/hour/lane due to the constraints including limited signal phasing time. Capacities on links were reviewed through the VISUM model calibration process to better reflect the observed conditions.
To further complement the refinement of capacities within the mesoscopic VISUM transportation model, a series of saturation flows were established for each turn movement at the intersections. The saturation flow was generically defined by turn type as follows:
• Left-turn at signal - 1,200 veh/hour/lane • Through at signal - 2,000 veh/hour/lane • Right-turn at signal - 1,500 veh/hour/lane • U-turn at signal - 500 veh/hour/lane • Turn to/from minor road - 700 veh/hour/lane • Roundabout approaches - subject to approach geometry
These saturation flows are based on typical average values established from sources including the user manual for SIDRA (Akcelik and Associates, 2007). Again, through the model development process, these values were refined to reflect the observed conditions within the study area. The calculated capacities for each turn within the study area ensures that the assignment within VISUM can be undertaken based on an accurate representation
Special Event Planning and Management Laufer et al Page 8
IPENZ Transportation Group Conference Christchurch, March 2010
of turn capacities at the junctions within the study area. This calibration step maintains that the impedance measures applied between the macroscopic and mesoscopic modelling are as similar as possible.
A network model calibration and validation process was undertaken to meet the requirements of the development process by the Singapore Land Transport Authority. Such discussion would warrant a lengthy series of tables and analysis and is not the immediate focus for discussing connections between macroscopic modelling and micro-simulation. However, as per typical lane use based models, the VISUM network model was calibrated at each stage of the transportation modelling process to match the observed modelling behaviour. It is worth noting that through this process a representation of a VISSIM simulation model was maintained as a focus. Calibration benchmarks pursued were higher than sometimes requested for transportation models. For example, traffic assignment volumes were analysed by turn rather than by link, to increase the detail of the model results.
The basis of the estimation of trip production and attraction has been the trip generation and attraction surveys undertaken during this study. Survey locations include private and public car parks including government offices as well as taxi and coach stands. This allowed for the review and pursuit of a number of land uses including retail, residential, office, hotel, entertainment and hospital land uses. The trip production and attraction at each of the external zones was obtained from the cordon traffic counts. For all surveys, data was collected for all five vehicle classes surveyed: car, taxi, goods vehicles, company buses and motorcycles. Data was obtained for both Friday and Saturday time periods.
The trip distribution model was developed through a series of origin-destination surveys across the study location. This was accompanied by a matrix of trip patterns from the Singapore Land and Transport Authority from a strategic land use model. Public transport patronage and behavioural observations were obtained from a series of site surveys to identify service utilisation.
A calibration process of assignment measures was undertaken for the turn movements at all intersections across the study area. Turn movements were utilised as a performance measure, as such detail would be maintained within a VISSIM micro-simulation subnetwork. To complement this action, survey data was utilised to determine volume/capacity ratios for each movement (including u-turns) and develop turn penalties as a measure of free flow travel time on the turn. Assigned traffic volumes for 286 turn movements were benchmarked against the observed volumes across the network. Analysis indicated that turn flows for more than 83% of turns were within 20% of the observed volume. This was within the criteria established by the Singapore Land and Transport Authority. PTV also considered that a number of turn volumes exceeded this measure sue to the small traffic volumes at a number of locations. When considering the accuracy of these small volume movements, the model provided a very close representation of over 91% of turn movements to observed volumes across the network. Data obtained from the outputs split the results by specific vehicle class. Further analysis of the results used a GEH calculation to confirm the accuracy of the assigned trip volumes.
Model validation requirements were undertaken against observed queue behaviour at key locations within the study area. Surveys identified the back of queue for key (through) movements at end of red for a sample of signal cycles. The model developed was required to achieve a target that at least 75% of average modelled back-of-queue for the link differs less than 50 meters from average observed back-of-queue at signalised junctions. Analysis indicated that the model reflected such measures in more than 92% of the observed surveys.
VISSIM MICRO-SIMULATION MODEL DEVELOPMENT The process of developing a VISUM mesoscopic model was undertaken to investigate traffic management issues or mitigation strategies within the northern Central Business District of Singapore. As the PTV VISION software provides for a direct connection between VISUM
Special Event Planning and Management Laufer et al Page 9
IPENZ Transportation Group Conference Christchurch, March 2010
for land use transportation planning and VISSIM for micro-simulation modelling, PTV provided an analytical simulation to identify the interaction of traffic, transport and pedestrians across the landscape. This allows the modelling team to identify any section of the VISUM mesoscopic model and import that area into a simulation network where the traffic operations are now determined by use of a car following algorithm. This process can save immeasurable time and energy in the model development stage and can therefore allow the user to provide a greater focus on the technical solutions rather than network development process.
This adaptive network model process allows vehicles to be simulated in VISSIM with static paths rather than as part of an origin- destination matrix (trip table). This option allows for paths to be defined for journeys, removing the issue of route choice within the simulation network. While use of origin-destination matrices is an option within VISSIM, the static path solution was pursued for the Suntec area investigation. This process ensured that the trip paths were assigned at the mesoscopic level (where capacity measures reflected on turns as well as links), while the simulation software modelled the individuality of the vehicles as agents within an urban landscape.
This use of static paths in VISSIM allows users to define the complete path from origin to destination. This process also avoids the need to refine the appeal of the different network paths as part of the calibration process in the simulation as such actions were pursued at the mesoscopic level. There are a number of additional measures available for short term variations through a VISSIM network. Such an approach is also quite valuable for modelling driver behaviour where the shortest path is not pursued. VISSIM has the capability through this technique to model, for example, taxi driver behaviour with unusual movements through a business district while searching for their next fare.
The adaptive network model (ANM) export process into VISSIM for simulation modelling obtains the flow bundle demands, the network arrangements (including geometric layout) and any control systems defined directly into the simulation software. This clever process is maintained between mesoscopic and microscopic transport models and ensures that any refinements in the VISUM model do not damage the VISSIM simulation model.
However, despite the clever value found within the adaptive network model export process there are a small number of additional steps to refine the new simulation model. For the Suntec area VISSIM micro-simulation network, the following refinements were made:
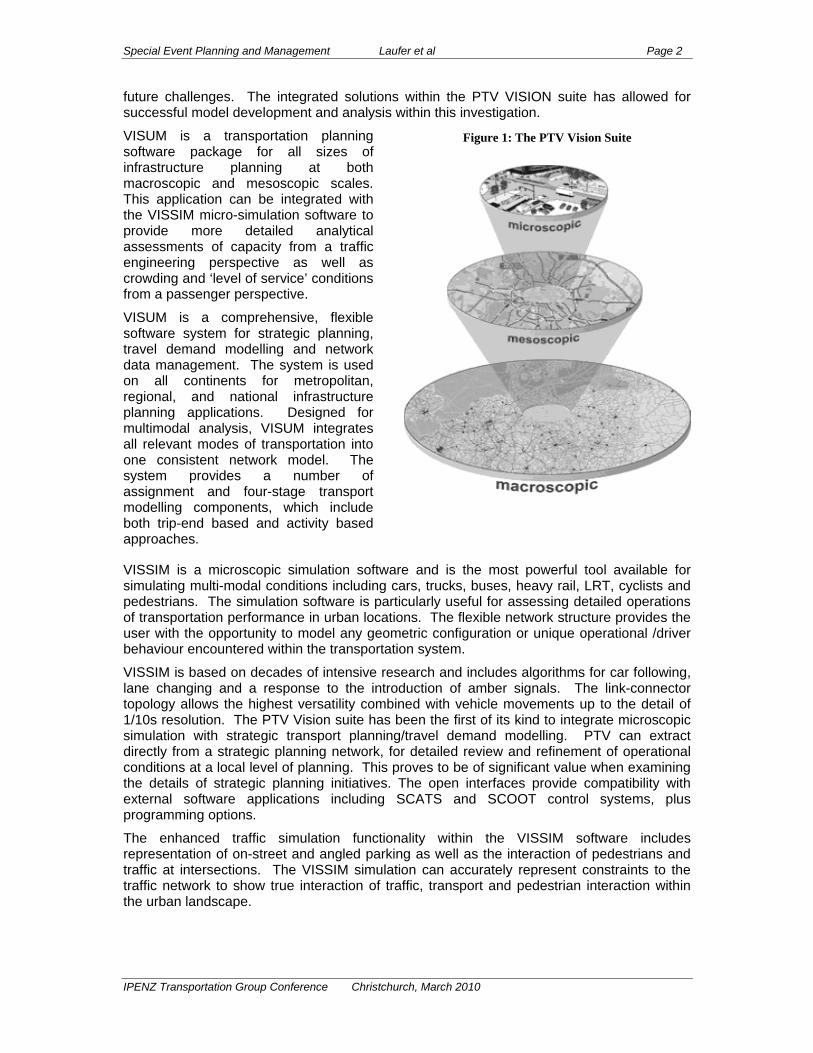
1. Refinement of curvature of links and of signal head locations. This is simply a reflection of modelling and analysis through a graph theory process (VISUM) into the accuracy observed for the simulation. Such an example is displayed in Figure 5 where the refinement from the ANM process transformed the right turn pocket from a graph theory form to a manner that reflected the site geometry. That is, the turn pocket is reflected in the mesoscopic model, including details of length, albeit does not match the curvature of the link. The network itself did not require refinement other than the position of the link.
2. Additional refinements that were incorporated into the VISSIM micro-simulation model include a restructure in the demand flows broken down into fifteen minute intervals to reflect the variation of surveyed flow volumes. The VISUM mesoscopic model was originally developed for a two hour period. However such measures of fifteen minute demand intervals can easily be included within a VISUM mesoscopic model.
3. An additional time period was incorporated for the build up (ramp up) of traffic and congestion within the network before commencing the evaluation periods of the VISSIM micro-simulation model.
4. A number of random seed values were used to provide subtle variations in the individuality of the vehicles across the network. The seed values adapt the starting values of the random generator used internally within the software. These values influence measures such as the arrival times of vehicle in the network, the stochastic variability of their driving
Special Event Planning and Management Laufer et al Page 10
IPENZ Transportation Group Conference Christchurch, March 2010
behaviour and also selection of a certain distribution value to wherever distributions are applied (e.g. dwell times, desired speeds etc). Performance measures of the base year modelling were provided as an average of the five seed model runs.
Figure 5: Transition from graph theory to geometric accuracy
5. Other refinements in the micro-simulation landscape include a better reflection of bus lanes (shown with a yellow strip on the lane marking) and enhancement of pedestrian crossing locations. The public transport network, including service routes, schedules and stop locations were directly exported from the VISUM network into the simulation model. However, the bus start times were provided with a small variation to better reflect the observed behaviour. This approach ensured that services arrived close to but not accurately on a set headway between services.
6. A revision in the driver behaviour parameters sets was also applied to better reflect the observed behaviour of motorbike users within the study location. This revision allowed motorbikes to meander forward through the stationary cars until reaching a stop line. Such a refinement ensures that these vehicles assess conditions within the micro-simulation model based on space rather than just that for lanes.
Overall this process provided for a simple conversion process from a land use focussed transport system to a micro-simulation model that examined the complexity of the behavioural detail within the urban landscape. This approach ensured that the measure of impedance at the mesoscopic model was that same as reflected at the micro-simulation model.
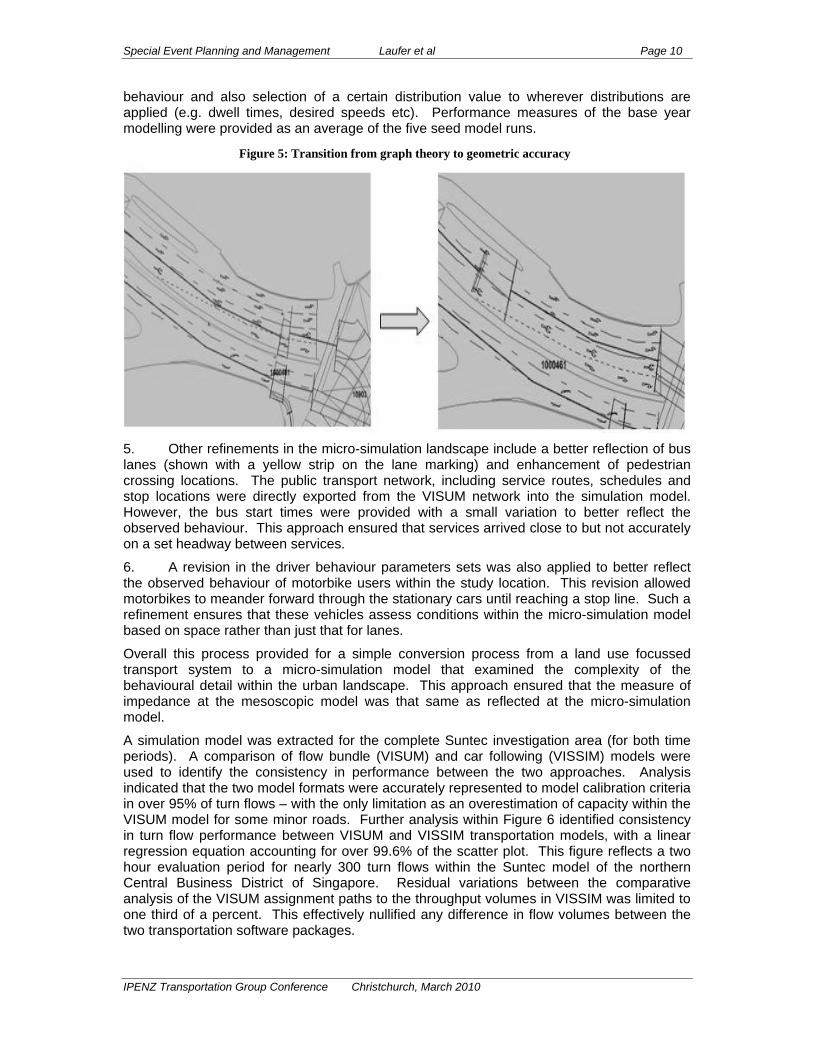
A simulation model was extracted for the complete Suntec investigation area (for both time periods). A comparison of flow bundle (VISUM) and car following (VISSIM) models were used to identify the consistency in performance between the two approaches. Analysis indicated that the two model formats were accurately represented to model calibration criteria in over 95% of turn flows – with the only limitation as an overestimation of capacity within the VISUM model for some minor roads. Further analysis within Figure 6 identified consistency in turn flow performance between VISUM and VISSIM transportation models, with a linear regression equation accounting for over 99.6% of the scatter plot. This figure reflects a two hour evaluation period for nearly 300 turn flows within the Suntec model of the northern Central Business District of Singapore. Residual variations between the comparative analysis of the VISUM assignment paths to the throughput volumes in VISSIM was limited to one third of a percent. This effectively nullified any difference in flow volumes between the two transportation software packages.
Special Event Planning and Management Laufer et al Page 11
IPENZ Transportation Group Conference Christchurch, March 2010
Figure 6: Comparison of VISUM and VISSIM Turn Flows within Suntec Model
THE SINGAPORE GRAND PRIX With the establishment of a base mesoscopic VISUM model and the opportunity to directly reflect such analysis (or a subarea thereof) within a micro-simulation environment, investigation of traffic management and mitigation for special events could easily be achieved. The provision of the VISUM mesoscopic model has allowed for various transportation investigations and analysis within the study area, including special event traffic management as well as a review of the public transport operations. One such use of the mesoscopic VISUM model was to investigate and derive traffic management plans for the first modern Singapore Grand Prix - a major event held in September 2008.
With the establishment of a mesoscopic model to reflect transportation and traffic operations, the process of exporting a selected area from VISUM to VISSIM for analysis saved considerable time. This process ensured a fast representation of assignment and choice issues were reflected in the VISUM transportation model with direct comparison made in operations in the VISSIM micro-simulation landscape.
The annual Singapore Grand Prix circuit, shown in Figure 7, covers a 5.0 km section of road within the study location. This makes the circuit approximately 50% longer than the street circuit of Monaco. In addition to this operation, the combination of attendance safety, team support and installation of lighting for the night race requires significant action in the days before the event.
Despite the occurrence of the Singapore Grand Prix (and use of the road network), commuter trips and regular activity trips continue to occur - in addition to the event related trips. Previous event related papers (Mohl et al, 2009) indicate that under such conditions, few regular trips are removed from the network during special events. A number of scenarios were investigated within the VISUM mesoscopic model to investigate changes in trip patterns within the northern Central Business District. Scenarios included a variation to trip ends for selected origins and destinations across the network. Considerations also incorporated a mode shift given the proposed management schemes across the network. A
Special Event Planning and Management Laufer et al Page 12
IPENZ Transportation Group Conference Christchurch, March 2010
series of performance measures assisted to produce a traffic management plan for the lead up and operation of the special event.
Figure 7: outline of the Singapore Grand Prix circuit
The traffic management plan pursued for the Singapore Grand Prix involved a two step action plan within the northern Central Business District. The initial action was to introduce route detours through the network. This measure allowed both drivers and traffic control operators to familiarise themselves with the revisions to the network. This measure took effect on Saturday 20th September and provided three days of familiarity before the second stage of the management plan was implemented. It is also worth noting that a number of event related activities such as the installation of street lighting (for the night race) had previously taken place.
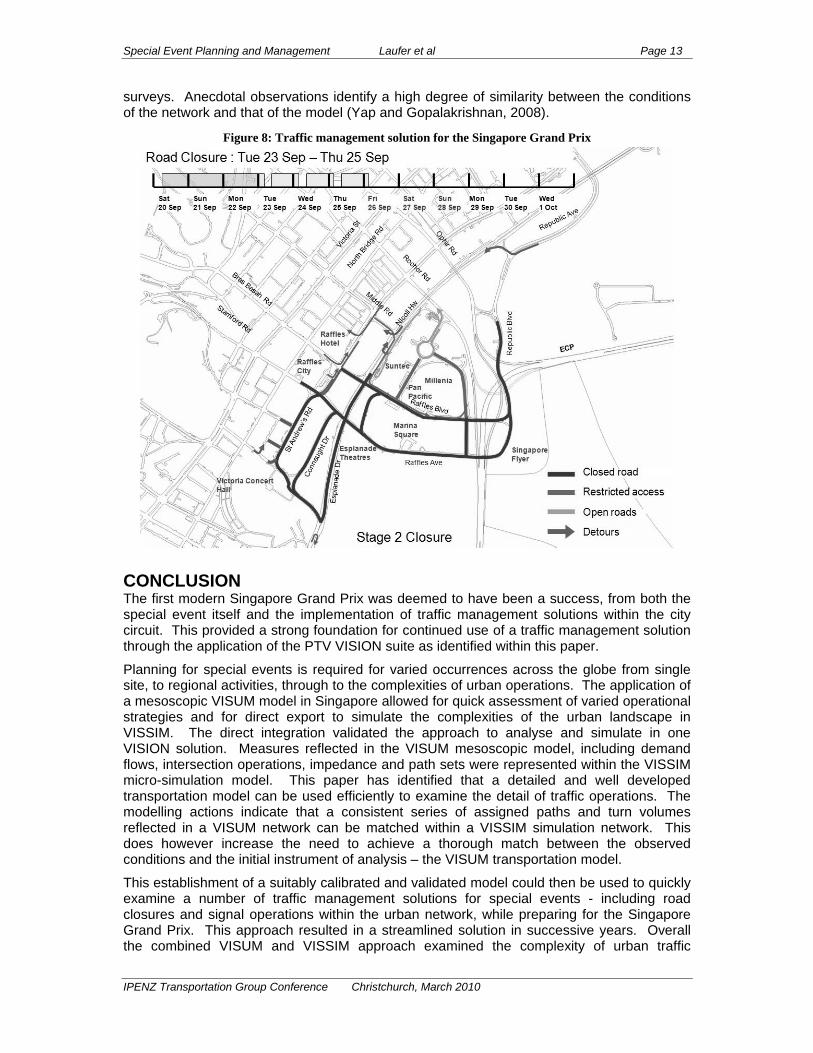
The second stage of the Singapore Grand Prix traffic management plan introduced a number of road closures through the network. As identified within Figure 8, areas relating to the race circuit were closed to general access from the Tuesday 23rd September. A number of additional roads provided restricted access to race related services (corporate, event related, management and operations activities). In this time, the safety barriers were installed across the race location.
Finally on Friday 26th September the special event activities began with a number of time trials across the circuit. The traffic management solution that was implemented as derived from the VISUM model suitably assessed a number of key operational measures that assisted with this scheme. These measures include the following actions incorporated into the VISUM mesoscopic model:
1. The closure of selected roads and thoroughfares reduced the number of conflicting movements (interruptions in flow) at several key intersections. This provided further phase time (i.e. intersection capacity) for the key arterial movements
2. The revisions in capacity across the network were complemented by revisions to the number of single vehicle trips generated across the network. That is, revisions to demand were re-assessed to account for changes in trip mode, or the number of trips to be generated. This investigation utilised various aspects of the land use based approach when developing a mesoscopic VISUM model for the northern Central Business District of Singapore.
The Land Transport Authority benchmarked the traffic management strategy developed in the VISUM mesoscopic model against the conditions identified on site through a series
Special Event Planning and Management Laufer et al Page 13
IPENZ Transportation Group Conference Christchurch, March 2010
surveys. Anecdotal observations identify a high degree of similarity between the conditions of the network and that of the model (Yap and Gopalakrishnan, 2008).
Figure 8: Traffic management solution for the Singapore Grand Prix
CONCLUSION The first modern Singapore Grand Prix was deemed to have been a success, from both the special event itself and the implementation of traffic management solutions within the city circuit. This provided a strong foundation for continued use of a traffic management solution through the application of the PTV VISION suite as identified within this paper.
Planning for special events is required for varied occurrences across the globe from single site, to regional activities, through to the complexities of urban operations. The application of a mesoscopic VISUM model in Singapore allowed for quick assessment of varied operational strategies and for direct export to simulate the complexities of the urban landscape in VISSIM. The direct integration validated the approach to analyse and simulate in one VISION solution. Measures reflected in the VISUM mesoscopic model, including demand flows, intersection operations, impedance and path sets were represented within the VISSIM micro-simulation model. This paper has identified that a detailed and well developed transportation model can be used efficiently to examine the detail of traffic operations. The modelling actions indicate that a consistent series of assigned paths and turn volumes reflected in a VISUM network can be matched within a VISSIM simulation network. This does however increase the need to achieve a thorough match between the observed conditions and the initial instrument of analysis – the VISUM transportation model.
This establishment of a suitably calibrated and validated model could then be used to quickly examine a number of traffic management solutions for special events - including road closures and signal operations within the urban network, while preparing for the Singapore Grand Prix. This approach resulted in a streamlined solution in successive years. Overall the combined VISUM and VISSIM approach examined the complexity of urban traffic
Special Event Planning and Management Laufer et al Page 14
IPENZ Transportation Group Conference Christchurch, March 2010
operations. The VISION solution represented both constraints and operations at the mesoscopic level to adequately plan and prepare traffic management plans for larger investigations sites using best practice methods.
REFERENCES Ahuja, S., (2009) “Advancements in Pedestrian Simulation Modelling Insight into the needs, data collection, calibration and future of pedestrian simulation models-Planning for the pedestrian needs for the 2010 FIFA World Cup” European Transport Conference, Leeuwenhorst, Netherlands, October 5-7
Akcelik and Associates (2007), SIDRA Intersection User Guide, Melbourne, Victoria.
Friderich, T., (2006) “Integrated Transportation Planning and Information with PTV VISION Technology” paper presented at 11th International Conference on Urban planning and Spatial Development for the Information Society, Vienna February 13-16
Meschini, L., Gentile, G. and Lew, K., (2009) “Simulating car-pedestrian interactions during mass events with DTA models: the case of Vancouver Winter Olympic Games, European Transport Conference, Leeuwenhorst, Netherlands, October 5-7
Möhl, P., (2007) “FIFA World Cup Supporters Stuck in Traffic?” published in PTV Compass Magazine 01/07
Möhl, P., Theis, C., Vogel, A. and Vortisch, P., (2009) “Scenario-based planning of Traffic Management Strategies” ITS World Congress Stockholm, September 21-25
Planung Transport Verkehr AG, (2009a) “VISUM User Manual 11.0”, June
Planung Transport Verkehr AG, (2009b) “VISSIM User Manual, 5.20”, December
Reinhardt, K., (2009) “European Football Championship 2012 under preparation in Lviv”, published in PTV Compass Magazine 01/09
Schomborg, A., (2009) “Always on the Ball” published in PTV Compass Magazine 02/09
Transportation Research Board (2000). “Highway Capacity Manual”. National Research Council, Washington, DC.
Yap, H.J. and Gopalakrishnan, S., (2008) “Integrating Micro-Simulation with Macroscopic Analysis” presented at the 1st PTV VISION Asia-Pacific User Group Meeting, Brisbane November 13-14.