Addressing Nitrate in California’s Drinking Water Report for the State Water Resources Control Board Report to the Legislature California Nitrate Project, Implementation of Senate Bill X2 1 Center for Watershed Sciences University of California, Davis http://groundwaternitrate.ucdavis.edu Prepared for the California State Water Resources Control Board With a Focus on Tulare Lake Basin and Salinas Valley Groundwater Alternative Water Supply Options for Nitrate Contamination TECHNICAL REPORT 7:
Transcript
Addressing Nitrate in California’s Drinking Water
Report for the State Water Resources Control Board Report to the Legislature
California Nitrate Project,
Implementation of Senate Bill X2 1
Center for Watershed Sciences
University of California, Davis
http://groundwaternitrate.ucdavis.edu
Prepared for the California State Water Resources Control Board
With a Focus on Tulare Lake Basin and Salinas Valley Groundwater
Alternative Water Supply Options for Nitrate Contamination
TECHNICAL REPORT 7:
Alternative Water Supply Options for
Nitrate Contamination
Technical Report 7
Addressing Nitrate in California’s Drinking Water
With a Focus on Tulare Lake Basin and Salinas Valley Groundwater
Report for the State Water Resources Control Board Report to the Legislature
Prepared by:
Kristin Honeycutt, Holly Canada, Marion Jenkins, and Jay Lund1
Center for Watershed Sciences
University of California, Davis
California Nitrate Project, Implementation of Senate Bill X2 1
The University of California prohibits discrimination or harassment of any person on the basis of race, color,
national origin, religion, sex, gender identity, pregnancy (including childbirth, and medical conditions related to
pregnancy or childbirth), physical or mental disability, medical condition (cancer-related or genetic characteristics),
ancestry, marital status, age, sexual orientation, citizenship, or service in the uniformed services (as defined by the
Uniformed Services Employment and Reemployment Rights Act of 1994: service in the uniformed services includes
membership, application for membership, performance of service, application for service, or obligation for service
in the uniformed services) in any of its programs or activities. University policy also prohibits reprisal or retaliation
against any person in any of its programs or activities for making a complaint of discrimination or sexual
harassment or for using or participating in the investigation or resolution process of any such complaint. University
policy is intended to be consistent with the provisions of applicable State and Federal laws.
Disclaimer: The contents of this document are solely the responsibility of the authors and do not necessarily represent the official views of supporting agencies.
Mart Noel Monterey County Health Department – Drinking Water Protection
Services
Joe Prado Fresno County
Jim Quinn UCD – Information Center for the Environment
Jose
Antonio
Ramirez City of Firebaugh
Solana Rice PolicyLink
Clay Rodgers Central Valley Regional Water Quality Control Board
Michael Rosberg Water System Owner
Victor Rubin PolicyLink
Cheryl Sandoval Monterey County Health Department – Drinking Water Protection
Services
Seth Scott Fresno County
Andrew Tran UCD – Graduate Student Researcher
Josh Viers UCD – Center for Watershed Sciences/Information Center for the
Environment
This work was funded by the State Water Resources Control Board under agreement number 09-122-
250.
Technical Report 7: Alternative Water Supply Options i
Contents
Tables ............................................................................................................................................................ v
Figures ........................................................................................................................................................ viii
Acronyms and Abbreviations ........................................................................................................................ x
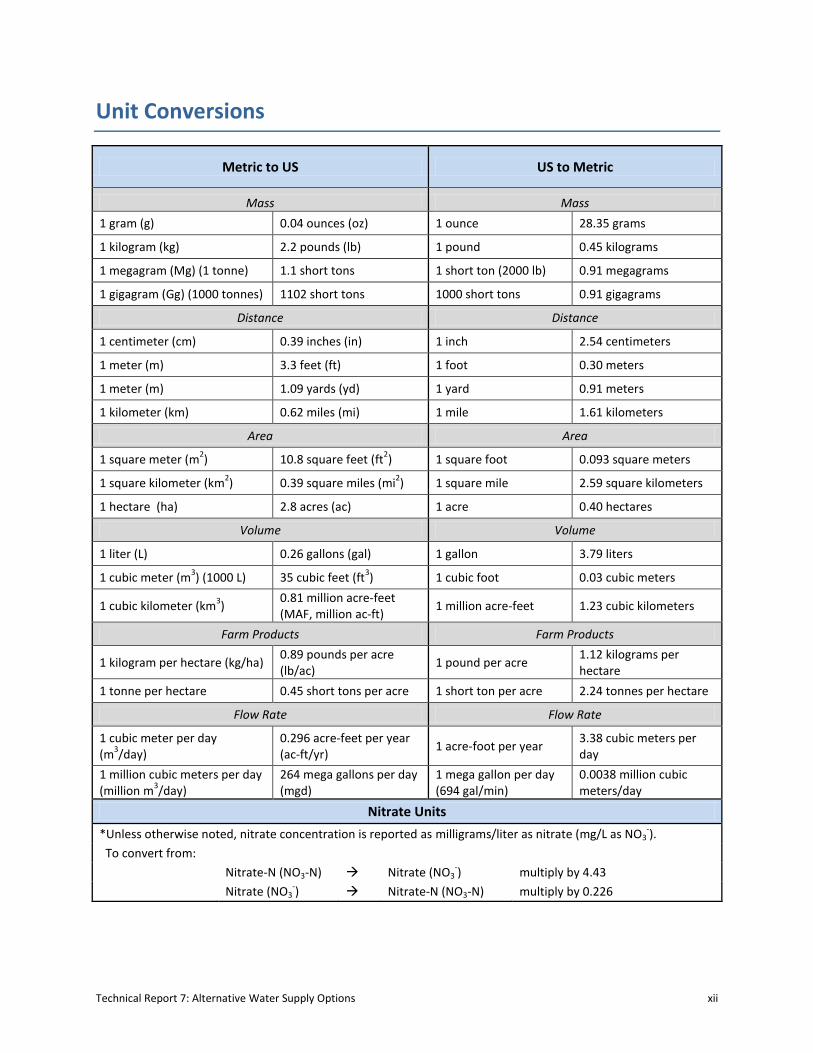
Unit Conversions ......................................................................................................................................... xii
2 Study Area Background .............................................................................................................................. 5
2.1 Tulare Lake Basin (TLB) ....................................................................................................................... 5
2.2 Salinas Valley (SV) ............................................................................................................................... 7
2.3 Drinking Water Systems ...................................................................................................................... 7
3 Susceptible Water Users ............................................................................................................................ 9
3.1 Drinking Water Supply Systems .......................................................................................................... 9
3.2 Water Quality Threats ....................................................................................................................... 10
3.3 Susceptible Water Users Overview ................................................................................................... 11
3.4 Water System Infrastructure ............................................................................................................ 14
3.4.1 Low System Vulnerability ........................................................................................................... 16
3.4.2 High System Vulnerability .......................................................................................................... 18
3.4.3 No System Vulnerability ............................................................................................................. 22
3.5 Susceptible Drinking Water Users..................................................................................................... 23
3.5.1 Highly Susceptible Population ................................................................................................... 24
3.5.2 Low Susceptibility Population .................................................................................................... 34
3.5.3 Unknown Susceptibility Population ........................................................................................... 37
3.6 Major Findings on Susceptible Water Users ..................................................................................... 37
3.7 Health and Socioeconomic Disparities .............................................................................................. 42
Technical Report 7: Alternative Water Supply Options ii
3.7.1 Pregnant Women and Infants .................................................................................................... 43
8.1 Major Findings ................................................................................................................................ 107
Technical Report 7: Alternative Water Supply Options iv
9 Literature Cited ...................................................................................................................................... 111
11 Case Studies ......................................................................................................................................... 131
Technical Report 7: Alternative Water Supply Options v
Tables
Table 1. Drinking water system connections and service duration. ............................................................ 8
Table 2. California’s drinking water quality responsibilities. ..................................................................... 11
Table 3. Community public water systems treating for nitrate in the Tulare Lake Basin. ......................... 17
Table 4. Community public water systems treating for nitrate in the Salinas Valley. ............................... 17
Table 5. 2010 Estimated self-supplied and local small water system population within the study area
based on the parcel use code and DWR land use designation. .................................................................. 19
Table 6. 1990 Census v. 2010 Estimated domestic well (single dwelling unit) population by county. ..... 21
Table 7. 2010 Estimated high susceptibility population served by self-supplied household and local small
water systems (referred to as ‘domestic well’). ......................................................................................... 27
Table 8. Single source systems with a high likelihood of nitrate in groundwater. .................................... 28
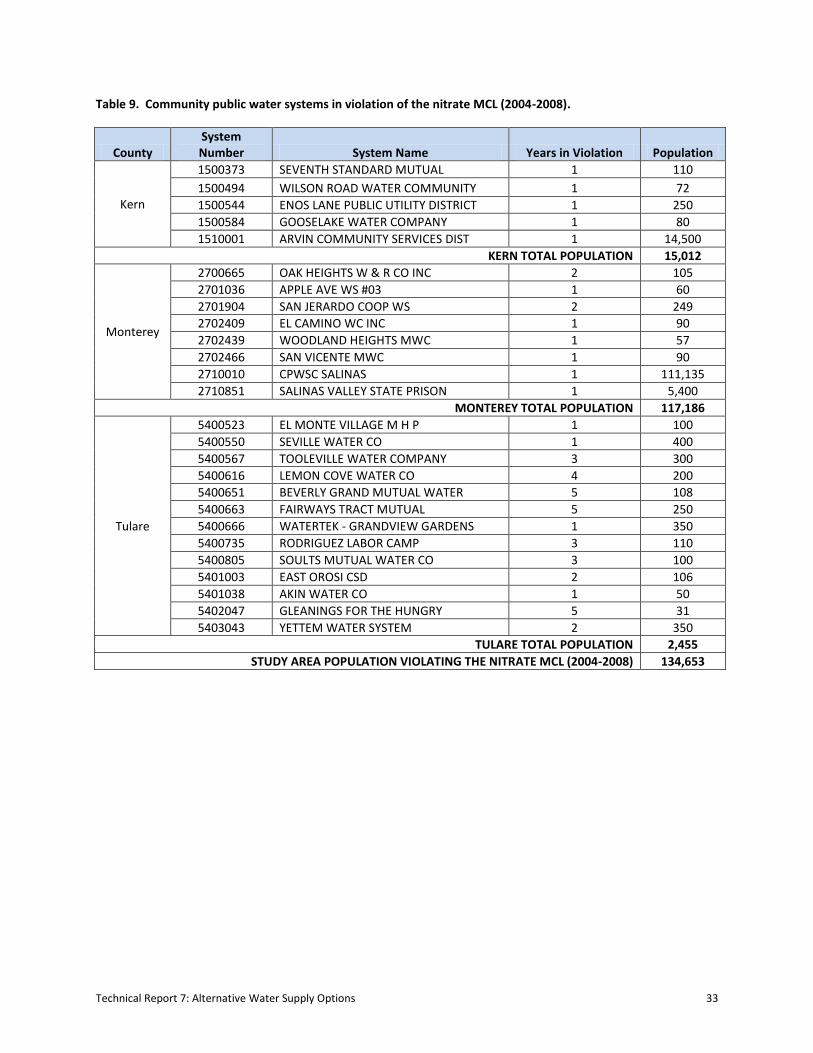
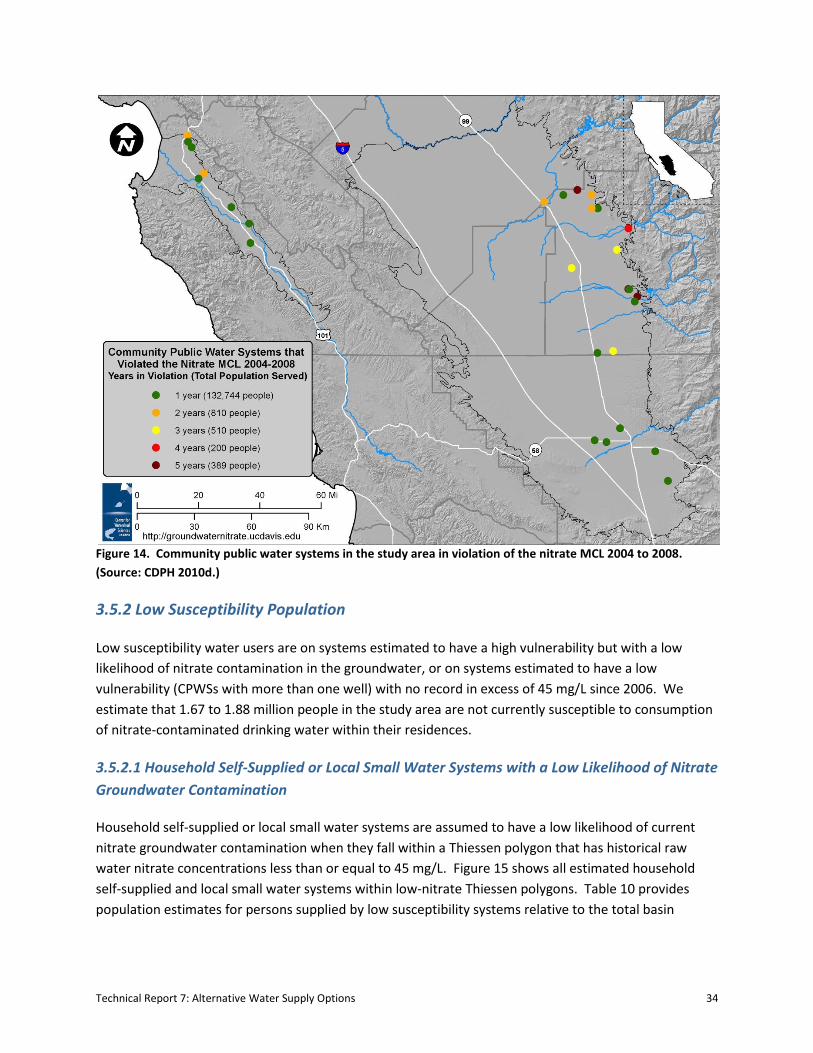
Table 9. Community public water systems in violation of the nitrate MCL (2004-2008). ......................... 33
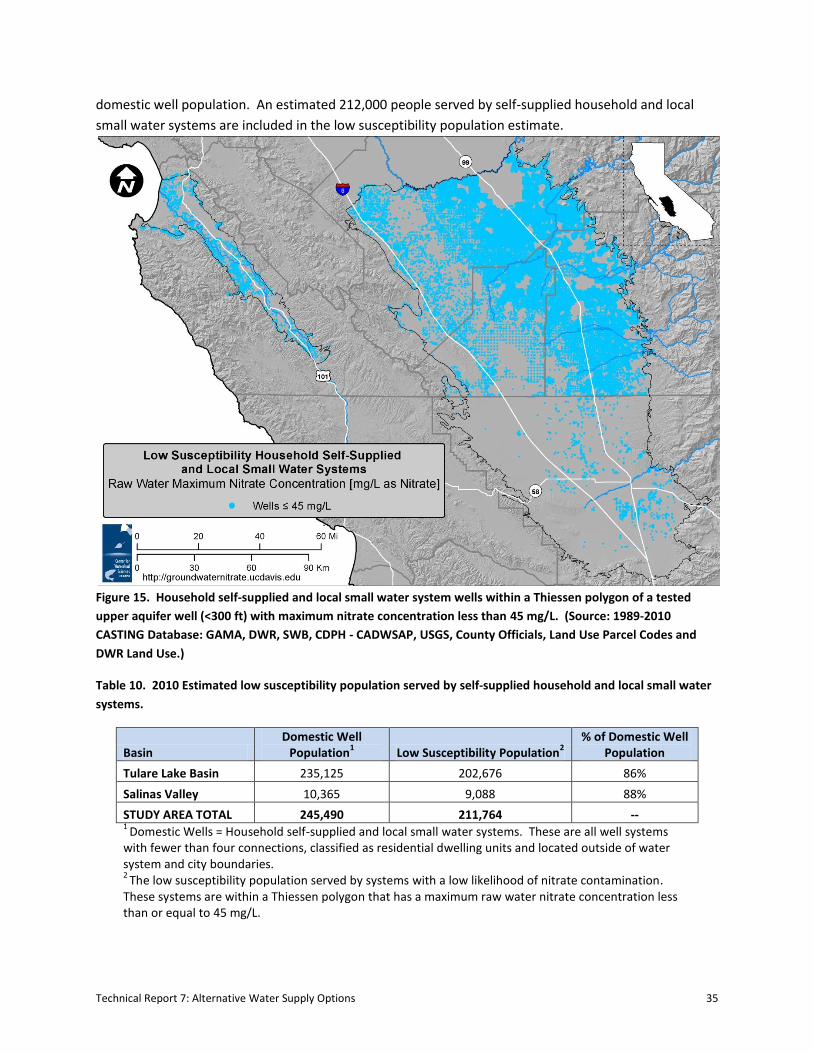
Table 10. 2010 Estimated low susceptibility population served by self-supplied household and local
small water systems. ................................................................................................................................... 35
Table 11. Single source systems with a low likelihood of nitrate in groundwater. ................................... 36
Table 12. Community public water systems with a low likelihood of nitrate in groundwater. ................. 36
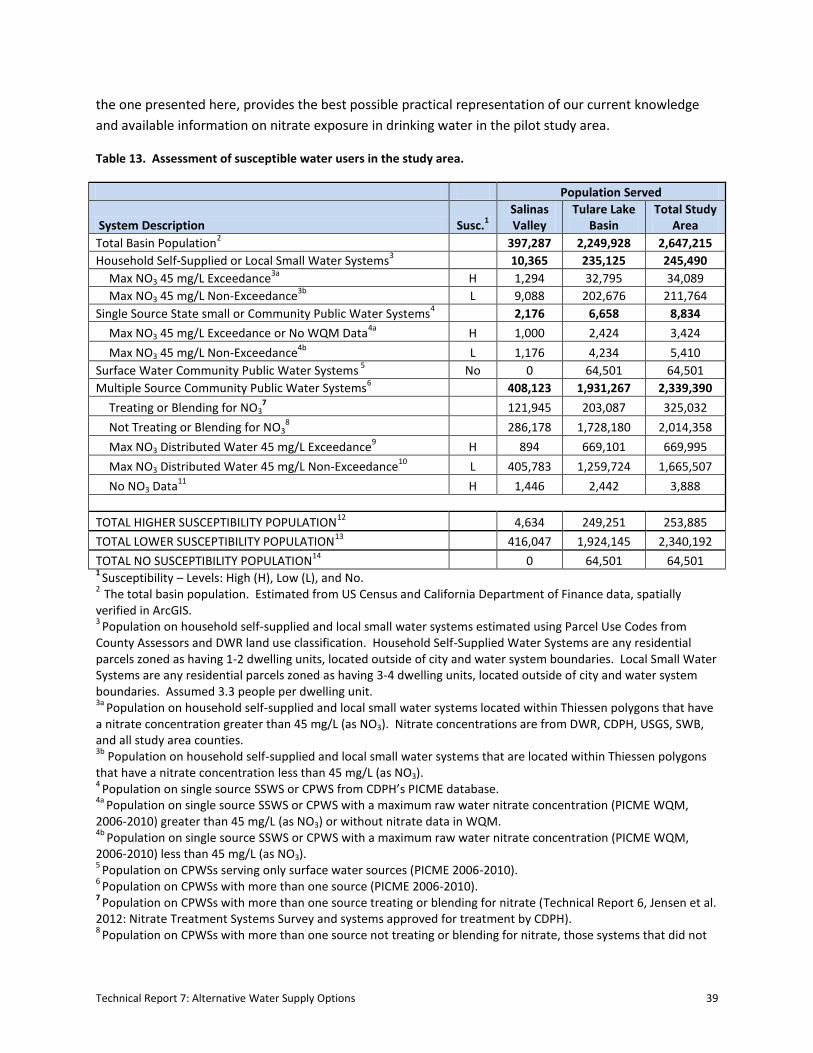
Table 13. Assessment of susceptible water users in the study area. ........................................................ 39
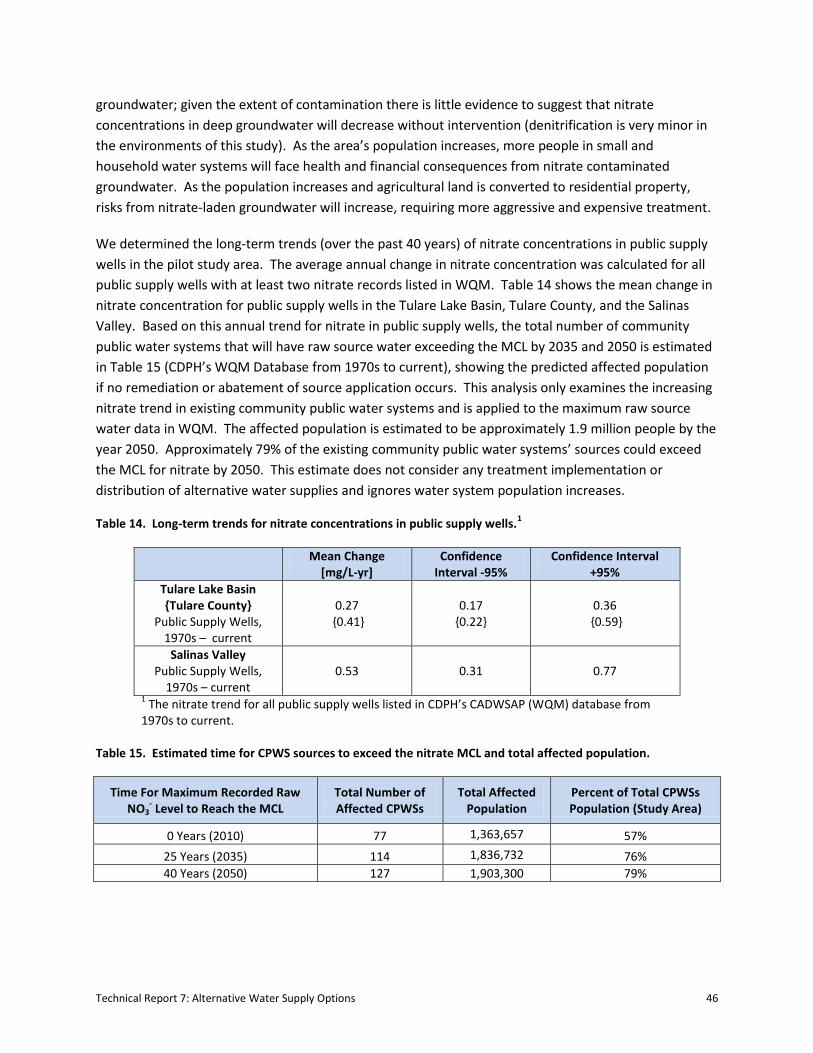
Table 14. Long-term trends for nitrate concentrations in public supply wells. ......................................... 46
Table 15. Estimated time for CPWS sources to exceed the nitrate MCL and total affected population... 46
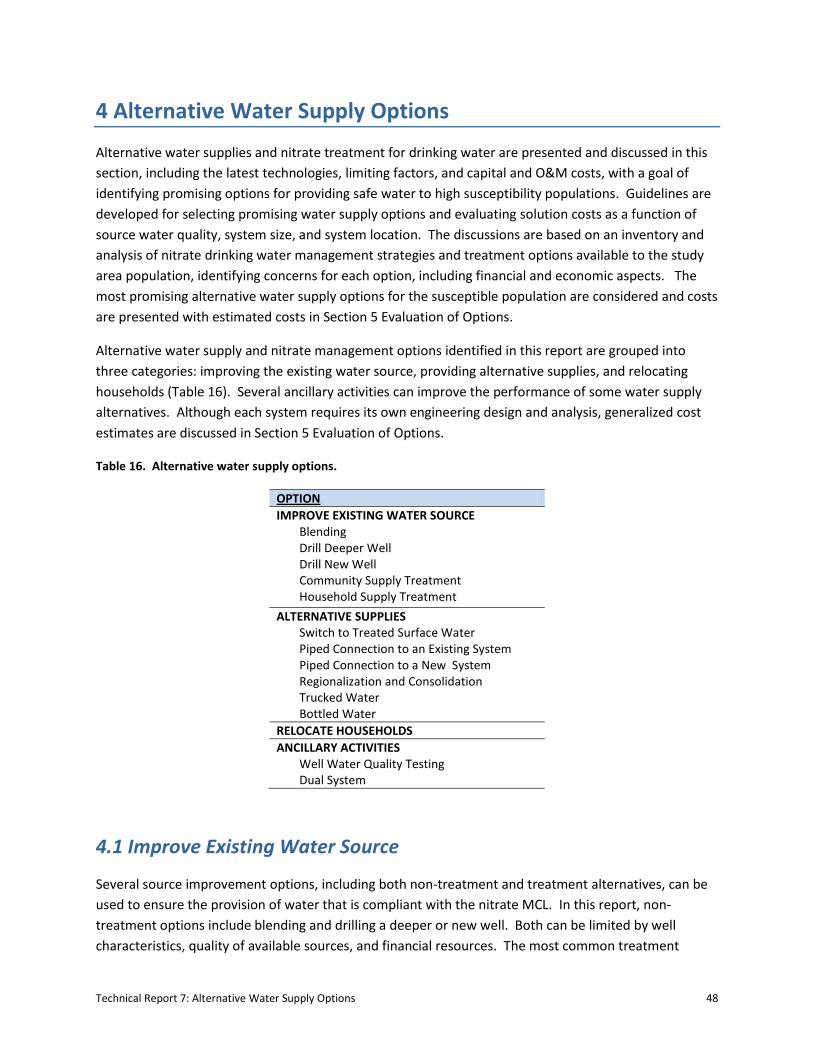
Table 16. Alternative water supply options. .............................................................................................. 48
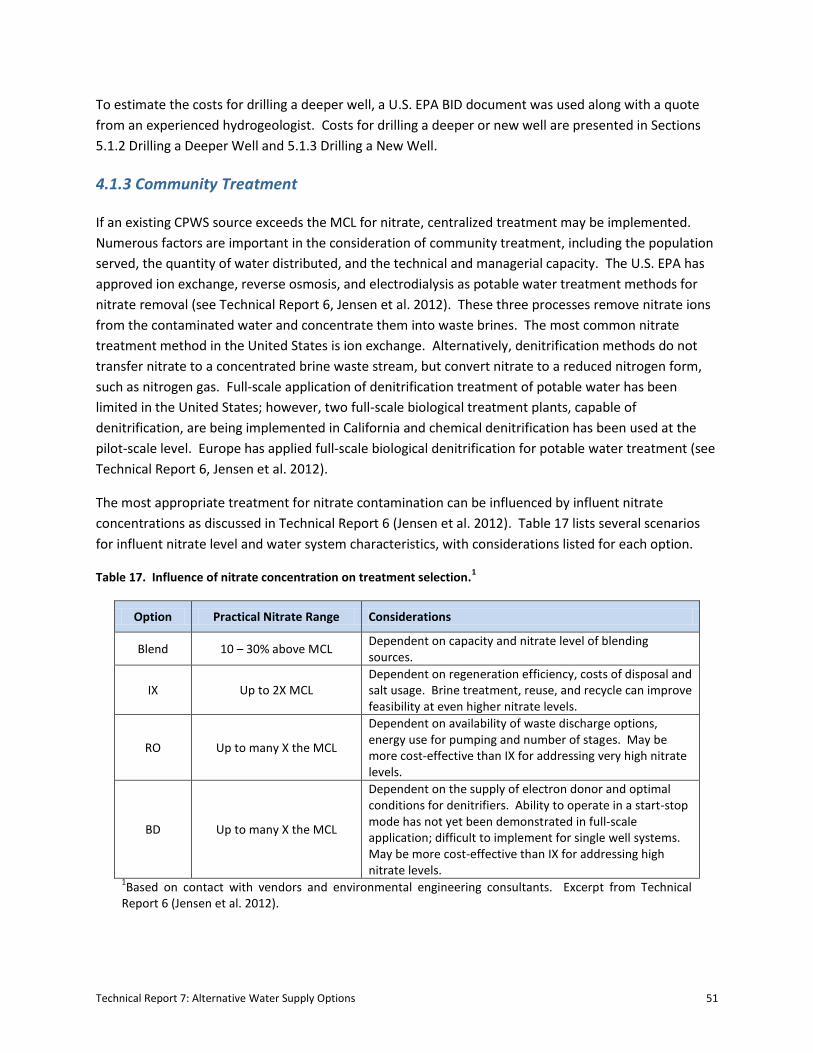
Table 17. Influence of nitrate concentration on treatment selection. ...................................................... 51
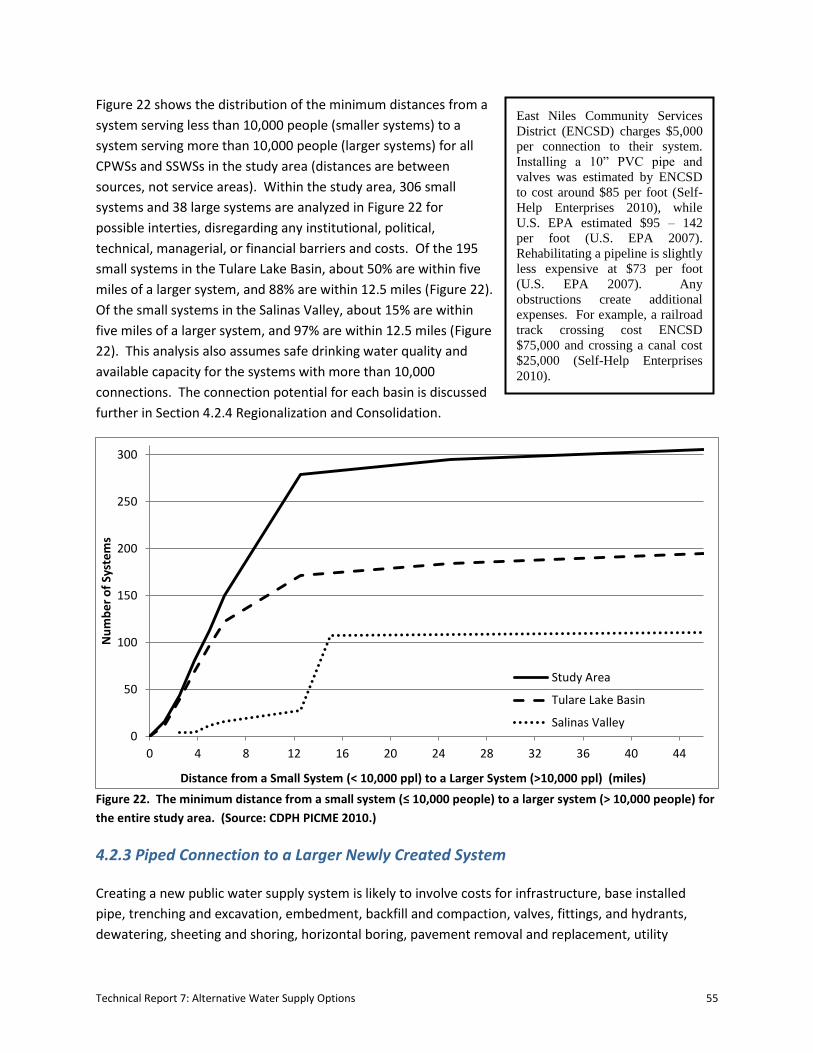
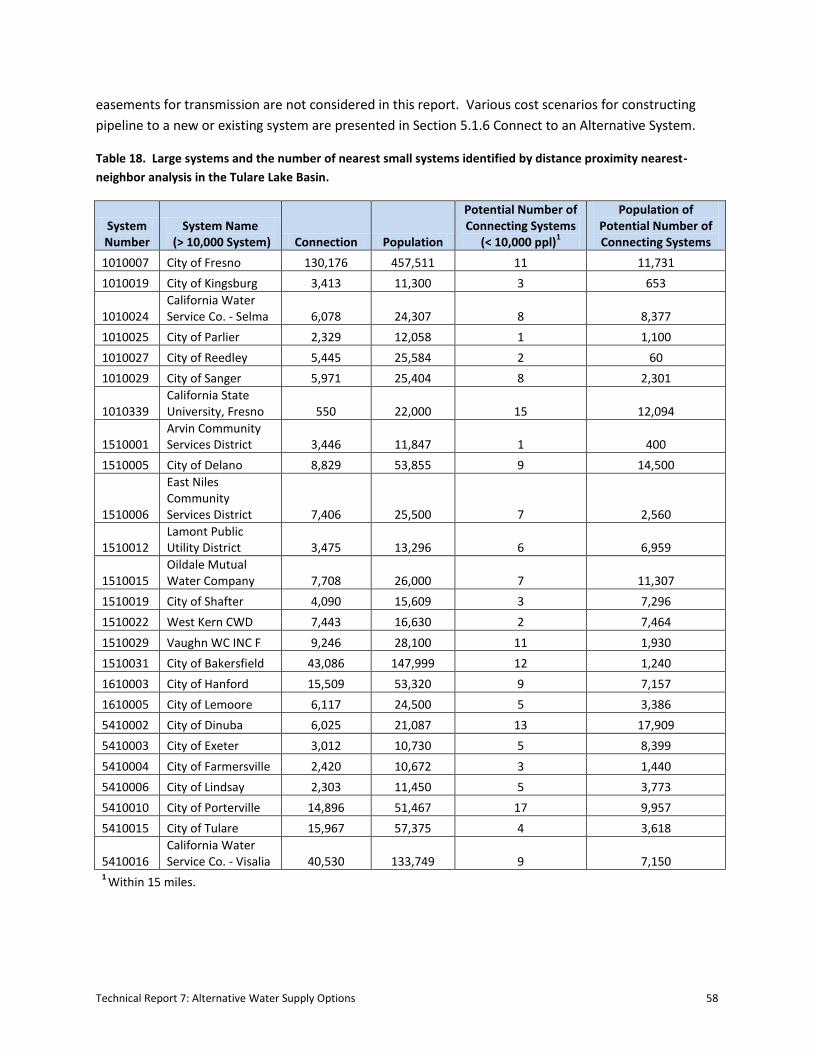
Table 18. Large systems and the number of nearest small systems identified by distance proximity
nearest-neighbor analysis in the Tulare Lake Basin. ................................................................................... 58
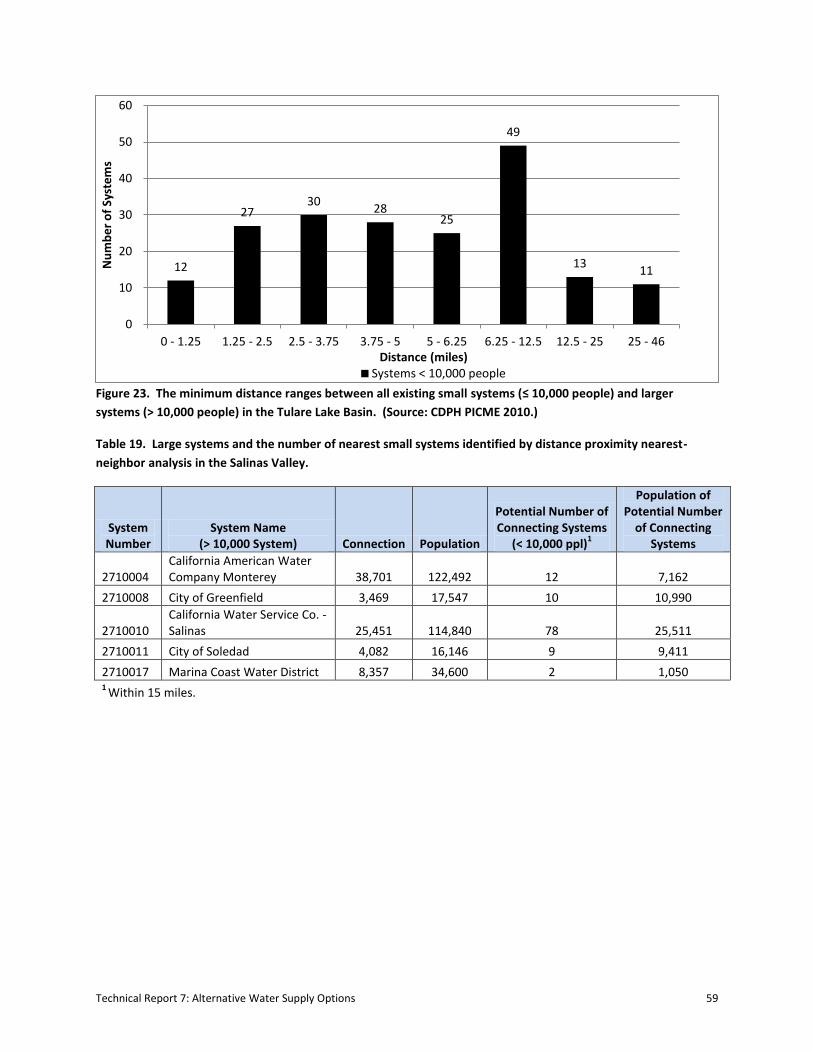
Table 19. Large systems and the number of nearest small systems identified by distance proximity
nearest-neighbor analysis in the Salinas Valley. ......................................................................................... 59
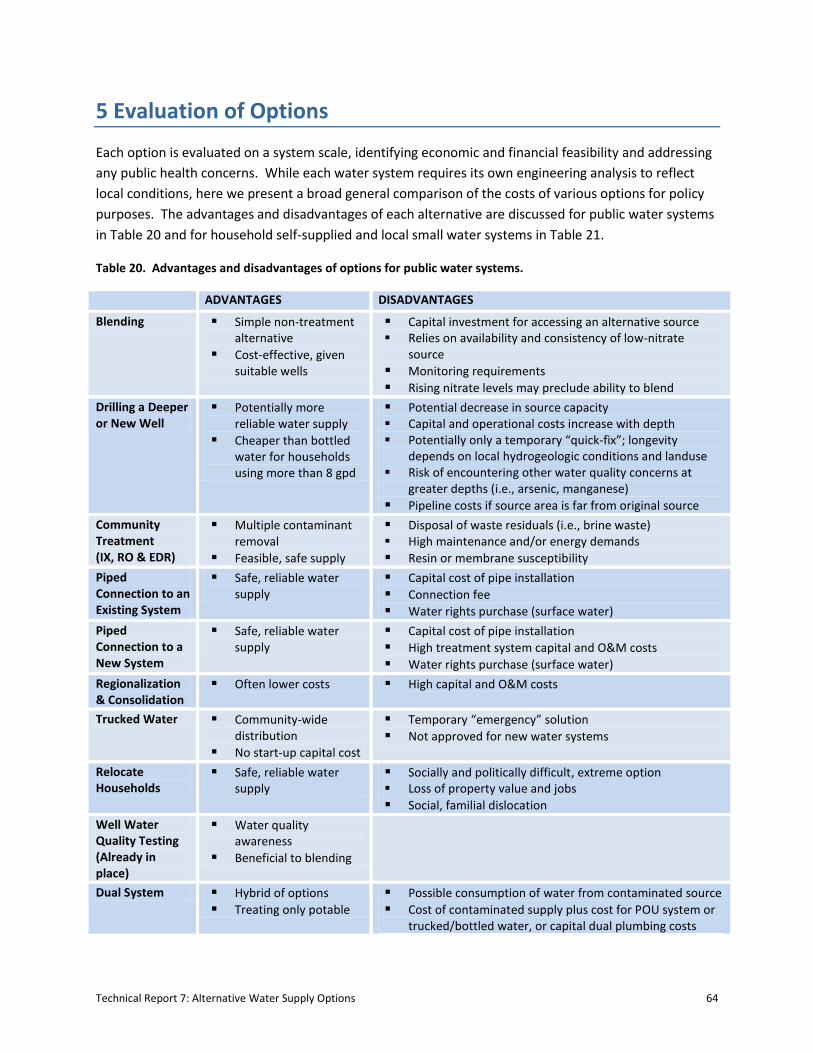
Table 20. Advantages and disadvantages of options for public water systems. ....................................... 64
Technical Report 7: Alternative Water Supply Options vi
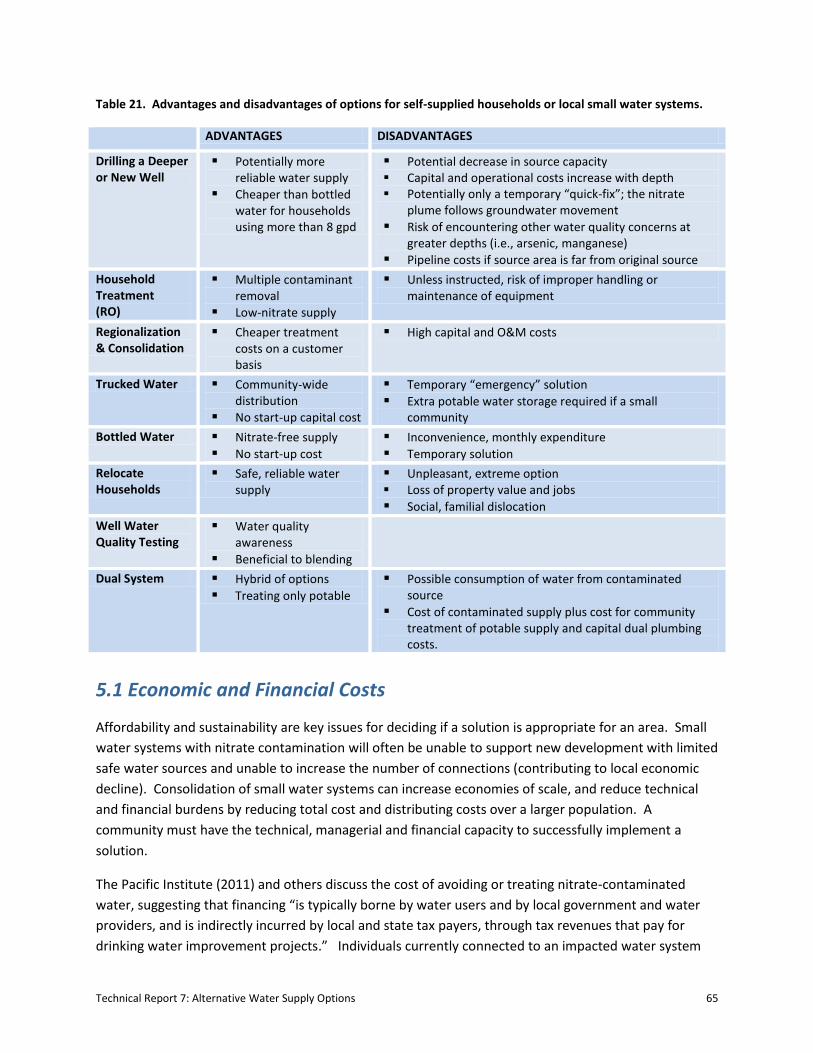
Table 21. Advantages and disadvantages of options for self-supplied households or local small water
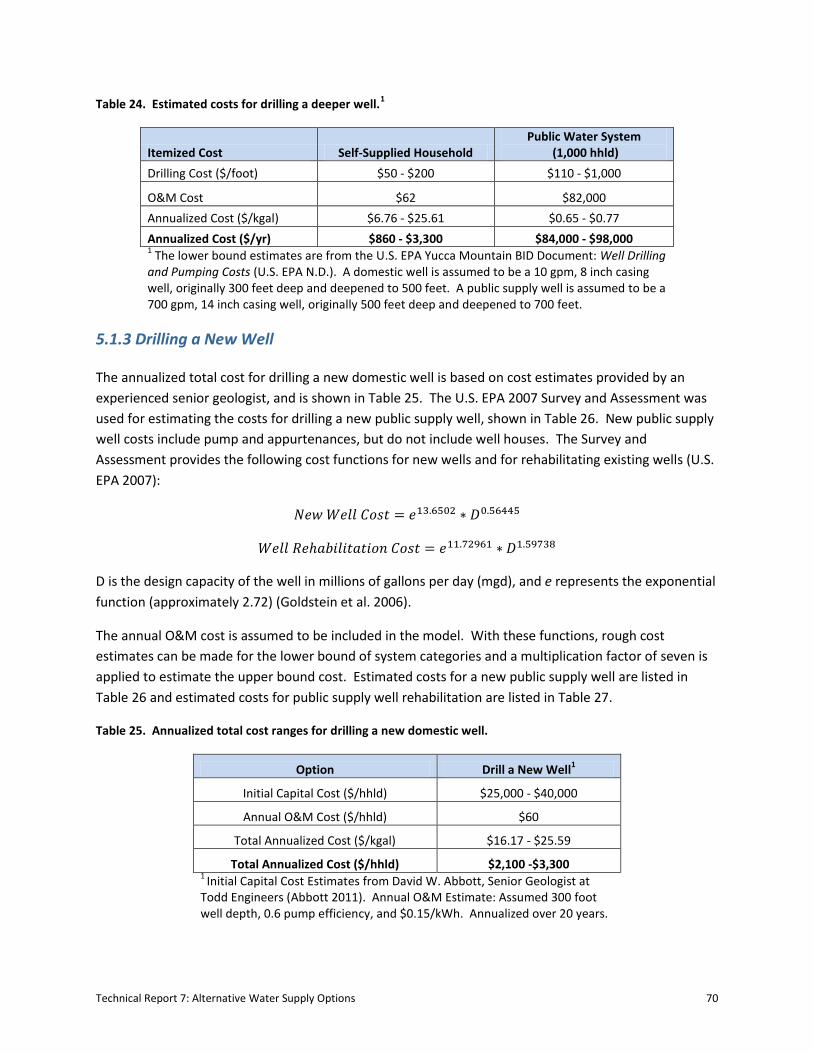
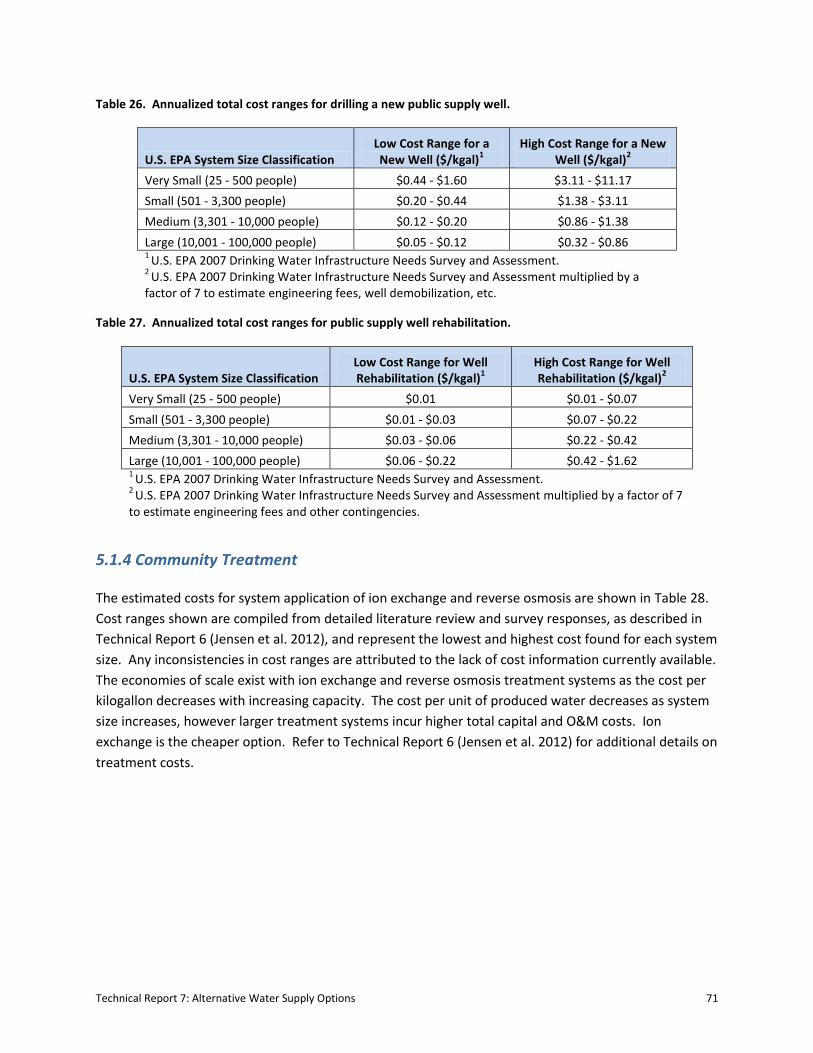
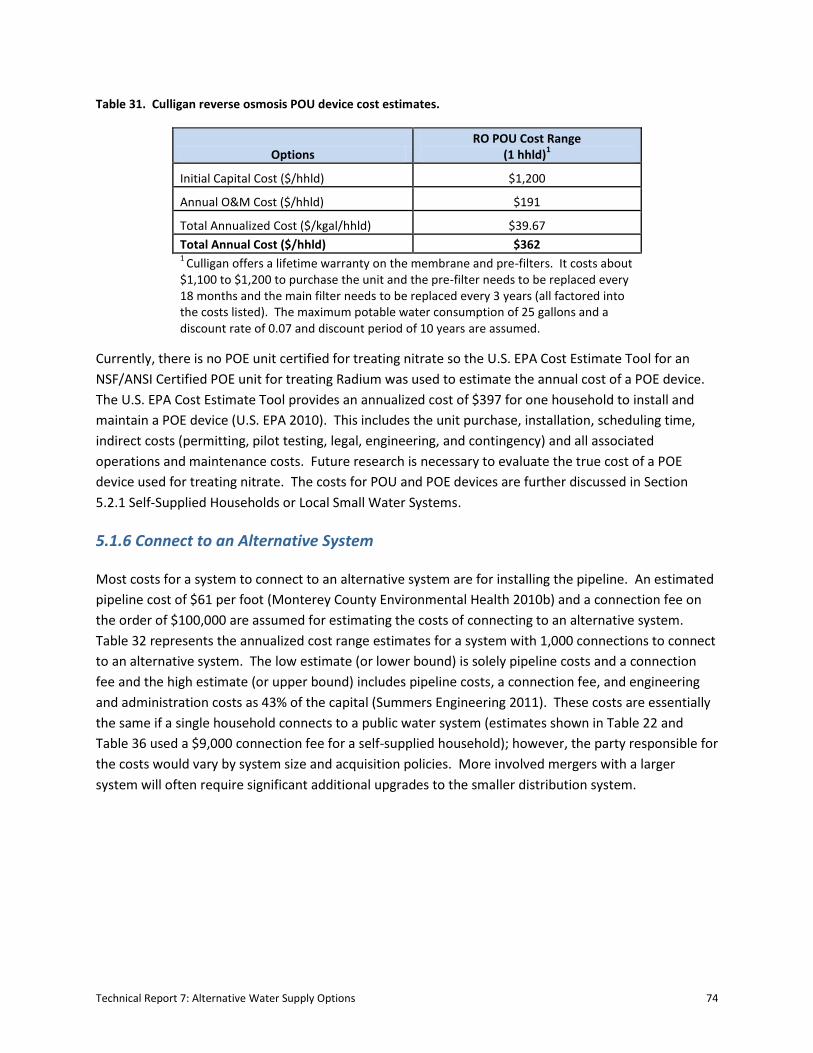
Table 32. Estimated annualized cost ranges for a system with 1,000 connections to connect to an
alternative system....................................................................................................................................... 75
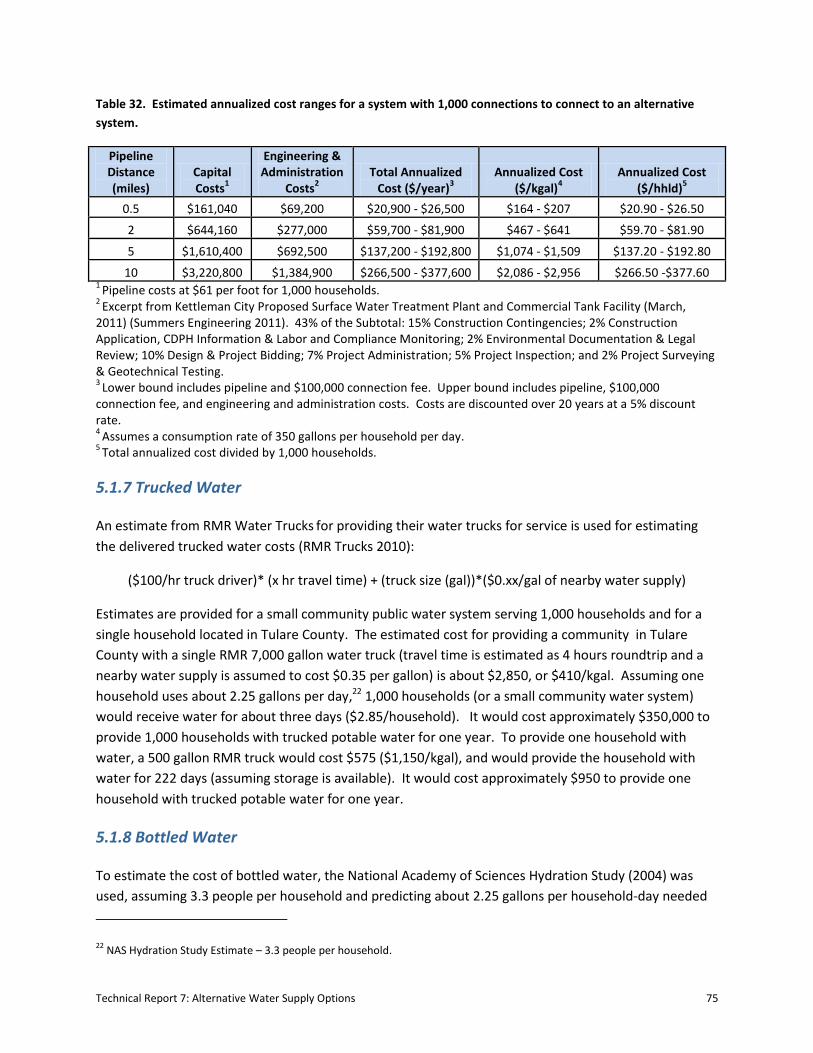
Table 33. Average listing prices for homes in study area counties. ........................................................... 76
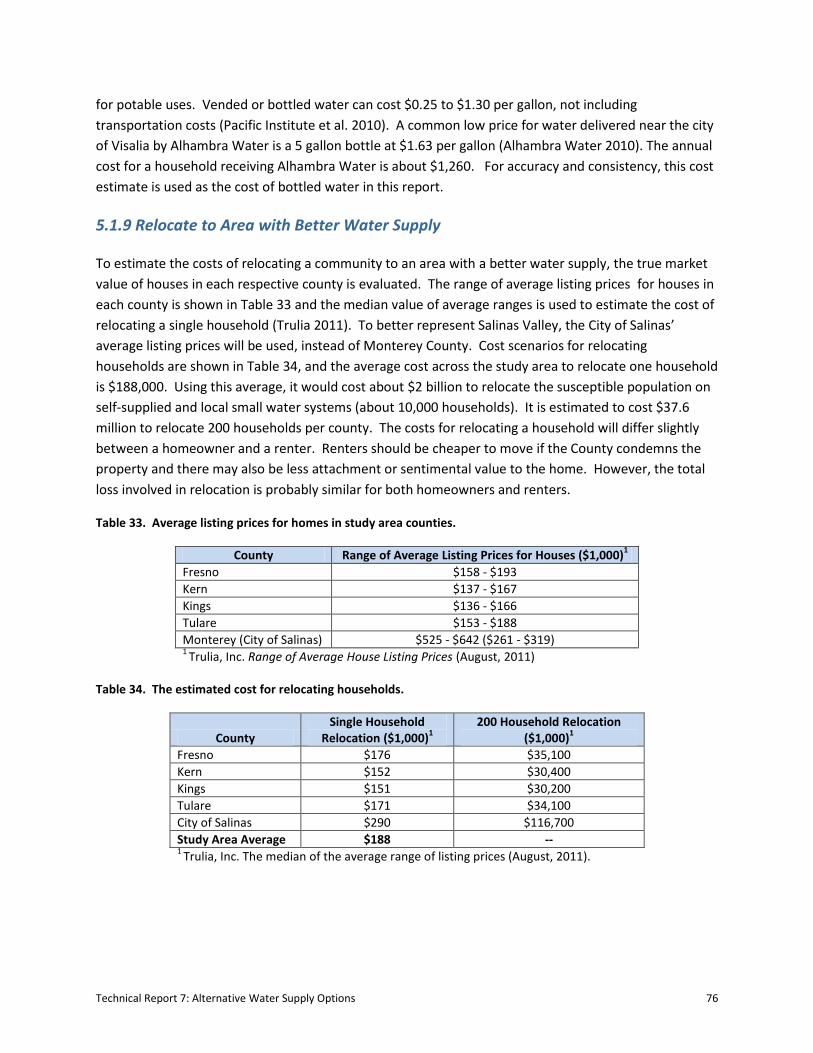
Table 34. The estimated cost for relocating households. .......................................................................... 76
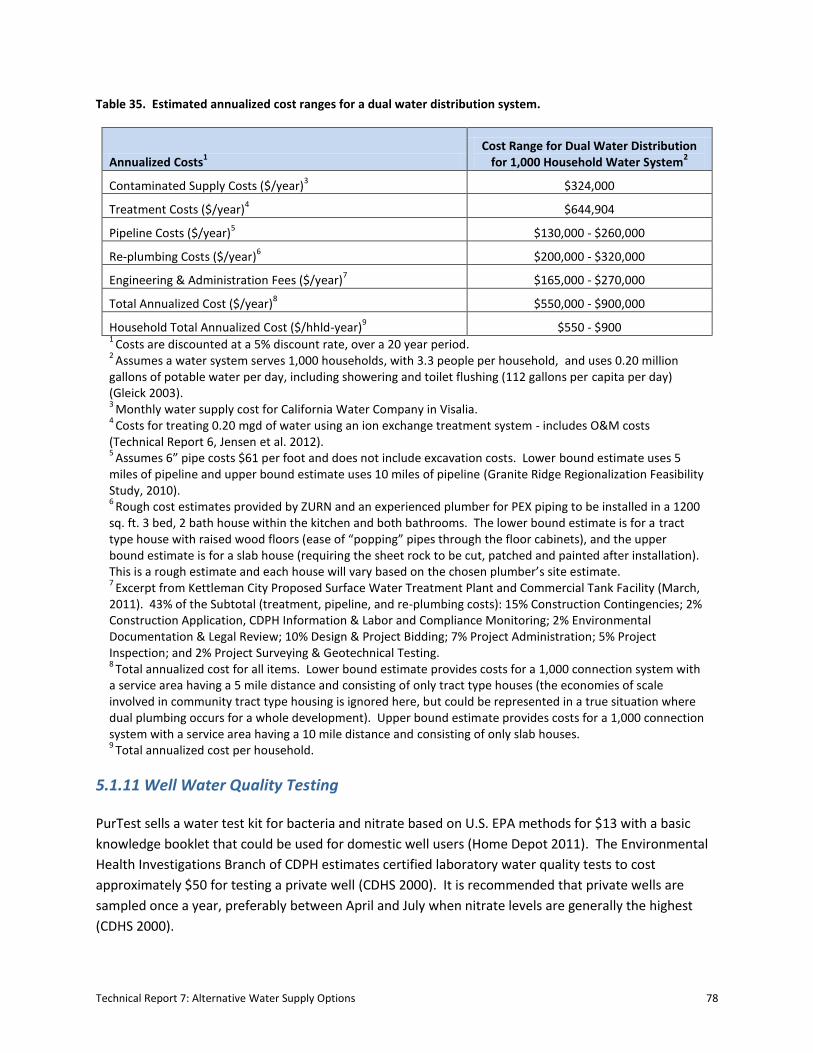
Table 35. Estimated annualized cost ranges for a dual water distribution system. .................................. 78
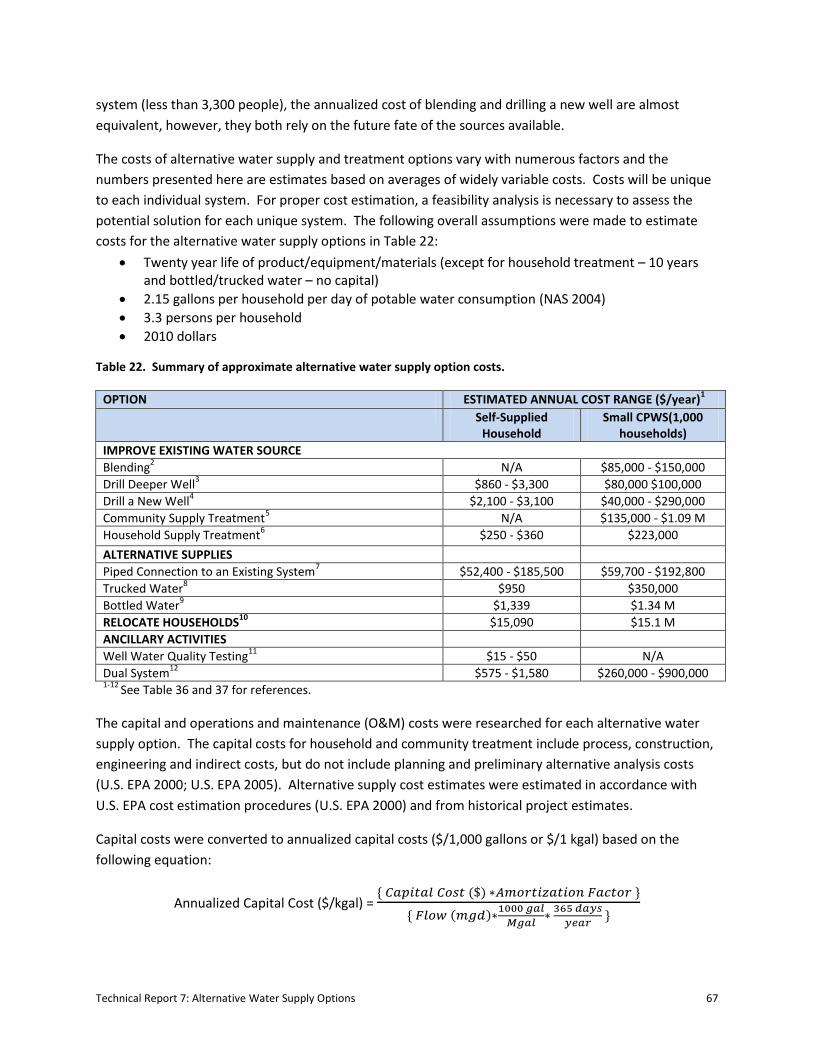
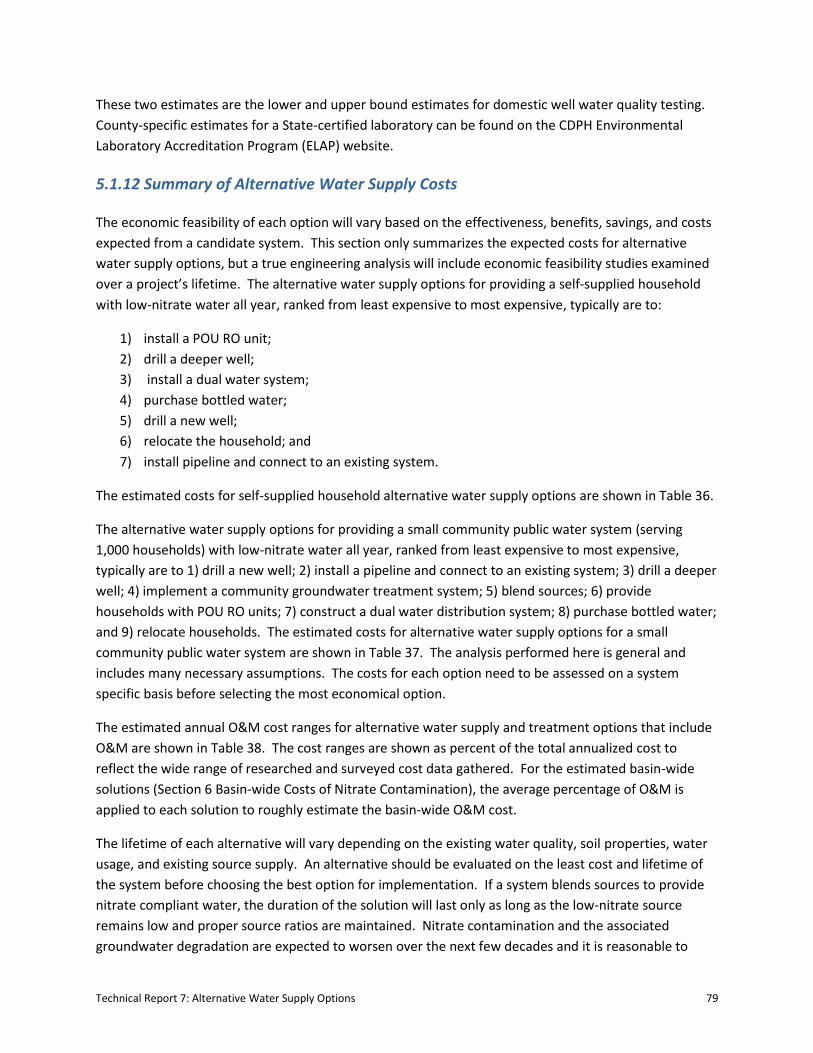
Table 36. Summary of the estimated alternative water supply costs for self-supplied households. ........ 80
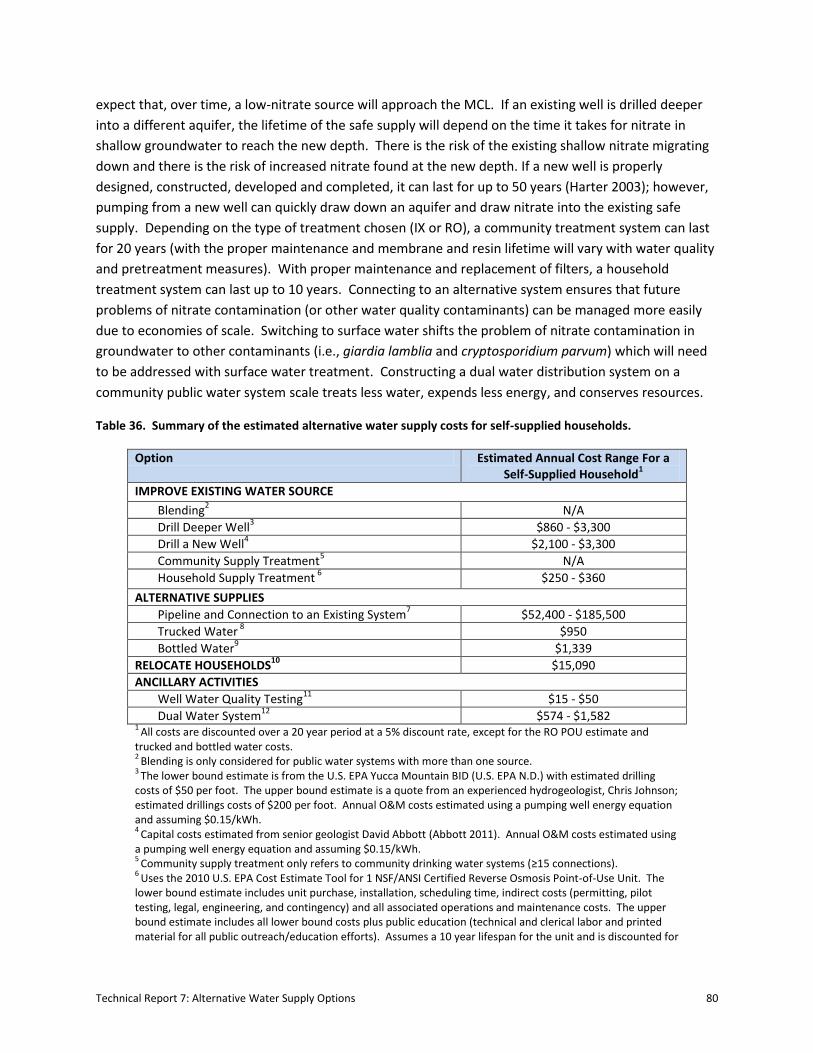
Table 37. Summary of the estimated alternative water supply costs for a small water system (1,000
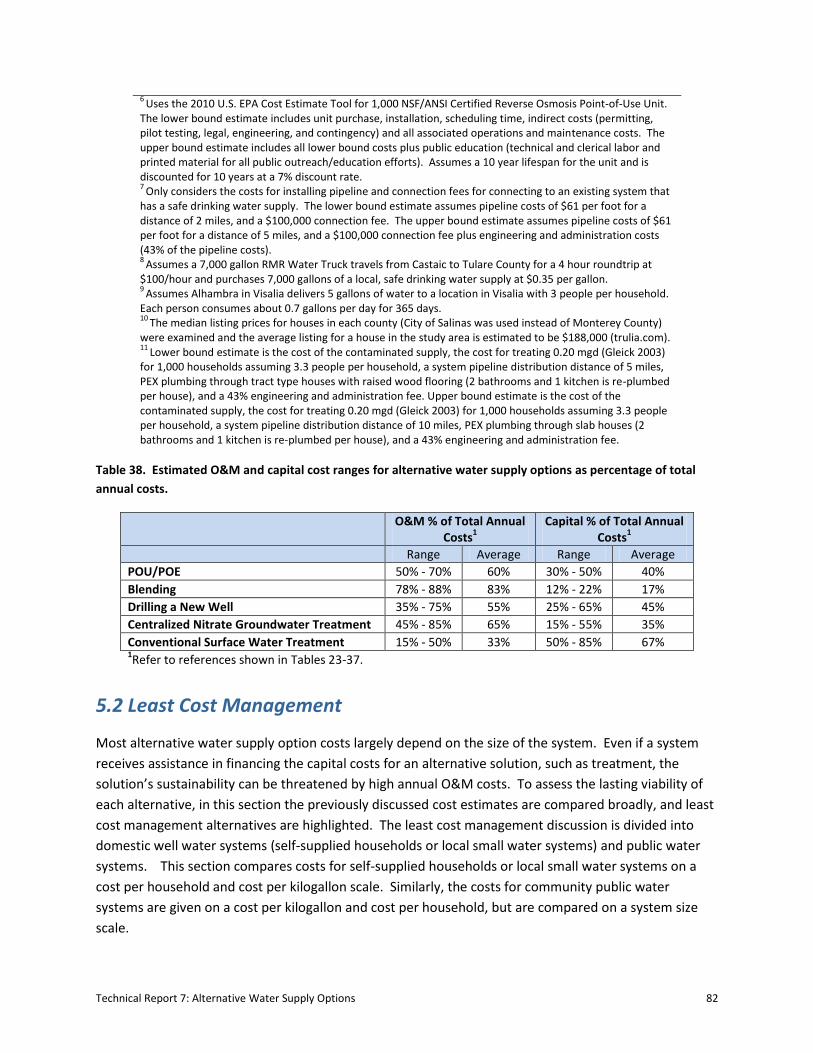
Table 38. Estimated O&M and capital cost ranges for alternative water supply options as percentage of
total annual costs. ....................................................................................................................................... 82
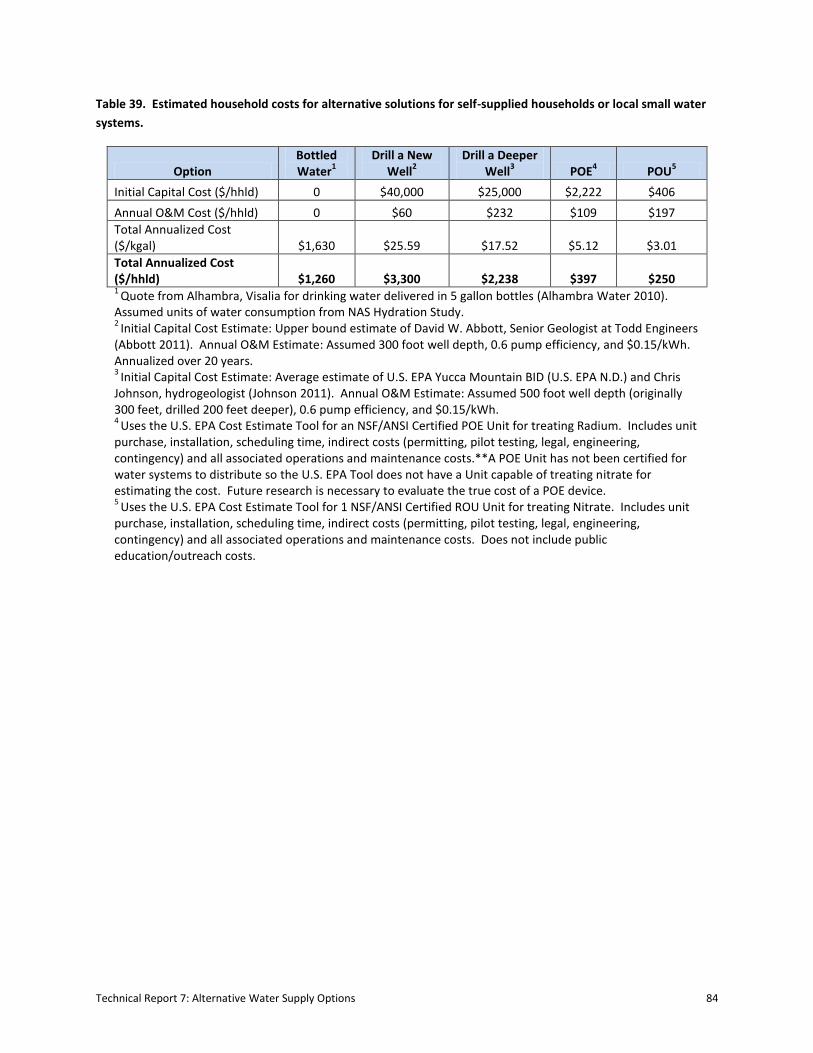
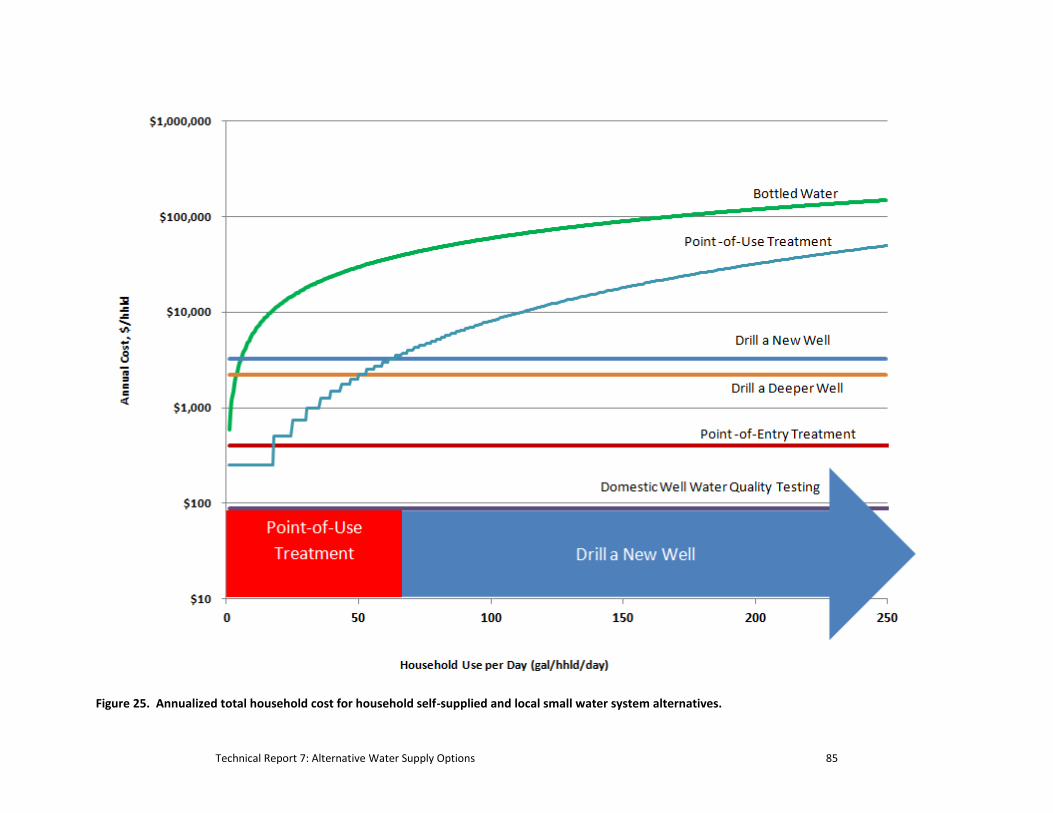
Table 39. Estimated household costs for alternative solutions for self-supplied households or local small
water systems. ............................................................................................................................................ 84
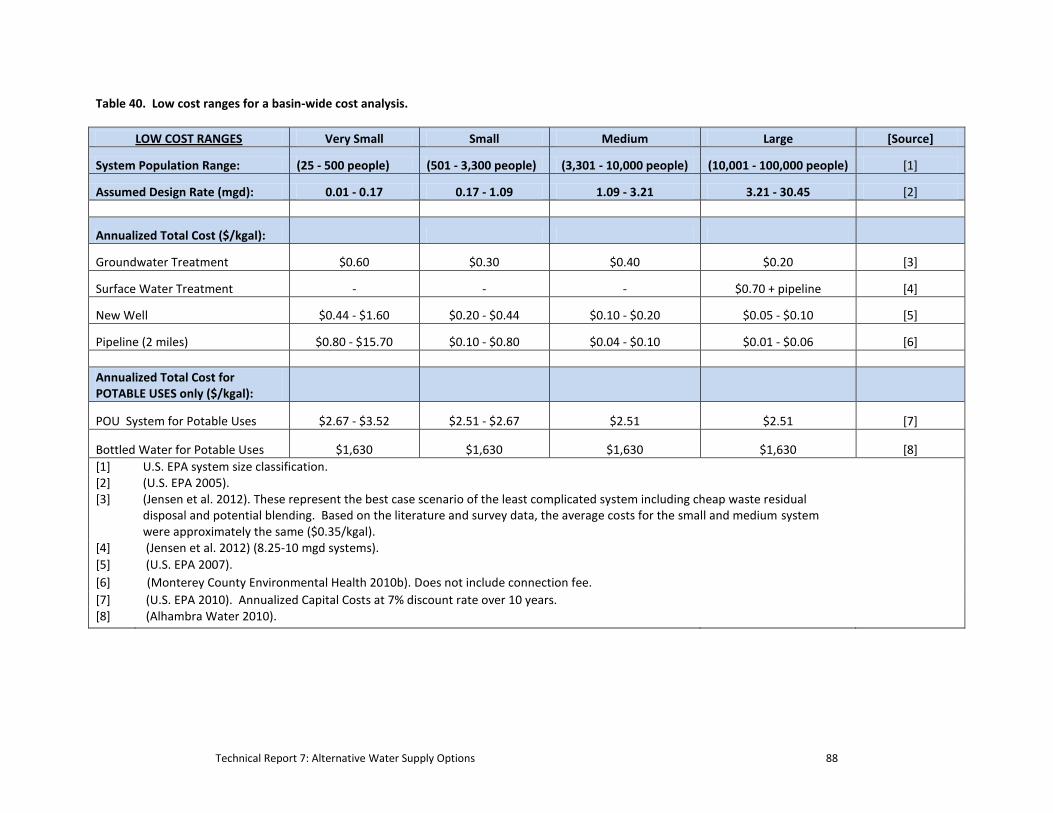
Table 40. Low cost ranges for a basin-wide cost analysis. ......................................................................... 88
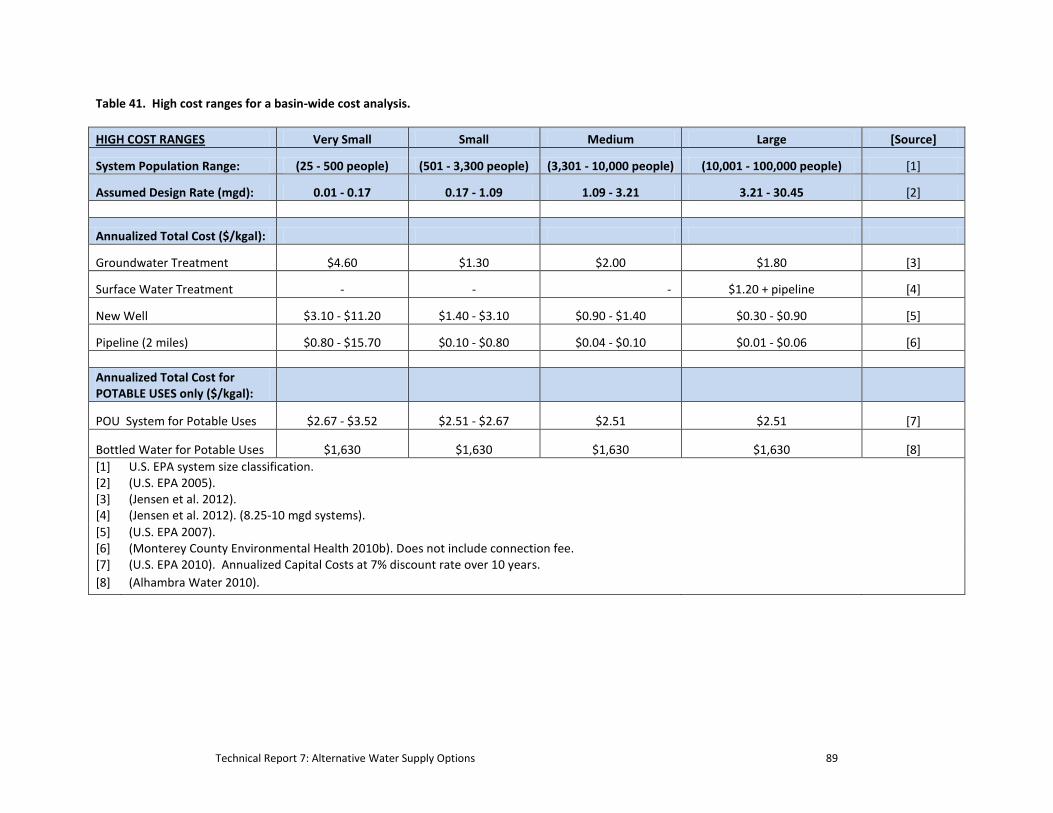
Table 41. High cost ranges for a basin-wide cost analysis. ........................................................................ 89
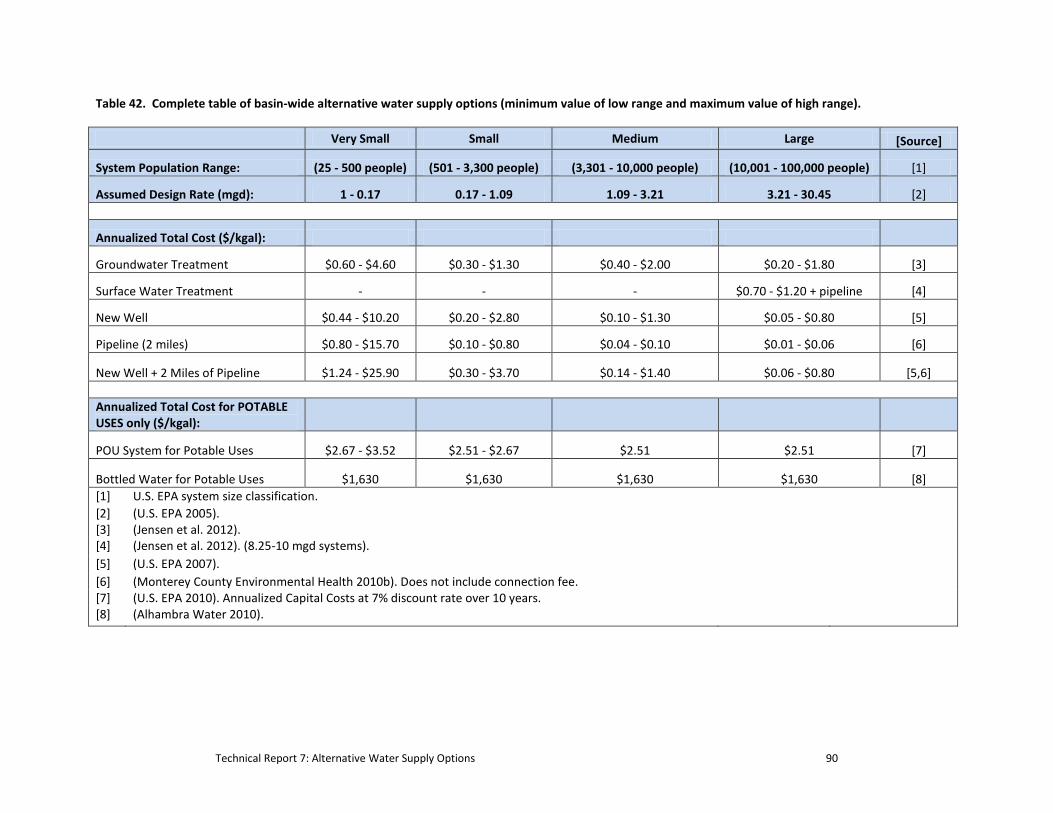
Table 42. Complete table of basin-wide alternative water supply options (minimum value of low range
and maximum value of high range). ........................................................................................................... 90
Technical Report 7: Alternative Water Supply Options vii
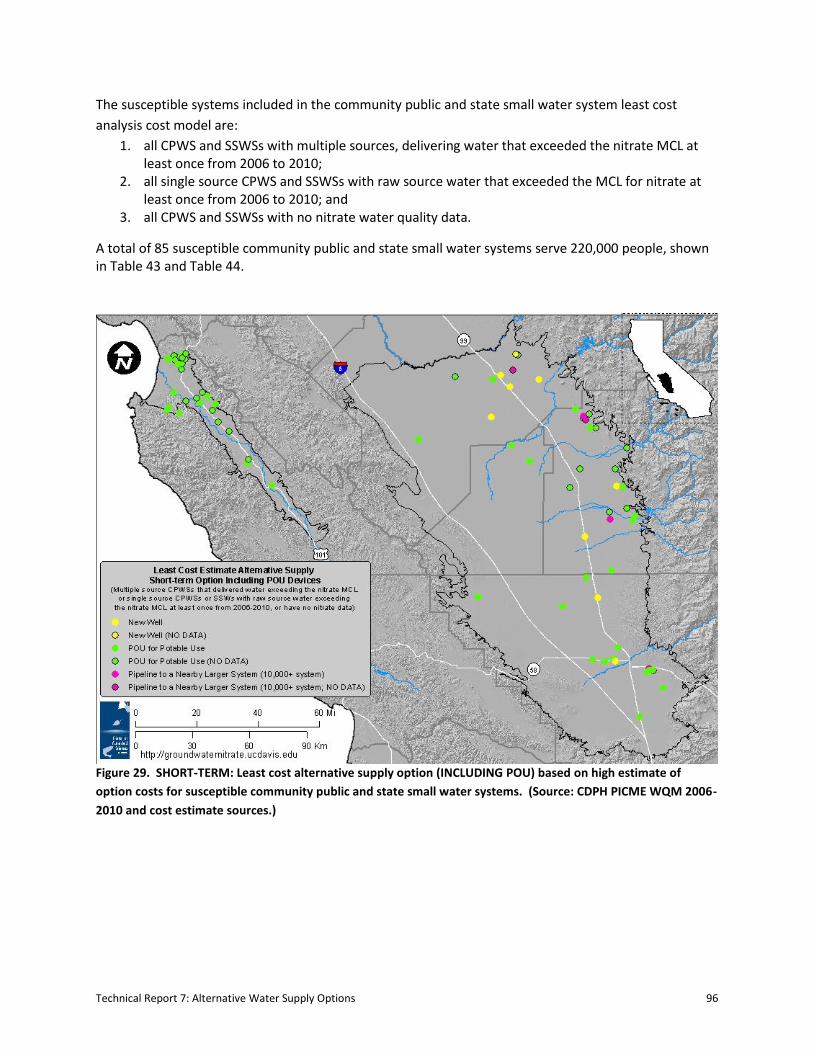
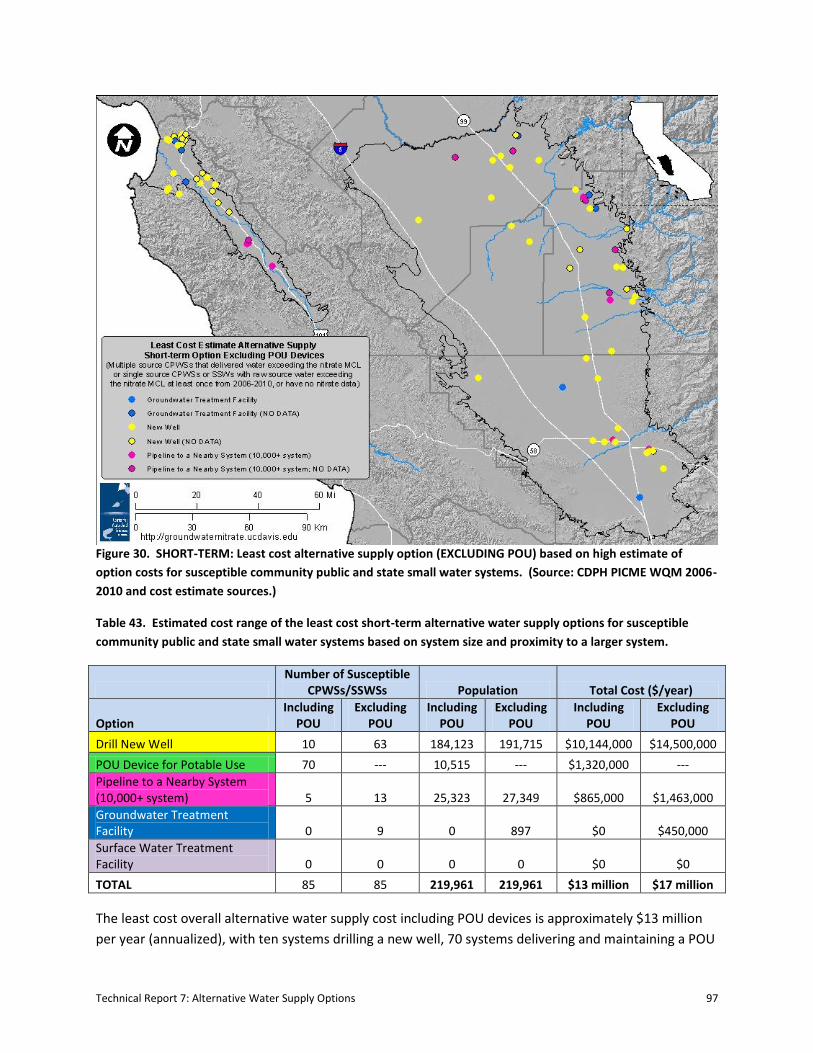
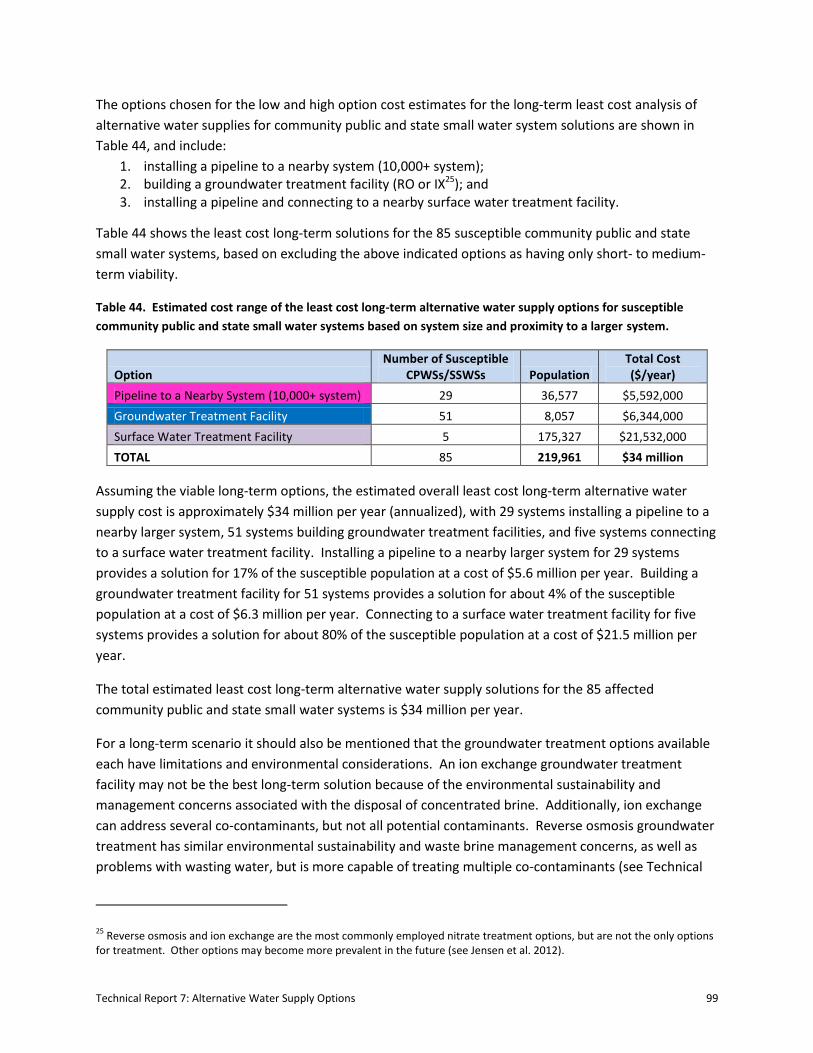
Table 43. Estimated cost range of the least cost short-term alternative water supply options for
susceptible community public and state small water systems based on system size and proximity to a
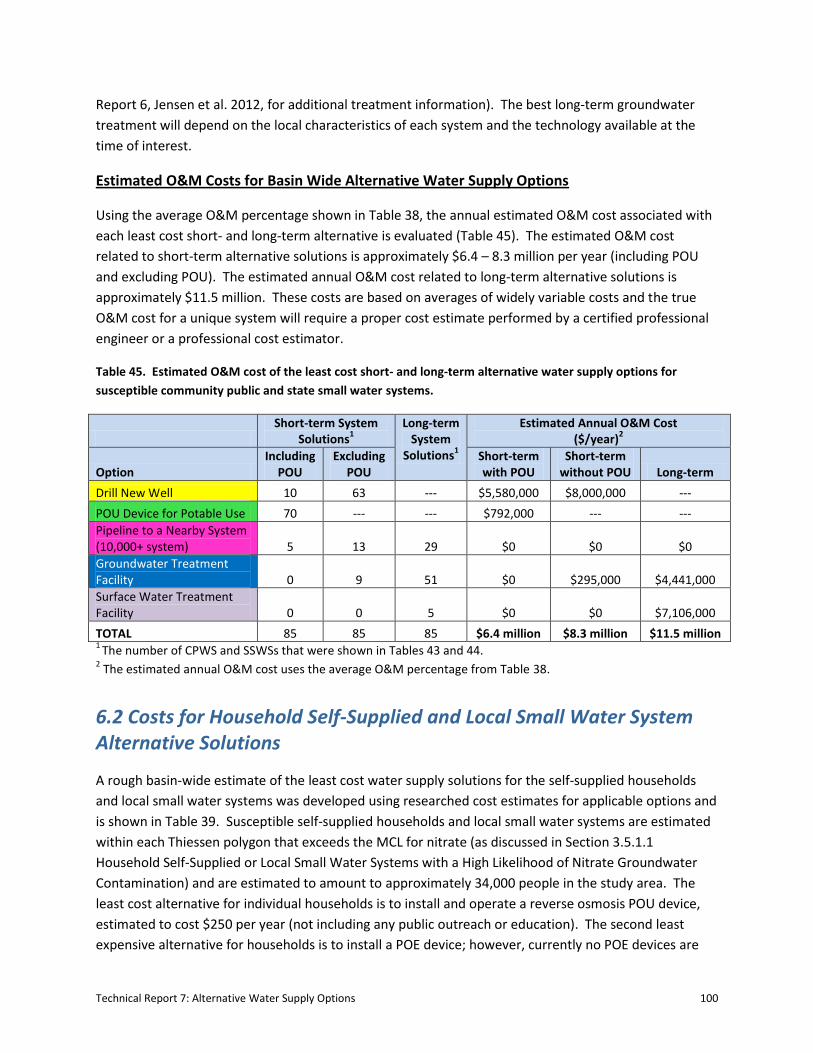
Table 45. Estimated O&M cost of the least cost short- and long-term alternative water supply options
for susceptible community public and state small water systems. .......................................................... 100
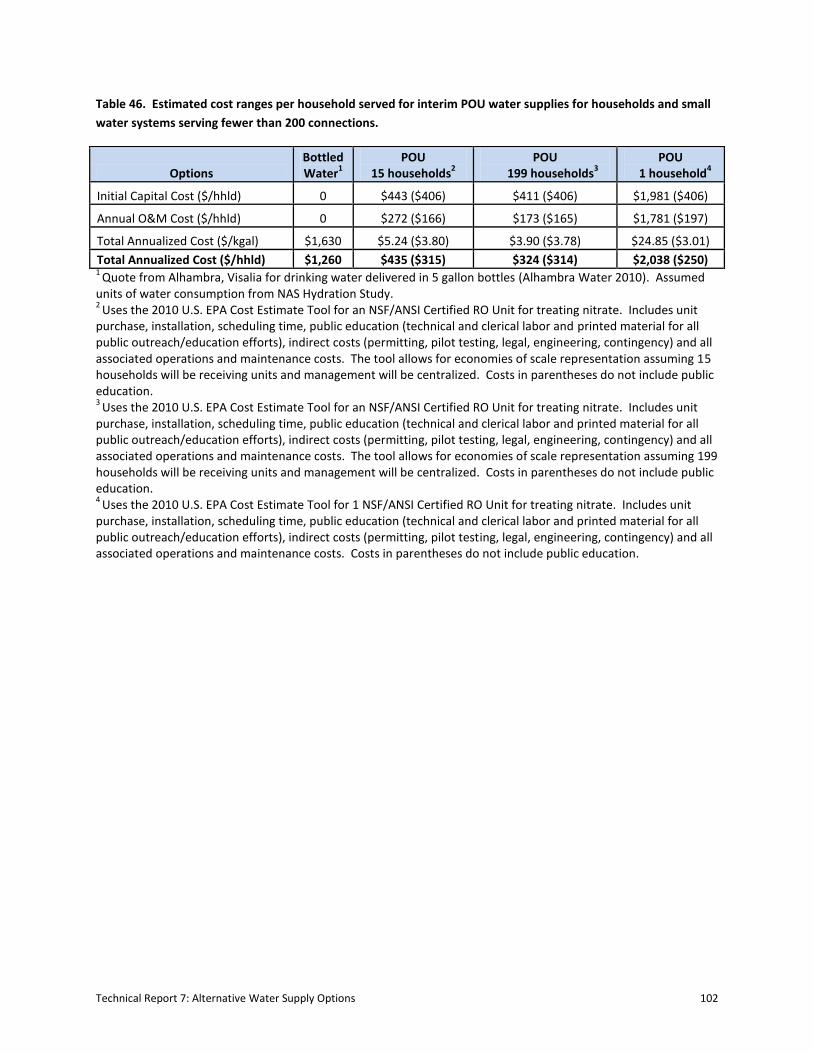
Table 46. Estimated cost ranges per household served for interim POU water supplies for households
and small water systems serving fewer than 200 connections. ............................................................... 102
Technical Report 7: Alternative Water Supply Options viii
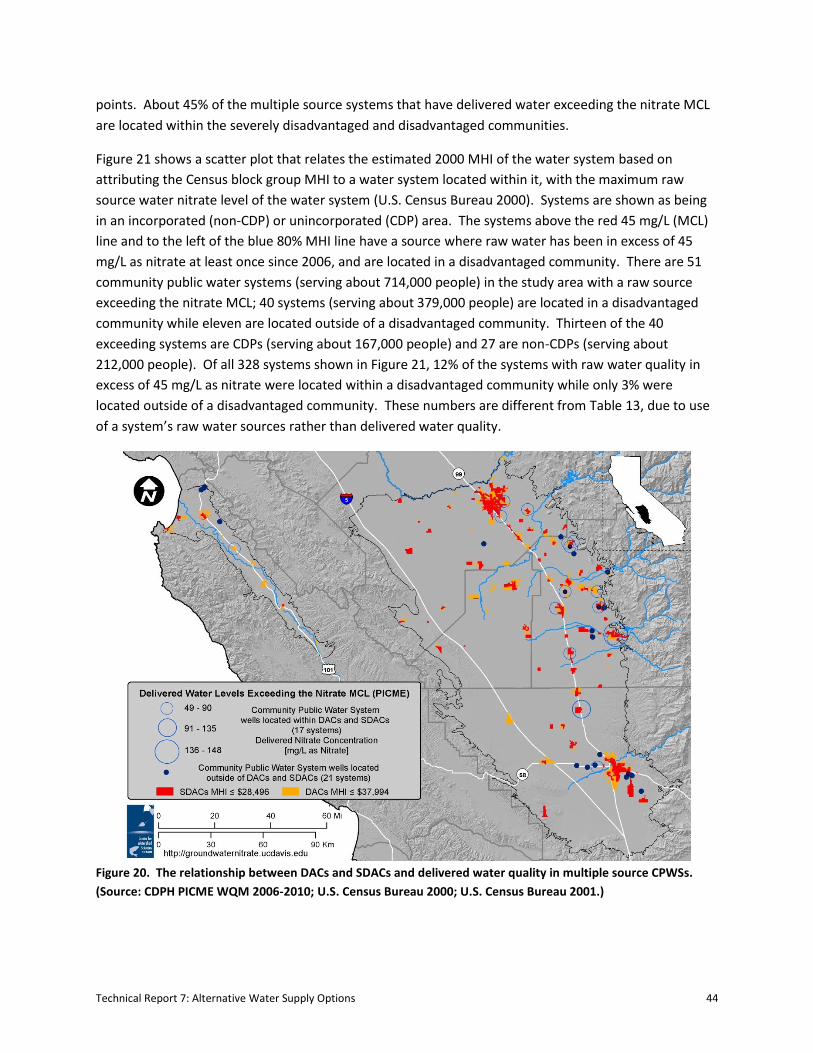
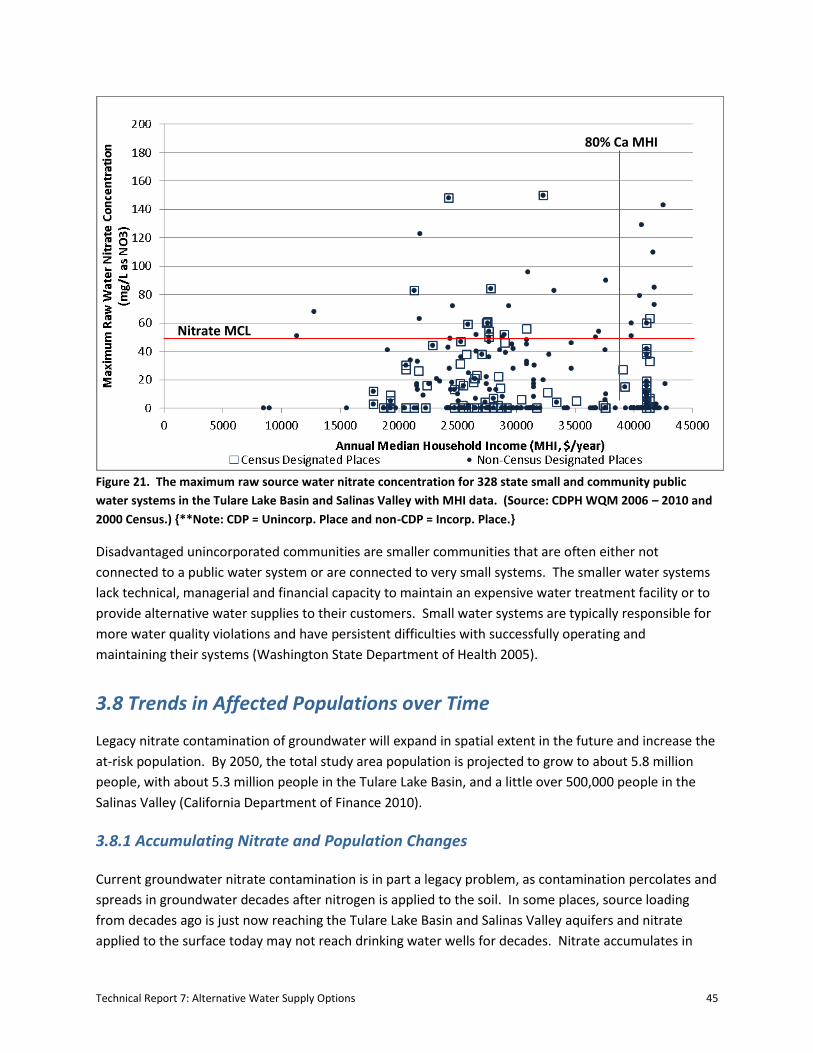
Figures
Figure 1. Bulletin 118 groundwater basins in the study area. ..................................................................... 5
Figure 2. Salinas Valley and Tulare Lake Basin counties. ............................................................................. 6
Figure 3. The size distribution (by population served) for state small (state-documented, listed in PICME)
and community public water systems in the study area. ........................................................................... 15
Figure 4. State small (state-documented) and community public water systems treating or not treating
for nitrate in the Tulare Lake Basin. ............................................................................................................ 16
Figure 5. State small (state-documented) and community public water systems treating or not treating
for nitrate in the Salinas Valley. .................................................................................................................. 16
Figure 6. Estimated location of the area’s 74,000 unregulated self-supplied water systems and the 402
regulated community public and state-documented state small water systems. ..................................... 20
Figure 7. Community public or state small water systems with only one well. ........................................ 22
Figure 8. Community public water systems with only surface water sources. .......................................... 23
Figure 9. Maximum raw source water nitrate concentration within shallow wells (≤ 300’) as Thiessen
Figure 10. Household self-supplied and local small water systems within a Thiessen polygon having a
maximum nitrate concentration value greater than 45 mg/L. ................................................................... 27
Figure 11. Maximum raw nitrate level records in community public and state small water systems. ..... 29
Figure 12. Community public water systems of low vulnerability with delivered water in excess of 45
mg/L as nitrate at least once. ..................................................................................................................... 30
Figure 13. System size distribution (by population served) of the low vulnerability state-documented
state small or community public water systems exceeding 45 mg/L as nitrate. ........................................ 30
Figure 14. Community public water systems in the study area in violation of the nitrate MCL 2004 to
Figure 15. Household self-supplied and local small water system wells within a Thiessen polygon of a
tested upper aquifer well (<300 ft) with maximum nitrate concentration less than 45 mg/L. .................. 35
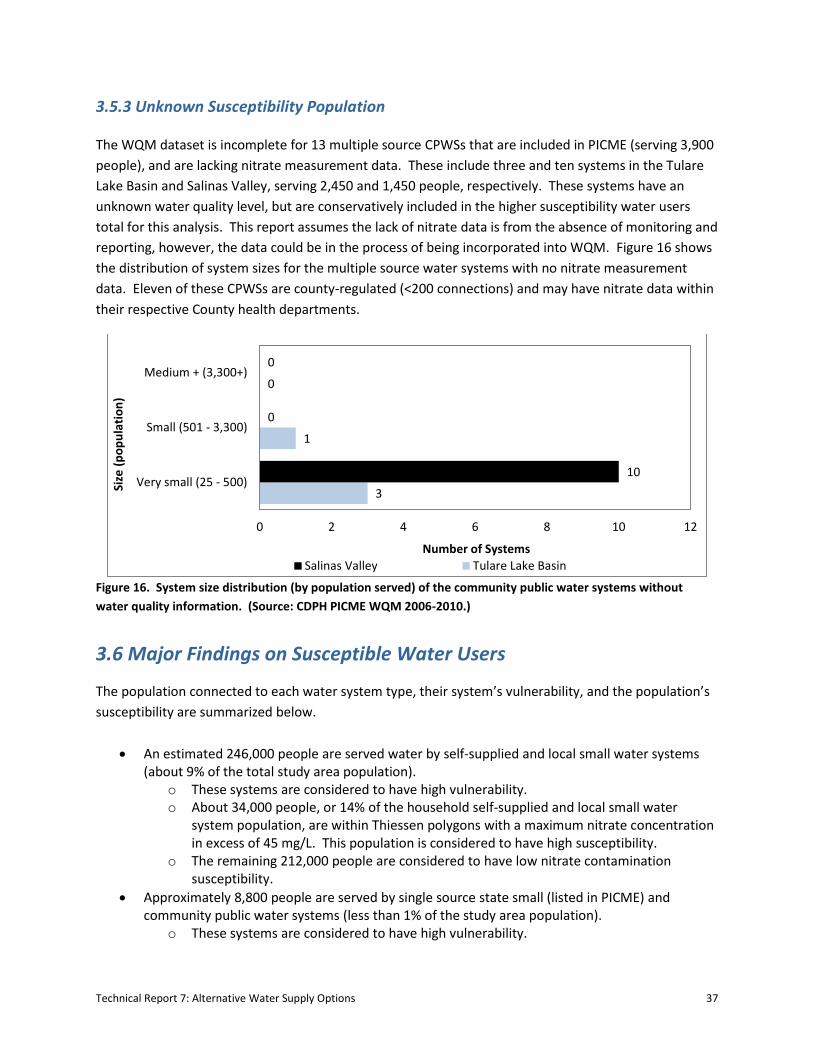
Figure 16. System size distribution (by population served) of the community public water systems
without water quality information. ............................................................................................................ 37
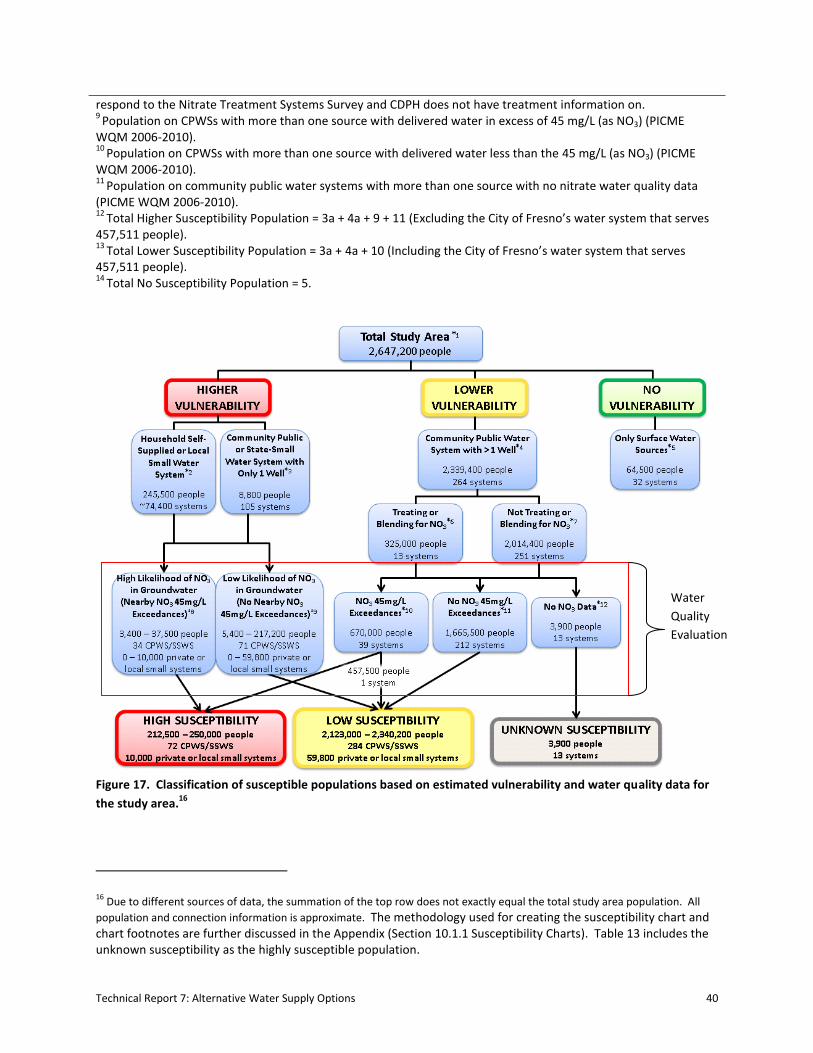
Figure 17. Classification of susceptible populations based on estimated vulnerability and water quality
data for the study area. .............................................................................................................................. 40
Technical Report 7: Alternative Water Supply Options ix
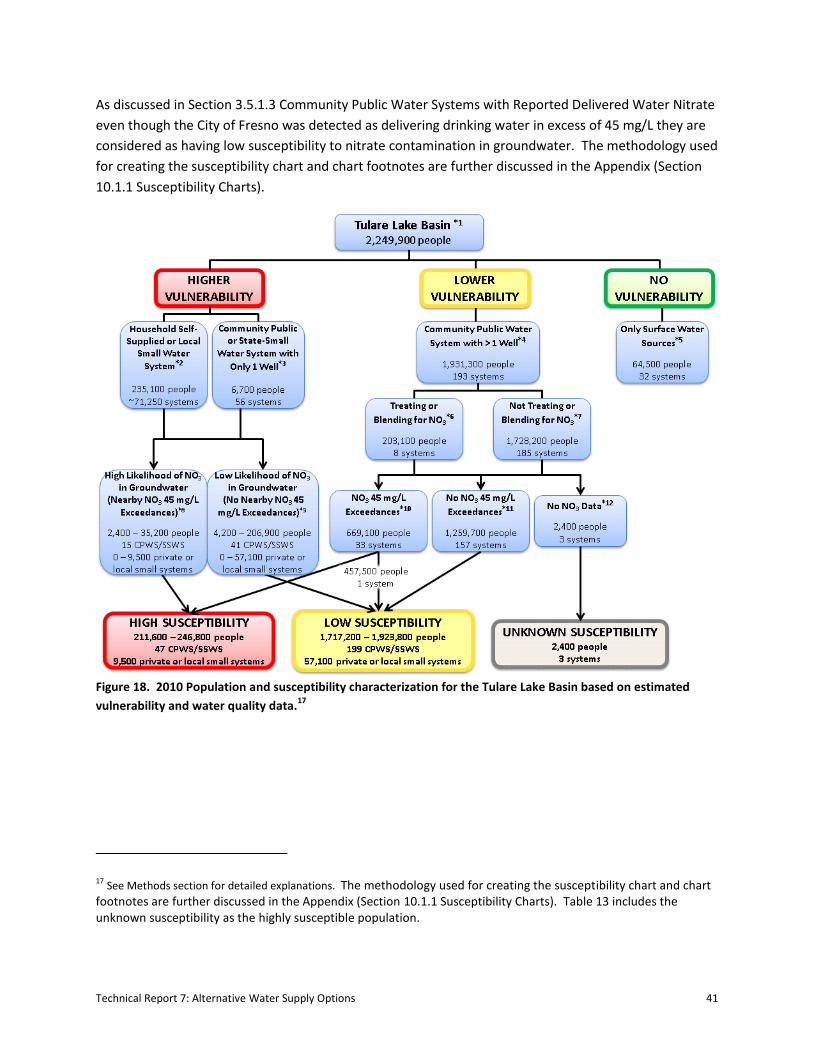
Figure 18. 2010 Population and susceptibility characterization for the Tulare Lake Basin based on
estimated vulnerability and water quality data. ......................................................................................... 41
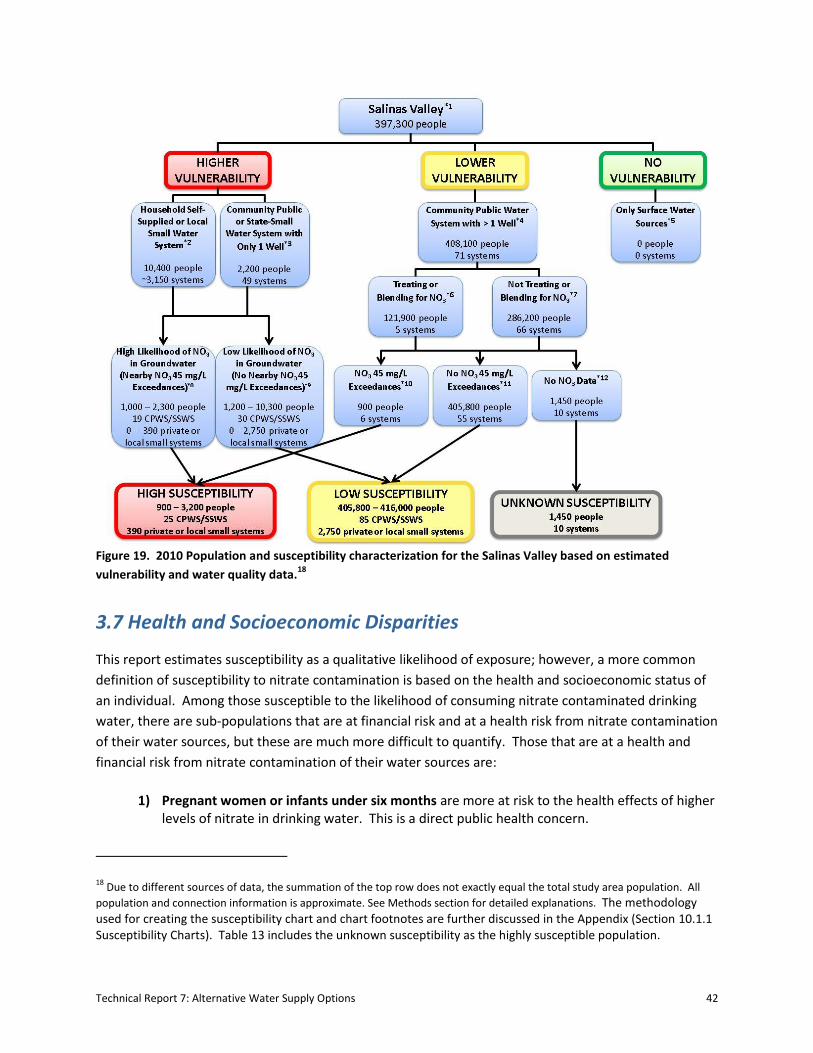
Figure 19. 2010 Population and susceptibility characterization for the Salinas Valley based on estimated
vulnerability and water quality data. .......................................................................................................... 42
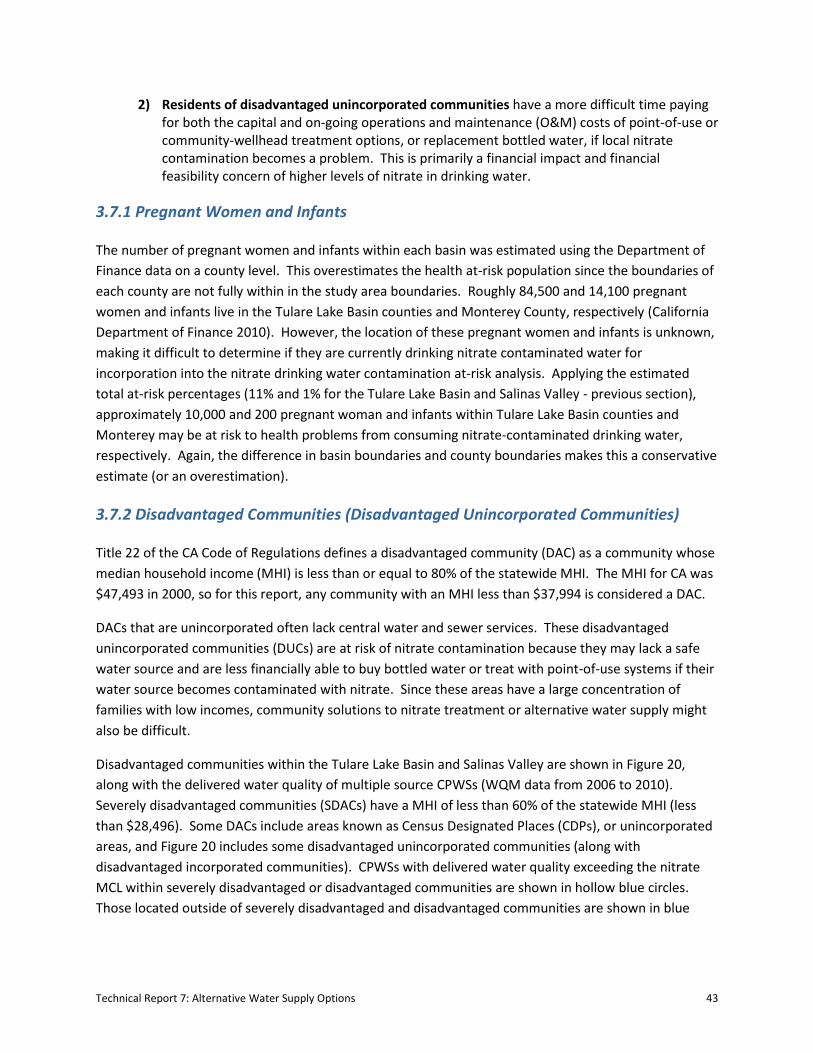
Figure 20. The relationship between DACs and SDACs and delivered water quality in multiple source
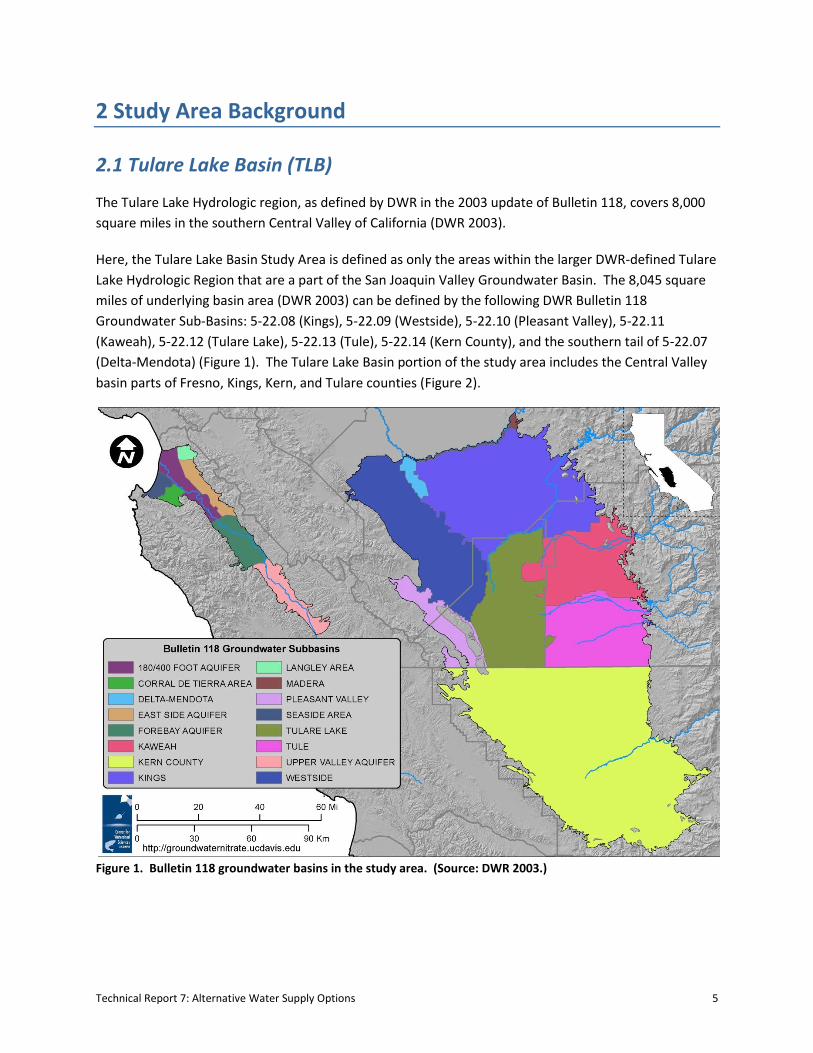
(Kaweah), 5-22.12 (Tulare Lake), 5-22.13 (Tule), 5-22.14 (Kern County), and the southern tail of 5-22.07
(Delta-Mendota) (Figure 1). The Tulare Lake Basin portion of the study area includes the Central Valley
basin parts of Fresno, Kings, Kern, and Tulare counties (Figure 2).
Figure 1. Bulletin 118 groundwater basins in the study area. (Source: DWR 2003.)
Technical Report 7: Alternative Water Supply Options 6
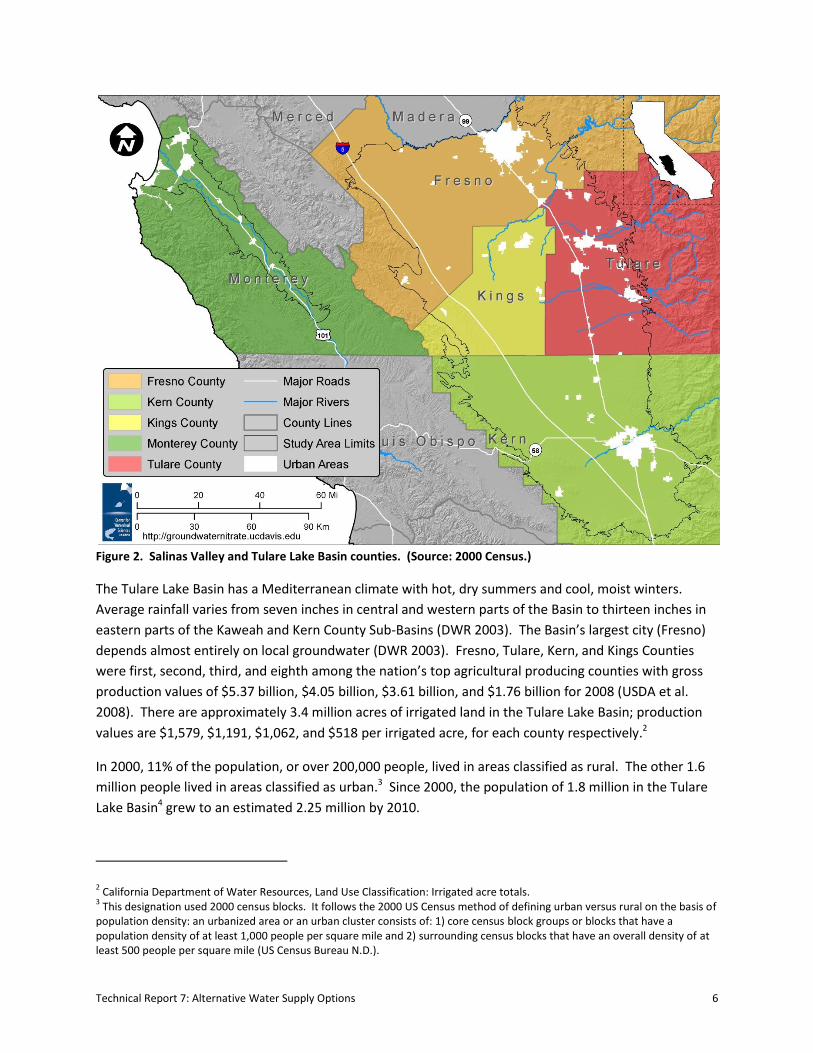
Figure 2. Salinas Valley and Tulare Lake Basin counties. (Source: 2000 Census.)
The Tulare Lake Basin has a Mediterranean climate with hot, dry summers and cool, moist winters.
Average rainfall varies from seven inches in central and western parts of the Basin to thirteen inches in
eastern parts of the Kaweah and Kern County Sub-Basins (DWR 2003). The Basin’s largest city (Fresno)
depends almost entirely on local groundwater (DWR 2003). Fresno, Tulare, Kern, and Kings Counties
were first, second, third, and eighth among the nation’s top agricultural producing counties with gross
production values of $5.37 billion, $4.05 billion, $3.61 billion, and $1.76 billion for 2008 (USDA et al.
2008). There are approximately 3.4 million acres of irrigated land in the Tulare Lake Basin; production
values are $1,579, $1,191, $1,062, and $518 per irrigated acre, for each county respectively.2
In 2000, 11% of the population, or over 200,000 people, lived in areas classified as rural. The other 1.6
million people lived in areas classified as urban.3 Since 2000, the population of 1.8 million in the Tulare
Lake Basin4 grew to an estimated 2.25 million by 2010.
2 California Department of Water Resources, Land Use Classification: Irrigated acre totals.
3 This designation used 2000 census blocks. It follows the 2000 US Census method of defining urban versus rural on the basis of
population density: an urbanized area or an urban cluster consists of: 1) core census block groups or blocks that have a population density of at least 1,000 people per square mile and 2) surrounding census blocks that have an overall density of at least 500 people per square mile (US Census Bureau N.D.).
Technical Report 7: Alternative Water Supply Options 7
2.2 Salinas Valley (SV)
With a total drainage area of five thousand square miles, the Salinas Valley (SV) watershed is the largest
southern California coastal basin (Kulongoski & Belitz 2005). It is bordered by the San Joaquin Valley and
the Pacific Ocean. Boundaries for the SV for this report follow DWR Bulletin 118 Groundwater Sub-
Valley Aquifer), 3-4.08 (Seaside Area), 3-4.09 (Langley Area), and 3-4.10 (Corral de Tierra Area) (Figure 1)
and cover a total drainage area of 650 square miles. The Paso Robles area of the SV watershed is not
included in this study. The SV, as considered here, is entirely within Monterey County (Figure 2).
Its climate features warm, dry summers and cool, moist winters. In Monterey, the average annual
temperature is 57˚F and average annual precipitation is 20 inches (mostly during the winter and early
spring) (Kulongoski & Belitz 2005). Precipitation in the entire Salinas Valley increases with both latitude
and altitude (Kulongoski & Belitz 2005). The Salinas Valley depends almost entirely on local
groundwater for all water supplies, and the SV supports one of the most productive agricultural
industries in California (Monterey County Water Resources Agency 1996). Monterey was fourth among
the nation’s top agricultural producing counties with a gross production value of $4.03 billion for 2008
(USDA et al. 2008). The Salinas Valley has approximately 200,000 acres of irrigated land with an average
production value of $20,150 per irrigated acre.5
In 2000, 7% of the population, or approximately 22,600 people, were classified as living in rural areas.
The other 300,000 people were classified as living in urban areas.6
2.3 Drinking Water Systems
The residential water systems examined in this report include self-supplied households (or domestic
wells), local small water systems, SSWSs, and CPWSs (Table 1). A self-supplied water system is not
shown in Table 1, but is a system served by a single domestic well and is considered a small water
system. Water system definitions and regulations are further discussed in Section 3.1 Drinking Water
Supply Systems.
4The total population living in the Tulare Lake Basin is based on summarizing population values listed in the 2000 US Census
blocks (www.census.gov). This is an overestimation of the total population within the study area because blocks extend
beyond study area boundaries. 5 California Department of Water Resources, Land Use Classification: Irrigated acre totals.
6 This designation uses 2000 census blocks. It follows the 2000 US Census method of defining urban versus rural on the basis of
population density: an urbanized area or an urban cluster consists of: 1) core census block groups or blocks that have a population density of at least 1,000 people per square mile; and 2) surrounding census blocks that have an overall density of at least 500 people per square mile (US Census Bureau N.D.).
Technical Report 7: Alternative Water Supply Options 8
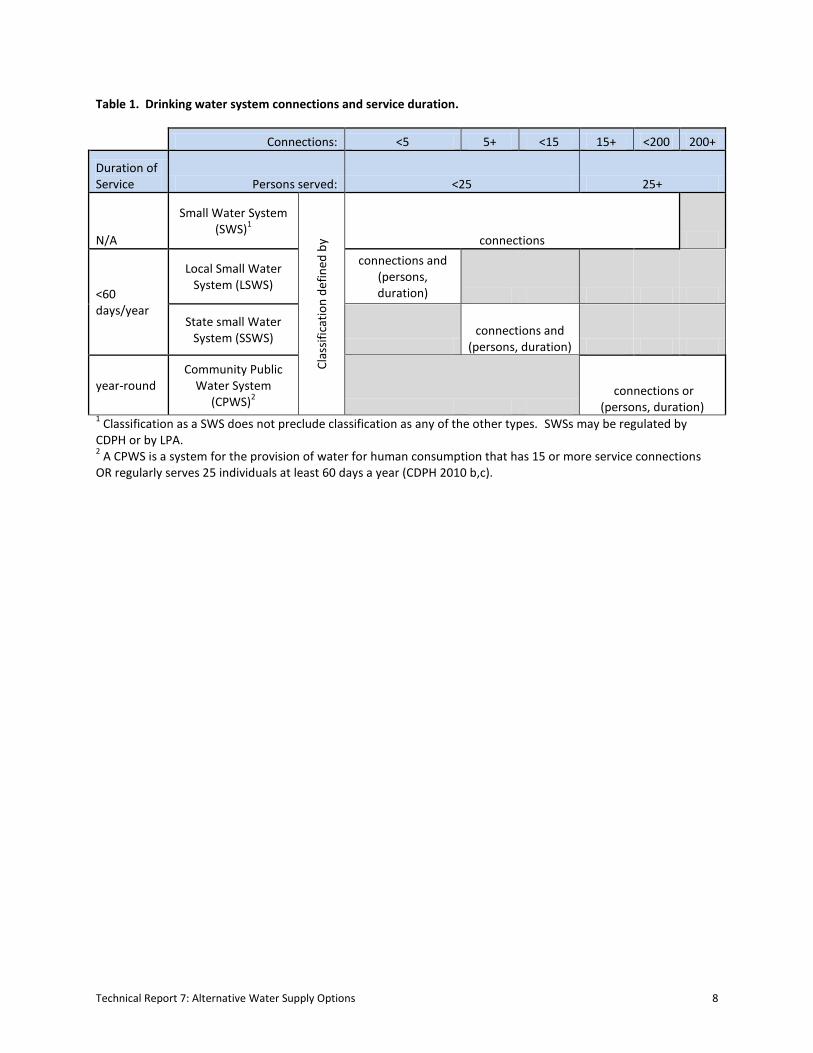
Table 1. Drinking water system connections and service duration.
Connections: <5 5+ <15 15+ <200 200+
Duration of Service Persons served: <25 25+
N/A
Small Water System (SWS)
1
Cla
ssif
icat
ion
def
ined
by connections
<60 days/year
Local Small Water System (LSWS)
connections and (persons, duration)
State small Water System (SSWS)
connections and
(persons, duration)
year-round Community Public
Water System (CPWS)
2
connections or
(persons, duration) 1 Classification as a SWS does not preclude classification as any of the other types. SWSs may be regulated by
CDPH or by LPA. 2 A CPWS is a system for the provision of water for human consumption that has 15 or more service connections
OR regularly serves 25 individuals at least 60 days a year (CDPH 2010 b,c).
Technical Report 7: Alternative Water Supply Options 9
3 Susceptible Water Users
This section examines the existing California drinking water supply systems within the study area and
summarizes current threats to groundwater quality in the study area in the context of the established
nitrate safe drinking water standard (45 mg/L). A discussion of nitrate susceptible drinking water users
is provided, defining system vulnerability and the susceptible population. To identify susceptible water
users within the Salinas Valley and the Tulare Lake Basin, all public data pertaining to drinking water
systems and water quality were collected and analyzed. Self-supplied households and their domestic
well locations were estimated on a land parcel level. The population that relies on domestic wells or
local small water systems was deduced from the basin total population and the land parcel level
estimates for domestic wells. An overview of the methods and data used for estimating susceptible
water users is provided in Section 3.3 Susceptible Water Users Overview.
3.1 Drinking Water Supply Systems
Water system types are defined by the period of water service, the number of people served, and the
number of connections. A public water system (PWS) pipes water for human consumption to 15 or
more service connections or regularly serves at least 25 people daily for at least 60 days of the year
(CDPH 2010b; CDPH 2010c). PWSs include a wide range of system types, both residential and non-
residential. A CPWS is a PWS that serves at least 15 residential connections all year or regularly serves
at least 25 residents all year (CDPH 2010b; CDPH 2010c). In addition to CPWSs, PWSs include non-
transient non-community (NTNC) and transient non-community (TNC) systems. A NTNC PWS serves
drinking water to a stable non-residential population of more than 25 people; these systems are often
schools and places of business (CDPH 2010b; CDPH 2010c). A TNC PWS serves areas such as
campgrounds or restaurants that serve a changing population of 25 or more people, 60 or more days
per year (CDPH 2010b; CDPH 2010c). A SSWS is not a PWS and pipes water to five to fourteen
connections, and does not regularly serve drinking water to more than an average of 25 people daily for
at least 60 days of the year (CDPH 2010b; CDPH 2010c). Systems with two to four service connections
are referred to as local small water systems in some counties or as self-supplied households on a
domestic well in other counties. Systems with less than two connections and self-supplied households
are often referred to together as domestic wells.
Water system regulations depend on water system type. PWSs and CPWSs are state-regulated, SSWSs
are county-regulated, and local small and household self-supplied systems are largely unregulated,
unless a County ordinance requires well monitoring when well property is sold. Monterey County
regulates their local small water systems and requires them to comply with Title 22 of the California
Code of Regulations and the Monterey County Code (Monterey County Environmental Health 2011).
PWSs and CPWSs are regulated by the state pursuant to Title 22 of the California Code of Regulations
and Health and Safety Code Section 131051, et seq. PWSs and CPWSs must also adhere to the National
Primary Drinking Water Regulations under the Safe Drinking Water Act.
Technical Report 7: Alternative Water Supply Options 10
Most counties are designated Local Primacy Agencies (LPAs) and are responsible for regulating
community public water systems with up to 199 connections. Tulare County, Kings County, and
Monterey County are all LPAs (CDPH 2011b; CDPH 2011c). Fresno County relinquished LPA authority in
2007. LPAs are also responsible for regulation or oversight of SSWSs (five to fourteen connections).
County-regulated systems serving five to fourteen connections are not explicitly covered by the Safe
Drinking Water Act, but they may still be required to treat by a variety of other contractual or
development permit terms, local/county ordinances, or anti-pollution laws. However, monitoring or
procedures to implement these requirements may not be in place. County-regulated water systems are
subject to tort law7 if they fail to protect the water delivered to consumers. Public water systems are
also subject to tort law if they fail to protect the water delivered to consumers.
3.2 Water Quality Threats
Once the water quality of an aquifer has been degraded, the aquifer may no longer be considered a safe
drinking water source without treatment; however, all groundwater designated as having municipal or
domestic supply (MUN) beneficial use still has that designated use even if the groundwater is
contaminated. Threats to groundwater quality can be point or nonpoint source pollution (see Technical
Report 2, Viers et al. 2012). Point sources are easier to identify than nonpoint sources because they
originate from specific locations, are usually regulated, and are typically discharged from pipes.
Nonpoint sources occur from pollutants over a wide area, such as irrigation runoff or infiltration from
agriculture. Examples of point sources of nitrate contamination include leaking underground septic
systems and discharge from wastewater treatment plants to percolation basins. Nonpoint
contamination comes from agriculture, mining, dairies, feedlots, and urban stormwater. Contaminants
also enter aquifers directly from surface water, improperly built groundwater wells, and surface water
infiltrating through the soil. The primary constituents of concern within California’s groundwater are
(DWR 2003). Contaminated groundwater can also affect the quality of surrounding surface water.
To protect the public from harmful constituents in groundwater and surface water, Congress passed the
Safe Drinking Water Act (SDWA) of 1974 to require regular testing of drinking water supplies, set
standards for contaminant concentrations, and schedule for development of new standards (U.S. EPA
2011a). The SDWA also requires the Office of Environmental Health Hazard Assessment (OEHHA, within
Cal EPA) to adopt Public Health Goals (PHGs), pursuant to California Health and Safety Code Section
116535, based solely on public health considerations (CaEPA 1997). PHGs represent the official level of
a contaminant that can be consumed daily for a lifetime without imposing a health risk. The PHGs are
based entirely on public health considerations and are used, along with consideration of health,
economic cost, and technical feasibility (examined by CDPH), to establish state MCLs. PHGs are
developed for chemical contaminants based on the best available toxicological data in the scientific
literature.
7 Tort law is a body of rights, obligations, and remedies that is applied by courts in civil proceedings to provide relief for persons
who have suffered harm from the wrongful acts of others (Farlex Inc. 2012).
Technical Report 7: Alternative Water Supply Options 11
The PHG for nitrate is 45 parts per million (ppm), which is equivalent to California’s current MCL of 45
mg/L (as NO3-). A system becomes legally non-compliant with the nitrate MCL, or “in violation,” when
there are two successive reporting MCL exceedances or failure to report the results of a follow-up test
on an initial reporting MCL exceedance. Water systems that are currently non-compliant with the state
MCL must distribute public notifications to all consumers of potential health risks from consumption of
their water. When half the MCL is exceeded for nitrate, systems must switch from annual monitoring
and reporting to quarterly monitoring and reporting and they must include a health information notice
in the consumer confidence report (CCR) discussing public health concerns from consumption of nitrate
(CDPH 2008). If a water system exceeds half of the MCL the system must “notify the governing body of
the local agency in which users of the drinking water reside” and it is recommended that the systems
notify their customers about the occurrence and health concern of consumption of the contaminant
(CDPH 2008).
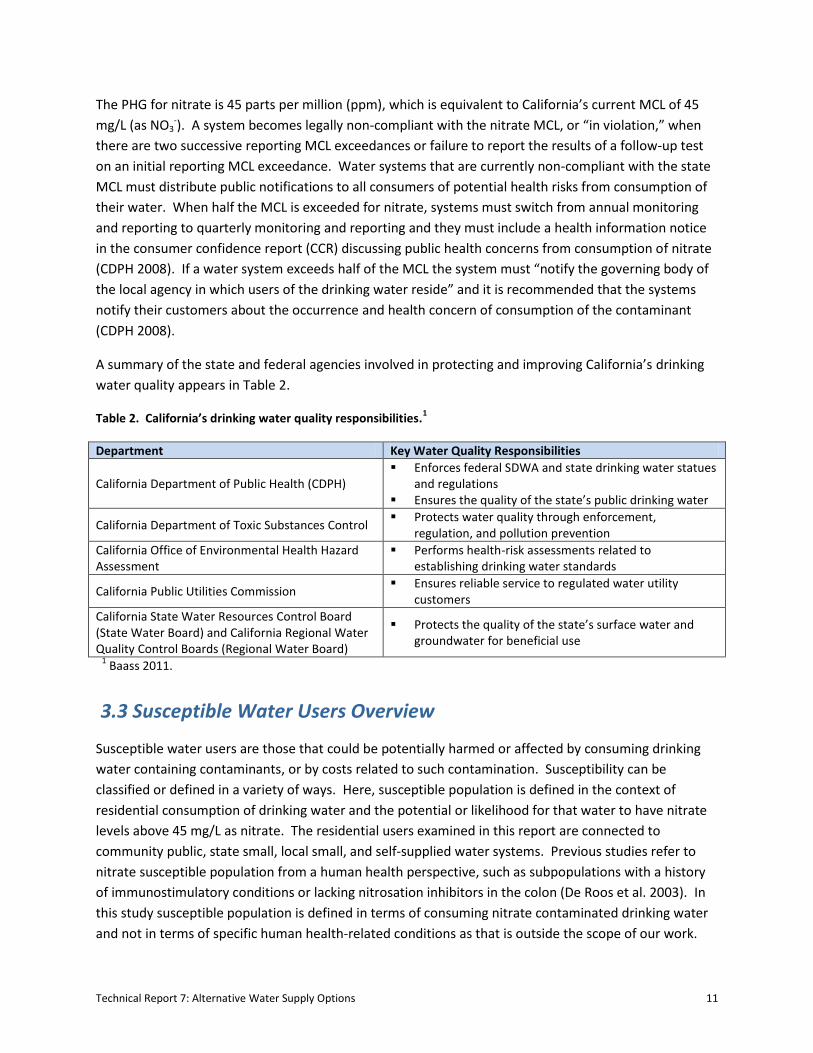
A summary of the state and federal agencies involved in protecting and improving California’s drinking
water quality appears in Table 2.
Table 2. California’s drinking water quality responsibilities.1
Department Key Water Quality Responsibilities
California Department of Public Health (CDPH) Enforces federal SDWA and state drinking water statues
and regulations Ensures the quality of the state’s public drinking water
California Department of Toxic Substances Control Protects water quality through enforcement,
regulation, and pollution prevention
California Office of Environmental Health Hazard Assessment
Performs health-risk assessments related to establishing drinking water standards
California Public Utilities Commission Ensures reliable service to regulated water utility
customers
California State Water Resources Control Board (State Water Board) and California Regional Water Quality Control Boards (Regional Water Board)
Protects the quality of the state’s surface water and groundwater for beneficial use
1 Baass 2011.
3.3 Susceptible Water Users Overview
Susceptible water users are those that could be potentially harmed or affected by consuming drinking
water containing contaminants, or by costs related to such contamination. Susceptibility can be
classified or defined in a variety of ways. Here, susceptible population is defined in the context of
residential consumption of drinking water and the potential or likelihood for that water to have nitrate
levels above 45 mg/L as nitrate. The residential users examined in this report are connected to
community public, state small, local small, and self-supplied water systems. Previous studies refer to
nitrate susceptible population from a human health perspective, such as subpopulations with a history
of immunostimulatory conditions or lacking nitrosation inhibitors in the colon (De Roos et al. 2003). In
this study susceptible population is defined in terms of consuming nitrate contaminated drinking water
and not in terms of specific human health-related conditions as that is outside the scope of our work.
Technical Report 7: Alternative Water Supply Options 12
Balazs (2011) suggested a susceptibility measure based on system water quality and the total number of
raw water sources within a community water system. Balazs categorized community public water
systems by considering three levels of source water quality: 1) low (< 22.5 mg NO3-/L), 2) medium (22.5
mg NO3-/L to 44.9 mg NO3
-/L), or 3) high (≥ 45 mg NO3-/L). Balazs then estimated the total population
potentially exposed based on the population served by these individual community public water
systems (according to CDPH’s Permitting Inspection Compliance Monitoring and Enforcement Database
(PICME)). For this report, we use a similar approach for defining susceptible water users.
Here, the susceptible population is estimated by examining the water system vulnerability and the
recent raw source water and delivered source water (method discussed in Section 10.1.2 Estimating
“Delivering” Sources of a System) quality (if available). Specifically we define “susceptible population”
as the number of individuals who:
1. are served by a CPWS with multiple drinking water sources that has reported at least one delivered water nitrate record in excess of 45 mg/L in the past five years in CDPH’s Water Quality Management Database (WQM), or
2. are served by a CPWS or SSWS with only a single drinking water source that has reported at least one raw water nitrate record in excess of 45 mg/L in the past five years in WQM, or
3. are on domestic wells or local small water systems and located in an area (Thiessen polygon) where shallow groundwater (<300 feet) has exceeded 45 mg/L as nitrate in the past (1989-2010, data from the UC Davis California Spatio-Temporal Information on Nitrate in Groundwater (CASTING) database), or
4. are served by a CPWS or state-documented SSWS (reported in PICME) lacking nitrate water quality data.
Additionally, the Annual Compliance Reports (ACRs) from CDPH were used to find systems in violation of
the nitrate MCL from 2004 to 2008, to provide a narrow regulatory violator based estimate of the
susceptible population and for comparison with the estimated susceptible population as defined above
in item 1, for multiple source CPWSs.
To estimate the population susceptible to nitrate groundwater contamination in the study area, we first
categorize the vulnerability of water systems, or system vulnerability. Population susceptibility is then
scored as “high”, “low”, or “unknown” by evaluating historical nitrate water quality data. In other
words, the population susceptibility is derived by scoring water system vulnerability and by scoring its
respective water quality record.
System vulnerability describes the intrinsic potential for a system to inadvertently deliver drinking water
to users with high nitrate levels based on the type of system and based on the number of water sources
within the system. System vulnerability is scored as follows:
Lower system vulnerability is assigned to community public water systems (water systems with > 15 connections) that have more than one source of water (i.e., more than one well) irrespective of whether or not they treat their water to reduce or remove nitrate.
Higher system vulnerability is assigned to all other water systems (community public water systems with one well, and state small, local small, and household self-supplied water systems).
Technical Report 7: Alternative Water Supply Options 13
No system vulnerability (to groundwater contamination) is assigned to water systems that are solely supplied by surface water.
Next, the likelihood for a system to encounter adverse drinking water quality conditions (with or without
addressing these in the treatment process) is estimated to determine the susceptible population. We
examine the water quality history documented for each system, or, if that information is not available,
the historical ambient groundwater quality in the vicinity of each source or system. Given the system
vulnerability and its water quality history, the susceptible population served by the system is ranked as:
Low susceptibility if there has been no recent nitrate record in excess of 45 mg/L documented delivered water for multiple source systems, in documented raw water for single source systems, or in ambient groundwater in the vicinity of the source for undocumented systems.
High susceptibility if there has been at least one recent nitrate record in excess of 45 mg/L in documented delivered water for multiple source systems, in documented raw water for single source systems, or in ambient groundwater in the vicinity of a source for undocumented systems.
Unknown susceptibility, if a community public water system has no nitrate water quality data available.
The highly susceptible population in this study is considered to be the estimated population served by
systems ranked as being of high or unknown susceptibility. The rest of the population is considered to
be of low susceptibility to nitrate contamination in groundwater.
The water system populations within the delineated Tulare Lake Basin and Salinas Valley pilot study
areas were estimated combining a variety of information sources, including the 2010 Census, California
Department of Finance 2010 population estimates, each county’s Local Agency Formation Commission,
and CDPH PICME data. Once the total pilot area study population was estimated, the PICME population
numbers for community public and state small water systems located in each basin were recorded and
summed, and the difference used to estimate the remaining population and number of households
supplied by domestic wells and local small water systems. This estimation method is inherently
imprecise as to absolute populations due to data limitations and inconsistencies, including data
coverage (i.e., Census block groups versus county boundaries), population values listed in PICME that
are rounded up and tend to exceed the actual population served, and systems within the study area
boundaries that may serve households just outside.
Details and discussion of the approach, data and results for classifying system vulnerability and
susceptible population, follow in Section 3.4 Water System Infrastructure and Section 3.5 Susceptible
Drinking Water Users. These sections include assumptions and methods used to estimate the various
categories of classified populations. The final results from the analysis of the population susceptible to
nitrate contamination in the pilot study area and each basin are presented in Section 3.6 Major Findings
on Susceptible Water Users.
Technical Report 7: Alternative Water Supply Options 14
3.4 Water System Infrastructure
Water system vulnerability is based on a system’s ability to protect against nitrate contamination. The
system vulnerability classification describes the potential for delivering high nitrate water to users and is
a function of system type. All households in the study area are categorized into four types of residential
drinking water supply systems: household self-supplied, local small, state small, or community public
water system. A household self-supplied, local or state small water system (not already in PICME) has
higher vulnerability since they lack multiple sources. A community public water system with multiple
sources has less vulnerability and a system using only surface water has no vulnerability to nitrate in
groundwater. The CDPH WQM and PICME database provided all community public water system data
and some state small water system information to identify system type, locate sources, and determine
nitrate levels in raw and distributed water for the vulnerability and susceptibility assessments. The
domestic wells were located based on the method discussed in Section 3.4.2.1 Household Self-Supplied
or Local Small Water Systems.
In most counties, state small water systems receive little monitoring or regulatory attention, and are
typically considerably more vulnerable to ambient pollution than are CPWSs. CPWSs must adhere to the
state MCLs for all drinking water contaminants, so households on these systems should have less
vulnerability to nitrate contamination. However, community public water systems having only one well
have the potential to be more vulnerable since blending cannot be used as a relatively inexpensive
solution.
Lower vulnerability is assigned to regulated CPWSs that have more than one well and the opportunity to
blend. Systems that rely completely on surface water have no vulnerability to delivering groundwater
contaminated with nitrate, though they may be vulnerable to other pollutants.
This report only addresses system vulnerability from community public water systems or water systems
that directly serve residences. It is assumed that the non-community systems adequately warn their
users if nitrate contamination is a concern; since users are not permanent, we here assume that they
are generally able to either avoid use or provide themselves with safe drinking water from another
source. Approximately 382 non-transient, non-community public water systems serve about 190,000
people in the study area. These 382 systems are non-residential and serve the same people for at least
6 months, such as schools and businesses. Approximately 318 transient non-community public water
systems in the study area serve about 150,000 people. These 318 systems are non-residential and serve
a changing population for at least 60 days per year, such as restaurants, hotels, stores and
campgrounds.
According to PICME, 401 active community public and state small water systems exist in the study area
regions (281 in the Tulare Lake Basin and 120 in the Salinas Valley). These systems supply water to
about 2.4 million people. The 371 CPWSs are supplied by 3,829 sources and the 30 state-documented
(listed in PICME) SSWSs supplied by 31 sources. Of the 3,860 sources overall, 3,682 are groundwater;
the remaining 178 are surface water. The state small water systems in PICME do not account for all
state small water systems in the study area. The 30 state small systems were included in PICME as part
Technical Report 7: Alternative Water Supply Options 15
of Assembly bill 1403 and are further referred to as state-documented state small water systems (CDPH
2011). The locations and information on any other state small water systems, not contained in PICME,
could not be identified, and thus the population served by these systems was not considered further.
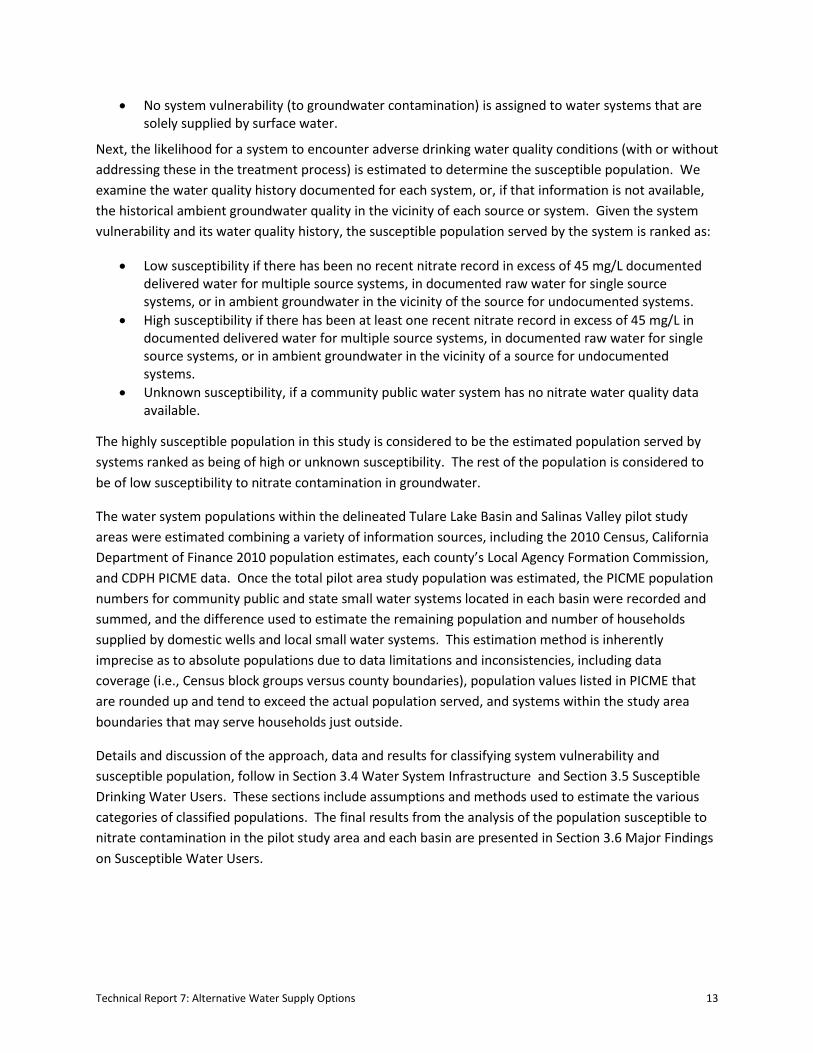
Figure 3 breaks down the number of state small and community public water systems by their U.S. EPA
size categories,8 in PICME and the study area. The Tulare Lake Basin has 8 state small and 172
community public water systems serving very small systems (< 501 people), and 47 community public
water systems serving small systems (501 to 3,300 people). About 81% of Tulare Lake Basin water
systems (CPWSs and state-documented SSWSs) are very small or small and serve 89,125 people (4% of
the Tulare Lake Basin population). The Salinas Valley has 22 state small and 73 community public water
systems serving very small systems, and 11 community public water systems serving small systems.
About 89% of the Salinas Valley water systems are very small or small and serve 23,215 people (6% of
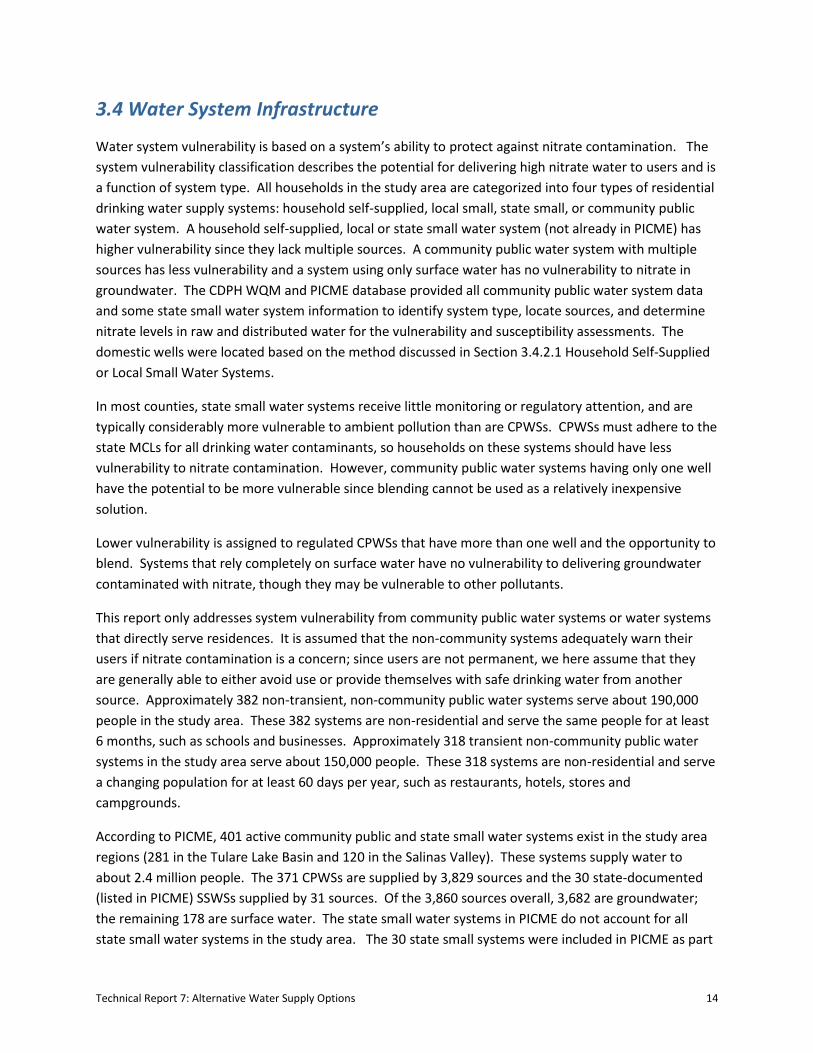
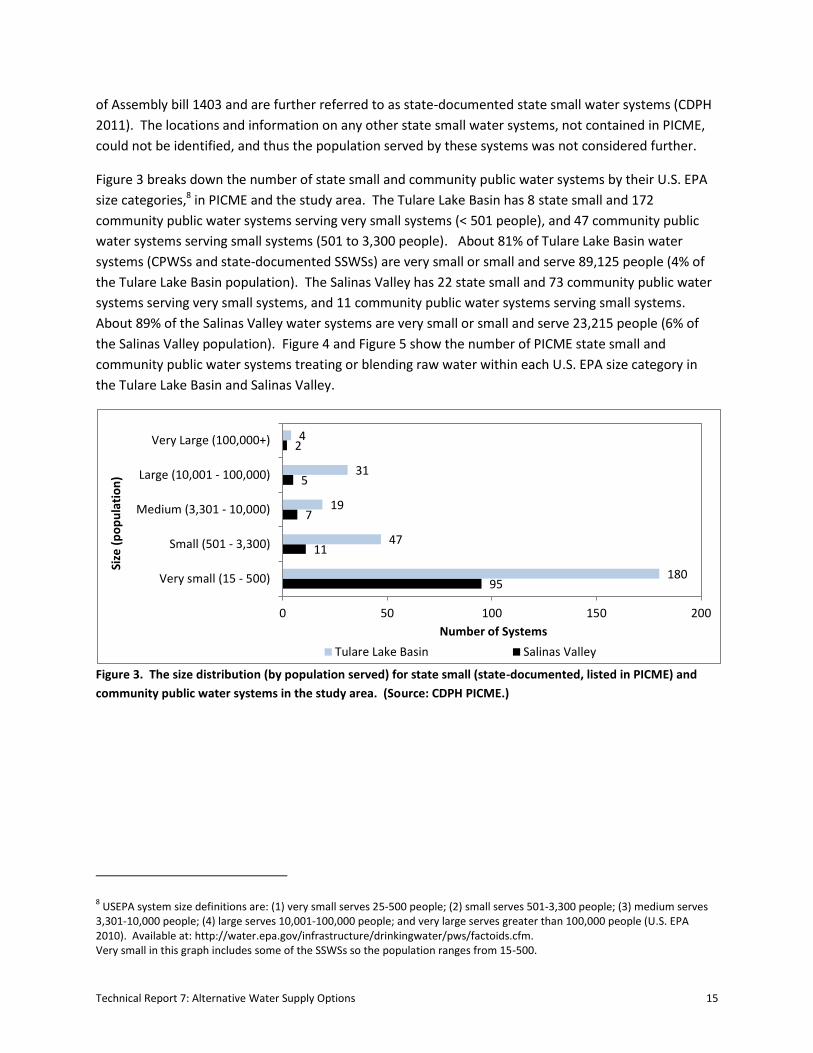
the Salinas Valley population). Figure 4 and Figure 5 show the number of PICME state small and
community public water systems treating or blending raw water within each U.S. EPA size category in
the Tulare Lake Basin and Salinas Valley.
Figure 3. The size distribution (by population served) for state small (state-documented, listed in PICME) and
community public water systems in the study area. (Source: CDPH PICME.)
8 USEPA system size definitions are: (1) very small serves 25-500 people; (2) small serves 501-3,300 people; (3) medium serves
3,301-10,000 people; (4) large serves 10,001-100,000 people; and very large serves greater than 100,000 people (U.S. EPA 2010). Available at: http://water.epa.gov/infrastructure/drinkingwater/pws/factoids.cfm. Very small in this graph includes some of the SSWSs so the population ranges from 15-500.
95
11
7
5
2
180
47
19
31
4
0 50 100 150 200
Very small (15 - 500)
Small (501 - 3,300)
Medium (3,301 - 10,000)
Large (10,001 - 100,000)
Very Large (100,000+)
Number of Systems
Size
(p
op
ula
tio
n)
Tulare Lake Basin Salinas Valley
Technical Report 7: Alternative Water Supply Options 16
Figure 4. State small (state-documented) and community public water systems treating or not treating for
nitrate in the Tulare Lake Basin. (Source: CDPH PICME and Technical Report 6, Section 5.2, Jensen et al. 2012.)
Figure 5. State small (state-documented) and community public water systems treating or not treating for
nitrate in the Salinas Valley. (Source: CDPH PICME and Technical Report 6, Section 5.2, Jensen et al. 2012.)
3.4.1 Low System Vulnerability
Theoretically, a CPWS should not deliver water exceeding the nitrate MCL since they must adhere to the
SDWA standards (see Section 3.5.1 Highly Susceptible ). Where possible, high-nitrate sources can be
blended with low-nitrate sources to reduce delivered nitrate levels to a compliant level (although daily
monitoring and operations may not always identify an exceedance). Because of the strict regulations
and guidelines and the availability of alternate sources, CPWSs with more than one well are considered
to have lower system vulnerability.
178
45
19
28
3
2
2
0
3
1
0 50 100 150 200
Very small (15 - 500)
Small (501 - 3,300)
Medium (3,301 - 10,000)
Large (10,001 - 100,000)
Very Large (100,000+)
Number of Systems
Size
(p
op
ula
tio
n)
Systems Not Treating or Blending Systems Treating or Blending
92
11
6
5
1
3
0
1
0
1
0 10 20 30 40 50 60 70 80 90 100
Very small (15 - 500)
Small (501 - 3,300)
Medium (3,301 - 10,000)
Large (10,001 - 100,000)
Very Large (100,000+)
Number of Systems
Size
(p
op
ula
tio
n)
Systems Not Treating or Blending Systems Treating or Blending
Technical Report 7: Alternative Water Supply Options 17
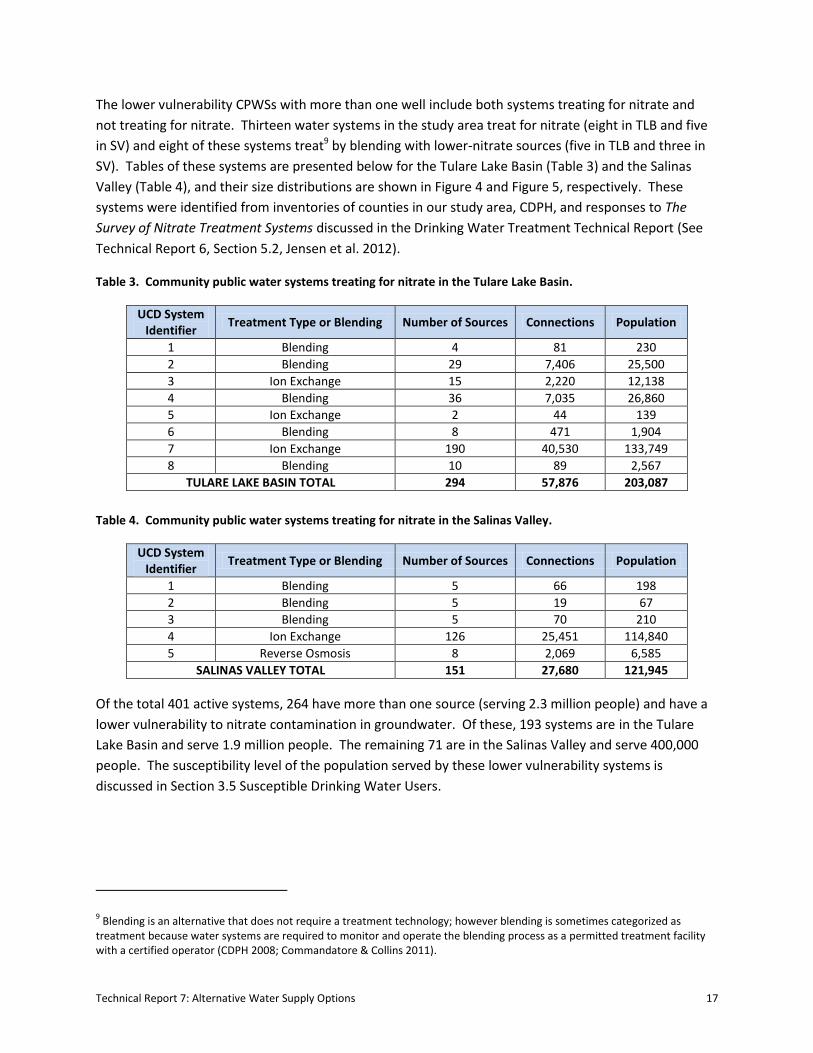
The lower vulnerability CPWSs with more than one well include both systems treating for nitrate and
not treating for nitrate. Thirteen water systems in the study area treat for nitrate (eight in TLB and five
in SV) and eight of these systems treat9 by blending with lower-nitrate sources (five in TLB and three in
SV). Tables of these systems are presented below for the Tulare Lake Basin (Table 3) and the Salinas
Valley (Table 4), and their size distributions are shown in Figure 4 and Figure 5, respectively. These
systems were identified from inventories of counties in our study area, CDPH, and responses to The
Survey of Nitrate Treatment Systems discussed in the Drinking Water Treatment Technical Report (See
Technical Report 6, Section 5.2, Jensen et al. 2012).
Table 3. Community public water systems treating for nitrate in the Tulare Lake Basin.
UCD System Identifier
Treatment Type or Blending Number of Sources Connections Population
1 Blending 4 81 230
2 Blending 29 7,406 25,500
3 Ion Exchange 15 2,220 12,138
4 Blending 36 7,035 26,860
5 Ion Exchange 2 44 139
6 Blending 8 471 1,904
7 Ion Exchange 190 40,530 133,749
8 Blending 10 89 2,567
TULARE LAKE BASIN TOTAL 294 57,876 203,087
Table 4. Community public water systems treating for nitrate in the Salinas Valley.
UCD System Identifier
Treatment Type or Blending Number of Sources Connections Population
1 Blending 5 66 198
2 Blending 5 19 67
3 Blending 5 70 210
4 Ion Exchange 126 25,451 114,840
5 Reverse Osmosis 8 2,069 6,585
SALINAS VALLEY TOTAL 151 27,680 121,945
Of the total 401 active systems, 264 have more than one source (serving 2.3 million people) and have a
lower vulnerability to nitrate contamination in groundwater. Of these, 193 systems are in the Tulare
Lake Basin and serve 1.9 million people. The remaining 71 are in the Salinas Valley and serve 400,000
people. The susceptibility level of the population served by these lower vulnerability systems is
discussed in Section 3.5 Susceptible Drinking Water Users.
9 Blending is an alternative that does not require a treatment technology; however blending is sometimes categorized as
treatment because water systems are required to monitor and operate the blending process as a permitted treatment facility with a certified operator (CDPH 2008; Commandatore & Collins 2011).
Technical Report 7: Alternative Water Supply Options 18
3.4.2 High System Vulnerability
In addition to CPWSs with just one well source, households not served by a state-regulated CPWS, are
considered highly vulnerable because county-regulated systems and individual household wells are
usually neither monitored nor treated. If the groundwater source for these households experienced an
increase in nitrate levels (above existing elevated anthropogenic levels), these households would not be
protected from nitrate contamination. The systems with high system vulnerability are:
1) Household Self-Supplied or Local Small Water Systems (see Section 3.4.2.1) 2) Community Public or State small Water Systems with Only One Well (see Section 3.4.2.2).
3.4.2.1 Household Self-Supplied or Local Small Water Systems
The 1990 and 2010 Census spatial data, DWR land use class designation, and land parcel use code
information were used to estimate the current 2010 population on household self-supplied or local
small water systems and their approximate geographic locations.
Department of Water Resources (DWR) land use class designations and land parcel use codes were the
key data sets used in this analysis. The number of dwelling units affiliated with each parcel was used to
develop self-supplied household population estimates, while the parcel locations were used to estimate
groundwater nitrate quality for residential susceptibility. It was assumed that 3.3 people reside at one
dwelling unit, and parcels with four or fewer dwelling units (dus) were considered self-supplied (1-2 dus)
or local small (3-4 dus) water systems. Residential parcels within city limits or water system boundaries
were excluded from the count of self-supplied households.
Unlike more recent census data, the 1990 Census asked a sample population about their water systems.
These data were collected at the household level and summarized in Attribute H23 of the 1990 Census.10
Census block groups (for which data are reported) tend to be of small area in urban regions, but
relatively large in rural regions so land use parcel code data was used in these areas for estimating self-
supplied household and local small water system densities. We then compared the 2010 self-supplied
household estimates to the 1990 Census block group numbers. The self-supplied and local small water
system population found from parcel use codes and DWR land use designation is shown in Table 5.
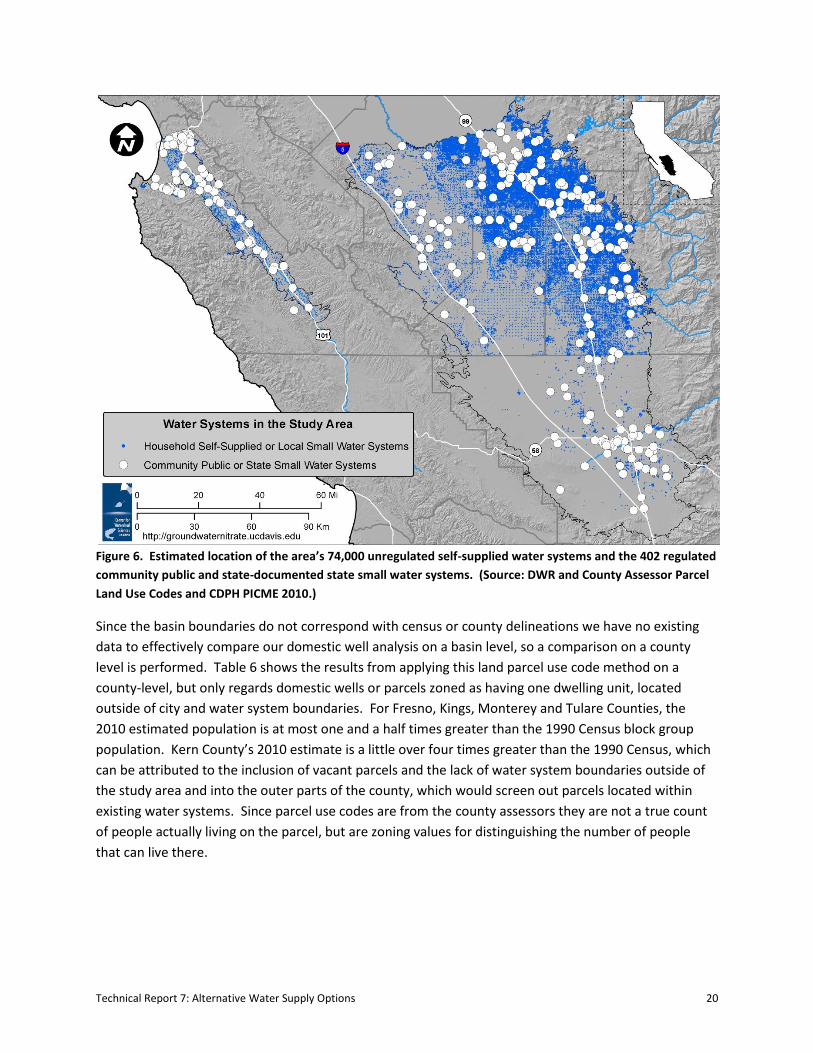
The estimated location of these household self-supplied and local small water systems is shown in
Figure 6, along with the area’s community public and state-documented state small water systems from
PICME. The total number of domestic wells in the study area portion of Kern County was difficult to
accurately estimate as its parcel use code zoning differs from the other counties. In Kern County more
parcels are zoned as having 100 plus dwelling units (i.e., apartment complexes and condominiums) than
10 Per the 1990 Census definitions, a source that supplies water to five or more housing units is considered a “Public system or
private company.” This includes any wells that supply water to five or more housing units. If the source serves four or fewer housing units, it is classified as: an “Individual drilled well,” an “Individual dug well,” or “Some other source.” The last distinction, “Some other source,” includes springs, creeks, rivers, lakes, cisterns, etc. (US Census Bureau 1999).
Technical Report 7: Alternative Water Supply Options 19
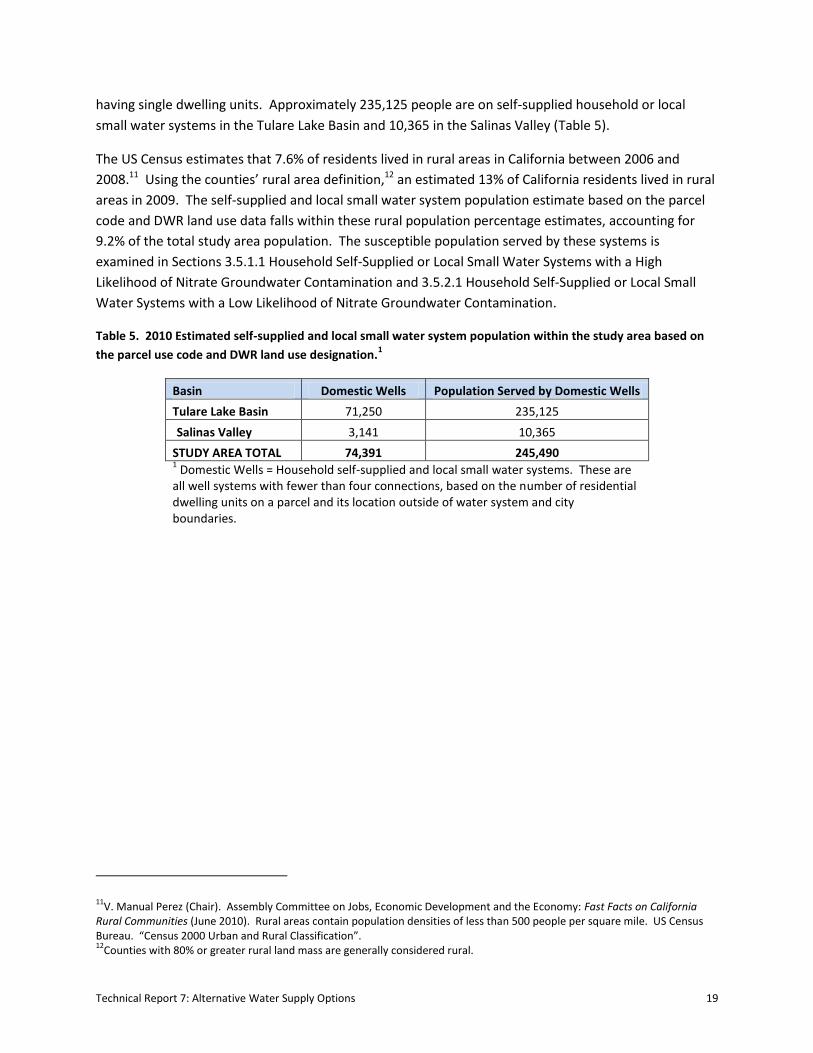
having single dwelling units. Approximately 235,125 people are on self-supplied household or local
small water systems in the Tulare Lake Basin and 10,365 in the Salinas Valley (Table 5).
The US Census estimates that 7.6% of residents lived in rural areas in California between 2006 and
2008.11 Using the counties’ rural area definition,12 an estimated 13% of California residents lived in rural
areas in 2009. The self-supplied and local small water system population estimate based on the parcel
code and DWR land use data falls within these rural population percentage estimates, accounting for
9.2% of the total study area population. The susceptible population served by these systems is
examined in Sections 3.5.1.1 Household Self-Supplied or Local Small Water Systems with a High
Likelihood of Nitrate Groundwater Contamination and 3.5.2.1 Household Self-Supplied or Local Small
Water Systems with a Low Likelihood of Nitrate Groundwater Contamination.
Table 5. 2010 Estimated self-supplied and local small water system population within the study area based on
the parcel use code and DWR land use designation.1
Basin Domestic Wells Population Served by Domestic Wells
Tulare Lake Basin 71,250 235,125
Salinas Valley 3,141 10,365
STUDY AREA TOTAL 74,391 245,490 1 Domestic Wells = Household self-supplied and local small water systems. These are
all well systems with fewer than four connections, based on the number of residential dwelling units on a parcel and its location outside of water system and city boundaries.
11V. Manual Perez (Chair). Assembly Committee on Jobs, Economic Development and the Economy: Fast Facts on California
Rural Communities (June 2010). Rural areas contain population densities of less than 500 people per square mile. US Census Bureau. “Census 2000 Urban and Rural Classification”. 12
Counties with 80% or greater rural land mass are generally considered rural.
Technical Report 7: Alternative Water Supply Options 20
Figure 6. Estimated location of the area’s 74,000 unregulated self-supplied water systems and the 402 regulated
community public and state-documented state small water systems. (Source: DWR and County Assessor Parcel
Land Use Codes and CDPH PICME 2010.)
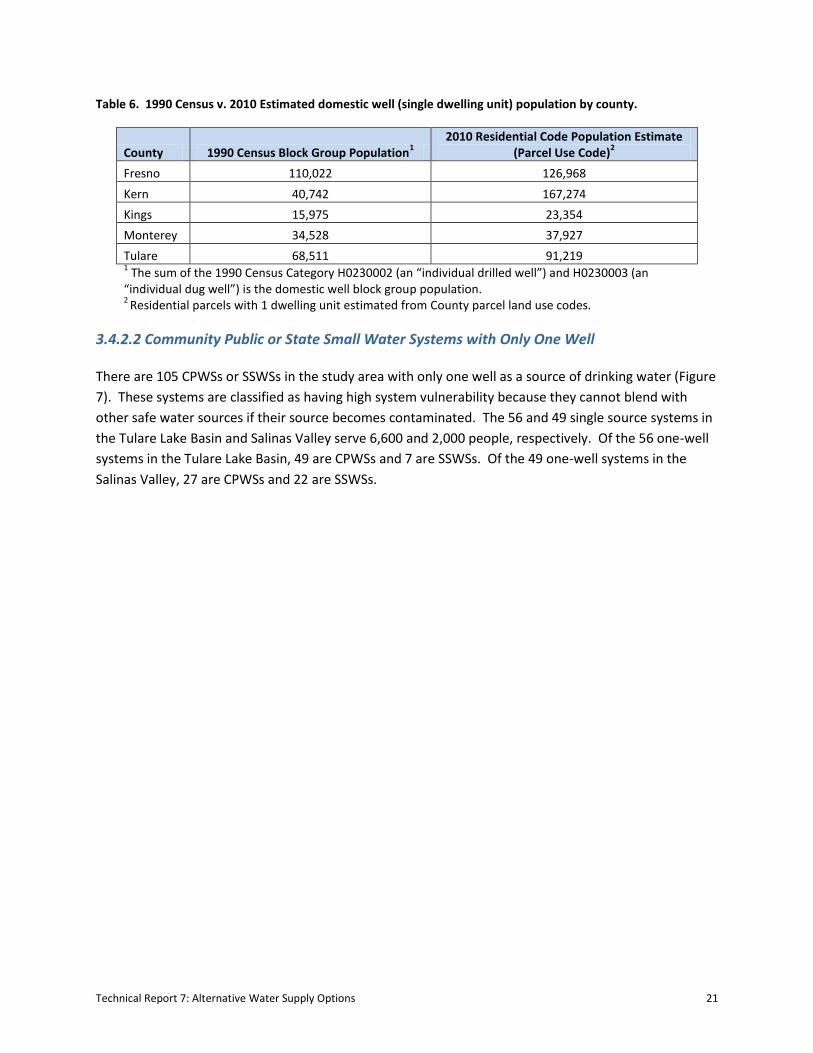
Since the basin boundaries do not correspond with census or county delineations we have no existing
data to effectively compare our domestic well analysis on a basin level, so a comparison on a county
level is performed. Table 6 shows the results from applying this land parcel use code method on a
county-level, but only regards domestic wells or parcels zoned as having one dwelling unit, located
outside of city and water system boundaries. For Fresno, Kings, Monterey and Tulare Counties, the
2010 estimated population is at most one and a half times greater than the 1990 Census block group
population. Kern County’s 2010 estimate is a little over four times greater than the 1990 Census, which
can be attributed to the inclusion of vacant parcels and the lack of water system boundaries outside of
the study area and into the outer parts of the county, which would screen out parcels located within
existing water systems. Since parcel use codes are from the county assessors they are not a true count
of people actually living on the parcel, but are zoning values for distinguishing the number of people
that can live there.
Technical Report 7: Alternative Water Supply Options 21
Table 6. 1990 Census v. 2010 Estimated domestic well (single dwelling unit) population by county.
County 1990 Census Block Group Population1
2010 Residential Code Population Estimate (Parcel Use Code)
2
Fresno 110,022 126,968
Kern 40,742 167,274
Kings 15,975 23,354
Monterey 34,528 37,927
Tulare 68,511 91,219 1 The sum of the 1990 Census Category H0230002 (an “individual drilled well”) and H0230003 (an
“individual dug well”) is the domestic well block group population. 2
Residential parcels with 1 dwelling unit estimated from County parcel land use codes.
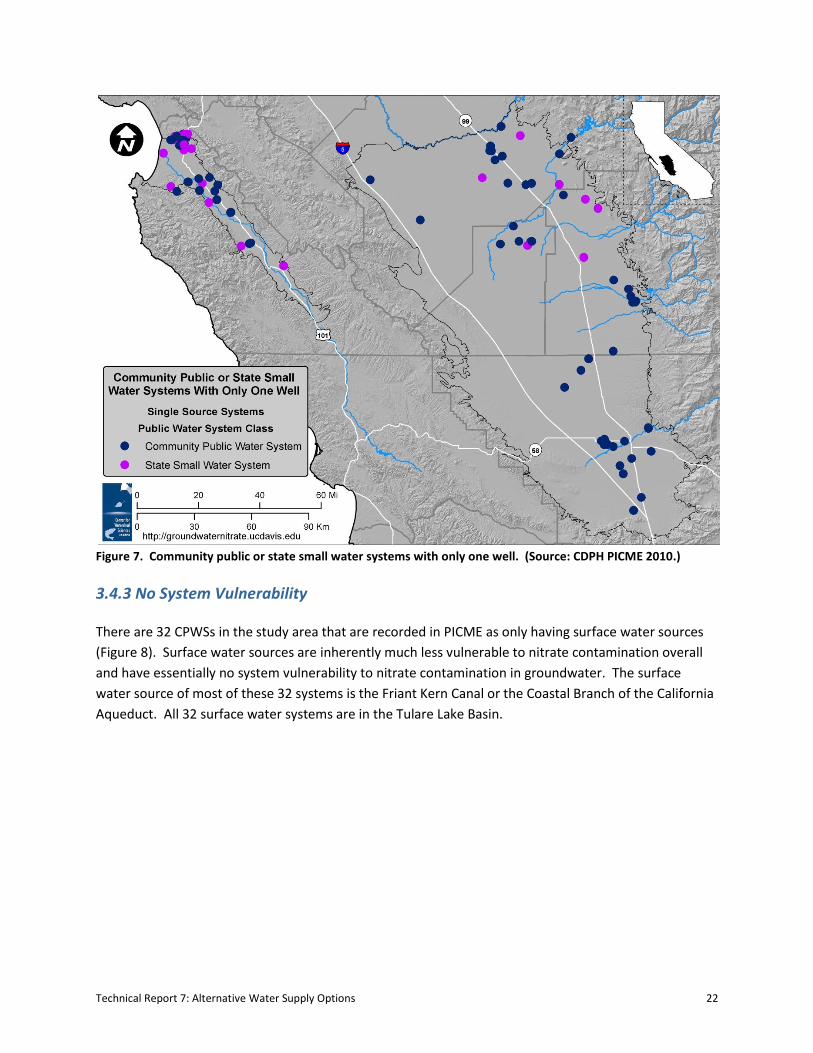
3.4.2.2 Community Public or State Small Water Systems with Only One Well
There are 105 CPWSs or SSWSs in the study area with only one well as a source of drinking water (Figure
7). These systems are classified as having high system vulnerability because they cannot blend with
other safe water sources if their source becomes contaminated. The 56 and 49 single source systems in
the Tulare Lake Basin and Salinas Valley serve 6,600 and 2,000 people, respectively. Of the 56 one-well
systems in the Tulare Lake Basin, 49 are CPWSs and 7 are SSWSs. Of the 49 one-well systems in the
Salinas Valley, 27 are CPWSs and 22 are SSWSs.
Technical Report 7: Alternative Water Supply Options 22
Figure 7. Community public or state small water systems with only one well. (Source: CDPH PICME 2010.)
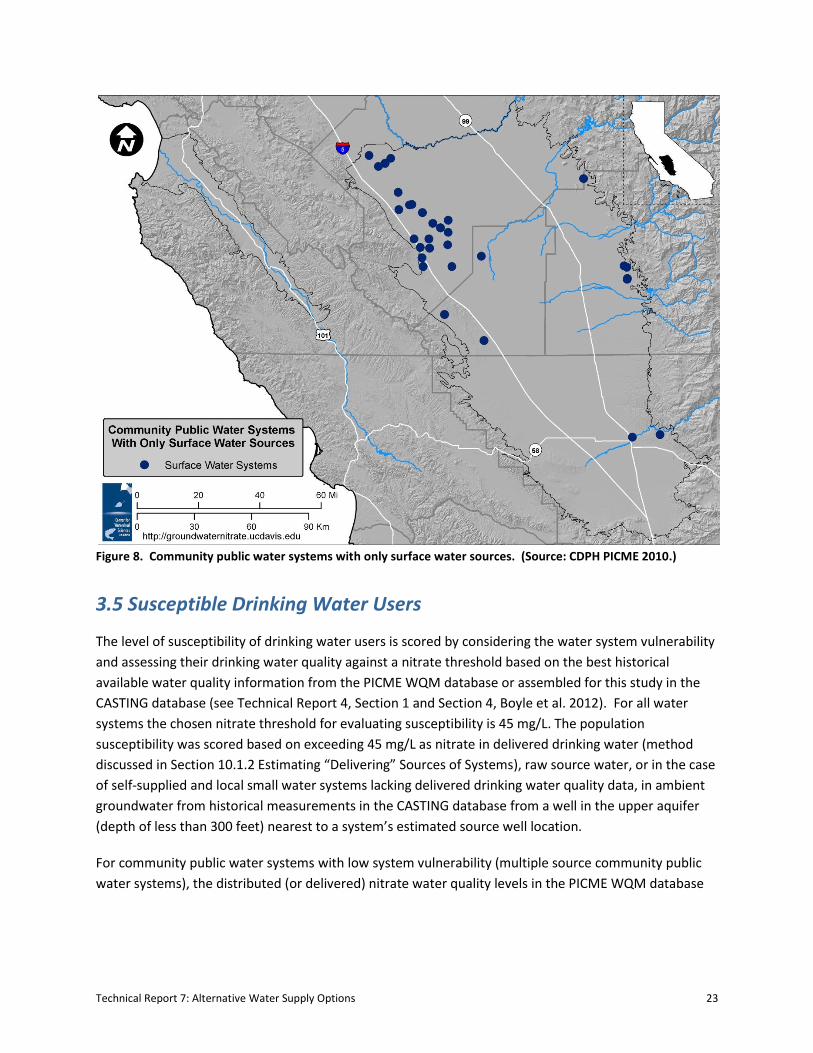
3.4.3 No System Vulnerability
There are 32 CPWSs in the study area that are recorded in PICME as only having surface water sources
(Figure 8). Surface water sources are inherently much less vulnerable to nitrate contamination overall
and have essentially no system vulnerability to nitrate contamination in groundwater. The surface
water source of most of these 32 systems is the Friant Kern Canal or the Coastal Branch of the California
Aqueduct. All 32 surface water systems are in the Tulare Lake Basin.
Technical Report 7: Alternative Water Supply Options 23
Figure 8. Community public water systems with only surface water sources. (Source: CDPH PICME 2010.)
3.5 Susceptible Drinking Water Users
The level of susceptibility of drinking water users is scored by considering the water system vulnerability
and assessing their drinking water quality against a nitrate threshold based on the best historical
available water quality information from the PICME WQM database or assembled for this study in the
CASTING database (see Technical Report 4, Section 1 and Section 4, Boyle et al. 2012). For all water
systems the chosen nitrate threshold for evaluating susceptibility is 45 mg/L. The population
susceptibility was scored based on exceeding 45 mg/L as nitrate in delivered drinking water (method
discussed in Section 10.1.2 Estimating “Delivering” Sources of Systems), raw source water, or in the case
of self-supplied and local small water systems lacking delivered drinking water quality data, in ambient
groundwater from historical measurements in the CASTING database from a well in the upper aquifer
(depth of less than 300 feet) nearest to a system’s estimated source well location.
For community public water systems with low system vulnerability (multiple source community public
water systems), the distributed (or delivered) nitrate water quality levels in the PICME WQM database
Technical Report 7: Alternative Water Supply Options 24
were used.13 If the distributed water for a water system was in excess of 45 mg/L as nitrate at least once
from 2006 to 2010, the population served by that water system was classified as having high
susceptibility. The population served by systems recorded as distributing drinking water less than 45
mg/L was classified as having low susceptibility. The population served by community or state small
water systems with no nitrate water quality data was determined as having an unknown susceptibility,
but is included in the total highly susceptible population estimate. For the single source community
public and state small water systems (higher vulnerability systems) the raw water quality data from
WQM was used to estimate whether or not the system exceeded 45 mg/L as nitrate. For the local small
and self-supplied household water systems without nitrate data (higher vulnerability systems), the
highest nitrate level in the nearest well (from the CASTING database) was used to estimate whether or
not the source exceeded 45 mg/L. The locations of state small water systems that are not accounted for
in PICME could not be identified, and so their population of consumers is not considered in this analysis.
An estimated 105 state small water systems are located in Tulare and Kern County alone, but there is
uncertainty in the total number of state small water systems within the study area.
3.5.1 Highly Susceptible Population
Household self-supplied, local small, state small and community public water systems that have recently
exceeded 45 mg/L as nitrate at least once using the relevant water quality data source, are defined as
high susceptibility systems. Population considered to be highly susceptible is served by water systems
with the following water quality records:
1) Household self-supplied or local small water systems in sub-areas characterized in the CASTING database as having a nitrate concentration in excess of 45 mg/L in shallow (<300 feet) groundwater (see Section 3.5.1.1 Household Self-Supplied or Local Small Water Systems with a High Likelihood of Nitrate Groundwater Contamination)
2) Community public and state small water systems with only one well and that have PICME WQM records of at least one raw source water in excess of 45 mg/L as nitrate since 2006 or lack water quality data (see Section 3.5.1.2 Community Public and State Small Water Systems with Only One Source and Reported Raw Water Nitrate Record in Excess of 45 mg/L or No Water Quality Data)
3) Community public water systems with more than one well and have PICME WQM records of at least one delivered water record in excess of 45 mg/L as nitrate since 2006 (see Section 3.5.1.3 Community Public Water Systems with Reported Delivered Water Nitrate )
For comparison with item 3, community public water systems that have violated the nitrate MCL at least once from 2004 to 2008 are discussed in Section 3.5.1.4 High Susceptibility Community Public Water Systems Evaluated as Violation (versus Exceedance). The difference between an exceedance and a violation is discussed in Section 3.5.1.4 High Susceptibility Community Public Water Systems Evaluated as Violation (versus Exceedance).
13 The method used for estimating the distributed (or delivered) nitrate water quality levels in the PICME WQM database is
discussed further in Section 10.1.2.
Technical Report 7: Alternative Water Supply Options 25
3.5.1.1 Household Self-Supplied or Local Small Water Systems with a High Likelihood of
Nitrate Groundwater Contamination
All groundwater wells with nitrate water quality data within the study area were compiled into a
comprehensive wells database (“CASTING”) that includes nitrate concentrations from 1989 to 2010.14
Information from the CASTING database was used to evaluate the likelihood of a household self-
supplied or local small water system being at risk of nitrate contamination. Each well within the
database less than 300 feet15 in depth was used to geographically seed the creation of a Thiessen
polygon or proximal zone. Thiessen polygons represent areas where any location within the polygon is
closer to its associated centroid well than any other well (ESRI 2010). Since the true raw source water
quality in most of the domestic and local small wells is unknown, the nearest CASTING raw well water
quality datum is used to determine whether a self-supplied or local small water system source was likely
to be above or below 45 mg/L. The well of a self-supplied or local small system, based on the parcel
location, is assumed to have a high likelihood of contamination if the centroid of the parcel is within a
Thiessen polygon whose CASTING well nitrate water quality data includes a maximum nitrate
concentration value greater than 45 mg/L. The population served by that system is given a high
susceptibility rating. Alternatively, a self-supplied or local small water system well is assumed to have a
low likelihood of contamination if it is within a Thiessen polygon with CASTING groundwater nitrate
concentrations less than or equal to 45 mg/L. The population served by that system is given a low
susceptibility rating. This method does not account for the direction of groundwater flow and the actual
nitrate concentrations at the true well depth, but provides a reasonable approach to estimate the
domestic well and local small water system users potentially at risk of drinking nitrate contaminated
water on a geographic basis.
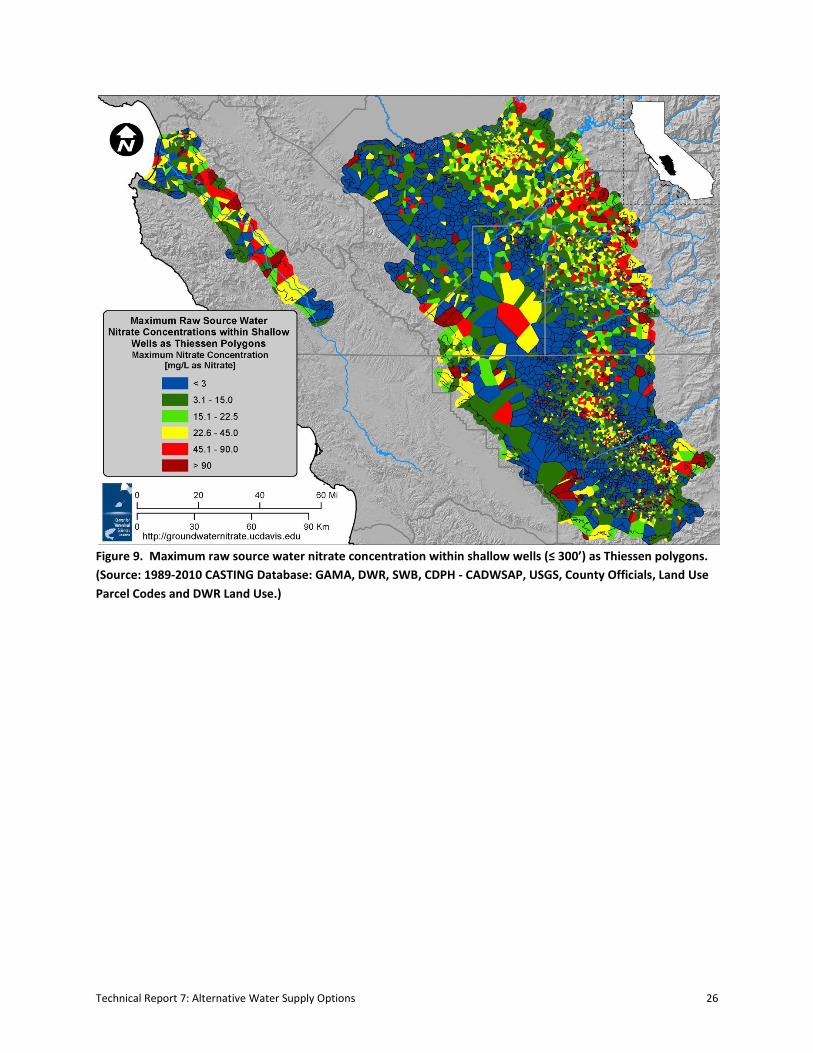
Figure 9 shows the maximum raw source water nitrate concentration from 1989 to 2010 in all wells in
the CASTING database less than 300 feet deep. Household self-supplied or local small water systems
with a high likelihood of current nitrate groundwater contamination and considered highly susceptible
are systems within a Thiessen polygon with a raw water nitrate concentration in excess of 45 mg/L.
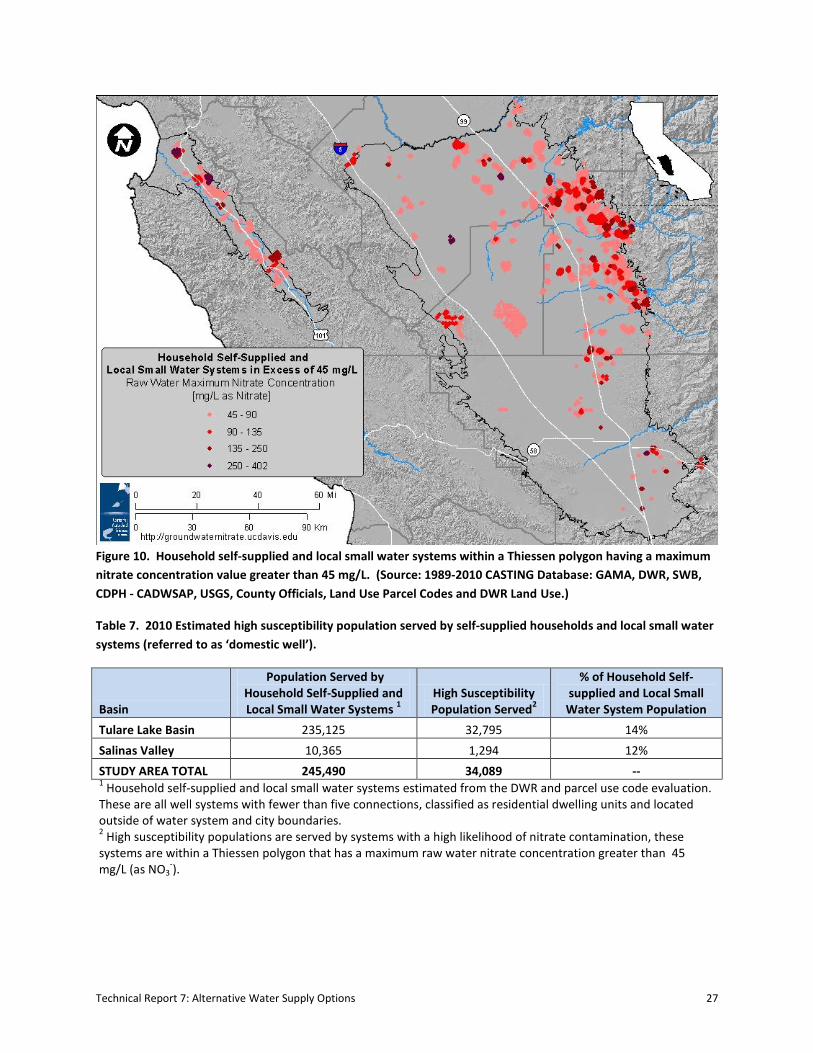
Figure 10 shows all estimated household self-supplied and local small water systems within high
susceptibility Thiessen polygons.
Table 7 provides the highly susceptible population estimated to be served by self-supplied or local small
water systems with nitrate in excess of 45 mg/L. Approximately 34,000 people are highly susceptible.
14 UC Davis CASTING wells database, refer to Technical Report 4 (Boyle et al. 2012) for detailed information on compilation.
15 Assumed as the average depth for household self-supplied wells.
Technical Report 7: Alternative Water Supply Options 26
Figure 9. Maximum raw source water nitrate concentration within shallow wells (≤ 300’) as Thiessen polygons.
(Source: 1989-2010 CASTING Database: GAMA, DWR, SWB, CDPH - CADWSAP, USGS, County Officials, Land Use
Parcel Codes and DWR Land Use.)
Technical Report 7: Alternative Water Supply Options 27
Figure 10. Household self-supplied and local small water systems within a Thiessen polygon having a maximum
nitrate concentration value greater than 45 mg/L. (Source: 1989-2010 CASTING Database: GAMA, DWR, SWB,
CDPH - CADWSAP, USGS, County Officials, Land Use Parcel Codes and DWR Land Use.)
Table 7. 2010 Estimated high susceptibility population served by self-supplied households and local small water
systems (referred to as ‘domestic well’).
Basin
Population Served by Household Self-Supplied and Local Small Water Systems
1 High Susceptibility Population Served
2
% of Household Self-supplied and Local Small
Water System Population
Tulare Lake Basin 235,125 32,795 14%
Salinas Valley 10,365 1,294 12%
STUDY AREA TOTAL 245,490 34,089 -- 1 Household self-supplied and local small water systems estimated from the DWR and parcel use code evaluation.
These are all well systems with fewer than five connections, classified as residential dwelling units and located outside of water system and city boundaries. 2 High susceptibility populations are served by systems with a high likelihood of nitrate contamination, these
systems are within a Thiessen polygon that has a maximum raw water nitrate concentration greater than 45 mg/L (as NO3
-).
Technical Report 7: Alternative Water Supply Options 28
3.5.1.2 Community Public and State Small Water Systems with Only One Source and Reported
Raw Water Nitrate Record in Excess of 45 mg/L or No Water Quality Data
The highly susceptible population served by active community public and state small water systems
listed in PICME that have only one source is defined as either:
1) have PICME WQM raw source water data in excess of 45 mg/L for nitrate since 2006, or 2) are lacking water quality data.
Of 105 single source systems in the study area, 34 have exceeded 45 mg/L (having a high likelihood of
nitrate in groundwater) and are therefore classified as highly susceptible; the population served by
these systems is listed in Table 8. If applicable, the highest recorded nitrate measurement per system
was used to create conservative estimates. The 3,400 people served by these 34 systems are included in
the high susceptibility estimate.
Table 8. Single source systems with a high likelihood of nitrate in groundwater.
Basin Highly Susceptible Population
1
Single Source CPWSs or SSWSs that serve Highly Susceptible Population
2
Tulare Lake Basin 2,424 15
Salinas Valley 1,000 19
STUDY AREA TOTAL 3,424 34 1 The highly susceptible population served by single source community public or
state small water systems with no nitrate concentration data or systems with raw source water in excess of 45 mg/L (as nitrate) (WQM 2010). 2 The single source systems that serve the highly susceptible population (PICME
2010).
3.5.1.3 Community Public Water Systems with Reported Delivered Water Nitrate in Excess of
45 mg/L
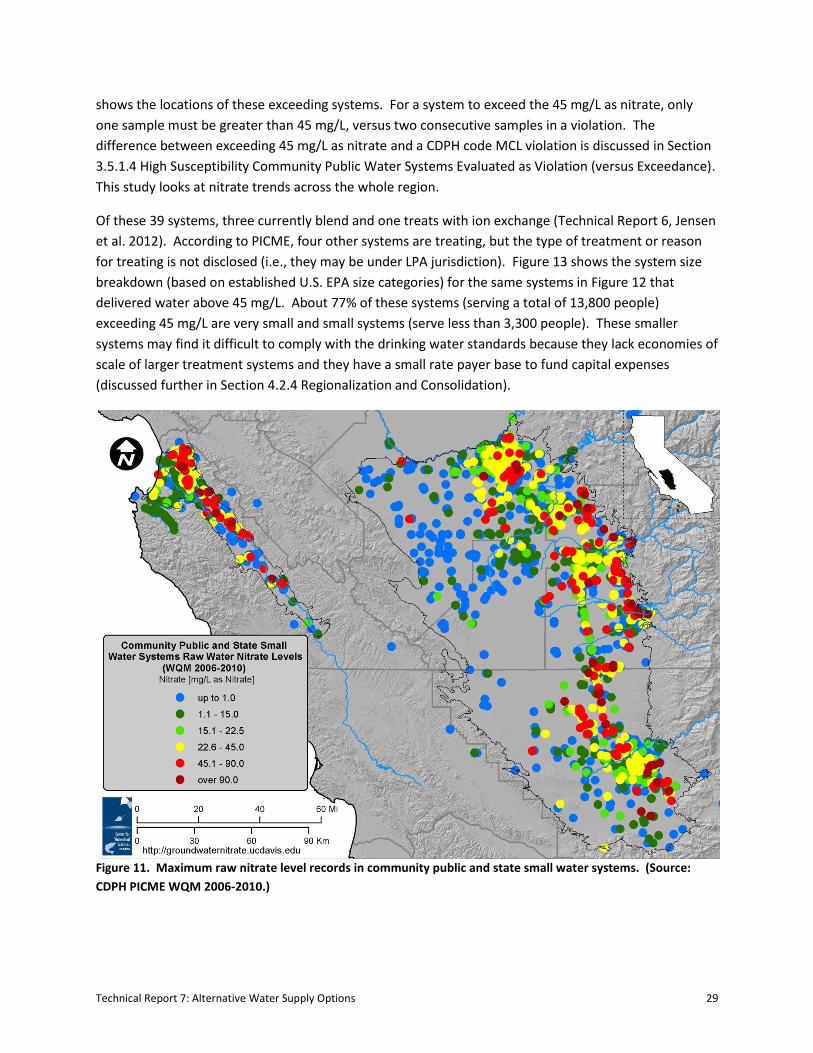
The maximum nitrate measurement in WQM for each community public and state small water system
source in PICME within the study area was mapped. These measurements were taken between January
1st , 2006 and July 13th, 2010. Figure 11 shows a map of WQM raw nitrate data from all sources in the
study area and provides an indication of raw nitrate levels in regulated drinking water systems.
To estimate the high susceptibility population served by low vulnerability systems, all active and pending
CPWSs and SSWSs (with multiple sources) within CDPH’s WQM database were evaluated to determine
delivered water nitrate levels. Approximately 15% of the 264 Active/Pending and Community
Public/State Small Water Systems (with multiple sources) in the study area delivered water that in
excess of 45 mg/L at least once from January 1st, 2006 to July 13th, 2010 (see Figure 12). The method
used for identifying the “delivering” source of a system is discussed in the Appendix (Section 10.1.2
Estimating “Delivering” Sources of a System). This includes 39 systems serving 670,000 people (35% of
the entire population being served by CPWSs/SSWSs) and suggests potential consumption of water with
nitrate levels exceeding the public health standards for an undetermined amount of time. Figure 12
Technical Report 7: Alternative Water Supply Options 29
shows the locations of these exceeding systems. For a system to exceed the 45 mg/L as nitrate, only
one sample must be greater than 45 mg/L, versus two consecutive samples in a violation. The
difference between exceeding 45 mg/L as nitrate and a CDPH code MCL violation is discussed in Section
3.5.1.4 High Susceptibility Community Public Water Systems Evaluated as Violation (versus Exceedance).
This study looks at nitrate trends across the whole region.
Of these 39 systems, three currently blend and one treats with ion exchange (Technical Report 6, Jensen
et al. 2012). According to PICME, four other systems are treating, but the type of treatment or reason
for treating is not disclosed (i.e., they may be under LPA jurisdiction). Figure 13 shows the system size
breakdown (based on established U.S. EPA size categories) for the same systems in Figure 12 that
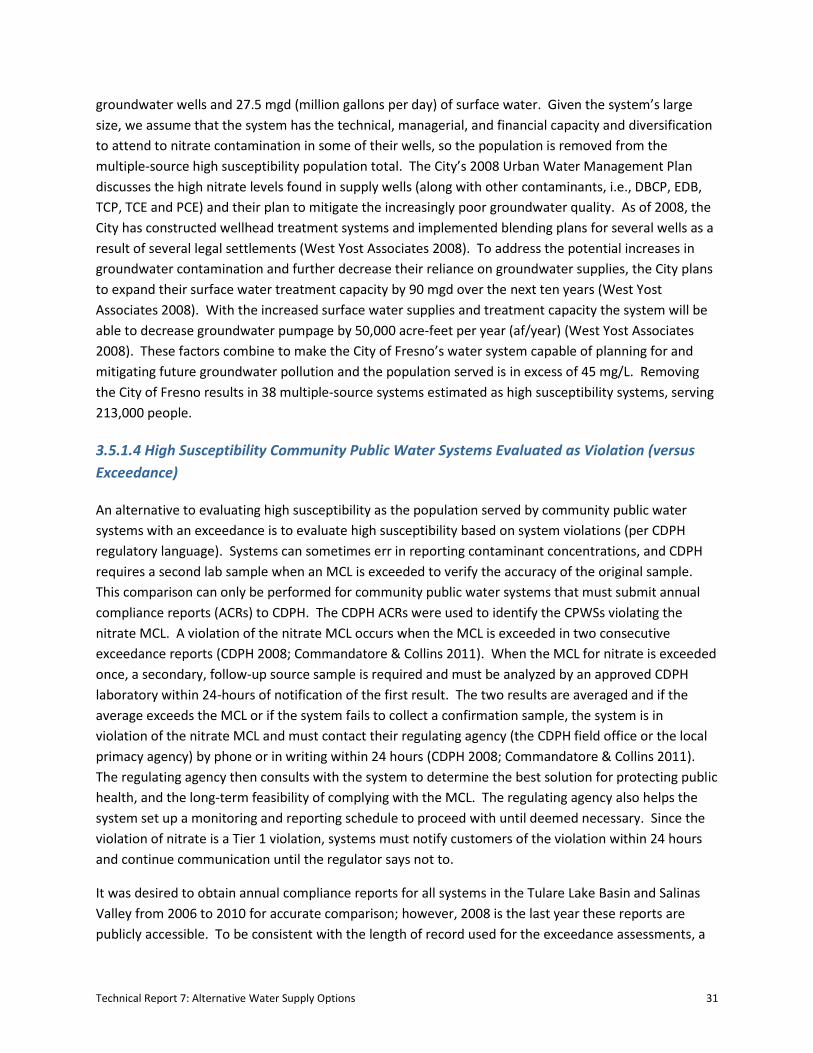
delivered water above 45 mg/L. About 77% of these systems (serving a total of 13,800 people)
exceeding 45 mg/L are very small and small systems (serve less than 3,300 people). These smaller
systems may find it difficult to comply with the drinking water standards because they lack economies of
scale of larger treatment systems and they have a small rate payer base to fund capital expenses
(discussed further in Section 4.2.4 Regionalization and Consolidation).
Figure 11. Maximum raw nitrate level records in community public and state small water systems. (Source:
CDPH PICME WQM 2006-2010.)
Technical Report 7: Alternative Water Supply Options 30
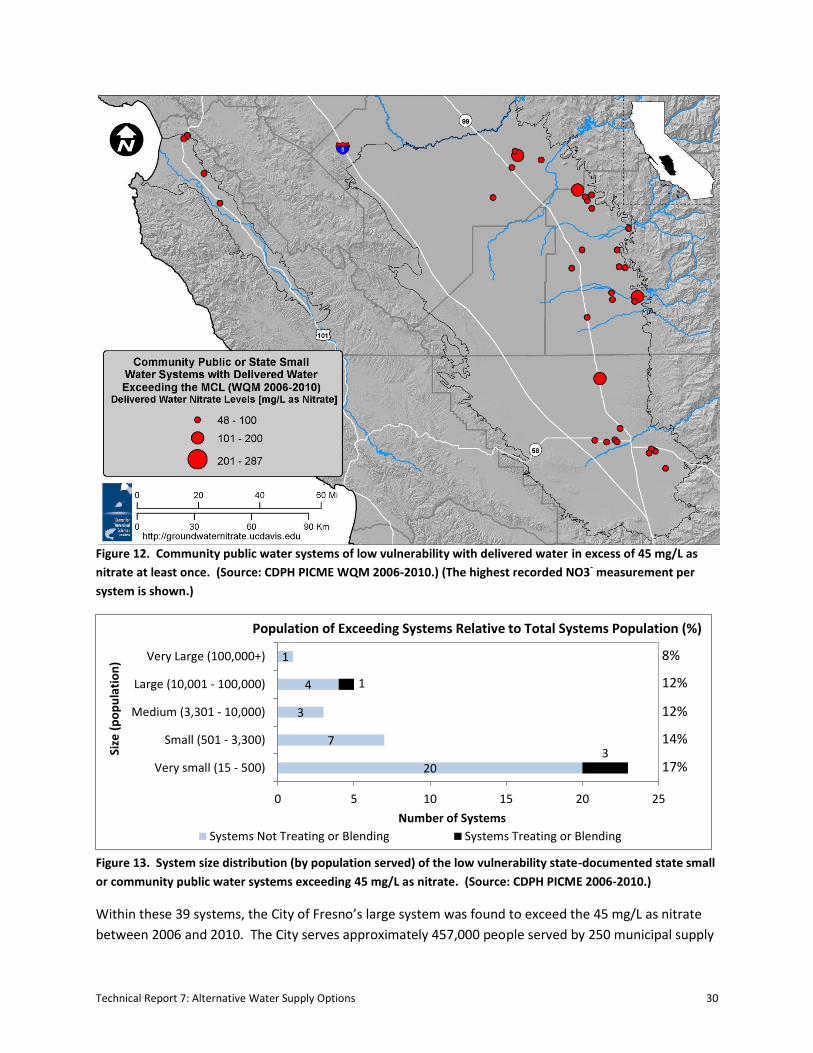
Figure 12. Community public water systems of low vulnerability with delivered water in excess of 45 mg/L as
nitrate at least once. (Source: CDPH PICME WQM 2006-2010.) (The highest recorded NO3- measurement per
system is shown.)
Figure 13. System size distribution (by population served) of the low vulnerability state-documented state small
or community public water systems exceeding 45 mg/L as nitrate. (Source: CDPH PICME 2006-2010.)
Within these 39 systems, the City of Fresno’s large system was found to exceed the 45 mg/L as nitrate
between 2006 and 2010. The City serves approximately 457,000 people served by 250 municipal supply
20
7
3
4
1
3
1
0 5 10 15 20 25
Very small (15 - 500)
Small (501 - 3,300)
Medium (3,301 - 10,000)
Large (10,001 - 100,000)
Very Large (100,000+)
Number of Systems
Size
(p
op
ula
tio
n)
Systems Not Treating or Blending Systems Treating or Blending
Population of Exceeding Systems Relative to Total Systems Population (%)
8%
12%
12%
14%
17%
Technical Report 7: Alternative Water Supply Options 31
groundwater wells and 27.5 mgd (million gallons per day) of surface water. Given the system’s large
size, we assume that the system has the technical, managerial, and financial capacity and diversification
to attend to nitrate contamination in some of their wells, so the population is removed from the
multiple-source high susceptibility population total. The City’s 2008 Urban Water Management Plan
discusses the high nitrate levels found in supply wells (along with other contaminants, i.e., DBCP, EDB,
TCP, TCE and PCE) and their plan to mitigate the increasingly poor groundwater quality. As of 2008, the
City has constructed wellhead treatment systems and implemented blending plans for several wells as a
result of several legal settlements (West Yost Associates 2008). To address the potential increases in
groundwater contamination and further decrease their reliance on groundwater supplies, the City plans
to expand their surface water treatment capacity by 90 mgd over the next ten years (West Yost
Associates 2008). With the increased surface water supplies and treatment capacity the system will be
able to decrease groundwater pumpage by 50,000 acre-feet per year (af/year) (West Yost Associates
2008). These factors combine to make the City of Fresno’s water system capable of planning for and
mitigating future groundwater pollution and the population served is in excess of 45 mg/L. Removing
the City of Fresno results in 38 multiple-source systems estimated as high susceptibility systems, serving
213,000 people.
3.5.1.4 High Susceptibility Community Public Water Systems Evaluated as Violation (versus
Exceedance)
An alternative to evaluating high susceptibility as the population served by community public water
systems with an exceedance is to evaluate high susceptibility based on system violations (per CDPH
regulatory language). Systems can sometimes err in reporting contaminant concentrations, and CDPH
requires a second lab sample when an MCL is exceeded to verify the accuracy of the original sample.
This comparison can only be performed for community public water systems that must submit annual
compliance reports (ACRs) to CDPH. The CDPH ACRs were used to identify the CPWSs violating the
nitrate MCL. A violation of the nitrate MCL occurs when the MCL is exceeded in two consecutive
exceedance reports (CDPH 2008; Commandatore & Collins 2011). When the MCL for nitrate is exceeded
once, a secondary, follow-up source sample is required and must be analyzed by an approved CDPH
laboratory within 24-hours of notification of the first result. The two results are averaged and if the
average exceeds the MCL or if the system fails to collect a confirmation sample, the system is in
violation of the nitrate MCL and must contact their regulating agency (the CDPH field office or the local
primacy agency) by phone or in writing within 24 hours (CDPH 2008; Commandatore & Collins 2011).
The regulating agency then consults with the system to determine the best solution for protecting public
health, and the long-term feasibility of complying with the MCL. The regulating agency also helps the
system set up a monitoring and reporting schedule to proceed with until deemed necessary. Since the
violation of nitrate is a Tier 1 violation, systems must notify customers of the violation within 24 hours
and continue communication until the regulator says not to.
It was desired to obtain annual compliance reports for all systems in the Tulare Lake Basin and Salinas
Valley from 2006 to 2010 for accurate comparison; however, 2008 is the last year these reports are
publicly accessible. To be consistent with the length of record used for the exceedance assessments, a
Technical Report 7: Alternative Water Supply Options 32
five year span evaluation based on ACRs from 2004 to 2008 was used to identify community public
water systems violating the MCL. Twenty-six community public water systems (Table 9) violated the
nitrate MCL within the Tulare Lake Basin and Salinas Valley, five in Kern, eight in Monterey, thirteen in
Tulare, and zero in Kings and Fresno counties. The total population served by violating systems is about
130,000 (Table 9) and is about 83,000 people less than the total population estimated with high
susceptibility based on multiple source MCL exceedance systems in Section 3.5.1.3 Community Public
Water Systems with Reported Delivered Water Nitrate . This population difference stems from
evaluating systems based on an exceedance versus violation. For a system to violate the nitrate MCL,
the average of two consecutive samples must be greater than the MCL. For a system to exceed the
nitrate MCL, only one sample must be greater than the MCL. CDPH has established the violation
definition to avoid any discrepancy in monitoring or reporting at the system or lab level. A conservative
approach is taken here in estimating the susceptibility based on an exceedance rather than a violation.
The community public water systems in violation of the nitrate MCL are shown in Figure 14, highlighting
the total years in violation between 2004 and 2008.
Technical Report 7: Alternative Water Supply Options 33
Table 9. Community public water systems in violation of the nitrate MCL (2004-2008).
County System Number System Name Years in Violation Population
Kern
1500373 SEVENTH STANDARD MUTUAL 1 110
1500494 WILSON ROAD WATER COMMUNITY 1 72
1500544 ENOS LANE PUBLIC UTILITY DISTRICT 1 250
1500584 GOOSELAKE WATER COMPANY 1 80
1510001 ARVIN COMMUNITY SERVICES DIST 1 14,500
KERN TOTAL POPULATION 15,012
Monterey
2700665 OAK HEIGHTS W & R CO INC 2 105
2701036 APPLE AVE WS #03 1 60
2701904 SAN JERARDO COOP WS 2 249
2702409 EL CAMINO WC INC 1 90
2702439 WOODLAND HEIGHTS MWC 1 57
2702466 SAN VICENTE MWC 1 90
2710010 CPWSC SALINAS 1 111,135
2710851 SALINAS VALLEY STATE PRISON 1 5,400
MONTEREY TOTAL POPULATION 117,186
Tulare
5400523 EL MONTE VILLAGE M H P 1 100
5400550 SEVILLE WATER CO 1 400
5400567 TOOLEVILLE WATER COMPANY 3 300
5400616 LEMON COVE WATER CO 4 200
5400651 BEVERLY GRAND MUTUAL WATER 5 108
5400663 FAIRWAYS TRACT MUTUAL 5 250
5400666 WATERTEK - GRANDVIEW GARDENS 1 350
5400735 RODRIGUEZ LABOR CAMP 3 110
5400805 SOULTS MUTUAL WATER CO 3 100
5401003 EAST OROSI CSD 2 106
5401038 AKIN WATER CO 1 50
5402047 GLEANINGS FOR THE HUNGRY 5 31
5403043 YETTEM WATER SYSTEM 2 350
TULARE TOTAL POPULATION 2,455
STUDY AREA POPULATION VIOLATING THE NITRATE MCL (2004-2008) 134,653
Technical Report 7: Alternative Water Supply Options 34
Figure 14. Community public water systems in the study area in violation of the nitrate MCL 2004 to 2008.
(Source: CDPH 2010d.)
3.5.2 Low Susceptibility Population
Low susceptibility water users are on systems estimated to have a high vulnerability but with a low
likelihood of nitrate contamination in the groundwater, or on systems estimated to have a low
vulnerability (CPWSs with more than one well) with no record in excess of 45 mg/L since 2006. We
estimate that 1.67 to 1.88 million people in the study area are not currently susceptible to consumption
of nitrate-contaminated drinking water within their residences.
3.5.2.1 Household Self-Supplied or Local Small Water Systems with a Low Likelihood of Nitrate
Groundwater Contamination
Household self-supplied or local small water systems are assumed to have a low likelihood of current
nitrate groundwater contamination when they fall within a Thiessen polygon that has historical raw
water nitrate concentrations less than or equal to 45 mg/L. Figure 15 shows all estimated household
self-supplied and local small water systems within low-nitrate Thiessen polygons. Table 10 provides
population estimates for persons supplied by low susceptibility systems relative to the total basin
Technical Report 7: Alternative Water Supply Options 35
domestic well population. An estimated 212,000 people served by self-supplied household and local
small water systems are included in the low susceptibility population estimate.
Figure 15. Household self-supplied and local small water system wells within a Thiessen polygon of a tested
upper aquifer well (<300 ft) with maximum nitrate concentration less than 45 mg/L. (Source: 1989-2010
CASTING Database: GAMA, DWR, SWB, CDPH - CADWSAP, USGS, County Officials, Land Use Parcel Codes and
DWR Land Use.)
Table 10. 2010 Estimated low susceptibility population served by self-supplied household and local small water
systems.
Basin Domestic Well
Population1 Low Susceptibility Population
2 % of Domestic Well
Population
Tulare Lake Basin 235,125 202,676 86%
Salinas Valley 10,365 9,088 88%
STUDY AREA TOTAL 245,490 211,764 -- 1
Domestic Wells = Household self-supplied and local small water systems. These are all well systems with fewer than four connections, classified as residential dwelling units and located outside of water system and city boundaries. 2
The low susceptibility population served by systems with a low likelihood of nitrate contamination. These systems are within a Thiessen polygon that has a maximum raw water nitrate concentration less than or equal to 45 mg/L.
Technical Report 7: Alternative Water Supply Options 36
3.5.2.2 Community Public or State Small Water Systems with Only One Source and No
Reported Raw Water Nitrate Record in Excess of 45 mg/L
The active community public and state small water systems in PICME that have only one source (high
vulnerability) and have not exceeded 45 mg/L for nitrate since 2006 in their raw source water are
considered to have a low likelihood of nitrate in groundwater, and their users are considered to have
low susceptibility to nitrate contamination. The raw nitrate levels of these systems are measured
against the 45 mg/L as nitrate since the delivered water quality could not be estimated in PICME. Of the
105 single source systems, 71 have a low likelihood of nitrate in groundwater. The low susceptibility
population served by these single source systems is given in Table 11 and is included in the low
susceptibility estimate.
Table 11. Single source systems with a low likelihood of nitrate in groundwater.
Basin Low Susceptibility Population
1 Single Source CPWSs or SSWSs
that serve the Low Susceptibility Population
2
Tulare Lake Basin 4,234 41
Salinas Valley 1,176 30
STUDY AREA TOTAL 5,410 71 1 The low susceptibility population served by single source systems with maximum source (raw water) nitrate concentrations less than 45 mg/L (WQM 2010). 2 Single source community public or state small water systems that serve this low susceptibility
population (PICME 2010).
3.5.2.3 Community Public Water Systems with Reported Nitrate Records less than 45 mg/L
There are 212 multiple source CPWSs in the study area with recorded PICME nitrate data having no
delivered nitrate records in excess of 45 mg/L from 2006 to 2010. The population of these multiple-
source systems is given in Table 12 and is included in the low susceptibility estimate.
Table 12. Community public water systems with a low likelihood of nitrate in groundwater.
Basin Low Susceptibility Population
1
Multiple Source CPWSs that serve the Low Susceptibility Population
2
Tulare Lake Basin 1,259,724 157
Salinas Valley 405,783 55
STUDY AREA TOTAL
1,665,507 212
1 The low susceptibility population served by systems with more than one source that has
maximum delivered nitrate concentrations less than or equal to 45 mg/L (as nitrate) (WQM 2010). 2 Community public water systems with more than one source that serve this low susceptibility
population (as NO3-) (PICME 2010).
Technical Report 7: Alternative Water Supply Options 37
3.5.3 Unknown Susceptibility Population
The WQM dataset is incomplete for 13 multiple source CPWSs that are included in PICME (serving 3,900
people), and are lacking nitrate measurement data. These include three and ten systems in the Tulare
Lake Basin and Salinas Valley, serving 2,450 and 1,450 people, respectively. These systems have an
unknown water quality level, but are conservatively included in the higher susceptibility water users
total for this analysis. This report assumes the lack of nitrate data is from the absence of monitoring and
reporting, however, the data could be in the process of being incorporated into WQM. Figure 16 shows
the distribution of system sizes for the multiple source water systems with no nitrate measurement
data. Eleven of these CPWSs are county-regulated (<200 connections) and may have nitrate data within
their respective County health departments.
Figure 16. System size distribution (by population served) of the community public water systems without
water quality information. (Source: CDPH PICME WQM 2006-2010.)
3.6 Major Findings on Susceptible Water Users
The population connected to each water system type, their system’s vulnerability, and the population’s
susceptibility are summarized below.
An estimated 246,000 people are served water by self-supplied and local small water systems (about 9% of the total study area population).
o These systems are considered to have high vulnerability. o About 34,000 people, or 14% of the household self-supplied and local small water
system population, are within Thiessen polygons with a maximum nitrate concentration in excess of 45 mg/L. This population is considered to have high susceptibility.
o The remaining 212,000 people are considered to have low nitrate contamination susceptibility.
Approximately 8,800 people are served by single source state small (listed in PICME) and community public water systems (less than 1% of the study area population).
o These systems are considered to have high vulnerability.
3
1
0
10
0
0
0 2 4 6 8 10 12
Very small (25 - 500)
Small (501 - 3,300)
Medium + (3,300+)
Number of Systems
Size
(p
op
ula
tio
n)
Salinas Valley Tulare Lake Basin
Technical Report 7: Alternative Water Supply Options 38
o Approximately, 1,100 people, or 13% of the single source state small and community public water system population, are served by a system with a maximum recorded (raw source water) nitrate level in excess of 45 mg/L; hence, this population is considered highly susceptible to nitrate contamination.
o Approximately 2,350 people, or 27% of the single source state small and community public water system population, are served by a system having no recorded nitrate data, and so are considered to have high nitrate contamination susceptibility.
o The remaining 5,400 people are considered to have low susceptibility.
An estimated 2.3 million people are on multiple source community public water systems (about 88% of the study area population).
o These systems are considered to be of low vulnerability. o Approximately 213,000 people, or 29% of the multiple source community public water
system population, have a maximum recorded (delivered water) nitrate level in excess of 45 mg/L, and so have high nitrate contamination susceptibility.
o Approximately 3,900 people (less than 1% of the multiple source community public water system population), have no recorded nitrate data, and so have high nitrate contamination susceptibility.
o The remaining 1.7 million people are served by systems with no recorded nitrate levels in excess of 45 mg/L and considered to have low nitrate contamination susceptibility.
A summary of the existing susceptible water systems and the population served, overall and in each
basin, is shown in Table 13 and presented visually in Figure 17, Figure 18, and Figure 19. Figure 17
illustrates how we assessed the degree of vulnerability and overall susceptibility for the study area
population in year 2010. Figure 18 and Figure 19 show the 2010 population susceptibility assessment
for the Tulare Lake Basin and Salinas Valley, respectively.
Approximately 254,000 people have higher susceptibility (about 10% of the study area population,
which includes the unknown susceptibility population), 2.34 million have lower susceptibility (90% of the
study area population), and 64,000 have no susceptibility (2% of the study area population) to nitrate
groundwater contamination.
Finally, an important and cautionary note on the interpretation of the terms “vulnerable” water
systems and “susceptible” population. Here, we have defined these terms to provide a tractable scoring
system that allows us to estimate the potential for a water system to draw from a nitrate contaminated
well and to estimate the magnitude of the population in the study area that may be exposed to nitrate
in drinking water from that well. Our analysis does not consider whether the exposure actually occurs.
Our analysis also does not consider whether exposure occurs once, occasionally, or regularly. The
susceptibility score is merely a qualitative measure of the likelihood that a person is exposed to drinking
nitrate contaminated water at the tap at least once, but potentially more than once. We do not know
how many people in either the high susceptible population or in the low susceptible population actually
drink water that is in excess of 45 mg/L, or how often they do so.
To improve upon our very general susceptibility measure, water quality data would need to be collected
on a regular basis from all sources of drinking water, including all local and state small water systems,
and all household self-supplied systems (domestic wells). Without these data, a scoring system such as
Technical Report 7: Alternative Water Supply Options 39
the one presented here, provides the best possible practical representation of our current knowledge
and available information on nitrate exposure in drinking water in the pilot study area.
Table 13. Assessment of susceptible water users in the study area.
Population Served
System Description Susc.1
Salinas Valley
Tulare Lake Basin
Total Study Area
Total Basin Population2
397,287 2,249,928 2,647,215
Household Self-Supplied or Local Small Water Systems3
10,365 235,125 245,490
Max NO3 45 mg/L Exceedance3a
H 1,294 32,795 34,089
Max NO3 45 mg/L Non-Exceedance3b
L 9,088 202,676 211,764
Single Source State small or Community Public Water Systems4
2,176 6,658 8,834
Max NO3 45 mg/L Exceedance or No WQM Data4a
H 1,000 2,424 3,424
Max NO3 45 mg/L Non-Exceedance4b
L 1,176 4,234 5,410
Surface Water Community Public Water Systems 5
No 0 64,501 64,501
Multiple Source Community Public Water Systems6
408,123 1,931,267 2,339,390
Treating or Blending for NO37
121,945 203,087 325,032
Not Treating or Blending for NO38
286,178 1,728,180 2,014,358
Max NO3 Distributed Water 45 mg/L Exceedance9
H 894 669,101 669,995
Max NO3 Distributed Water 45 mg/L Non-Exceedance10
L 405,783 1,259,724 1,665,507
No NO3 Data11
H 1,446 2,442 3,888
TOTAL HIGHER SUSCEPTIBILITY POPULATION12
4,634 249,251 253,885
TOTAL LOWER SUSCEPTIBILITY POPULATION13
416,047 1,924,145 2,340,192
TOTAL NO SUSCEPTIBILITY POPULATION14
0 64,501 64,501 1
Susceptibility – Levels: High (H), Low (L), and No. 2
The total basin population. Estimated from US Census and California Department of Finance data, spatially verified in ArcGIS. 3
Population on household self-supplied and local small water systems estimated using Parcel Use Codes from County Assessors and DWR land use classification. Household Self-Supplied Water Systems are any residential parcels zoned as having 1-2 dwelling units, located outside of city and water system boundaries. Local Small Water Systems are any residential parcels zoned as having 3-4 dwelling units, located outside of city and water system boundaries. Assumed 3.3 people per dwelling unit. 3a
Population on household self-supplied and local small water systems located within Thiessen polygons that have a nitrate concentration greater than 45 mg/L (as NO3). Nitrate concentrations are from DWR, CDPH, USGS, SWB, and all study area counties. 3b
Population on household self-supplied and local small water systems that are located within Thiessen polygons that have a nitrate concentration less than 45 mg/L (as NO3). 4
Population on single source SSWS or CPWS from CDPH’s PICME database. 4a
Population on single source SSWS or CPWS with a maximum raw water nitrate concentration (PICME WQM, 2006-2010) greater than 45 mg/L (as NO3) or without nitrate data in WQM. 4b
Population on single source SSWS or CPWS with a maximum raw water nitrate concentration (PICME WQM, 2006-2010) less than 45 mg/L (as NO3). 5
Population on CPWSs serving only surface water sources (PICME 2006-2010). 6
Population on CPWSs with more than one source (PICME 2006-2010). 7
Population on CPWSs with more than one source treating or blending for nitrate (Technical Report 6, Jensen et al. 2012: Nitrate Treatment Systems Survey and systems approved for treatment by CDPH). 8
Population on CPWSs with more than one source not treating or blending for nitrate, those systems that did not
Technical Report 7: Alternative Water Supply Options 40
respond to the Nitrate Treatment Systems Survey and CDPH does not have treatment information on. 9
Population on CPWSs with more than one source with delivered water in excess of 45 mg/L (as NO3) (PICME WQM 2006-2010). 10
Population on CPWSs with more than one source with delivered water less than the 45 mg/L (as NO3) (PICME WQM 2006-2010).
11 Population on community public water systems with more than one source with no nitrate water quality data
(PICME WQM 2006-2010).
12 Total Higher Susceptibility Population = 3a + 4a + 9 + 11 (Excluding the City of Fresno’s water system that serves
457,511 people). 13
Total Lower Susceptibility Population = 3a + 4a + 10 (Including the City of Fresno’s water system that serves 457,511 people). 14
Total No Susceptibility Population = 5.
Figure 17. Classification of susceptible populations based on estimated vulnerability and water quality data for
the study area.16
16 Due to different sources of data, the summation of the top row does not exactly equal the total study area population. All
population and connection information is approximate. The methodology used for creating the susceptibility chart and chart footnotes are further discussed in the Appendix (Section 10.1.1 Susceptibility Charts). Table 13 includes the unknown susceptibility as the highly susceptible population.
Water
Quality
Evaluation
Technical Report 7: Alternative Water Supply Options 41
As discussed in Section 3.5.1.3 Community Public Water Systems with Reported Delivered Water Nitrate
even though the City of Fresno was detected as delivering drinking water in excess of 45 mg/L they are
considered as having low susceptibility to nitrate contamination in groundwater. The methodology used
for creating the susceptibility chart and chart footnotes are further discussed in the Appendix (Section
10.1.1 Susceptibility Charts).
Figure 18. 2010 Population and susceptibility characterization for the Tulare Lake Basin based on estimated
vulnerability and water quality data.17
17 See Methods section for detailed explanations. The methodology used for creating the susceptibility chart and chart footnotes are further discussed in the Appendix (Section 10.1.1 Susceptibility Charts). Table 13 includes the unknown susceptibility as the highly susceptible population.
Technical Report 7: Alternative Water Supply Options 42
Figure 19. 2010 Population and susceptibility characterization for the Salinas Valley based on estimated
vulnerability and water quality data.18
3.7 Health and Socioeconomic Disparities
This report estimates susceptibility as a qualitative likelihood of exposure; however, a more common
definition of susceptibility to nitrate contamination is based on the health and socioeconomic status of
an individual. Among those susceptible to the likelihood of consuming nitrate contaminated drinking
water, there are sub-populations that are at financial risk and at a health risk from nitrate contamination
of their water sources, but these are much more difficult to quantify. Those that are at a health and
financial risk from nitrate contamination of their water sources are:
1) Pregnant women or infants under six months are more at risk to the health effects of higher
levels of nitrate in drinking water. This is a direct public health concern.
18 Due to different sources of data, the summation of the top row does not exactly equal the total study area population. All
population and connection information is approximate. See Methods section for detailed explanations. The methodology used for creating the susceptibility chart and chart footnotes are further discussed in the Appendix (Section 10.1.1 Susceptibility Charts). Table 13 includes the unknown susceptibility as the highly susceptible population.
Technical Report 7: Alternative Water Supply Options 43
2) Residents of disadvantaged unincorporated communities have a more difficult time paying for both the capital and on-going operations and maintenance (O&M) costs of point-of-use or community-wellhead treatment options, or replacement bottled water, if local nitrate contamination becomes a problem. This is primarily a financial impact and financial feasibility concern of higher levels of nitrate in drinking water.
3.7.1 Pregnant Women and Infants
The number of pregnant women and infants within each basin was estimated using the Department of
Finance data on a county level. This overestimates the health at-risk population since the boundaries of
each county are not fully within in the study area boundaries. Roughly 84,500 and 14,100 pregnant
women and infants live in the Tulare Lake Basin counties and Monterey County, respectively (California
Department of Finance 2010). However, the location of these pregnant women and infants is unknown,
making it difficult to determine if they are currently drinking nitrate contaminated water for
incorporation into the nitrate drinking water contamination at-risk analysis. Applying the estimated
total at-risk percentages (11% and 1% for the Tulare Lake Basin and Salinas Valley - previous section),
approximately 10,000 and 200 pregnant woman and infants within Tulare Lake Basin counties and
Monterey may be at risk to health problems from consuming nitrate-contaminated drinking water,
respectively. Again, the difference in basin boundaries and county boundaries makes this a conservative
Title 22 of the CA Code of Regulations defines a disadvantaged community (DAC) as a community whose
median household income (MHI) is less than or equal to 80% of the statewide MHI. The MHI for CA was
$47,493 in 2000, so for this report, any community with an MHI less than $37,994 is considered a DAC.
DACs that are unincorporated often lack central water and sewer services. These disadvantaged
unincorporated communities (DUCs) are at risk of nitrate contamination because they may lack a safe
water source and are less financially able to buy bottled water or treat with point-of-use systems if their
water source becomes contaminated with nitrate. Since these areas have a large concentration of
families with low incomes, community solutions to nitrate treatment or alternative water supply might
also be difficult.
Disadvantaged communities within the Tulare Lake Basin and Salinas Valley are shown in Figure 20,
along with the delivered water quality of multiple source CPWSs (WQM data from 2006 to 2010).
Severely disadvantaged communities (SDACs) have a MHI of less than 60% of the statewide MHI (less
than $28,496). Some DACs include areas known as Census Designated Places (CDPs), or unincorporated
areas, and Figure 20 includes some disadvantaged unincorporated communities (along with
disadvantaged incorporated communities). CPWSs with delivered water quality exceeding the nitrate
MCL within severely disadvantaged or disadvantaged communities are shown in hollow blue circles.
Those located outside of severely disadvantaged and disadvantaged communities are shown in blue
Technical Report 7: Alternative Water Supply Options 44
points. About 45% of the multiple source systems that have delivered water exceeding the nitrate MCL
are located within the severely disadvantaged and disadvantaged communities.
Figure 21 shows a scatter plot that relates the estimated 2000 MHI of the water system based on
attributing the Census block group MHI to a water system located within it, with the maximum raw
source water nitrate level of the water system (U.S. Census Bureau 2000). Systems are shown as being
in an incorporated (non-CDP) or unincorporated (CDP) area. The systems above the red 45 mg/L (MCL)
line and to the left of the blue 80% MHI line have a source where raw water has been in excess of 45
mg/L as nitrate at least once since 2006, and are located in a disadvantaged community. There are 51
community public water systems (serving about 714,000 people) in the study area with a raw source
exceeding the nitrate MCL; 40 systems (serving about 379,000 people) are located in a disadvantaged
community while eleven are located outside of a disadvantaged community. Thirteen of the 40
exceeding systems are CDPs (serving about 167,000 people) and 27 are non-CDPs (serving about
212,000 people). Of all 328 systems shown in Figure 21, 12% of the systems with raw water quality in
excess of 45 mg/L as nitrate were located within a disadvantaged community while only 3% were
located outside of a disadvantaged community. These numbers are different from Table 13, due to use
of a system’s raw water sources rather than delivered water quality.
Figure 20. The relationship between DACs and SDACs and delivered water quality in multiple source CPWSs.
(Source: CDPH PICME WQM 2006-2010; U.S. Census Bureau 2000; U.S. Census Bureau 2001.)
Technical Report 7: Alternative Water Supply Options 45
Figure 21. The maximum raw source water nitrate concentration for 328 state small and community public
water systems in the Tulare Lake Basin and Salinas Valley with MHI data. (Source: CDPH WQM 2006 – 2010 and
2000 Census.) {**Note: CDP = Unincorp. Place and non-CDP = Incorp. Place.}
Disadvantaged unincorporated communities are smaller communities that are often either not
connected to a public water system or are connected to very small systems. The smaller water systems
lack technical, managerial and financial capacity to maintain an expensive water treatment facility or to
provide alternative water supplies to their customers. Small water systems are typically responsible for
more water quality violations and have persistent difficulties with successfully operating and
maintaining their systems (Washington State Department of Health 2005).
3.8 Trends in Affected Populations over Time
Legacy nitrate contamination of groundwater will expand in spatial extent in the future and increase the
at-risk population. By 2050, the total study area population is projected to grow to about 5.8 million
people, with about 5.3 million people in the Tulare Lake Basin, and a little over 500,000 people in the
Salinas Valley (California Department of Finance 2010).
3.8.1 Accumulating Nitrate and Population Changes
Current groundwater nitrate contamination is in part a legacy problem, as contamination percolates and
spreads in groundwater decades after nitrogen is applied to the soil. In some places, source loading
from decades ago is just now reaching the Tulare Lake Basin and Salinas Valley aquifers and nitrate
applied to the surface today may not reach drinking water wells for decades. Nitrate accumulates in
Nitrate MCL
80% Ca MHI
Technical Report 7: Alternative Water Supply Options 46
groundwater; given the extent of contamination there is little evidence to suggest that nitrate
concentrations in deep groundwater will decrease without intervention (denitrification is very minor in
the environments of this study). As the area’s population increases, more people in small and
household water systems will face health and financial consequences from nitrate contaminated
groundwater. As the population increases and agricultural land is converted to residential property,
risks from nitrate-laden groundwater will increase, requiring more aggressive and expensive treatment.
We determined the long-term trends (over the past 40 years) of nitrate concentrations in public supply
wells in the pilot study area. The average annual change in nitrate concentration was calculated for all
public supply wells with at least two nitrate records listed in WQM. Table 14 shows the mean change in
nitrate concentration for public supply wells in the Tulare Lake Basin, Tulare County, and the Salinas
Valley. Based on this annual trend for nitrate in public supply wells, the total number of community
public water systems that will have raw source water exceeding the MCL by 2035 and 2050 is estimated
in Table 15 (CDPH’s WQM Database from 1970s to current), showing the predicted affected population
if no remediation or abatement of source application occurs. This analysis only examines the increasing
nitrate trend in existing community public water systems and is applied to the maximum raw source
water data in WQM. The affected population is estimated to be approximately 1.9 million people by the
year 2050. Approximately 79% of the existing community public water systems’ sources could exceed
the MCL for nitrate by 2050. This estimate does not consider any treatment implementation or
distribution of alternative water supplies and ignores water system population increases.
Table 14. Long-term trends for nitrate concentrations in public supply wells.1
Mean Change
[mg/L-yr] Confidence
Interval -95% Confidence Interval
+95%
Tulare Lake Basin {Tulare County}
Public Supply Wells, 1970s – current
0.27 {0.41}
0.17 {0.22}
0.36 {0.59}
Salinas Valley Public Supply Wells,
1970s – current 0.53 0.31 0.77
1 The nitrate trend for all public supply wells listed in CDPH’s CADWSAP (WQM) database from
1970s to current.
Table 15. Estimated time for CPWS sources to exceed the nitrate MCL and total affected population.
Time For Maximum Recorded Raw NO3
- Level to Reach the MCL
Total Number of Affected CPWSs
Total Affected Population
Percent of Total CPWSs Population (Study Area)
0 Years (2010) 77 1,363,657 57%
25 Years (2035) 114 1,836,732 76%
40 Years (2050) 127 1,903,300 79%
Technical Report 7: Alternative Water Supply Options 47
3.8.2 Drinking Water System Regulatory Changes
Tightening drinking water regulations and increasing trends in nitrate concentrations will likely make it
more difficult for small local suppliers to comply with regulations for nitrate, arsenic, and other
contaminants. With drinking water regulations expected to become more stringent in the future with
tighter drinking quality standards and increased contamination occurrences, more water systems will be
forced to implement state-of-the-art treatment facilities and monitor more frequently with online
monitoring tools. Systems must be prepared to comply with more complex regulations while
simultaneously continuing to comply with existing regulations. Compliance will be increasingly difficult
as nitrate levels increase over time. Small systems lacking the technical, managerial, and financial
capacity for operating and maintaining a treatment facility will struggle with future regulations. The lack
of resources and looming safe drinking water challenges should motivate smaller systems to regionalize
and consolidate with bigger systems, where possible, to achieve the economies of scale and rate base to
be able to assure safe drinking water in an increasingly challenging environment for small systems, or to
consult assistance programs for financial, technical and institutional help.
Technical Report 7: Alternative Water Supply Options 48
4 Alternative Water Supply Options
Alternative water supplies and nitrate treatment for drinking water are presented and discussed in this
section, including the latest technologies, limiting factors, and capital and O&M costs, with a goal of
identifying promising options for providing safe water to high susceptibility populations. Guidelines are
developed for selecting promising water supply options and evaluating solution costs as a function of
source water quality, system size, and system location. The discussions are based on an inventory and
analysis of nitrate drinking water management strategies and treatment options available to the study
area population, identifying concerns for each option, including financial and economic aspects. The
most promising alternative water supply options for the susceptible population are considered and costs
are presented with estimated costs in Section 5 Evaluation of Options.
Alternative water supply and nitrate management options identified in this report are grouped into
three categories: improving the existing water source, providing alternative supplies, and relocating
households (Table 16). Several ancillary activities can improve the performance of some water supply
alternatives. Although each system requires its own engineering design and analysis, generalized cost
estimates are discussed in Section 5 Evaluation of Options.
Table 16. Alternative water supply options.
OPTION
IMPROVE EXISTING WATER SOURCE Blending
Drill Deeper Well
Drill New Well Community Supply Treatment Household Supply Treatment
ALTERNATIVE SUPPLIES Switch to Treated Surface Water Piped Connection to an Existing System Piped Connection to a New System Regionalization and Consolidation Trucked Water
Bottled Water
RELOCATE HOUSEHOLDS
ANCILLARY ACTIVITIES Well Water Quality Testing Dual System
4.1 Improve Existing Water Source
Several source improvement options, including both non-treatment and treatment alternatives, can be
used to ensure the provision of water that is compliant with the nitrate MCL. In this report, non-
treatment options include blending and drilling a deeper or new well. Both can be limited by well
characteristics, quality of available sources, and financial resources. The most common treatment
Technical Report 7: Alternative Water Supply Options 49
options for community public water systems are ion exchange (IX) and reverse osmosis (RO); additional
options for drinking water nitrate treatment include electrodialysis/electrodialysis reversal (EDR),
biological denitrification and chemical denitrification. Household treatment options include ion
exchange at the point-of-entry or reverse osmosis at the point-of-use.
4.1.1 Blending
Blending dilutes a source with higher nitrate levels with a lower nitrate source to produce water that
meets safe drinking water standards. Blending typically takes advantage of the differing nitrate
concentrations typically found among wells of different locations, districts, and depths. Blending
requires at least one nitrate compliant source and cannot occur in systems with only one well, unless
additional water is brought from outside.
Blending is often considered a form of treatment because water systems are required to monitor and
operate the blending process as a permitted treatment facility with a certified operator (CDPH 2008;
Commandatore & Collins 2011). Requirements for blending include daily field monitoring, using
continuous online nitrate analyzers to ensure complete mixing and compliant blended water quality;
collection of monthly samples to certify a source is uncompromised; and consistent distribution of
nitrate compliant water (CDPH 2008; Commandatore & Collins 2011). The compliance point for a
blending system shifts from the source water in the well to the blended sampling point (or point-of-
entry to the distribution system) (CDPH 2010). Water may be blended from several groundwater wells,
or systems can blend groundwater with purchased treated surface water.
According to CDPH, blending is only acceptable as “a treatment process if one of the blended sources
exceeds a primary MCL” (CDHS 2005). If a water system decides to blend their sources to comply with
drinking water regulations, they must contact CDPH and coordinate with them to create a Blending
Program and receive permission to blend. Blending requires two wells to continually operate, ensuring
that one is always a low-nitrate source. A blending system must have an operator certified as Grade T2.
If the low-nitrate blend water becomes compromised by high nitrate levels, a system automatically loses
blending privileges. The maximum blend concentration allowed by CDPH is less than or equal to 40
mg/L (as NO3-).
Within the study area, eight CPWSs use blending alone to reduce nitrate in delivered water. Blending is
typically the first choice and least expensive option when a nitrate compliant source is available.
Estimated costs for blending are presented in Section 5.1.1 Blending.
4.1.2 Drilling a Deeper or New Well
Nitrate slowly follows general groundwater movement down from the surface to the saturated zone.
Sometimes it is possible to avoid or defer nitrate contamination by drilling deeper wells. This is often
considered a temporary solution because any nitrate contaminating the original shallower well can
eventually infiltrate to the deeper well, unless any of the following conditions are met:
Technical Report 7: Alternative Water Supply Options 50
Mettler Community Water District, in
Kern County, drilled a 700 foot well at
a capacity to serve 146 residents and it
was estimated to cost $284,000. In
2009, a well comparable in size and
depth was built by Plainview Mutual
Water Company, in Tulare County, to
serve 800 residents and it was
estimated to cost $339,000. Ducor
Community Service District, also in
Tulare County, spent close to
$725,000 on a 1,400 foot well for 850
residents. These cost estimates do not
include the contingency, escalation,
and design costs, that can add an
additional 30% to the construction
costs. (Self-Help Enterprises 2010)
a strongly chemically reducing aquitard zone, capable of denitrifying downward seeping groundwater, separates the current screen level from the target screen level;
a rather impermeable layer separates the deeper well from the nitrate contamination; or
the new well screen is much deeper (several hundred feet) below the current screen level and the well is properly sealed to the depth of the well screen.
A deeper aquifer protected by a clay layer could prevent upper aquifer nitrate-contaminated water from
entering the new wells withdrawal zone. Depending on the local hydrogeology, source capacity may
decrease with deeper wells – however, this is typically not an issue for small production domestic wells
or wells with few connections. Other water contaminants (such as arsenic) may emerge at new depths.
Jensen et al. (2012) found evidence of a possible increase in the incidence of arsenic MCL exceedance
with well depth in areas of the Tulare Lake Basin (see Technical Report 6, Section 4.2, Jensen et al.
2012). New wells might be a feasible option for communities while they await long-term solutions, such
as connection with larger systems, a new treatment system, or groundwater remediation. Drilling a
deeper or new well takes less time than some construction and remediation projects. New well owners
and systems employing new wells should test their well frequently.
Drilling a new or deeper well should employ an experienced well driller who is educated on the local
hydrogeology. The driller should be familiar with the nitrate distribution and groundwater gradient at
the desired well location. The main costs of drilling a new or deeper well will be drilling and pumping
costs; both increase with the depth to uncontaminated water. Well modification of an existing well may
limit the screened interval, to capture a region of groundwater with low nitrate concentrations. A
packer/plug can be installed to restrict withdrawal from nitrated contaminated regions and installation
can occur without removing pumps (BESST Inc. 2008).
A new well should be drilled more than about 30 meters (100
feet) from potential sources of pollution or contamination (such
as septic fields). Drilling a well has many costs including:
drilling a pilot test well and the larger diameter borehole
for the production well;
installing the well, filter pack, borehole seals, and
surface completion;
equipping the site;
testing for sediment and water quality;
well development;
installation of storage and distribution systems; and
planning, consulting, and engineering services.
Installing a new community water supply well can cost from about $300,000 to $1 million, depending
on depth and capacity (Newkirk & Darby 2010). Kettleman City Community Services District estimated
the costs for drilling a pilot test well to be about $320,000 (Summers Engineering 2011).
Technical Report 7: Alternative Water Supply Options 51
To estimate the costs for drilling a deeper well, a U.S. EPA BID document was used along with a quote
from an experienced hydrogeologist. Costs for drilling a deeper or new well are presented in Sections
5.1.2 Drilling a Deeper Well and 5.1.3 Drilling a New Well.
4.1.3 Community Treatment
If an existing CPWS source exceeds the MCL for nitrate, centralized treatment may be implemented.
Numerous factors are important in the consideration of community treatment, including the population
served, the quantity of water distributed, and the technical and managerial capacity. The U.S. EPA has
approved ion exchange, reverse osmosis, and electrodialysis as potable water treatment methods for
nitrate removal (see Technical Report 6, Jensen et al. 2012). These three processes remove nitrate ions
from the contaminated water and concentrate them into waste brines. The most common nitrate
treatment method in the United States is ion exchange. Alternatively, denitrification methods do not
transfer nitrate to a concentrated brine waste stream, but convert nitrate to a reduced nitrogen form,
such as nitrogen gas. Full-scale application of denitrification treatment of potable water has been
limited in the United States; however, two full-scale biological treatment plants, capable of
denitrification, are being implemented in California and chemical denitrification has been used at the
pilot-scale level. Europe has applied full-scale biological denitrification for potable water treatment (see
Technical Report 6, Jensen et al. 2012).
The most appropriate treatment for nitrate contamination can be influenced by influent nitrate
concentrations as discussed in Technical Report 6 (Jensen et al. 2012). Table 17 lists several scenarios
for influent nitrate level and water system characteristics, with considerations listed for each option.
Table 17. Influence of nitrate concentration on treatment selection.1
Option Practical Nitrate Range Considerations
Blend 10 – 30% above MCL Dependent on capacity and nitrate level of blending sources.
IX Up to 2X MCL
Dependent on regeneration efficiency, costs of disposal and salt usage. Brine treatment, reuse, and recycle can improve feasibility at even higher nitrate levels.
RO Up to many X the MCL
Dependent on availability of waste discharge options, energy use for pumping and number of stages. May be more cost-effective than IX for addressing very high nitrate levels.
BD Up to many X the MCL
Dependent on the supply of electron donor and optimal conditions for denitrifiers. Ability to operate in a start-stop mode has not yet been demonstrated in full-scale application; difficult to implement for single well systems. May be more cost-effective than IX for addressing high nitrate levels.
1Based on contact with vendors and environmental engineering consultants. Excerpt from Technical
Report 6 (Jensen et al. 2012).
Technical Report 7: Alternative Water Supply Options 52
The estimated costs for use of ion exchange and reverse osmosis are presented in Section 5.1.4
Community Treatment; additional information is provided in Technical Report 6 (Jensen et al. 2012).
Since the most recent U.S. EPA Cost Estimating Manual is from 1979, collected cost information for
arsenic treatment was used for a more up to date comparison of ion exchange treatment (U.S. EPA
2000). Refer to Technical Report 6 on Drinking Water Treatment for more nitrate treatment details
(Jensen et al. 2012).
Communities with dual plumbing systems that separate drinking and cooking uses from other water
uses, have the possibility to greatly reduce treatment quantities and costs, and reduce production of
waste brines requiring disposal. However, dual plumbing systems increase capital and maintenance
costs and may raise regulatory issues.
Any CPWS implementing treatment could consider using remote monitoring and management
technology to lower operating and maintenance expenses. A remote telemetry or supervisory control
and data acquisition (SCADA) system would be very beneficial to small systems lacking resources to
support qualified operators on-site. Small water systems are more expensive and challenging to
manage well and SCADA allows a skilled operator to supervise several systems remotely. A SCADA
system allows real time control of system operation and maintenance of water quality by using a central
computer to control mechanical processes and collect data from sensors. Emergency responses can be
quick with instant notification of critical system events or episodes automatically sent to the operator.
Additionally, the data acquisition component allows utilities to provide statistics on water quality and
usage for budget planning, water quality compliance, system improvement, and targeted system
expansions. A SCADA system can alert operators to changes in water quality requiring their assistance
or automatically modify system operation through preprogrammed control functions not needing
operator assistance. A SCADA and Programmable Logic Controller (PLC) control system for a 900 gallon
per minute (gpm) surface water treatment plant costs about $75,000 (Summers Engineering 2011).
Based on the U.S. EPA 2007 Drinking Water Infrastructure Needs Survey and Assessment, approximate
minimum costs for SCADA are represented for various system sizes in Section 5.1.4 Community
Treatment.
4.1.4 Household Treatment
An alternative to community treatment is the use of a household water treatment device either at the
point-of-entry (all water entering the home) or at the point-of-use (drinking and cooking water only).
Point-of-entry (POE) solutions remove nitrate through reverse osmosis or ion exchange for the entire
house (usually only indoor uses). Point-of-use (POU) solutions for nitrate commonly use reverse
osmosis for kitchen taps (New Hampshire Department of Environmental Services 2008). Since nitrate is
not a concern for non-drinking uses (showering), a POU system that treats drinking and cooking water is
more economical than a POE system. POU systems have greater potential public health risks than POE
systems, because residents may consume water from bathroom taps without a POU system. In general,
reverse osmosis is the cheapest nitrate treatment at the household level (Mahler 2007).
Technical Report 7: Alternative Water Supply Options 53
Certification to the relevant ANSI/NSF standard by an ANSI accredited third party certifier ensures the
safety and performance of the residential treatment systems (see Technical Report 6, Jensen et al.
2012). Currently there is only one ANSI/NSF household-level technology standard for nitrate reduction:
NSF 58 - Reverse osmosis drinking water treatment systems (NSF 2010). POU devices that claim to
reduce a drinking water contaminant must be certified by CDPH (CDPH 2008; CDPH 2010a). CDPH’s
Certified Residential Water Treatment Devices directory lists approved water treatment devices to
reduce nitrate. “Under counter” approved systems reduce nitrate through reverse osmosis or reverse
osmosis with carbon. “Counter top” approved systems reduce nitrate through reverse osmosis and
granular activated carbon (CDPH 2011b).
POU treatment requires separation of drinking and cooking water supplies from other water uses and
potentially increases public health risk, but is much less expensive than treating all household water to
remove nitrate, and similarly generates much less waste brine. For a reverse osmosis system, piping
from the device and faucet plumbing must be lead-free. This precaution is needed because reduction of
the water’s alkalinity can increase corrosiveness and leach lead (New Hampshire Department of
Environmental Services 2008).
The average rated service flow for the certified residential nitrate treatment devices in the CDPH
directory is about 20 gallons per day (gpd), with some devices as low as 7.6 gpd and some as high as
35.5 gpd (CDPH 2011a). The average human uses 0.8 gpd for cooking and drinking (NAS 2004), so these
flow rates are appropriate for drinking and cooking needs of most family sizes.
While the residential water treatment devices in the CDPH directory are certified to remove nitrate from
drinking water, there is a limit to their effectiveness. For example, many of the reverse osmosis with
carbon treatment systems manufactured by Kinetico Incorporated are only acceptable for nitrate levels
below 27 mg/L (measured as nitrogen) (CDPH 2011a). However, treatment with these devices can also
remove other potential contaminants of concern, such as arsenic.
The estimated cost of a reverse osmosis POU device and an ion exchange POE device is discussed in
Section 5.1.5 Household Treatment.
4.2 Connect to Alternative Water Supplies
Alternative water supplies include connection to a better quality water system, trucked potable water
from a better source, and purchased bottled or vended water. A piped connection to a better quality
water system can take three forms: connecting to an existing system, connecting to a newly created
system, and consolidating several small systems into a larger new regional system. Trucking of water
would most likely occur for remote, very small communities and businesses as an interim or emergency
solution. The use of bottled or vended water is a simple and effective temporary solution for isolated
households or small businesses, albeit at some cost and inconvenience.
Technical Report 7: Alternative Water Supply Options 54
Kettleman City Community Services
District is proposing switching from
their contaminated groundwater (arsenic
and benzene) to a surface water
treatment plant. The County of Kings
and Tulare Lake agricultural users are
allocating some of their State Water
Contract (900 acre-feet per year). The
estimated cost for a surface water
treatment plant is $6.6 million. The
plant would supply 1.3 mgd of surface
water to 1,500 people. An increase in
residential rates is limited to $2.21 per
month (1.94% of the MHI) (Summers
Engineering 2011). The annual O&M
will be subsidized by Kings County.
Cutler and Orosi are two unincorporated
communities in Tulare County located less than
a mile from each other, and less than a mile
from a smaller community, East Orosi. Cutler
and Orosi each have their own water systems
that are contaminated with DBCP and nitrate.
The Alta Irrigation District has just completed
the first stage of a feasibility study for treating
Friant Kern Canal surface water to supplement
Cutler and Orosi’s contaminated groundwater
sources. The project is estimated to cost
approximately $17 million in capital costs and
approximately $500,000 in annual operating
costs (CWC 2011a).
4.2.1 Switch to Treated Surface Water
A piped connection to an existing surface water
treatment system becomes promising if a community is
reasonably near a well-functioning system with capacity.
The costs for connecting to an existing surface water
treatment system, currently supplied by a source such as
the Central Valley Project (CVP) or State Water Project
(SWP), would include the pipeline costs for the installed
distribution pipe, trenching and excavation, embedment,
backfill and compaction, valves, fittings and hydrants,
dewatering, sheeting and shoring, horizontal boring,
pavement removal and replacement, utility interference,
and the fees for each connection to buy into
capacity(varies within each system – the City of Davis
charges about $9,000 for a residential ¾” meter
connection to their system) (City of Davis Public Works
Division 2011).
Although the quantities of water to serve a small
community might not be large, legal and contracting
issues will arise. When attempting to switch to surface
water as a drinking source in the Tulare Lake Basin,
operating characteristics of surface water supply
systems designed for irrigation use, such as the Friant-
Kern Canal, also may pose challenges to small rural
communities when such systems are drained for
maintenance during the off-season. To prepare for this
type of surface water availability limitation, it may
sometimes be appropriate to create a surface water
treatment system with capacity to treat nitrate
contaminated groundwater as well, so the residents
have greater supply reliability.
4.2.2 Piped Connection to an Existing System
Costs for a piped connection to an existing water system with safe water would include infrastructure,
base installed pipe, trenching and excavation, embedment, backfill and compaction, valves, fittings, and
hydrants, dewatering, sheeting and shoring, horizontal boring, pavement removal and replacement, and
connection fees to the existing safe water system. Most costs will be for distribution and connection.
Technical Report 7: Alternative Water Supply Options 55
East Niles Community Services
District (ENCSD) charges $5,000
per connection to their system.
Installing a 10” PVC pipe and
valves was estimated by ENCSD
to cost around $85 per foot (Self-
Help Enterprises 2010), while
U.S. EPA estimated $95 – 142
per foot (U.S. EPA 2007).
Rehabilitating a pipeline is slightly
less expensive at $73 per foot
(U.S. EPA 2007). Any
obstructions create additional
expenses. For example, a railroad
track crossing cost ENCSD
$75,000 and crossing a canal cost
$25,000 (Self-Help Enterprises
2010).
Figure 22 shows the distribution of the minimum distances from a
system serving less than 10,000 people (smaller systems) to a
system serving more than 10,000 people (larger systems) for all
CPWSs and SSWSs in the study area (distances are between
sources, not service areas). Within the study area, 306 small
systems and 38 large systems are analyzed in Figure 22 for
possible interties, disregarding any institutional, political,
technical, managerial, or financial barriers and costs. Of the 195
small systems in the Tulare Lake Basin, about 50% are within five
miles of a larger system, and 88% are within 12.5 miles (Figure 22).
Of the small systems in the Salinas Valley, about 15% are within
five miles of a larger system, and 97% are within 12.5 miles (Figure
22). This analysis also assumes safe drinking water quality and
available capacity for the systems with more than 10,000
connections. The connection potential for each basin is discussed
further in Section 4.2.4 Regionalization and Consolidation.
Figure 22. The minimum distance from a small system (≤ 10,000 people) to a larger system (> 10,000 people) for
the entire study area. (Source: CDPH PICME 2010.)
4.2.3 Piped Connection to a Larger Newly Created System
Creating a new public water supply system is likely to involve costs for infrastructure, base installed
pipe, trenching and excavation, embedment, backfill and compaction, valves, fittings, and hydrants,
dewatering, sheeting and shoring, horizontal boring, pavement removal and replacement, utility
0
50
100
150
200
250
300
0 4 8 12 16 20 24 28 32 36 40 44
Nu
mb
er
of
Syst
em
s
Distance from a Small System (< 10,000 ppl) to a Larger System (>10,000 ppl) (miles)
Study Area
Tulare Lake Basin
Salinas Valley
Technical Report 7: Alternative Water Supply Options 56
Kettleman City CSD identified
potential safe water supplies about
8,000 feet away from their property.
The CSD’s Engineer estimated drilling
two new groundwater wells, with an
8,000 foot distribution pipeline, to cost
about $6.6 million (Summers
Engineering 2011). The CSD also
estimated treating two new
groundwater wells (treatment for
arsenic and odor) drilled on the
existing property to cost about $7.7
million (Summers Engineering 2011).
The San Jerardo Water System spent
over $5 million installing two miles of
water transmission pipelines, a 285,000
gallon water tank, a potable water well,
and pumping station. They also
created an intertie with a nearby
potable water supply for emergency
service (Monterey County Planning
Commission 2009).
interference, new sources, and treatment equipment. For a
new groundwater system, a district or community may need to
look outside for safe groundwater. If a new groundwater
system is constructed within a district’s boundaries there must
be property available for a structure to house a nitrate
treatment system. It is recommended to construct at least two
wells since pumping units can fail within a well and it is prudent
to have a backup source. Cost estimates would include costs for
two wells, distribution, and treatment.
4.2.4 Regionalization and Consolidation
Regionalization and consolidation in the drinking water sector
can take many forms. Inter-tying systems to create a new larger
system combines several small water systems that suffer from
diseconomies of scale into one larger water system that serves
the desired population and provides treatment to comply with
drinking water standards. Regionalization has more formally
been defined as “…a creation of an appropriate management or
contractual administrative organization or a coordinated
physical system plan of two or more community water systems
in a geographical area for the purpose of utilizing common
resources and facilities to their optimum advantage” (Grigg
1989). Similarly, consolidation has been defined as “one
community public water system being absorbed into, combined with, or served by other utilities to gain
the resources they lack otherwise” (Raucher et al.2004). Consolidation often refers to giving up control
and independence by one entity (or water system) as it is merged into another single entity. This
transfer of control and loss of independence does not always occur with regionalization; multiple
smaller systems can join together to create a larger system with management distributed evenly among
all parties.
Regionalization and consolidation combine neighboring water systems to improve service and
efficiencies, and to lower costs through economies of scale (Eskaf 2009). Regionalization and
consolidation can be considered for drinking water systems struggling to meet regulatory compliance,
unable to sustain aging infrastructure, unable to operate the system, or concerned about future water
availability. Regionalization and consolidation are especially attractive for small systems that lack
population base and access to financial resources and technical expertise. Systems can achieve
economies of scale through regionalization without being physically connected by sharing capital
equipment and management staff, or by participating in joint business and logistic operations. The least
to most collaborative regionalization options range from: 1) create a planning document together; 2)
initiate communication to discuss water system issues or to call during an emergency; 3) share inventory
or equipment; 4) share an operator; 5) join management or delegate bookkeeping or billing to one
Technical Report 7: Alternative Water Supply Options 57
entity; 6) interconnect systems for emergency purposes only; 7) share water rights or water resources
without an intertie; 8) intertie systems, but maintain separate operations; and 9) intertie systems, close
current systems, or form a combined system (New Mexico Rural Water Association 2006).
The optimal economic water system size and least-cost service area are estimated by the cost trade-offs
between the water source acquisition-treatment component and the transmission-distribution
component (Clark & Stevie 1981). Smaller water systems may not have the economies of scale for the
acquisition-treatment component, resulting in increased marginal costs for drilling and pumping.
Ideally, in consolidation there is a balance between the increasing returns in acquiring and treating the
water and the decreasing returns involved in distributing water further and further. Rural small
community water systems are generally farther from large urban systems, resulting in high costs for the
transmission-distribution component of consolidating that often are unaffordable by low income rural
populations (Ottem et al. 2003).
There is significant potential based on size and distance analysis for systems to consolidate in the Tulare
Lake Basin. There are 98 large systems and 195 small systems analyzed for connection. The number of
smaller systems that are within 15 miles of larger systems is shown in Table 18. The Cities of Fresno,
Dinuba and Porterville, as well as the CSU Fresno water systems, are available for ten or more small
systems to connect based solely on their spatial proximity. Figure 23 shows the number of smaller
systems that are within a specific distance range of a larger system (e.g., there are 12 smaller systems
within 1.25 miles of a larger system in the Tulare Lake Basin). Considering only piping costs, about 97
smaller systems could consolidate and join a larger system less than five miles away at a cost of about
$1.6 million19 per system. Spatial proximity is the only consideration in suggesting these interties; other
territorial, institutional, infrastructure upgrading, legal, and political barriers are ignored.
Within the Salinas Valley, there are 19 large systems and 111 small systems analyzed for connection
(Table 19). The California American Water Company in Monterey and the California Water Service
Company in Salinas are close to ten or more small systems for possible connection consideration, based
solely on spatial proximity. Figure 24 shows the number of smaller systems that are within a specific
distance range of a larger system (e.g., there are 4 smaller systems within 1.25 miles of a larger system
in the Salinas Valley). Again, considering only piping costs, about 28 smaller systems could consolidate
and join a larger system less than thirteen miles away at a cost of about $4 million per system
(Monterey County Environmental Health 2010b).
Assuming sufficient capacity and adequate internal infrastructure of the small systems, there is
significant potential for regionalization and consolidation if a system can afford the pipeline and
connection costs. The costs considered in this report for connecting to a new or existing system are only
those for installing the intertie pipeline and for connection fees. The operating costs for the intertie
pipeline, the additional value of the safe water relative to the unsafe water, and the cost for land
19 This assumes a $61/ft pipe cost from the Granite Ridge Regional Water Supply Project Feasibility Study (Monterey County
Environmental Health 2010b).
Technical Report 7: Alternative Water Supply Options 58
easements for transmission are not considered in this report. Various cost scenarios for constructing
pipeline to a new or existing system are presented in Section 5.1.6 Connect to an Alternative System.
Table 18. Large systems and the number of nearest small systems identified by distance proximity nearest-
neighbor analysis in the Tulare Lake Basin.
System Number
System Name (> 10,000 System) Connection Population
Potential Number of Connecting Systems
(< 10,000 ppl)1
Population of Potential Number of Connecting Systems
1010007 City of Fresno 130,176 457,511 11 11,731
1010019 City of Kingsburg 3,413 11,300 3 653
1010024 California Water Service Co. - Selma 6,078 24,307 8 8,377
1010025 City of Parlier 2,329 12,058 1 1,100
1010027 City of Reedley 5,445 25,584 2 60
1010029 City of Sanger 5,971 25,404 8 2,301
1010339 California State University, Fresno 550 22,000 15 12,094
1510001 Arvin Community Services District 3,446 11,847 1 400
1510005 City of Delano 8,829 53,855 9 14,500
1510006
East Niles Community Services District 7,406 25,500 7 2,560
1510012 Lamont Public Utility District 3,475 13,296 6 6,959
1510015 Oildale Mutual Water Company 7,708 26,000 7 11,307
1510019 City of Shafter 4,090 15,609 3 7,296
1510022 West Kern CWD 7,443 16,630 2 7,464
1510029 Vaughn WC INC F 9,246 28,100 11 1,930
1510031 City of Bakersfield 43,086 147,999 12 1,240
1610003 City of Hanford 15,509 53,320 9 7,157
1610005 City of Lemoore 6,117 24,500 5 3,386
5410002 City of Dinuba 6,025 21,087 13 17,909
5410003 City of Exeter 3,012 10,730 5 8,399
5410004 City of Farmersville 2,420 10,672 3 1,440
5410006 City of Lindsay 2,303 11,450 5 3,773
5410010 City of Porterville 14,896 51,467 17 9,957
5410015 City of Tulare 15,967 57,375 4 3,618
5410016 California Water Service Co. - Visalia 40,530 133,749 9 7,150
1 Within 15 miles.
Technical Report 7: Alternative Water Supply Options 59
Figure 23. The minimum distance ranges between all existing small systems (≤ 10,000 people) and larger
systems (> 10,000 people) in the Tulare Lake Basin. (Source: CDPH PICME 2010.)
Table 19. Large systems and the number of nearest small systems identified by distance proximity nearest-
neighbor analysis in the Salinas Valley.
System Number
System Name (> 10,000 System) Connection Population
Potential Number of Connecting Systems
(< 10,000 ppl)1
Population of Potential Number
of Connecting Systems
2710004 California American Water Company Monterey 38,701 122,492 12 7,162
2710008 City of Greenfield 3,469 17,547 10 10,990
2710010 California Water Service Co. - Salinas 25,451 114,840 78 25,511
2710011 City of Soledad 4,082 16,146 9 9,411
2710017 Marina Coast Water District 8,357 34,600 2 1,050 1
Unpleasant, extreme option Loss of property value and jobs
Social, familial dislocation
Well Water Quality Testing
Water quality awareness
Beneficial to blending
Dual System Hybrid of options Treating only potable
Possible consumption of water from contaminated source
Cost of contaminated supply plus cost for community treatment of potable supply and capital dual plumbing costs.
5.1 Economic and Financial Costs
Affordability and sustainability are key issues for deciding if a solution is appropriate for an area. Small
water systems with nitrate contamination will often be unable to support new development with limited
safe water sources and unable to increase the number of connections (contributing to local economic
decline). Consolidation of small water systems can increase economies of scale, and reduce technical
and financial burdens by reducing total cost and distributing costs over a larger population. A
community must have the technical, managerial and financial capacity to successfully implement a
solution.
The Pacific Institute (2011) and others discuss the cost of avoiding or treating nitrate-contaminated
water, suggesting that financing “is typically borne by water users and by local government and water
providers, and is indirectly incurred by local and state tax payers, through tax revenues that pay for
drinking water improvement projects.” Individuals currently connected to an impacted water system
Technical Report 7: Alternative Water Supply Options 66
must pay for their own bottled water, health care services, or point-of-use treatment device. The same
costs may be incurred by individuals connected to systems at risk of future contamination. These
economic and financial results will be considered when discussing future funding sources and policy
options (see Technical Report 8, Canada et al. 2012) for the Tulare Lake Basin and Salinas Valley.
Compared to larger cities, small, disadvantaged, unincorporated communities and self-supplied
households often have different economical solutions. Based on the analysis herein, the least expensive
option for self-supplied households and local small water systems is often to install point-of-use reverse
osmosis devices for all potable uses within their households. If a household can afford drilling a new
well and if that well can tap an uncontaminated supply, then a new well can be an attractive alternative;
the new well option has fewer potential health concerns from improper handling and accidental
consumption of untreated water. The least expensive option for very small community public water
systems (serving less than 500 people) is often to install ion exchange treatment within the system
configuration. For small community public water systems (serving 500 to 3,300 people) the least
expensive option is often to install reverse osmosis treatment. Another economical option for small
water systems (serving less than 3,300 people) is often to connect to another system; however, the
costs for connection here include pipeline costs and a rough estimation of connection costs.
Constructing a new well also may be economical. For medium community public water systems (serving
3,300 to 10,000 people) the least expensive option often is to install groundwater treatment, either ion
exchange or reverse osmosis, since the estimated costs overlap. Another economical option for
medium systems is to construct a new well or to construct a new well some distance from the existing
system location. The economies of scale for pipeline start to prevail for the medium system sizes, and
they can pipe their way out of the problem. For larger community public water systems, all options are
relatively equal and local conditions become more important. A larger community public water system
also has more opportunity to connect to surface water; with the larger population base the costs of
connecting, maintaining, and treating the system can be equitably distributed without imposing too
much of a financial burden.
For the final basin-wide cost analysis presented in Section 6 Basin-wide Costs of Nitrate Contamination,
the following alternative water supply options were excluded from community water supply options:
bottled water, trucked water, blending, and a dual water distribution system. The U.S. EPA does not
allow a community public water system to distribute bottled water to their consumers as a means of
complying with drinking water standards.20 In addition, new community public water systems are not
allowed to have trucked water delivered to their consumers and older water systems are only permitted
to use this option in an emergency (CDPH 2005; CDPH 2011c; CDPH 2011d). Lastly, blending was not
considered in the basin-wide cost analysis, but is recommended as the first step for a community public
water system towards complying with the nitrate MCL. If a water system has an additional, low-nitrate
source (at least less than 40 mg/L as nitrate) a blending program should be set-up and permitted by
CDPH, as the annual O&M costs are less than a groundwater treatment system. For a small water
20 National Primary Drinking Water Regulations, Code of Federal Regulations Title 40 §141.101.
Technical Report 7: Alternative Water Supply Options 67
system (less than 3,300 people), the annualized cost of blending and drilling a new well are almost
equivalent, however, they both rely on the future fate of the sources available.
The costs of alternative water supply and treatment options vary with numerous factors and the
numbers presented here are estimates based on averages of widely variable costs. Costs will be unique
to each individual system. For proper cost estimation, a feasibility analysis is necessary to assess the
potential solution for each unique system. The following overall assumptions were made to estimate
costs for the alternative water supply options in Table 22:
Twenty year life of product/equipment/materials (except for household treatment – 10 years and bottled/trucked water – no capital)
2.15 gallons per household per day of potable water consumption (NAS 2004)
3.3 persons per household
2010 dollars
Table 22. Summary of approximate alternative water supply option costs.
OPTION ESTIMATED ANNUAL COST RANGE ($/year)1
Self-Supplied Household
Small CPWS(1,000 households)
IMPROVE EXISTING WATER SOURCE
Blending2
N/A $85,000 - $150,000
Drill Deeper Well3
$860 - $3,300 $80,000 $100,000
Drill a New Well4
$2,100 - $3,100 $40,000 - $290,000
Community Supply Treatment5
N/A $135,000 - $1.09 M
Household Supply Treatment6
$250 - $360 $223,000
ALTERNATIVE SUPPLIES
Piped Connection to an Existing System7
$52,400 - $185,500 $59,700 - $192,800
Trucked Water8
$950 $350,000
Bottled Water9
$1,339 $1.34 M
RELOCATE HOUSEHOLDS10
$15,090 $15.1 M
ANCILLARY ACTIVITIES
Well Water Quality Testing11
$15 - $50 N/A
Dual System12
$575 - $1,580 $260,000 - $900,000 1-12
See Table 36 and 37 for references.
The capital and operations and maintenance (O&M) costs were researched for each alternative water
supply option. The capital costs for household and community treatment include process, construction,
engineering and indirect costs, but do not include planning and preliminary alternative analysis costs
(U.S. EPA 2000; U.S. EPA 2005). Alternative supply cost estimates were estimated in accordance with
U.S. EPA cost estimation procedures (U.S. EPA 2000) and from historical project estimates.
Capital costs were converted to annualized capital costs ($/1,000 gallons or $/1 kgal) based on the
following equation:
Annualized Capital Cost ($/kgal) =
Technical Report 7: Alternative Water Supply Options 68
An amortization value of 0.0802 was used which corresponds with an interest rate ( ) of 5% over 20
years ( , represented by the following equation:
Amortization Factor =
Annual O&M costs were converted to annualize O&M costs based on the following equation:
Annualized O&M Cost ($/kgal) =
The total annualized cost of each alternative water supply option equals the sum of the annualized
capital and O&M costs.
5.1.1 Blending
To estimate blending costs for nitrate compliance, a report written by Kennedy/Jenks was used that
based “bid” cost estimates primarily for nitrate problems (Kennedy/Jenks 2004). They used a blending
design case for a 14 inch casing well with a flow rate range of 300-1,200 gpm and a well depth of 700.
This report uses the costs corresponding with flow rates of 300 and 600 gpm as the low and high
estimate for blending costs for a 1,000 household community. The cost for obtaining a new low-nitrate
source is not included in this cost estimate. The original capital and O&M costs are in 2003 dollars and
are projected to 2010 dollars using the 2010 ENR CCI. The capital cost incorporates the cost for the
basic blending facility and is estimated to cost about $131,000 for each flow rate. Indirect construction
costs such as engineering, contingency, and permitting costs were estimated to be about 25 percent of
the estimated bid costs (Kennedy/Jenks 2004). The O&M cost for blending water was estimated at $250
per acre-foot (af), costing approximately $50,000 and $100,000 (2003 dollars) annually for each flow
rate, respectively. Table 23 shows the resulting blending costs, with annual costs estimated as $83,000
and $148,000, for each flow rate, or $0.52 and $0.47 per kilogallon, respectively. These blending
estimates are for a 3,300 person (or 1,000 household) community, as blending is only recommended for
public water systems with more than one well and the ability to obtain a low-nitrate source.
Technical Report 7: Alternative Water Supply Options 69
Table 23. Estimated costs for blending.
Itemized Cost Low Estimate1 High Estimate
2
2003 Capital Cost3 $131,000 $131,000
Indirect Construction Cost4 $32,750 $32,750
2010 Capital Cost5 $216,000 $216,000
2010 O&M Cost6 $$65,000 $130,000
Annualized Cost ($/kgal)7 $0.52 $0.47
Annualized Cost ($/year)8 $83,000 $148,000
1 14" casing well at 700' deep, 300 gpm. A single blending station is assumed for each source. These costs are
based on similar projects implemented by Kennedy/Jenks, primarily for nitrate. 2
14" casing well at 700' deep, 600 gpm. A single blending station is assumed for each source. These costs are based on similar projects implemented by Kennedy/Jenks, primarily for nitrate. 3
Capital costs include the construction "bid" costs for constructing the blending facilities. 4
25% indirect construction costs. 5
The 2003 Capital Costs plus 25% Indirect Construction Cost and projected to 2010 costs using the 2010 ENR CCI. 6
A major O&M cost is the cost of obtaining low-nitrate blending water. These O&M costs assume that there is already an uncontaminated source available for blending. The O&M costs were developed for electrical power, labor, maintenance materials, resin replacement, and monitoring. Labor rates were estimated at an average of $40 per hour, electricity rates were estimate at $0.12/kWh and an annual allowance for maintenance materials was estimated at 1 percent of total capital costs. The average O&M cost within the well range was chosen and projected to 2010 costs using the 2010 ENR CCI. 7
The cost is annualized over a 20 year period with a 5% annual interest rate and expressed as dollar per kilogallon produced. 8
The cost is annualized over a 20 year period with a 5% annual interest rate.
5.1.2 Drilling a Deeper Well
The lower bound cost estimates for drilling a deeper well are from a Background Information Document
(BID) from U.S. EPA that provides well drilling cost estimates (U.S. EPA 2001). For a domestic well
(assumed 10 gpm, 8 inch casing well), the drilling costs are about $50 per foot; and for a public supply
well (assumed 700 gpm, 14 inch casing well), the drilling costs are about $110 per foot. Chris Johnson, a
principal hydrogeologist, advises that drilling a deeper well can cost almost as much as drilling a new
well and provided the upper bound cost estimates of $200 per foot for a domestic well and $1,000 per
foot for a public supply well (Johnson 2011). Table 24 shows the estimated costs for drilling a deeper
well based on these two references.
Technical Report 7: Alternative Water Supply Options 70
Table 24. Estimated costs for drilling a deeper well.1
Itemized Cost Self-Supplied Household Public Water System
Annualized Cost ($/yr) $860 - $3,300 $84,000 - $98,000 1 The lower bound estimates are from the U.S. EPA Yucca Mountain BID Document: Well Drilling
and Pumping Costs (U.S. EPA N.D.). A domestic well is assumed to be a 10 gpm, 8 inch casing well, originally 300 feet deep and deepened to 500 feet. A public supply well is assumed to be a 700 gpm, 14 inch casing well, originally 500 feet deep and deepened to 700 feet.
5.1.3 Drilling a New Well
The annualized total cost for drilling a new domestic well is based on cost estimates provided by an
experienced senior geologist, and is shown in Table 25. The U.S. EPA 2007 Survey and Assessment was
used for estimating the costs for drilling a new public supply well, shown in Table 26. New public supply
well costs include pump and appurtenances, but do not include well houses. The Survey and
Assessment provides the following cost functions for new wells and for rehabilitating existing wells (U.S.
EPA 2007):
D is the design capacity of the well in millions of gallons per day (mgd), and e represents the exponential
function (approximately 2.72) (Goldstein et al. 2006).
The annual O&M cost is assumed to be included in the model. With these functions, rough cost
estimates can be made for the lower bound of system categories and a multiplication factor of seven is
applied to estimate the upper bound cost. Estimated costs for a new public supply well are listed in
Table 26 and estimated costs for public supply well rehabilitation are listed in Table 27.
Table 25. Annualized total cost ranges for drilling a new domestic well.
Option Drill a New Well1
Initial Capital Cost ($/hhld) $25,000 - $40,000
Annual O&M Cost ($/hhld) $60
Total Annualized Cost ($/kgal) $16.17 - $25.59
Total Annualized Cost ($/hhld) $2,100 -$3,300 1
Initial Capital Cost Estimates from David W. Abbott, Senior Geologist at Todd Engineers (Abbott 2011). Annual O&M Estimate: Assumed 300 foot well depth, 0.6 pump efficiency, and $0.15/kWh. Annualized over 20 years.
Technical Report 7: Alternative Water Supply Options 71
Table 26. Annualized total cost ranges for drilling a new public supply well.
U.S. EPA System Size Classification Low Cost Range for a New Well ($/kgal)
1
High Cost Range for a New Well ($/kgal)
2
Very Small (25 - 500 people) $0.44 - $1.60 $3.11 - $11.17
U.S. EPA 2007 Drinking Water Infrastructure Needs Survey and Assessment. 2
U.S. EPA 2007 Drinking Water Infrastructure Needs Survey and Assessment multiplied by a factor of 7 to estimate engineering fees, well demobilization, etc.
Table 27. Annualized total cost ranges for public supply well rehabilitation.
U.S. EPA System Size Classification Low Cost Range for Well Rehabilitation ($/kgal)
U.S. EPA 2007 Drinking Water Infrastructure Needs Survey and Assessment. 2
U.S. EPA 2007 Drinking Water Infrastructure Needs Survey and Assessment multiplied by a factor of 7 to estimate engineering fees and other contingencies.
5.1.4 Community Treatment
The estimated costs for system application of ion exchange and reverse osmosis are shown in Table 28.
Cost ranges shown are compiled from detailed literature review and survey responses, as described in
Technical Report 6 (Jensen et al. 2012), and represent the lowest and highest cost found for each system
size. Any inconsistencies in cost ranges are attributed to the lack of cost information currently available.
The economies of scale exist with ion exchange and reverse osmosis treatment systems as the cost per
kilogallon decreases with increasing capacity. The cost per unit of produced water decreases as system
size increases, however larger treatment systems incur higher total capital and O&M costs. Ion
exchange is the cheaper option. Refer to Technical Report 6 (Jensen et al. 2012) for additional details on
treatment costs.
Technical Report 7: Alternative Water Supply Options 72
Table 28. Annualized total cost ranges for groundwater treatment systems.1
U.S. EPA System Size Classification
Annualized Total Cost Range for Ion
Exchange [$/kgal]
2
Annualized Total Cost Range for Ion
Exchange [$/yr]
2
Annualized Total Cost Range for
Reverse Osmosis [$/kgal]
Annualized Total Cost Range for
Reverse Osmosis [$/yr] (population)
Very Small $0.62 - $4.60 $2,100 - $285,000
$0.69 - $19.16 $2,300 - $1.2 M
(< 501)
Small $0.30 - $2.73 $21,000 - $1.1 M
$0.58 - $1.34 $36,000 - $533,000
(501 - 3,300)
Medium $0.36 - $2.04 $143,000 - $2.4 M
$1.35 - $3.39 $537,000 - $4.0 M
(3,301 - 10,000)
Large $0.22 - $1.81 $258,000 - $20.1 M
$0.73 - $3.67 $855,000 - $40.8 M
(10,001 - 100,000) 1 Cost information is an excerpt from Technical Report 6 (Jensen et al. 2012).
2 Disposal costs were not included in the U.S. EPA cost estimates of IX for arsenic removal (used to estimate nitrate
removal).
U.S. EPA’s 2007 Drinking Water Infrastructure Needs Survey and Assessment estimate the cost for a
SCADA system by the following equation:
The e is the exponential function (approximately 2.72).21 The lower bound annualized cost of SCADA
infrastructure was estimated and is shown in Table 29. As the system size increases the cost for SCADA
becomes more affordable.
Table 29. Lower bound annualized cost of SCADA infrastructure.1
U.S. EPA System Size Classification
Annualized Total Cost for SCADA Infrastructure
[$/kgal]
Annualized Total Cost for SCADA Infrastructure
[$/yr]
Very Small (25 - 500 people) $4.99 $11,400
Small (501 - 3,300 people) $1.06 $49,000
Medium (3,301 - 10,000 people) $0.42 $116,000
Large (10,001 - 100,000 people) $0.23 $633,000 1 U.S. EPA Drinking Water Infrastructure Needs Survey and Assessment (2007).
5.1.5 Household Treatment
The 2010 U.S. EPA POU/POE cost model was used to estimate the costs for installing a reverse osmosis
POU device. The cost model assumes an average per capita water consumption of 100 gallons per
21 Goldstein, Lay, Schneider, and Asmar, Brief calculus and its applications, 11
th ed., Prentice-Hall, 2006.
Technical Report 7: Alternative Water Supply Options 73
person per day, 2.6 people per household, a discount rate of 7%, and a discount period of 10 years (the
lifetime of the unit) (U.S. EPA 2010). The cost model includes equipment installation, laboratory
analyses, indirect capital costs, equipment maintenance, and public education and outreach. Table 30
shows the estimated cost per household for installing a reverse osmosis POU unit for one household and
for 1,000 households. The lower bound estimate does not incorporate the public education and
outreach that is required for systems using a POU device for emergency purposes to comply with
drinking water quality standards (discussed in Section 7 Regulatory and Implementation Implications).
For a self-supplied household it is cost-effective to not incorporate public education and outreach;
however, for a 1,000 household (or connection) public water system it would be beneficial to
incorporate public outreach to educate the user and ensure proper procedures are followed.
Table 30. U.S. EPA reverse osmosis POU device cost estimates.
Options RO POU Cost Estimate
(Single Household)1
RO POU Cost Range (1,000 Household System)
1
Initial Capital Cost ($/hhld) $406 - 1,981 $493 - $494
Uses the 2010 U.S. EPA Cost Estimate Tool for an NSF/ANSI Certified RO Unit for nitrate treatment. The lower bound estimate includes unit purchase, installation, scheduling time, indirect costs (permitting, pilot testing, legal, engineering, and contingency) and all associated operations and maintenance costs. The upper bound estimate includes all listed above and public education (technical and clerical labor and printed material for all public outreach/education efforts). The tool allows for economies of scale.
For comparison, a quote from Culligan estimates a typical nitrate filter to cost about $360 per year
including maintenance for one household, cost details are shown in Table 31 (Culligan 2011). The total
annualized cost ($/kgal) is greater than the U.S. EPA cost model estimates because of the difference in
maximum potable water consumption. Culligan also rents RO POU devices for about $26 to $36 per
month, plus filter replacement and service fees (Culligan 2011). An RO POU device is estimated to cost
between$250 and $360 annually discounted over 10 years at a rate of 0.07. For households unable to
pay the initial capital, the next best option would be to rent a NSF/ANSI certified RO POU device for at
least $430 per year (plus filter replacement and service fees).
Technical Report 7: Alternative Water Supply Options 74
Table 31. Culligan reverse osmosis POU device cost estimates.
Options RO POU Cost Range
(1 hhld)1
Initial Capital Cost ($/hhld) $1,200
Annual O&M Cost ($/hhld) $191
Total Annualized Cost ($/kgal/hhld) $39.67
Total Annual Cost ($/hhld) $362 1
Culligan offers a lifetime warranty on the membrane and pre-filters. It costs about $1,100 to $1,200 to purchase the unit and the pre-filter needs to be replaced every 18 months and the main filter needs to be replaced every 3 years (all factored into the costs listed). The maximum potable water consumption of 25 gallons and a discount rate of 0.07 and discount period of 10 years are assumed.
Currently, there is no POE unit certified for treating nitrate so the U.S. EPA Cost Estimate Tool for an
NSF/ANSI Certified POE unit for treating Radium was used to estimate the annual cost of a POE device.
The U.S. EPA Cost Estimate Tool provides an annualized cost of $397 for one household to install and
maintain a POE device (U.S. EPA 2010). This includes the unit purchase, installation, scheduling time,
indirect costs (permitting, pilot testing, legal, engineering, and contingency) and all associated
operations and maintenance costs. Future research is necessary to evaluate the true cost of a POE
device used for treating nitrate. The costs for POU and POE devices are further discussed in Section
5.2.1 Self-Supplied Households or Local Small Water Systems.
5.1.6 Connect to an Alternative System
Most costs for a system to connect to an alternative system are for installing the pipeline. An estimated
pipeline cost of $61 per foot (Monterey County Environmental Health 2010b) and a connection fee on
the order of $100,000 are assumed for estimating the costs of connecting to an alternative system.
Table 32 represents the annualized cost range estimates for a system with 1,000 connections to connect
to an alternative system. The low estimate (or lower bound) is solely pipeline costs and a connection
fee and the high estimate (or upper bound) includes pipeline costs, a connection fee, and engineering
and administration costs as 43% of the capital (Summers Engineering 2011). These costs are essentially
the same if a single household connects to a public water system (estimates shown in Table 22 and
Table 36 used a $9,000 connection fee for a self-supplied household); however, the party responsible for
the costs would vary by system size and acquisition policies. More involved mergers with a larger
system will often require significant additional upgrades to the smaller distribution system.
Technical Report 7: Alternative Water Supply Options 75
Table 32. Estimated annualized cost ranges for a system with 1,000 connections to connect to an alternative
Pipeline costs at $61 per foot for 1,000 households. 2
Excerpt from Kettleman City Proposed Surface Water Treatment Plant and Commercial Tank Facility (March, 2011) (Summers Engineering 2011). 43% of the Subtotal: 15% Construction Contingencies; 2% Construction Application, CDPH Information & Labor and Compliance Monitoring; 2% Environmental Documentation & Legal Review; 10% Design & Project Bidding; 7% Project Administration; 5% Project Inspection; and 2% Project Surveying & Geotechnical Testing.
3 Lower bound includes pipeline and $100,000 connection fee. Upper bound includes pipeline, $100,000
connection fee, and engineering and administration costs. Costs are discounted over 20 years at a 5% discount rate. 4
Assumes a consumption rate of 350 gallons per household per day. 5
Total annualized cost divided by 1,000 households.
5.1.7 Trucked Water
An estimate from RMR Water Trucks for providing their water trucks for service is used for estimating
the delivered trucked water costs (RMR Trucks 2010):
($100/hr truck driver)* (x hr travel time) + (truck size (gal))*($0.xx/gal of nearby water supply)
Estimates are provided for a small community public water system serving 1,000 households and for a
single household located in Tulare County. The estimated cost for providing a community in Tulare
County with a single RMR 7,000 gallon water truck (travel time is estimated as 4 hours roundtrip and a
nearby water supply is assumed to cost $0.35 per gallon) is about $2,850, or $410/kgal. Assuming one
household uses about 2.25 gallons per day,22 1,000 households (or a small community water system)
would receive water for about three days ($2.85/household). It would cost approximately $350,000 to
provide 1,000 households with trucked potable water for one year. To provide one household with
water, a 500 gallon RMR truck would cost $575 ($1,150/kgal), and would provide the household with
water for 222 days (assuming storage is available). It would cost approximately $950 to provide one
household with trucked potable water for one year.
5.1.8 Bottled Water
To estimate the cost of bottled water, the National Academy of Sciences Hydration Study (2004) was
used, assuming 3.3 people per household and predicting about 2.25 gallons per household-day needed
22 NAS Hydration Study Estimate – 3.3 people per household.
Technical Report 7: Alternative Water Supply Options 76
for potable uses. Vended or bottled water can cost $0.25 to $1.30 per gallon, not including
transportation costs (Pacific Institute et al. 2010). A common low price for water delivered near the city
of Visalia by Alhambra Water is a 5 gallon bottle at $1.63 per gallon (Alhambra Water 2010). The annual
cost for a household receiving Alhambra Water is about $1,260. For accuracy and consistency, this cost
estimate is used as the cost of bottled water in this report.
5.1.9 Relocate to Area with Better Water Supply
To estimate the costs of relocating a community to an area with a better water supply, the true market
value of houses in each respective county is evaluated. The range of average listing prices for houses in
each county is shown in Table 33 and the median value of average ranges is used to estimate the cost of
relocating a single household (Trulia 2011). To better represent Salinas Valley, the City of Salinas’
average listing prices will be used, instead of Monterey County. Cost scenarios for relocating
households are shown in Table 34, and the average cost across the study area to relocate one household
is $188,000. Using this average, it would cost about $2 billion to relocate the susceptible population on
self-supplied and local small water systems (about 10,000 households). It is estimated to cost $37.6
million to relocate 200 households per county. The costs for relocating a household will differ slightly
between a homeowner and a renter. Renters should be cheaper to move if the County condemns the
property and there may also be less attachment or sentimental value to the home. However, the total
loss involved in relocation is probably similar for both homeowners and renters.
Table 33. Average listing prices for homes in study area counties.
County Range of Average Listing Prices for Houses ($1,000)1
Total Annualized Cost ($/year)8 $550,000 - $900,000
Household Total Annualized Cost ($/hhld-year)9 $550 - $900
1 Costs are discounted at a 5% discount rate, over a 20 year period.
2 Assumes a water system serves 1,000 households, with 3.3 people per household, and uses 0.20 million
gallons of potable water per day, including showering and toilet flushing (112 gallons per capita per day) (Gleick 2003). 3
Monthly water supply cost for California Water Company in Visalia. 4
Costs for treating 0.20 mgd of water using an ion exchange treatment system - includes O&M costs (Technical Report 6, Jensen et al. 2012). 5
Assumes 6” pipe costs $61 per foot and does not include excavation costs. Lower bound estimate uses 5 miles of pipeline and upper bound estimate uses 10 miles of pipeline (Granite Ridge Regionalization Feasibility Study, 2010). 6
Rough cost estimates provided by ZURN and an experienced plumber for PEX piping to be installed in a 1200 sq. ft. 3 bed, 2 bath house within the kitchen and both bathrooms. The lower bound estimate is for a tract type house with raised wood floors (ease of “popping” pipes through the floor cabinets), and the upper bound estimate is for a slab house (requiring the sheet rock to be cut, patched and painted after installation). This is a rough estimate and each house will vary based on the chosen plumber’s site estimate. 7
Excerpt from Kettleman City Proposed Surface Water Treatment Plant and Commercial Tank Facility (March, 2011). 43% of the Subtotal (treatment, pipeline, and re-plumbing costs): 15% Construction Contingencies; 2% Construction Application, CDPH Information & Labor and Compliance Monitoring; 2% Environmental Documentation & Legal Review; 10% Design & Project Bidding; 7% Project Administration; 5% Project Inspection; and 2% Project Surveying & Geotechnical Testing. 8
Total annualized cost for all items. Lower bound estimate provides costs for a 1,000 connection system with a service area having a 5 mile distance and consisting of only tract type houses (the economies of scale involved in community tract type housing is ignored here, but could be represented in a true situation where dual plumbing occurs for a whole development). Upper bound estimate provides costs for a 1,000 connection system with a service area having a 10 mile distance and consisting of only slab houses. 9
Total annualized cost per household.
5.1.11 Well Water Quality Testing
PurTest sells a water test kit for bacteria and nitrate based on U.S. EPA methods for $13 with a basic
knowledge booklet that could be used for domestic well users (Home Depot 2011). The Environmental
Health Investigations Branch of CDPH estimates certified laboratory water quality tests to cost
approximately $50 for testing a private well (CDHS 2000). It is recommended that private wells are
sampled once a year, preferably between April and July when nitrate levels are generally the highest
(CDHS 2000).
Technical Report 7: Alternative Water Supply Options 79
These two estimates are the lower and upper bound estimates for domestic well water quality testing.
County-specific estimates for a State-certified laboratory can be found on the CDPH Environmental
Laboratory Accreditation Program (ELAP) website.
5.1.12 Summary of Alternative Water Supply Costs
The economic feasibility of each option will vary based on the effectiveness, benefits, savings, and costs
expected from a candidate system. This section only summarizes the expected costs for alternative
water supply options, but a true engineering analysis will include economic feasibility studies examined
over a project’s lifetime. The alternative water supply options for providing a self-supplied household
with low-nitrate water all year, ranked from least expensive to most expensive, typically are to:
1) install a POU RO unit;
2) drill a deeper well;
3) install a dual water system;
4) purchase bottled water;
5) drill a new well;
6) relocate the household; and
7) install pipeline and connect to an existing system.
The estimated costs for self-supplied household alternative water supply options are shown in Table 36.
The alternative water supply options for providing a small community public water system (serving
1,000 households) with low-nitrate water all year, ranked from least expensive to most expensive,
typically are to 1) drill a new well; 2) install a pipeline and connect to an existing system; 3) drill a deeper
well; 4) implement a community groundwater treatment system; 5) blend sources; 6) provide
households with POU RO units; 7) construct a dual water distribution system; 8) purchase bottled water;
and 9) relocate households. The estimated costs for alternative water supply options for a small
community public water system are shown in Table 37. The analysis performed here is general and
includes many necessary assumptions. The costs for each option need to be assessed on a system
specific basis before selecting the most economical option.
The estimated annual O&M cost ranges for alternative water supply and treatment options that include
O&M are shown in Table 38. The cost ranges are shown as percent of the total annualized cost to
reflect the wide range of researched and surveyed cost data gathered. For the estimated basin-wide
solutions (Section 6 Basin-wide Costs of Nitrate Contamination), the average percentage of O&M is
applied to each solution to roughly estimate the basin-wide O&M cost.
The lifetime of each alternative will vary depending on the existing water quality, soil properties, water
usage, and existing source supply. An alternative should be evaluated on the least cost and lifetime of
the system before choosing the best option for implementation. If a system blends sources to provide
nitrate compliant water, the duration of the solution will last only as long as the low-nitrate source
remains low and proper source ratios are maintained. Nitrate contamination and the associated
groundwater degradation are expected to worsen over the next few decades and it is reasonable to
Technical Report 7: Alternative Water Supply Options 80
expect that, over time, a low-nitrate source will approach the MCL. If an existing well is drilled deeper
into a different aquifer, the lifetime of the safe supply will depend on the time it takes for nitrate in
shallow groundwater to reach the new depth. There is the risk of the existing shallow nitrate migrating
down and there is the risk of increased nitrate found at the new depth. If a new well is properly
designed, constructed, developed and completed, it can last for up to 50 years (Harter 2003); however,
pumping from a new well can quickly draw down an aquifer and draw nitrate into the existing safe
supply. Depending on the type of treatment chosen (IX or RO), a community treatment system can last
for 20 years (with the proper maintenance and membrane and resin lifetime will vary with water quality
and pretreatment measures). With proper maintenance and replacement of filters, a household
treatment system can last up to 10 years. Connecting to an alternative system ensures that future
problems of nitrate contamination (or other water quality contaminants) can be managed more easily
due to economies of scale. Switching to surface water shifts the problem of nitrate contamination in
groundwater to other contaminants (i.e., giardia lamblia and cryptosporidium parvum) which will need
to be addressed with surface water treatment. Constructing a dual water distribution system on a
community public water system scale treats less water, expends less energy, and conserves resources.
Table 36. Summary of the estimated alternative water supply costs for self-supplied households.
Option Estimated Annual Cost Range For a Self-Supplied Household
1
IMPROVE EXISTING WATER SOURCE
Blending2
N/A
Drill Deeper Well3
$860 - $3,300
Drill a New Well4
$2,100 - $3,300
Community Supply Treatment5 N/A
Household Supply Treatment 6
$250 - $360
ALTERNATIVE SUPPLIES
Pipeline and Connection to an Existing System7 $52,400 - $185,500
Trucked Water 8
$950
Bottled Water9
$1,339
RELOCATE HOUSEHOLDS10
$15,090
ANCILLARY ACTIVITIES
Well Water Quality Testing11
$15 - $50
Dual Water System12
$574 - $1,582 1
All costs are discounted over a 20 year period at a 5% discount rate, except for the RO POU estimate and trucked and bottled water costs. 2
Blending is only considered for public water systems with more than one source. 3
The lower bound estimate is from the U.S. EPA Yucca Mountain BID (U.S. EPA N.D.) with estimated drilling costs of $50 per foot. The upper bound estimate is a quote from an experienced hydrogeologist, Chris Johnson; estimated drillings costs of $200 per foot. Annual O&M costs estimated using a pumping well energy equation and assuming $0.15/kWh. 4
Capital costs estimated from senior geologist David Abbott (Abbott 2011). Annual O&M costs estimated using a pumping well energy equation and assuming $0.15/kWh. 5
Community supply treatment only refers to community drinking water systems (≥15 connections). 6
Uses the 2010 U.S. EPA Cost Estimate Tool for 1 NSF/ANSI Certified Reverse Osmosis Point-of-Use Unit. The lower bound estimate includes unit purchase, installation, scheduling time, indirect costs (permitting, pilot testing, legal, engineering, and contingency) and all associated operations and maintenance costs. The upper bound estimate includes all lower bound costs plus public education (technical and clerical labor and printed material for all public outreach/education efforts). Assumes a 10 year lifespan for the unit and is discounted for
Technical Report 7: Alternative Water Supply Options 81
10 years at a 7% discount rate. 7
Only considers the costs for installing pipeline and the connection fees for connecting to an existing system that has a safe drinking water supply. The lower bound estimate assumes pipeline costs of $61 per foot for a distance of 2 miles, and a $9,000 connection fee per household. The upper bound estimate assumes pipeline costs of $61 per foot for a distance of 5 miles, and a $9,000 connection fee plus engineering and administration costs (43% of the pipeline costs). 8
Assumes a 500 gallon RMR Water Truck travels from Castaic to Tulare County for a 4 hour roundtrip at $100/hour and purchases 500 gallons of a local, safe drinking water supply at $0.35 per gallon. A one-time 500 gallons cost. Does not include the cost for storage. 9
Assumes Alhambra in Visalia delivers 5 gallons of “Crystal Fresh” water to a location in Visalia with 3 people per household. Each person consumes about 0.7 gallons per day for 365 days. 10
The median listing prices for houses in each county (City of Salinas was used instead of Monterey County) were examined and the average listing for a house in the study area is estimated to be $188,000 (trulia.com). 11
Well water quality test for nitrate and bacteria from PurTest sold at Home Depot ($13) and CDPH estimate of $50 for a private well nitrate sample from a State-certified laboratory. All public water systems (≥ 15 connections) are already required to sample and monitor their water. 12
Lower bound estimate is the U.S. EPA POU Cost Estimate tool plus the monthly cost of the contaminated supply and the upper bound estimate is the cost for bottled water (Culligan – 5 gallon bottle) plus the monthly cost of the contaminated supply (Visalia Community Water Center is used for the reference, however this is not meant to suggest that Visalia CWC’s water is contaminated).
Table 37. Summary of the estimated alternative water supply costs for a small water system (1,000
households).
Option Estimated Annual Cost Range For a Small Water System (1,000 hhlds)
1
IMPROVE EXISTING WATER SOURCE
Blending2
$200,000 - $365,000
Drill Deeper Well3
$80,000 - $100,000
Drill a New Well4
$40,000 - $290,000
Community Supply Treatment5 $95,000 - $105,000
Household Supply Treatment6
$223,000
ALTERNATIVE SUPPLIES
Pipeline and Connection to an Existing System7
$59,700 - $192,800
Trucked Water8
$2,850
Bottled Water9
$1.34 M
RELOCATE HOUSEHOLDS10
$15.1 M
ANCILLARY ACTIVITIES
Dual Water Distribution System11
$500,000 - $900,000 1
All costs are discounted over a 20 year period at a 5% discount rate, except for the RO POU estimate and trucked and bottled water costs. 2
A 14” casing well with flow rates of 300 gpm (lower bound estimate) and 600 gpm (upper bound estimate) and well depth of 700 feet. Does not include the cost of obtaining a low-nitrate source. O&M for blending estimated at $250 per acre-foot and indirect costs are estimated to be about 25% of the estimated bid costs. Kennedy/Jenks (2004) “bid” cost estimates primarily based on nitrate problems. 3
The lower bound estimate is from the U.S. EPA Yucca Mountain BID (U.S. EPA N.D.) with estimated drilling costs of $110 per foot. The upper bound estimate is a quote from an experienced hydrogeologist, Chris Johnson; estimated drillings costs of $1,000 per foot. Annual O&M costs estimated using a pumping well energy equation and assuming $0.15/kWh. 4
Costs estimated from the 2007 U.S. EPA Drinking Water Infrastructure Needs Survey & Assessment (O&M assumed to be included in the cost model); projected to 2010 dollars using the 2010 ENR CCI. The upper bound estimate is from applying a multiplication factor of 7 to estimate engineering fees, well demobilization, etc. 5
Cost estimates from Technical Report 6 (Jensen et al. 2012). Disposal costs were not included in the U.S. EPA cost estimates of ion exchange for arsenic removal (that was used to estimate nitrate removal).
Technical Report 7: Alternative Water Supply Options 82
6 Uses the 2010 U.S. EPA Cost Estimate Tool for 1,000 NSF/ANSI Certified Reverse Osmosis Point-of-Use Unit.
The lower bound estimate includes unit purchase, installation, scheduling time, indirect costs (permitting, pilot testing, legal, engineering, and contingency) and all associated operations and maintenance costs. The upper bound estimate includes all lower bound costs plus public education (technical and clerical labor and printed material for all public outreach/education efforts). Assumes a 10 year lifespan for the unit and is discounted for 10 years at a 7% discount rate. 7
Only considers the costs for installing pipeline and connection fees for connecting to an existing system that has a safe drinking water supply. The lower bound estimate assumes pipeline costs of $61 per foot for a distance of 2 miles, and a $100,000 connection fee. The upper bound estimate assumes pipeline costs of $61 per foot for a distance of 5 miles, and a $100,000 connection fee plus engineering and administration costs (43% of the pipeline costs). 8
Assumes a 7,000 gallon RMR Water Truck travels from Castaic to Tulare County for a 4 hour roundtrip at $100/hour and purchases 7,000 gallons of a local, safe drinking water supply at $0.35 per gallon. 9
Assumes Alhambra in Visalia delivers 5 gallons of water to a location in Visalia with 3 people per household. Each person consumes about 0.7 gallons per day for 365 days. 10
The median listing prices for houses in each county (City of Salinas was used instead of Monterey County) were examined and the average listing for a house in the study area is estimated to be $188,000 (trulia.com). 11
Lower bound estimate is the cost of the contaminated supply, the cost for treating 0.20 mgd (Gleick 2003) for 1,000 households assuming 3.3 people per household, a system pipeline distribution distance of 5 miles, PEX plumbing through tract type houses with raised wood flooring (2 bathrooms and 1 kitchen is re-plumbed per house), and a 43% engineering and administration fee. Upper bound estimate is the cost of the contaminated supply, the cost for treating 0.20 mgd (Gleick 2003) for 1,000 households assuming 3.3 people per household, a system pipeline distribution distance of 10 miles, PEX plumbing through slab houses (2 bathrooms and 1 kitchen is re-plumbed per house), and a 43% engineering and administration fee.
Table 38. Estimated O&M and capital cost ranges for alternative water supply options as percentage of total
Conventional Surface Water Treatment 15% - 50% 33% 50% - 85% 67% 1Refer to references shown in Tables 23-37.
5.2 Least Cost Management
Most alternative water supply option costs largely depend on the size of the system. Even if a system
receives assistance in financing the capital costs for an alternative solution, such as treatment, the
solution’s sustainability can be threatened by high annual O&M costs. To assess the lasting viability of
each alternative, in this section the previously discussed cost estimates are compared broadly, and least
cost management alternatives are highlighted. The least cost management discussion is divided into
domestic well water systems (self-supplied households or local small water systems) and public water
systems. This section compares costs for self-supplied households or local small water systems on a
cost per household and cost per kilogallon scale. Similarly, the costs for community public water
systems are given on a cost per kilogallon and cost per household, but are compared on a system size
scale.
Technical Report 7: Alternative Water Supply Options 83
5.2.1 Self-Supplied Households or Local Small Water Systems
The estimated costs for alternative solutions for self-supplied households and local small water systems
are shown in Table 39 with the total annualized costs displayed per household and per kilogallon of
water. The primary feasible options available to a household or local small water system are to
purchase bottled water, install a POU device, drill a new well, or deepen an existing well. The least to
most expensive cost alternative for households is to:
install a reverse osmosis POU treatment device, estimated to cost $250 per year (not including any
public outreach or education);
install a POE device; however, currently no POE devices are NSF/ANSI certified for removing nitrate
from drinking water (the estimate given in Table 39 is for treating Radium);
drill a deeper well; however, the user must continually test and monitor the well to make sure the
nitrate contamination does not reach the new depth.
Figure 25 shows the annualized cost curves of each option and highlights the cost-effective option for
expected water use or consumption. If a household only requires low-nitrate potable water, a POU
device is the less expensive solution. However, if a household desires to treat more than 18 gallons of
water per day, a POU device is no longer cost-effective, and installing a POE device is preferred. The
cost curves do not represent the actual maximum potable water consumption per day for filter pumping
capacity, which varies by manufacturer (i.e., Culligan has a maximum of 25 gallons per day).
Technical Report 7: Alternative Water Supply Options 84
Table 39. Estimated household costs for alternative solutions for self-supplied households or local small water
systems.
Option Bottled Water
1
Drill a New Well
2
Drill a Deeper Well
3 POE
4 POU
5
Initial Capital Cost ($/hhld) 0 $40,000 $25,000 $2,222 $406
Annual O&M Cost ($/hhld) 0 $60 $232 $109 $197
Total Annualized Cost ($/kgal) $1,630 $25.59 $17.52 $5.12 $3.01
Total Annualized Cost ($/hhld) $1,260 $3,300 $2,238 $397 $250 1
Quote from Alhambra, Visalia for drinking water delivered in 5 gallon bottles (Alhambra Water 2010). Assumed units of water consumption from NAS Hydration Study. 2
Initial Capital Cost Estimate: Upper bound estimate of David W. Abbott, Senior Geologist at Todd Engineers (Abbott 2011). Annual O&M Estimate: Assumed 300 foot well depth, 0.6 pump efficiency, and $0.15/kWh. Annualized over 20 years. 3
Initial Capital Cost Estimate: Average estimate of U.S. EPA Yucca Mountain BID (U.S. EPA N.D.) and Chris Johnson, hydrogeologist (Johnson 2011). Annual O&M Estimate: Assumed 500 foot well depth (originally 300 feet, drilled 200 feet deeper), 0.6 pump efficiency, and $0.15/kWh. 4
Uses the U.S. EPA Cost Estimate Tool for an NSF/ANSI Certified POE Unit for treating Radium. Includes unit purchase, installation, scheduling time, indirect costs (permitting, pilot testing, legal, engineering, contingency) and all associated operations and maintenance costs.**A POE Unit has not been certified for water systems to distribute so the U.S. EPA Tool does not have a Unit capable of treating nitrate for estimating the cost. Future research is necessary to evaluate the true cost of a POE device. 5
Uses the U.S. EPA Cost Estimate Tool for 1 NSF/ANSI Certified ROU Unit for treating Nitrate. Includes unit purchase, installation, scheduling time, indirect costs (permitting, pilot testing, legal, engineering, contingency) and all associated operations and maintenance costs. Does not include public education/outreach costs.
Technical Report 7: Alternative Water Supply Options 85
Figure 25. Annualized total household cost for household self-supplied and local small water system alternatives.
Technical Report 7: Alternative Water Supply Options 86
5.2.2 Community Public Water Systems
The minimum and maximum ranges of cost estimates for community public water system categories
appear in Table 40 and Table 41, and the compiled cost ranges are shown in Table 42. The annualized
low and high cost in dollar per kilogallon ($/kgal) for each alternative is evaluated by U.S. EPA–
designated water system size (Table 40 and Table 41). The low cost case is the best case scenario for the
least complex system, and the high cost case is more realistic for what the real world average costs
would be when all external contingencies are included. For the low cost case, a groundwater treatment
facility is the cheapest alternative per kilogallon for very small and small systems. For medium systems,
the cost for installing a pipeline to a nearby system becomes very cost-effective, with groundwater
treatment and drilling a new well as the next least cost options. POU RO devices are only cost-effective
for systems with less than 3,300 people; this coincides well with the 3-year emergency regulations that
only allow POU devices to be distributed to systems with less than 200 connections (discussed in Section
7 Regulatory and Implementation Implications). Bottled water costs more than all alternatives (per
thousand gallons). Table 40 and Table 41 represent connecting to a better water system only as the
pipeline costs and the connection costs are not included in the annualized cost.
For the high cost case, drilling a new well, installing a pipeline to a larger system, or installing a POU RO
device are the cheaper options for very small systems. For small and medium systems, a pipeline to a
larger system is the cheapest option per kilogallon, but depends on the distance to a nearby system as
only two miles of pipeline are assumed. The next best options for small and medium systems are to
implement a groundwater treatment facility or drill a new well. For large systems, the cost-effective
solutions are to drill a new well or implement groundwater treatment. Bottled water costs more than
all alternatives (per thousand gallons).
Figure 26 and Figure 27 graphically show the minimum annualized cost ($/kgal) of alternative options for
public water systems; Figure 27 includes pipeline costs and excludes SCADA costs. Similar to the cost
table results, Figure 26 shows that for small and medium systems groundwater treatment is the most
cost-effective. For medium and large systems an ion exchange treatment facility or a new well are most
cost-effective. SCADA costs are shown for treatment and system size comparison. Figure 27 includes
the option to construct five miles of pipeline for connecting to another water system or drilling a new
well in a low-nitrate location. The economies of scale for pipeline costs can be observed for systems
serving more than 3,300 people as pipeline costs decline to less than reverse osmosis costs. A
groundwater system with ion exchange remains the cheapest option; however, piping to another
system allows a water system to share treatment with a larger entity (i.e., certified operators would
already be hired) and the O&M costs would be distributed over a larger population base. Medium and
large systems also can search for a low-nitrate source well near the existing system, instead of installing
ion exchange treatment.
Figure 28 shows the annualized household cost ($/hhld) of alternative options for public water systems,
including consolidation (a small system connecting to a larger system). Costs are shown for a system
Technical Report 7: Alternative Water Supply Options 87
with 2,000 connections (households) and include pipeline costs ($61/foot)24 and the estimated
connection fees (on the order of $150,000), and are discounted over 20 years with an annual discount
rate of 0.05. A 50% contingency was attributed to pipeline costs for external expenses, such as
permitting activities and legal fees. For a 2,000 connection system, the best option is to drill a new well
if the surrounding groundwater quality is acceptable for drinking water purposes. If drilling a new well is
not an available option, the next least expensive option is to connect to a larger system that is less than
eighteen miles away. If there are no larger systems less than eighteen miles away for a 2,000
connection system to connect to, then implementing an ion exchange system is the cost-effective
solution. The maximum distance for connecting to an alternative system will vary with varying system
sizes and connection cost estimates. The costs presented and discussed are rough estimates for
alternative supply option comparison.
24 Granite Ridge Regionalization Feasibility Study (Monterey County Environmental Health 2010b).
Technical Report 7: Alternative Water Supply Options 88
Table 40. Low cost ranges for a basin-wide cost analysis.
LOW COST RANGES Very Small Small Medium Large [Source]
System Population Range: (25 - 500 people) (501 - 3,300 people) (3,301 - 10,000 people) (10,001 - 100,000 people) [1]
POU System for Potable Uses $2.67 - $3.52 $2.51 - $2.67 $2.51 $2.51 [7]
Bottled Water for Potable Uses $1,630 $1,630 $1,630 $1,630 [8]
[1] U.S. EPA system size classification. [2] (U.S. EPA 2005). [3] (Jensen et al. 2012). These represent the best case scenario of the least complicated system including cheap waste residual
disposal and potential blending. Based on the literature and survey data, the average costs for the small and medium system were approximately the same ($0.35/kgal).
[6] (Monterey County Environmental Health 2010b). Does not include connection fee. [7] (U.S. EPA 2010). Annualized Capital Costs at 7% discount rate over 10 years. [8] (Alhambra Water 2010).
Technical Report 7: Alternative Water Supply Options 89
Table 41. High cost ranges for a basin-wide cost analysis.
HIGH COST RANGES Very Small Small Medium Large [Source]
System Population Range: (25 - 500 people) (501 - 3,300 people) (3,301 - 10,000 people) (10,001 - 100,000 people) [1]
POU System for Potable Uses $2.67 - $3.52 $2.51 - $2.67 $2.51 $2.51 [7]
Bottled Water for Potable Uses $1,630 $1,630 $1,630 $1,630 [8]
[1] U.S. EPA system size classification. [2] (U.S. EPA 2005). [3] (Jensen et al. 2012). [4] (Jensen et al. 2012). (8.25-10 mgd systems).
[5] (U.S. EPA 2007). [6] (Monterey County Environmental Health 2010b). Does not include connection fee. [7] (U.S. EPA 2010). Annualized Capital Costs at 7% discount rate over 10 years.
[8] (Alhambra Water 2010).
Technical Report 7: Alternative Water Supply Options 90
Table 42. Complete table of basin-wide alternative water supply options (minimum value of low range and maximum value of high range).
Very Small Small Medium Large [Source]
System Population Range: (25 - 500 people) (501 - 3,300 people) (3,301 - 10,000 people) (10,001 - 100,000 people) [1]
New Well + 2 Miles of Pipeline $1.24 - $25.90 $0.30 - $3.70 $0.14 - $1.40 $0.06 - $0.80 [5,6]
Annualized Total Cost for POTABLE
USES only ($/kgal):
POU System for Potable Uses $2.67 - $3.52 $2.51 - $2.67 $2.51 $2.51 [7]
Bottled Water for Potable Uses $1,630 $1,630 $1,630 $1,630 [8]
[1] U.S. EPA system size classification. [2] (U.S. EPA 2005). [3] (Jensen et al. 2012). [4] (Jensen et al. 2012). (8.25-10 mgd systems). [5] (U.S. EPA 2007).
[6] (Monterey County Environmental Health 2010b). Does not include connection fee. [7] (U.S. EPA 2010). Annualized Capital Costs at 7% discount rate over 10 years. [8] (Alhambra Water 2010).
Technical Report 7: Alternative Water Supply Options 91
Figure 26. Annualized cost ($/kgal) for community public water system alternatives (excluding pipeline costs).
Figure 27. Community public water system annualized cost comparison ($/kgal) for alternative water supply
option (including pipeline for connecting to a nearby system and excluding SCADA costs).
1
$-
$0.50
$1.00
$1.50
$2.00
$2.50
$3.00
$3.50
$4.00
$4.50
$5.00
Very Small (25-500people)
Small (501-3,300 people) Medium (3,301-10,000people)
Large (10,001-100,000people)
$/k
gal
System Size
Reverse Osmosis
Ion Exchange
New Well Drilling
SCADA (ancillary activity)
$-
$0.50
$1.00
$1.50
$2.00
$2.50
$3.00
$3.50
$4.00
$4.50
$5.00
Very Small (25-500 people) Small (501-3,300 people) Medium (3,301-10,000people)
Large (10,001-100,000people)
$/k
gal
System Size
Reverse Osmosis
Ion Exchange
New Well Drilling
New Well + 5 Miles of Pipeline
5 Miles of Pipeline
$58.24 $56.65
Technical Report 7: Alternative Water Supply Options 92
Figure 28. Annualized cost comparison ($/hhld) of alternative water supply options for a 2,000 connection
community public water system.
These cost estimates (Table 39, Table 42, Figure 26, Figure 27, and Figure 28) are used to discuss the
basin-wide cost estimates for providing alternative solutions to the population susceptible to nitrate
contamination in the Salinas Valley and Tulare Lake Basin (discussed in Section 6 Basin-wide Costs of
Nitrate Contamination).
5.3 Public Health and Other Considerations The most recent twelve year survey of waterborne disease in the United States (1991-2002)
documented 183 drinking water-related outbreaks, with 76% from groundwater sources (Reynolds et al.
2008). From 2001 to 2002, 92% of outbreaks related to drinking water were from groundwater, and
39% of the groundwater systems were household self-supplied systems not regulated by the U.S. EPA
(Blackburn et al. 2004). Drinking water systems have an enormous effect on public health. Ford (1993,
1996, 1998) suggests that “there is reason to be concerned for the future microbiological safety of
drinking water because a) source water continue to receive agricultural, industrial, and municipal
waters; b) water treatment and distribution systems age and deteriorate; c) water supplies are
overwhelmed by excessive demand; and d) there appears to be an increase in diseases, or at least an
increased recognition of disease, caused by pathogens with varying degrees of resistance to treatment
and disinfection” (Ford 1999).
Technical Report 7: Alternative Water Supply Options 93
A water system struggling with regulatory compliance must manage and plan for the future and prepare
for potential tightening of regulations. Reverse osmosis (RO) and ion exchange (IX) are the most cost-
effective treatment options to reduce nitrate and to provide the highest quality and reliability of safe
water for all households connected to water systems. Furthermore, since nitrate is not the only
contaminant of concern within the study area (see Technical Report 6, Jensen et al. 2012) RO treatment
may be deemed the most promising option for certain systems because it is effective against many co-
occurring contaminants. Until treatment can be afforded or completed, interim solutions include
delivery of bottled or trucked water or distribution of POU treatment devices. Bottled water is
regulated by the Food and Drug Administration (FDA) and is not required to follow as rigorous
regulations as U.S. EPA-regulated tap water; however, bottled water will be better than the current
supply of nitrate-contaminated groundwater, albeit at greater expense (particularly since most brands
are bottled from U.S. EPA regulated municipal drinking water systems). Water delivered by a truck from
a low-nitrate source should be of good quality if proper truck cleaning and transfer procedures are
followed; however, CDPH does not allow water systems to serve trucked water to their community
water supply customers (CDPH 2008; CDPH 2011c; CDPH 2011d). If POU treatment devices (usually RO)
are distributed to households, they must be CDPH approved devices and require households to be
properly educated on their use. RO devices require filter replacement. Often, a plumber must be
employed to install the device and annual maintenance is advisable.
If a self-supplied household has tested their well for nitrate and found a problem, they can employ a
POU or POE device and request assistance on installation and maintenance from a nearby vendor or
water system. A POE system allows household members to have the convenience of using any sink in
the house instead of only the sink with a POU treatment unit. A properly implemented and maintained
POE device supplies a household with the highest quality and reliability of water, compared to a POU
device. Drilling a deeper well is promising for households able to access an aquifer with low nitrate
water. It would be best to drill to deeper, lower nitrate water, while also testing for arsenic levels.
Technical Report 7: Alternative Water Supply Options 94
6 Basin-wide Costs of Nitrate Contamination
Rough basin-wide costs for nitrate contamination in the pilot study area were estimated for
communities, self-supplied households, and local small water systems, using a range of cost estimates
from literature, surveys, and researching existing proposal estimates and final project costs as described
in detail in Section 5 Evaluation of Options. The highly susceptible population (shown in Table 13) is
estimated to be 254,000 people. Of this total, 220,000 people are connected to 85 community public or
state small water systems and approximately 34,000 people are served by 10,000 self-supplied
households or local small water systems. Overall, the estimated economic least cost for providing
nitrate-compliant water to the total highly susceptible population in the study area is roughly $20
million per year ($80/susceptible person/year) for the short-term (excluding one very large system), and
is roughly $36 million per year ($142/susceptible person/year) for the long-term (excluding one very
large system). Short-term solutions are those that can be used in the interim or as temporary solutions,
while a more sustainable, longer-term solution is being planned and implemented. Ideally, there would
be a perfect long-term solution for each system; however, in some circumstances a short-term solution
is the preferred long-term solution. Smaller water systems may not have the technical, managerial, or
financial capacity to incorporate a centralized groundwater treatment system or they may be too far
from a larger system to realistically consider a connection. In this case it may be better for small water
systems to deliver and maintain POU devices to their customers or to drill a new well that is properly
constructed and can avoid future contamination.
Again, the costs of alternative water supply and treatment options vary with numerous factors and the
numbers presented here are estimates based on averages of widely variable costs. Costs will be unique
to each individual system. For proper cost estimation, a feasibility analysis is necessary to assess the
potential solution for each unique system.
6.1 Costs for Community Public and State Small Water System Alternative Solutions
A rough basin-wide lowest cost for solving nitrate contamination of drinking water in the study area was
estimated for community public and state small water systems. Only multiple source systems having a
recorded level of delivering water above the nitrate MCL, single source systems that have a raw source
water level exceeding the nitrate MCL, and systems lacking water quality data within WQM were
included in this analysis. The low and high ranges of the cost estimate for each alternative as a function
of size of community public water system appear in Table 40 and Table 41, with the compiled cost
ranges by size and option in Table 42. The maps in Figure 29 and Figure 30 show the estimated least-
cost short-term option for each affected community system based solely on system size. The displayed
options are not recommended solutions for specific systems since they only consider system size;
individual solutions should be engineered and designed for the local situation of each system. This map
merely shows which promising least cost solutions are found in the approximate short-term. The most
promising least cost solutions for the approximate long-term are shown in Table 44. By short-term we
Technical Report 7: Alternative Water Supply Options 95
mean temporary or interim solutions that do not address the legacy of worsening nitrate groundwater
pollution. By long-term we mean sustainable solutions capable of addressing increasing nitrate levels in
groundwater. The short-term least cost for providing nitrate-compliant water to those connected to
susceptible community public and state small water systems is roughly $13 – 17 million per year (Table
43). The long-term least cost for providing nitrate-compliant water to those connected to susceptible
community public and state small water systems is roughly $34 million per year (Table 44). The
estimated annual O&M cost (already included in the aforementioned least cost scenarios) for short-term
basin-wide solutions is approximately $6.4 – 8.3 million per year, and about $11.5 million per year for
long-term solutions (Table 45).
Short-term Solutions
The alternatives considered for community public and state small water systems (discussed in Table 40
and Table 41) include drilling a new well, installing a pipeline to a nearby system (within 14 miles) that
serves more than 10,000 people, delivering and maintaining a POU RO device for potable uses, installing
groundwater treatment, or connecting to a nearby new surface water treatment facility. The final short-
term cost estimates are based on selecting the high estimate of the least cost alternative (Table 40 and
Table 41) as a function solely of system size and proximity to a larger system, and excluding the follow
options: allowing systems to provide bottled water to their consumers as a means of compliance,
allowing medium and large systems to deliver POU RO devices for compliance, and allowing large
systems to install a pipeline to a larger system (only systems with less than 10,000 people are
connecting to systems with greater than 10,000 people). The final short-term cost estimates are shown
in Table 43, with the first column representing solutions including POU systems and the second column
excluding POU systems. Note that the cost to connect to an alternative system does not include the
estimated connection fee. Since the costs throughout this report are from literature, surveys and U.S.
EPA cost models there is some uncertainty in the accuracy of values to the true system size and
capability. To estimate any uncertainty in these costs, all high estimate values (Table 40 and Table 41)
are used to estimate the overall basin-wide least cost solutions and a contingency factor is applied
based on system size. This contingency factor is meant to account for external factors that may not be
included in researched cost estimates.
The options chosen for the final least cost estimate for providing community public and state small
water systems with short-term solutions are:
1. drilling a new well; 2. delivering and maintaining POU RO devices for potable uses (only for systems serving up to 200
connections over a three year regulatory time constraint); 3. installing a pipeline to a nearby system (10,000+ system); 4. building a groundwater treatment facility; and 5. connecting to a nearby surface water treatment facility.
Drilling a new well and installing a POU device are the only options considered short-term solutions; however, for cost comparison installing a pipeline, building a groundwater treatment facility and connecting a nearby surface water treatment facility are also included in the short-term cost estimates.
Technical Report 7: Alternative Water Supply Options 96
The susceptible systems included in the community public and state small water system least cost
analysis cost model are:
1. all CPWS and SSWSs with multiple sources, delivering water that exceeded the nitrate MCL at least once from 2006 to 2010;
2. all single source CPWS and SSWSs with raw source water that exceeded the MCL for nitrate at least once from 2006 to 2010; and
3. all CPWS and SSWSs with no nitrate water quality data.
A total of 85 susceptible community public and state small water systems serve 220,000 people, shown in Table 43 and Table 44.
Figure 29. SHORT-TERM: Least cost alternative supply option (INCLUDING POU) based on high estimate of
option costs for susceptible community public and state small water systems. (Source: CDPH PICME WQM 2006-
2010 and cost estimate sources.)
Technical Report 7: Alternative Water Supply Options 97
Figure 30. SHORT-TERM: Least cost alternative supply option (EXCLUDING POU) based on high estimate of
option costs for susceptible community public and state small water systems. (Source: CDPH PICME WQM 2006-
2010 and cost estimate sources.)
Table 43. Estimated cost range of the least cost short-term alternative water supply options for susceptible
community public and state small water systems based on system size and proximity to a larger system.
Number of Susceptible
CPWSs/SSWSs Population Total Cost ($/year)
Option Including
POU Excluding
POU Including
POU Excluding
POU Including
POU Excluding
POU
Drill New Well 10 63 184,123 191,715 $10,144,000 $14,500,000
POU Device for Potable Use 70 --- 10,515 --- $1,320,000 ---
Pipeline to a Nearby System (10,000+ system) 5 13 25,323 27,349 $865,000 $1,463,000
TOTAL 85 85 219,961 219,961 $13 million $17 million
The least cost overall alternative water supply cost including POU devices is approximately $13 million
per year (annualized), with ten systems drilling a new well, 70 systems delivering and maintaining a POU
Technical Report 7: Alternative Water Supply Options 98
device for potable use, and five systems installing a pipeline to a nearby system. This is graphically
displayed in Figure 29 and numerically shown in Table 43. Drilling a new well for ten systems provides a
solution for 84% of the susceptible population at a cost of $10.1 million per year. Installing and
maintaining a POU device for 70 systems (all serving up to 200 connections) provides a solution for
about 5% of the susceptible population at a cost of $1.3 million per year. Installing a pipeline to a
nearby larger system for five systems provides a solution for 12% of the susceptible population at a cost
of $865,000 per year. Building a groundwater treatment facility was not a least cost option when POU
devices were available.
The least cost overall alternative water supply cost excluding POU devices is approximately $17 million
per year (annualized), with 63 systems drilling a new well, 13 systems installing a pipeline to a nearby
system, and nine systems building a groundwater treatment facility. This is graphically displayed in
Figure 30 and numerically shown in Table 43. Drilling a new well for 63 systems provides a solution for
87% of the susceptible population at a cost of $14.5 million per year. Building a groundwater treatment
facility for nine systems provides a solution for less than 1% of the susceptible population at a cost of
$450,000 per year. Installing a pipeline to a nearby larger system for 13 systems provides a solution for
12% of the susceptible population at a cost of $1.5 million per year. Connecting to a surface water
treatment facility was not a least cost option under the short-term least cost analysis solution, for either
estimated cost options for the currently susceptible system sizes and locations.
The total estimated range of costs for the least cost alternative option for community public and state
small water system short-term solutions is $13 – 17 million per year. However, because there is
uncertainty in the amount of time a well can produce nitrate-safe drinking water before it may become
compromised by legacy and on-going nitrate leaching, an alternative “long-term” cost scenario is
analyzed below and shown in Table 44, in which the option of drilling a new well and installing POU RO
devices are excluded as a long-term option.
Long-term Solutions
As groundwater degradation continues over time, nitrate and other contaminants will be of concern
(e.g., arsenic, chromium, DBCP, and salts). Drilling a new well does not reliably provide a long-term safe
drinking water solution throughout the study area since it may take only a few years for a nitrate plume
to contaminate the new well or for other groundwater contaminants to appear in the location chosen
for drilling a new well. For this reason, a long-term analysis of alternative water supply costs was
undertaken in which more vulnerable options were excluded as potentially unreliable solutions for the
longer-term. Excluded solutions included: use of POU RO devices for compliance and drilling a new well.
As with the short-term solution cost analysis, the cost of the option to connect to a larger system does
not include the estimated connection fee. To estimate any uncertainty in these costs, all high estimate
values (Table 40 and Table 41) are used to estimate the overall basin-wide least cost solutions and a
contingency factor is applied based on system size. This contingency factor is meant to account for
external factors that may not be included in researched cost estimates.
Technical Report 7: Alternative Water Supply Options 99
The options chosen for the low and high option cost estimates for the long-term least cost analysis of
alternative water supplies for community public and state small water system solutions are shown in
Table 44, and include:
1. installing a pipeline to a nearby system (10,000+ system); 2. building a groundwater treatment facility (RO or IX25); and 3. installing a pipeline and connecting to a nearby surface water treatment facility.
Table 44 shows the least cost long-term solutions for the 85 susceptible community public and state
small water systems, based on excluding the above indicated options as having only short- to medium-
term viability.
Table 44. Estimated cost range of the least cost long-term alternative water supply options for susceptible
community public and state small water systems based on system size and proximity to a larger system.
Option Number of Susceptible
CPWSs/SSWSs Population Total Cost ($/year)
Pipeline to a Nearby System (10,000+ system) 29 36,577 $5,592,000
Quote from Alhambra, Visalia for drinking water delivered in 5 gallon bottles (Alhambra Water 2010). Assumed units of water consumption from NAS Hydration Study. 2
Uses the 2010 U.S. EPA Cost Estimate Tool for an NSF/ANSI Certified RO Unit for treating nitrate. Includes unit purchase, installation, scheduling time, public education (technical and clerical labor and printed material for all public outreach/education efforts), indirect costs (permitting, pilot testing, legal, engineering, contingency) and all associated operations and maintenance costs. The tool allows for economies of scale representation assuming 15 households will be receiving units and management will be centralized. Costs in parentheses do not include public education. 3
Uses the 2010 U.S. EPA Cost Estimate Tool for an NSF/ANSI Certified RO Unit for treating nitrate. Includes unit purchase, installation, scheduling time, public education (technical and clerical labor and printed material for all public outreach/education efforts), indirect costs (permitting, pilot testing, legal, engineering, contingency) and all associated operations and maintenance costs. The tool allows for economies of scale representation assuming 199 households will be receiving units and management will be centralized. Costs in parentheses do not include public education. 4
Uses the 2010 U.S. EPA Cost Estimate Tool for 1 NSF/ANSI Certified RO Unit for treating nitrate. Includes unit purchase, installation, scheduling time, public education (technical and clerical labor and printed material for all public outreach/education efforts), indirect costs (permitting, pilot testing, legal, engineering, contingency) and all associated operations and maintenance costs. Costs in parentheses do not include public education.
Technical Report 7: Alternative Water Supply Options 103
7 Regulatory and Implementation Implications
Each alternative water supply option has its own regulatory and implementation implications. Since domestic well users are excluded from the statewide drinking water protections, and have no regulatory standards for testing their wells (except for a few local county ordinances), the implications of their water supply options will differ slightly from those for community public water systems.
7.1 Implications of Household Self-Supplied System Alternatives
The large numbers of self-supplied households pose several regulatory challenges. Their small size and
unique and varying circumstances result in these small systems bearing significant financial costs and
public health risks.
Drilling a New or Deeper Well: Some counties have existing regulations for drilling new domestic wells.
In areas with nitrate contamination potential, counties and the state should consider additional
monitoring and well construction regulations.
Household Treatment: Since there is little regulatory oversight for domestic well users, there are no
specific requirements for POU or POE devices, but purchasing a certified unit is recommended.
Households with self-supplied wells that choose to install a POU RO or POE IX device should consider
hiring a certified POU/POE distributor to manage and operate the device or should seek training in
proper maintenance. Given the often lesser and declining expense of POU/POE systems, the state
should continue to examine its regulations to take advantage of these improving technologies.
Connect to Alternative System: If a household wishes to connect to a nearby safe community public
water system they must contact the water system or county official and determine if they are within the
water system boundary. If a household is outside of water system boundaries they will need to speak
with local officials about annexation, an extension of the urban growth boundary, or a separate
contractual relationship. Households outside of water system boundaries may find it more difficult to
be incorporated into an existing water system.
Bottled Water: There are no regulatory implications for households to start purchasing bottled or
vended water; however, the quality of bottled water is an under-regulated industrial activity, and can
sometimes be of lower quality than other sources.
7.2 Implications of Community Public Water System Alternatives
Since CPWSs are larger in size and capacity and fewer in number they have many more options, but
higher individual consequences. Community public water systems are always in direct contact with the
regulators to determine the most effective solution for complying with drinking water standards.
Blending: CDPH has already established a Blending Program; however, the regulatory implications will
differ slightly depending on whether the blending source is groundwater or surface water. A
Technical Report 7: Alternative Water Supply Options 104
groundwater source used for blending will not be suitable for use if the groundwater quality eventually
exceeds the MCL for nitrate. Once blending is implemented the water system must continually monitor
the low-nitrate source to ensure the blending ratio is achieved.
Drilling a New or Deeper Well: California already has a Well Standards Ordinance established for
community public water systems for drilling a new or deeper well. Local county ordinances also
establish rules for each community water system. Also, CPDH regulates well construction and evaluates
the location, source water quality and quantity for drilling a new or deeper well in a community public
water system supply.
Community Treatment: CDPH has a Division of Drinking Water and Environmental Management
(DDWEM) that provides permitting information for community public water systems and has established
a Drinking Water Treatment and California Operation Certification Program that provides the minimum
qualifications for a potable water treatment system operator. Furthermore, the respective regulatory
agency for each community public water system must verify that the drinking water treatment device
employed is consistent with Title 22 California Code of Regulations (CDPH 2008; CDPH 2011a).
Household Treatment: California regulations currently allow small public water systems to provide POU
devices to customers as a means of complying with the nitrate standards under the following
restrictions (CDPH 2008):
“…a public water system may be permitted to use point-of-use treatment devices (POUs) in lieu of
centralized treatment for compliance with one or more maximum contaminant levels… if;
(1) the water system serves fewer than 200 service connections,
(2) the water system meets the requirements of this Article (Title 22 Division 4 Chapter 15 Article 2.5),
(3) the water system has demonstrated to the CDPH that centralized treatment, for the contaminants of concern, is not economically feasible within three years of the water system’s submittal of its application for a permit amendment to use POUs,
… no longer than three years or until funding for the total cost of constructing a project for centralized
treatment or access to an alternative source of water is available, whichever occurs first….”
According to the emergency legislation (Health and Safety Code 11680(a)(1)) for temporary compliance
a POE device may also be employed in lieu of centralized treatment. As of September 22, 2011 a POE
system must be considered as a system solution before a POU device. If the POE device is found to be
“not economically feasible or not as protective of public health as POUs” then a POU device may be
used (CDPH 2011e). . The most significant costs of a POU RO device are in the management and
monitoring of the unit. Since the law states that POU units must be centrally-managed by the public
water system or by a company hired by the public water system, a fair regulatory policy should be
developed. For example, a public water system could work with a private company to create a
reasonable contract that allows the company to manage, maintain and monitor all devices within a
specific public water system service area. To use a POU device for complying with the SDWA
amendments there must be 100% participation within a public water system. If any of the connections
deny access to their house it automatically prohibits POU as an alternative for compliance. This is a
Technical Report 7: Alternative Water Supply Options 105
substantial impediment to POU treatment. Other communities have addressed this by passing a local
ordinance requiring installation, and employing the authority to disconnect the water supply if
installation is refused (U.S. EPA 2006a). A local ordinance was passed in San Ysidro, New Mexico,
making water use contingent on POU installation (U.S. EPA 2006a). It is important to provide public
education to customers before, during and after implementation of a POU device to ensure success.
Connect to Alternative Supplies: All public water systems must submit an amended permit application
to the local CDPH drinking water field office prior to changing their source or method(s) of treatment
(CDPH 2011c; CDPH 2011d). If a water system switches from groundwater to surface water, the water
treatment requirements change as specified in the State and Federal Surface Water Treatment Rule.
Also, surface water treatment is almost always more expensive than groundwater treatment. However,
all water served to the public for drinking water purposes is subject to the same nitrate drinking water
standard. A switch to surface water could require purchasing existing surface water rights, contracting
with another entity, petitioning for new surface water rights, or getting an existing surface water right
owner, such as an irrigation district, to amend their use permit and expand activities to provide treated
drinking water services.
Regionalization and Consolidation: Regionalization and consolidation allow systems to increase the
levels of service by taking advantage of economy of scale benefits and complying with stringent
regulations. Service duplications across management and operational functions can be eliminated,
while achieving regulatory compliance and improving financial accountability. Rourke and Smith (1997)
estimated that approximately 40 – 45% of community public water systems will experience financial
instability from rising operational and future regulatory compliance costs; the larger population base
found in regionalization can support increases in operational costs and future regulations. Legislation or
CDPH should consider providing larger systems with financial and ratemaking incentives to encourage
the acquisition of smaller systems. Regulatory incentives for regionalization have been considered in
many policy areas, and “some states have enacted legislation authorizing the use of mandatory
‘takeovers’…but, many water utilities would prefer positive incentives to mandatory takeovers”
(Beecher 1996). Furthermore, if there was an incentive for larger systems to acquire smaller systems
there would be fewer systems for regulating agencies to monitor, reducing administration costs.
Several studies have examined the advantages and disadvantages of regionalization, but the physical
implementation depends on the unique needs and barriers in each region. Successful implementation
of regionalization and consolidation requires planning in a regional context, along with strong public and
political participation. Comprehensive planning that establishes public policy and resource planning on
a regional scale will help meet the objective goals involved in consolidation (Beecher et al. 1996). Some
implementation issues must be considered before consolidating systems, including: “(1) system income
and expenses, (2) level of contributions in aid of construction, (3) rate base, (4) condition of facilities, (5)
reasonableness of price and terms, (6) impact on customers, (7) required additional investments, (8)
alternatives to sale and impacts of no sale, (9) ability to operate facilities, and (10) public interest
assessment (Cloud 1994)” (Beecher 1996). Public participation is essential for regionalization, to
properly educate the public and assure their involvement in the project, and for the future fate of the
system. CDPH supports consolidation efforts through funding programs and low interest loans to
Technical Report 7: Alternative Water Supply Options 106
construct facilities for the physical consolidation of water systems, but does not have an explicit
program to support the planning needed for moving towards regionalization.
To be considered for Safe Drinking Water State Revolving Funds, a water system must prove its
technical, managerial and financial (TMF) capability.26 A water system must also submit an assessment
that identifies all public water systems located within a five mile radius and determines the feasibility of
consolidation (Newkirk & Darby 2010).
Trucked Water: Hauled or trucked potable water is often allowed by CDPH and used for public water
systems in emergency situations when a water source is interrupted for an extended period of time and
if there are no other alternatives. A water system that needs to provide trucked potable water to
customers must contact CDPH and ensure that a CDPH Food and Drug Branch licensed water hauler is
hired for service delivery. The water must be obtained from another regulated public water system and
a “boil water advisory” may be given to each consumer as a precautionary measure to account for
possible contamination during the delivery.27
Dual Water Distribution System: The permitting agency for dual water distribution systems or recycled
water systems is the local Regional Water Board (Central Valley and Central Coast). A water system that
wants to install two distribution systems, one for potable and one for non-potable or recycled water,
must file a report with the appropriate Regional Water Board (CWC section 13522.5). CDPH reviews and
evaluates recycled water proposals to verify the protection of public health and ensures that a system
has the correct backflow protection established to prevent non-potable water from entering the
drinking water system. CDPH encourages the use of recycled water in urban areas where recycled water
or irrigation water is available (CDPH 2011d). To mitigate the concerns of inter-connection of the two
sources or improper plumbing, water system personnel must be trained and a cross-connection control
program must be implemented (CDPH 2011d). This program must also include annual testing of the
backflow prevention devices and periodic shut-down tests (CDPH 2011d).
If a dual water distribution system is implemented on a community public water system level there must
be full public acceptance among consumers. Along with customer acceptance and approval, there must
be a consensus within the City or County about the quantity and quality of water expected for delivery,
and communication with the state about existing regulations. If a system desires to install a dual water
distribution system there must be consideration of the health effects, treatment, storage and
distribution demands (American Water Works Association 1994).
26 California Health and Safety Code Section 116540.
27 Boiling water is not an option to address nitrate contaminated water.
Technical Report 7: Alternative Water Supply Options 107
8 Conclusions
8.1 Major Findings
1) A total of 254,000 people in California’s Tulare Lake Basin and Salinas Valley have drinking water
supplies susceptible or potentially susceptible to nitrate groundwater contamination.
a) Highly susceptible water users fall into one of three identified situations. These comprise: i)
being served by a community public water system with multiple sources and at least one
reported nitrate record in excess of 45 mg/L since 2006, ii) being a single source community
public water system with at least one reported raw source water nitrate record in excess of 45
mg/L since 2006, or iii) being a self-supplied household or served by a local small water system
located in the vicinity a shallow nitrate groundwater concentration in excess of 45 mg/L.
Approximately 213,000 people in 38 multiple-source systems have at least one reported
delivered nitrate record in excess of 45 mg/L. Approximately 3,400 people in 34 single-source
systems have at least one, reported raw water nitrate record in excess of 45 mg/L or no nitrate
water quality data in WQM. In addition, approximately 10,000 rural households (serving
approximately 34,000 people) using domestic wells or on local small water systems of four or
less connections are in the vicinity of shallow groundwater where the nitrate concentration
exceeds 45 mg/L.
b) Other water users considered highly susceptible include approximately 3,900 people in 13
multiple source water systems in the study area that have no recorded nitrate concentration
data in the statewide water quality database (WQM).
2) Nitrate contamination problems will grow. According to recorded raw groundwater data in WQM,
57% of the current population of these regions uses a community public water system with
recorded raw nitrate levels above 45 mg/L. Assuming unchanging continued basin-wide trends
observed since 1970 in nitrate groundwater levels, this number is expected to increase to almost
80% by 2050. Nitrate groundwater contamination problems will increase, treatment costs will rise,
and there is growing potential for public health impacts.
3) Each community public and state small water system with high susceptibility (50 and 35 systems
in Tulare Lake Basin and Salinas Valley, respectively) will need individual engineering and financial
analyses. No single solution will fit every community affected by nitrate in groundwater.
4) From a physical and engineering cost perspective, there is significant potential to consolidate
systems. The potential for consolidation is based on system size and the distance from a smaller
system to a larger system. About 81% and 89% of the Tulare Lake Basin and Salinas Valley water
systems are very small or small (defined as serving < 3,300 people) and serve 89,125 and 23,215
people (4% and 6% of the Tulare Lake Basin and Salinas Valley population), respectively. In the
Tulare Lake Basin and Salinas Valley, respectively, about 50% and 15% of smaller systems (<10,000
people) are within five miles of a larger system (>10,000 people), and 88% and 97% of smaller
systems are within 12.5 miles of a larger system. Consolidation permanently addresses nitrate
problems, as well as many other small system safe drinking water problems typically encountered
by these systems now and in the future.
Technical Report 7: Alternative Water Supply Options 108
5) Options for communities connected to highly susceptible systems are:
a) consolidation with a larger system that can provide safe drinking water to more customers;
b) consolidation of nearby small systems into a single larger system, with a larger rate payer base
and economies of scale;
c) ion exchange community water treatment;
d) interim point-of-use treatment systems until a more long-term and sustainable solution can be
implemented;
e) drilling a new well, at least in the short-to-medium term;
f) blending of contaminated wells, at least temporarily; and
g) switching to surface water.
Some of these options are less viable solutions for the long-term because they may fail to
sustainably deliver nitrate-safe water. Those considered less viable in the long-term include POU,
drilling a new well, and blending.
6) Solutions for self-supplied household or local small water systems within a highly susceptible area
are bottled water (as an interim solution), reverse osmosis point-of-use treatment systems, point-
of-entry ion exchange systems, and drilling a new or deeper well.
7) Better data collection and management will improve knowledge of the extent of nitrate
contamination. Improvements in state and local management of data regarding state small wells,
water system boundaries, domestic wells, and systems with unknown risk can facilitate
understanding and more effective management of nitrate contamination.
8) The overall estimated least cost, including capital and operating costs, for providing short-term
nitrate-compliant drinking water to the Tulare Lake Basin and Salinas Valley is $15 – 20 million per
year for the currently susceptible population. The overall estimated least cost, including capital
and operating costs, for providing long-term nitrate-compliant drinking water to the Tulare Lake
Basin and Salinas Valley is $36 million per year for the currently susceptible population.
Roughly $13 – 17 million per year will be needed to provide safe drinking water for short-term solutions
for multiple source community public water systems exceeding the nitrate MCL, single source
community public water systems (and the small fraction of state small systems included in CDPH’s
database) with nitrate records in excess of 45 mg/L, and community public water systems (and the state
small water systems included in CDPH’s PICME database) lacking nitrate records in WQM, that together
currently serve an estimated 220,000 people (85 systems). Of this cost, approximately $6.4 to 8.3
million is estimated as annual O&M costs. The provision of safe drinking water with long-term solutions
for these 85 systems will cost roughly $34 million per year. Of this cost, approximately $11.5 million is
estimated as annual O&M costs.
The annualized cost of providing nitrate-compliant drinking water to the estimated 34,000 people
(10,000 rural households) using domestic wells or local small water systems (< 5 connections) highly
susceptible to current or future nitrate contamination ranges from $2.5 million per year for point-of-use
(POU) treatment for drinking purposes only, to $4 million per year for point-of entry (POE) treatment for
each household for all water needs. Costs for both could be lower if a manufacturing discount for bulk
purchase of POU/POE systems were available. Approximately $1.5 to $2.4 million is estimated as annual
Technical Report 7: Alternative Water Supply Options 109
O&M costs associated with providing POU/POE systems to the susceptible population served by
domestic well or local small water systems. The least cost POU option is included in the total project
study area estimated least cost of alternative water supply solutions in both the short- and long-term.
The cost to fund alternative water supplies for highly susceptible, nitrate-affected water systems
amounts to $60 – 80 per susceptible person per year, $4 – 5 per irrigated acre per year for the four
million acres of agriculture in these regions, or $75 – 100 per ton of fertilizer nitrogen (assuming about
200,000 tons of fertilizer is applied in these regions) in the short-term. Allowing for only long-term more
viable and sustainable alternative drinking water solutions for affected communities, the total cost
would amount to $142 per susceptible person per year, $9 per irrigated acre per year for the four
million acres of agriculture in these regions, or $180 per ton of fertilizer nitrogen (assuming about
200,000 tons of fertilizer is applied in these regions) in the long-term.
8.2 Promising Actions
1) A feasibility analysis should occur for individual systems to determine the most suitable
alternative water supply option, in which consolidation and regionalization are actively explored
and investigated as the best longer-term options for small systems.
2) For any solution, there are long-term considerations, such as:
a) The need to remove additional contaminants. Alternative water supplies or treatment
options selected should be capable of addressing multiple contaminants if these currently exist
or there is good evidence that additional contaminants are likely to emerge in the near-to-
medium term.
b) The drawdown involved in pumping a new or deeper well. Over time, as pumping continues,
a new well could draw nitrate into the well.
c) Brine waste from treatment systems. The low brine technologies in groundwater treatment
offer a minimal waste approach, and future research and development of brine treatment
alternatives seem promising for greatly reducing brine waste from treatment systems. Systems
should consider the sustainable management and disposal of the brine in the selection of the
groundwater treatment.
d) Environmental impacts of reliance on bottled water. Manufacturing and transporting bottles
uses a lot of energy and causes negative environmental impacts, and the disposal of these
bottles stresses solid waste systems.
3) Advance household treatment for community public water system compliance.
a) Create NSF certifiable POE devices for community public water systems to provide to
customers.
b) Allow community public water systems to provide POU devices to customers for more than
three years under reasonable conditions.
4) Regionalize and Consolidate.
a) Fund non-structural regionalization/consolidation of drinking water systems. Programs in
California fund physical consolidation activities like the construction of new pipelines, the
installation of water meters, or the expansion of treatment systems. Regionalization efforts
Technical Report 7: Alternative Water Supply Options 110
should be expanded to convene pilot projects that bring together communities of water
systems to encourage informational, managerial, institutional, and future planning
collaboration to lay the groundwork and foundations for future consolidation with respect to
institutional, political, and shared needs. This could be done without necessarily having to start
with historically, politically sensitive, and difficult consolidation, since appropriate
regionalization projects can help communities begin to collaborate on information and other
types of exchanges to address shared nitrate problems, as well as many of the other shared
problems of small water systems.
b) Provide incentives to large safe drinking water systems to consolidate with or initiate
regionalization projects with surrounding smaller systems. To encourage larger systems to
take on the risks of a smaller system, incentives should be offered. For example, it may be
beneficial to increase the points given to large systems on State Revolving Funds' Project
Priority Lists who help bring small systems up to the same technical standards as larger
systems, often a prerequisite for consolidation.
5) Construct, populate, and maintain a statewide publicly accessible comprehensive water quality
database for groundwater and public water supply systems. To facilitate accessibility of
groundwater quality data throughout the state, one agency should manage a comprehensive
database and create a simple graphical user interface for easy extraction of groundwater quality
data.
6) Create a Small System Water and Wastewater Task Force for integrating water and wastewater
treatment projects and efforts. Small water and wastewater systems have many chronic and
common problems, and tend to have more frequent contamination problems and higher costs than
larger systems. A Task Force should examine the state’s effectiveness of overseeing and aiding such
systems, with particular attention to possibilities for better integrating water and wastewater utility
functions. This would require an inventory of existing and future system concerns with a special
focus on very small and small systems’ current infrastructure conditions, problems, and future
needs.
7) Require domestic wells water quality monitoring. Collection of shallow domestic well water quality
data is a promising management practice for identifying and protecting groundwater quality
especially for domestic self-supplied households’ drinking water needs in areas identified as being at
risk for nitrate contamination.
Technical Report 7: Alternative Water Supply Options 111
9 Literature Cited
Abbott, D. W. (2011) Interview with David W. Abbott, Senior Geologist at Todd Engineers, personal
communication with Kristin Honeycutt.
Alhambra. (2010) Alhambra Bottled Water Delivery Service – Estimate for 5 gallon Crystal Fresh bottled
water, http://www.alhambrawater.com
American Water Works Association. (1994) Dual Water Systems.
Anton, E.C., Barnickol, J.L. & Schnaible, D.R. (1988) Nitrate in Drinking Water. Report to the Legislature.
State Water Resources Control Board.
Baass, M. (2011) Policy Matters: The Water We Drink: What is California Doing to Ensure its Water is
Safe? California Senate Office of Research.
Balazs, C., Morello-Frosch, R., Hubbard, A., Ray, I. (2011) Social Disparities in Nitrate Contaminated
Drinking Water in the San Joaquin Valley. Environmental Health Perspectives, 119(9): 1272-
1278.
Balazs, C. (2005) Third World Problems in California? A Case Study of Drinking Water in Tulare County.
UC Hastings California Water Law Symposium, San Francisco, CA.
Beecher, J.A. (1996) The Regionalization of Water Utilities: Perspectives, Literature Review, and
Annotated Bibliography. Ohio State University: The National Regulatory Research Institute
(NRRI), Graduate Assistants School of Public and Environmental Affairs Indiana University.
BESST, Inc. (2008) Groundwater Production Well Diagnostic Catheterization & Video Orthoscopy,
Zidar, M. & Thomasberg, K. (1995) Nitrates in Ground Water, 1987-1993 Salinas Valley, California.
Monterey County Water Resources Agency.
Technical Report 7: Alternative Water Supply Options 125
10 Appendix
10.1 Methods
10.1.1 Susceptibility Charts
Explanations are given below for the population/connections estimates given in the susceptibility
breakdown charts (Figure 17, Figure 18, and Figure 19). The number below corresponds to the labeled
boxes in the susceptibility breakdown charts.
1 Total Population: California Department of Finance (CDF) estimates for city-wide populations were
combined with US Census population estimates for Census Designated Places (CDP). Average annual
county growth rates from the CDF 2007 report were applied to project the CDP population to 2010.
2 Household Self-Supplied or Local Small Water Systems: All parcels with a parcel use code designated
as residential and having one to four residential dwelling units outside of city and water system
boundaries and 3.3 people were assumed to be inhabiting each dwelling unit.
3 Community Public Water System with Only One Well: Public water system information is from the
California Department of Public Health’s PICME water system database. Data were pulled for all active
community and state small systems in the study area with only one well.
4 Community Public Water System with More than One Well: Public water system information is from
the PICME database. Data were pulled for all active community and state small systems in the study
area with more than one well delivering water directly to individuals. A system’s source was assumed to
be a “delivering” source following the method described below. Systems with one well and a treatment
plant were also included.
5 Only Surface Water Sources: Public water system information is from the PICME database. Data were
pulled for all active community and state small systems in the study area where all “delivering” sources
were surface water. A system’s source was assumed to be a “delivering” source following the method
described below.
6 Treating or Blending for Nitrate: A list of systems that treat or blend specifically for nitrate was
compiled through personal communication with County Environmental Health departments, individual
water systems, and the California Department of Public Health.
7 Not Treating or Blending for Nitrate: Population and connections from Box #6 was subtracted from Box
#4.
8 High Likelihood of Nitrate in Groundwater: A population range is presented based on the water quality
analysis for populations listed in Box #2 and #3. The population estimated to reside in areas where
there was exceedance of the nitrate threshold chosen (22.5 mg/L as NO3-). The UC Davis Wells Database
(CASTING) was used to examine raw nitrate groundwater levels from 1989 to 2010 in all self-supplied
Technical Report 7: Alternative Water Supply Options 126
household and local small water systems. The CDPH Water Quality Management (WQM) database was
used to examine all raw nitrate groundwater levels from 2006 to 2010 in all community public and state
small water systems.
9 Low Likelihood of Nitrate in Groundwater: A population range is presented based on the water quality
analysis for populations listed in Box #2 and #3. The population estimated to reside in areas where
there was not exceedance of the nitrate threshold chosen. The UC Davis Wells Database (CASTING) was
used to examine raw nitrate groundwater levels from 1989 to 2010 in all self-supplied household and
local small water systems. The CDPH WQM database was used to examine all raw nitrate groundwater
levels from 2006 to 2010 in all community public and state small water systems.
10 Nitrate MCL Exceedances: Public water system water quality information is from the CDPH WQM
database. A system was assumed to exceed the nitrate MCL (i.e., deliver water to customers that
exceeded the nitrate MCL) if the maximum recorded nitrate level from 2006-2010 for any “delivering”
source in a system was greater than 45 mg/L as NO3-. A system’s source was assumed to be a
“delivering” source following the method described below.
11No Nitrate MCL Exceedances: Public water system water quality information is from the CDPH WQM
database. A system was assumed to not exceed the nitrate MCL (i.e., no deliveries of water to
customers that exceeded the nitrate MCL) if the maximum recorded nitrate level from 2006-2010 for all
“delivering” sources in a system were less than or equal 45 mg/L as NO3-. A system’s source was
assumed to be a “delivering” source following the method described below.
12 No Nitrate Data: This box contains the community water systems with more than one well (Box #4)
that did not contain any water quality data on nitrate levels in PICME’s CDPH database from 2006-2010.
10.1.2 Estimating “Delivering” Sources of a System
Often, the “sources” field listed in CDPH’s PICME database simply refers to a water quality sample point
along the treatment/distribution line, and not necessarily a well. Samples can be taken at the beginning,
end or middle of the distribution line. A source can even refer to a treatment plant. There are various
methods to determine which sources are actually delivering the recorded water quality to customers
and which are merely intermediary points along the treatment/distribution line. The method used in
this report is by no means infallible, but it uses a column in PICME that is present and consistent for
most systems, and can therefore be used as a rough way to understand the bigger picture. CDPH’s
PICME database contains a column labeled “ENTITY_INFO” that describes the source. All sources (with
the exception of inactive sources) that are labeled as “Treated” were considered to be delivering
sources because this designation refers to a point along the distribution system after treatment has
occurred. Similarly, all sources (with the exception of inactive sources) that are labeled as “Untreated”
were also considered to be delivering because these sources refer to points along the distribution
system where treatment has not occurred, but will NOT occur in the future. The sources labeled as
“Raw” were not included because these sources will be treated in the future, and are therefore not the
final entry point into the distribution line before the water reaches customers. Sources with the
Technical Report 7: Alternative Water Supply Options 127
following specific codes in the “ENTITY_INFO” column were considered to be delivering sources and
their water quality data was assumed to reach customers as listed in PICME:
AT = Active Treated. Active source after treatment.
AU = Active Untreated. Active Source that is not treated and will not be treated.
CM = Combination/Blend Mixed. Blended sources included in this station are both treated and raw or untreated.
CT = Combination/Blend Treated. Blended sources all treated prior to sample point.
CU = Combination/Blend Untreated. Blended sources are all untreated and will not be treated using any method prior to delivery.
DT = Distribution Treated. Sample point within the distribution system, after treatment.
PT = Purchased Treated. Purchased source water that was treated by the seller.
PU = Purchased Untreated. Purchased source water that has not and will not be treated.
ST = Standby Treated. Emergency source that is used less than 15 calendar days per year, with periods not to exceed five consecutive days, and that receives treatment when in use.
SU = Standby Untreated. Emergency source that is used less than 15 calendar days per year, with periods not to exceed five consecutive days, untreated (CDPH’s PICME Documentation).
A few active community or state small water systems in the study area did not have any sources labeled
with the above designations. In these cases, all sources were maintained for the system and were
considered to be delivering sources, even if they were labeled as “Raw”.
Technical Report 7: Alternative Water Supply Options 128
10.2 Rainwater Cisterns
A rainwater cistern is an underground basin or an above ground barrel or tank that collects and stores
rainwater from rooftops or other catchments. Rainwater harvesting has been used for centuries to
supply water for household, landscape, and agricultural uses and is currently being applied in locations
including Hawaii, Africa, Asia and Australia. Rainwater harvesting relies on dependable rainfall and
runoff and is suitable for locations where the average rainfall exceeds 400 mm/year (Lye 2002). A
rainwater harvesting system has the following six components: a catchment area or roof, gutters and
downspouts, leaf screens and roofwashers, cisterns or storage tanks, conveyance, and water treatment.
Within the study area the rainwater will be applied to potable uses that will require proper filtration and
disinfection prior to distribution. A rainwater cistern used for potable uses should have durable,
watertight exterior and a clean, smooth interior sealed with a non-toxic joint sealant with all materials
labeled as FDA-approved. Cisterns may be constructed of plastic, metal, concrete and masonry, or
wood. Cistern design depends on the rainfall within the region, the catchment area, and the
household’s daily water use. The cistern needs to be properly located to avoid sunlight penetration,
maintain a minimum distance of 50 feet from septic fields, and have the proper foundation and support.
The average construction cost is estimated to be $1.48 per gallon of collection capacity; a potable water
case study of a 5,000 gallon above ground fiberglass cistern with a 5 micron sediment filter, a carbon
cartridge filter and UV light costs about $6,200 (Texas Water Development Board 2005).
Air pollution due to crop dusting and agricultural practices would create water quality problems, as the
chemicals and debris left on rooftops would wash off into the cistern with the first rainfall. Another
concern would be in the reliability, timing, and volume of the rainfall. As previously mentioned, the
Salinas Valley annually receives about 20 inches of rain, and the Tulare Lake Basin annually receives
between 7 and 13 inches of rain. The Texas Rainwater Harvesting Manual estimates a production of 600
gallons of water for every inch of rain over a 1,000 square foot catchment area, that would yield an
annual amount of 12,000 gallons of water per household (32 gallons per day) within the Salinas Valley
and an annual amount between 4,200 and 7,800 gallons of water per household (11 to 21 gallons per
day) within the Tulare Lake Basin, assuming the average catchment area of 1,000 square feet. The
inconsistency and unreliability of the distribution pattern of this source would not be a sufficient supply
for a household to depend on for potable water.
Overall, public health and water quality seem likely to be the greatest impediment to the use of cisterns
as a replacement water supply. Costs can be high, even though water yields are likely to be adequate
for drinking and cooking water.
Technical Report 7: Alternative Water Supply Options 129
10.3 Glossary
Census Block
The smallest geographic unit used by the US Census for tabulating
data collected from all households within a region. They are
formed by streets, roads, railroads, streams and other bodies of
water, other visible physical and cultural features, and the legal
boundaries shown on Census Bureau maps. (US Census)
Census Block Group
A cluster of census blocks and a subdivision of a census tract.
Census block groups generally have between 600 and 3,000 people.
On average there are 39 blocks in a block group. (US Census)
Census Tract
Small, relatively permanent statistical subdivisions of a county
delineated for most metropolitan areas and other densely
populated counties by local census statistical areas committees.
Census tracts usually have between 2,500 and 8,000 persons and,
when first delineated, are designed to be homogeneous with
respect to population characteristics, economic status, and living
conditions. (US Census)
Census Designated Place (CDP)
Areas delineated for each decennial census as the statistical
counterparts of incorporated places. CDPs are created to provide
data for settled concentrations of population that are identifiable
by name but are not legally incorporated under the laws of the
state they are located. (US Census)
Community Public Water System
(CPWS)
A public water system that serves at least 15 service connections
used by yearlong residents or that regularly serves at least 25
yearlong residents of the area. (CDPH) Disadvantaged Community (DAC)
– Block Group
A block group that has a Median Household Income (MHI) of less
than 80% of the State of California’s Median Household Income.
Household Self-Supplied Water
System
A water system that is not connected to a public water system, is
assumed to be 1 to 2 dwelling units (or connections), and is
considered a domestic well.
Local Small Water System A water system with 2 to 4 connections.
Local Primacy Agency (LPA)
County environmental health jurisdiction that has applied for and
was granted regulatory authority over small community and non-
community public water systems in their county. (CDPH)
Maximum Contaminant Level
(MCL)
Enforceable drinking water regulations established to protect the
public against consumption of drinking water contaminants that
present a risk to human health. (U.S. EPA)
Median Household Income (MHI)
The amount that divides the income distribution into two equal
groups, half having income above that amount, and half having
income below that amount. It is the sum of money received in the
calendar year by all household members 15 years of age or older,
Technical Report 7: Alternative Water Supply Options 130
including unrelated household members. (US Census)
Non-Transient Non-Community
public water system (NTNC)
A public water system that is not a community public water system
and that regularly serves at least 25 of the same persons over 6
months per year. (CDPH)
Permits, Inspection, Compliance,
Monitoring, and Enforcement
(PICME)
The PICME database maintained by the Drinking Water Program of
the California Department of Public Health and containing
information related to the regulation of public drinking water
systems subject to the federal and California Safe Drinking Water
Acts. (CDPH)
Public Water System (PWS)
A system for the provision of water for human consumption
through pipes or other constructed conveyances that has 15 or
more service connections or regularly serves at least 25 individuals
daily at least 60 days out of the year. PWSs are regulated under
the Safe Drinking Water Act. (CDPH)
State Small Water System (SSWS)
A system for the provision of piped water to the public for human
consumption that serves at least five, but no more than 14, service
connections and does not regularly serve drinking water to more
than an average of 25 individuals daily for more than 60 days out of
the year. SSWSs are not regulated under the Safe Drinking Water
Act.
Susceptibility The potential for the residential population to consume drinking
water above the nitrate MCL.
Transient Non-Community public
water system (TNC)
A non-community public water system that does not regularly
serve at least 25 of the same persons over 6 months per year.
(CDPH)
Vulnerability
The potential for a system to deliver water with high nitrate levels
if nitrate contamination occurs at a source. A function of the type
of system. Classified as higher, lower, or no vulnerability
depending on the source of water and the number of system water
sources.
Water Quality Management
(WQM)
The WQM database contains one record for each CPWS per quarter
and year with average concentrations of nitrate as well as the
frequency of sampling, the number of sampling stations, and the
date of the last sample.
Technical Report 7: Alternative Water Supply Options 131
11 Case Studies
CITY OF LINDSAY
Phone Conversation with Public Works Director, Mike Camarena (5/19/11)
The City of Lindsay’s main water supply today is treated surface water from the Friant Kern Canal. They
have some groundwater wells, but they prefer to use the surface water due to groundwater quality
issues (groundwater sources contain nitrate, but do not exceed the MCL). The City has a long-term
contract with the United States Bureau of Reclamation (USBR) for a set amount of water to be delivered
costing $225/af (the contract was signed in 2006). The City is currently helping Paige-Moore Tract by
supplying them with water, but the current water treatment plant was built at a specific capacity and
the City is starting to have issues with maxing out capacity. They have to chlorinate the raw water from
the canal prior to filtration and this initial and final chlorination process is causing disinfection
byproducts (DBPs) to contaminate the supply. The facility needs to be expanded to allow the water to
sit for a long enough detention time and allow the chlorine to properly disinfect the water. The City of
Lindsay is applying for SRF funding for either a new, bigger contact tank or an alternative disinfectant,
the total cost is estimated at $300,000 to $400,000. The City will not be funding the distribution or
pipeline costs for El Rancho or Tonyville, but they have to apply for SRF funding to connect to the
system. The Tonyville application had just been rejected. It is hard for the City to incorporate
neighboring communities, even though they want to help because they need to do what is best for their
future growth and they must preserve their best interest. Currently within the City of Lindsay, it is policy
to charge double the cost of water to anyone served outside of the city limits. This double charge allows
for the City to help fund their system and prepare for future growth. **13.04.300 (City Code) – Service
Outside City: All water services outside the city limits are subject to council approval, and shall pay twice
the applicable monthly rates. (Ord. 329 § 5-5.1974)
Since some of these smaller communities outside of city limits cannot afford to pay double rates, they
may have to obtain council approval to try to lower that value. The City is a metered water system and
anyone who is connecting must be metered as well. They do not have block water rates. Also, for the
City to include Tonyville and El Rancho they must alter their contract with USBR and increase the
allotment of Friant Kern Canal water they receive.
Technical Report 7: Alternative Water Supply Options 132
LEMON COVE WATER COMPANY
Phone Conversation with Bill Pensar (5/23/11)
They received Prop 84 Safe Drinking Water funding back in 1991 for a new well at Mateas Point; they
have been experiencing nitrate fluxes over the past 20 years. The nitrate concentrations have gone up
to 100 mg/L as nitrate and then down to below the MCL and then back up to 100 mg/L. In late October
of 2008, they applied for funding for a Feasibility Study to drill a new well. They were accepted for
loans, but want grant money. Their application was just recently re-submitted. The feasibility study will
cost about $200,000 and drilling a new well will cost about $100,000. They are hoping that the study
will also cover expenses for a new tank that can be built up on a hill and can pump at night utilizing the
cheap energy costs and gravity driven distribution. The new well will be in a location that is closer to
them than the existing well so they will not have to install pipeline or increase the distribution mains.
They believe drilling a new well is the best option, avoiding the need for brine disposal associated with
treatment, purchasing or filing a new license, hiring an operator or participating in a lot of O&M
activities. They are under the impression that RO is outrageously expensive and they are worried about
disposing the brine back into the TLB. The cost of trucking the brine to a remote location is too
expensive as well.
PLAINVIEW MUTUAL WATER COMPANY: Leaky Distribution Lines and Contaminated Back-Up Well
Plainview Mutual Water Company provides drinking water to around 800 people in the unincorporated
area of Plainview, Tulare County (CWC 2011b). When one of their wells was shut down because nitrate
levels started to exceed the MCL, Plainview was forced to rely on their only other well. This second well
had recorded concentrations of DBCP (CWC 2011b). The distribution mains for this area were installed
in 1941 and severe rusting and leakage issues caused bacterial contamination of the drinking water
being supplied to the homes (Doan 1995). A flat rate of $25 per month was charged to these
households (Doan 1995) whose median income in 1997 was only $12,000. Funds raised by the water
company were not enough to adequately maintain the water system or to protect the water; many
households were left to struggle to finance their own in home chlorine treatment for the bacteria (Doan
1995). Plainview Mutual Water Company was able to secure $2.3 million from federal and state sources
to replace their distribution system and build a new well. This tremendous sum could have never been
financed by such a small disadvantaged community.
Doan, Lynn (1995). “Towns Thirst For Safe Water”. Visalia Times-Delta
<http://www.lynndoan.com/Towns_Thirst.html>
Community Water Center (CWC) (2011b). “Plainview”. <http://www.communitywatercenter.org/water-
valley.php?content=Plainview>
Technical Report 7: Alternative Water Supply Options 133
CITY OF TUCSON: “Brown Water” Produced After Switching from Groundwater to Surface Water
With the enactment of Arizona’s Groundwater Management Act in 1980, the City of Tucson was
required to achieve a safe yield by appropriately balancing groundwater withdrawals with recharge
(University of Arizona 1998). This mandate led to the city’s adoption of a 110-year water plan that
mapped out a strategy to serve 95% of the population with surface water from the Central Arizona
Project (CAP) by 1995 (ADWR 1999). By 1992, the surface water treatment plant was constructed and
the city began delivering treated CAP water to 60% of its municipal customers (ADWR 1999). The salts,
which had built up inside of the pipes over the years that groundwater was distributed, were released
due to the sudden change in pH (attributable to the surface water). Suddenly, households were
receiving brown water. Municipal delivery of the surface water was halted in 1994 due to the poor
water quality and concerned residents. Later, it was revealed that the utility was only replacing pipes at
a rate of 0.5 percent per year (typical rates are 3 – 5%) (ADWR 1999).
Arizona Department of Water Resources (ADWR) (1999). “Third Management Plan for Tucson Active
Management Area”, Chapter 8: Augmentation and Recharge Program.