.. .rlllllllll ill n og ro III National Cooperative for the Disposal of Radioactive Waste TECHNICAL REPORT 94-08 Kristallin-I Estimates of Solubility Limits for Safety Relevant Radionuclides April 1995 U. Berner PSI, WOrenlingen and Villigen Hardstrasse 73, CH-5430 WetfingenjSwiizerland, Telephone +41-56-37 11 11
Transcript
.. .rlllllllllill n og ro III National Cooperative for the
Disposal of Radioactive Waste
TECHNICAL REPORT 94-08
Kristallin-I
Estimates of Solubility Limits for Safety Relevant Radionuclides
All parts of this work are protected by copyright. Any utilisation outwith the remit of the copyright law is
unlawful and liable to prosecution. This applies in particular to translations, storage and processing in
electronic systems and programs, microfilms, reproductions, etc. II
Preface
The Waste Management Laboratory at the Paul Scherrer Institute is performing work to develop and test models as well as to acquire specific data relevant to performance assessments of Swiss nuclear waste repositories. These investigations are undertaken in close co-operation with, and with the partial fmancial support of, the National Cooperative for the Disposal of Radioactive Waste (Nagra). The present report is issued simultaneously as a PSI-Bericht and a Nagra Technical Report.
Contents
ABSTRACT
ZUSAMMENFASSUNG
REsuME
1. PRELIMINARIES
2. APPROACH
a) General
b) Estimation of solubility limits
c) Procedures applied
- 1-
3. REFERENCE SOLUTIONS AND INVENTORIES
4. RESULTS (fust priority elements)
Thorium
Protactinium
Uranium
Neptunium
Plutonium
Americium
Curium
Technetium
Nickel
Palladium
Selenium
5. INFLUENCE OF pH AND Eh
6. CONSISTENCY WITH FAR-FIELD REFERENCE WATER
7. DISCUSSION OF ACTINIDE THERMODYNAMIC DATA
8. CONCLUDING REMARKS AND RECOMMENDATIONS
ACKNOWLEDGEMENTS
REFERENCES
APPENDIX 1 (results of second priority elements)
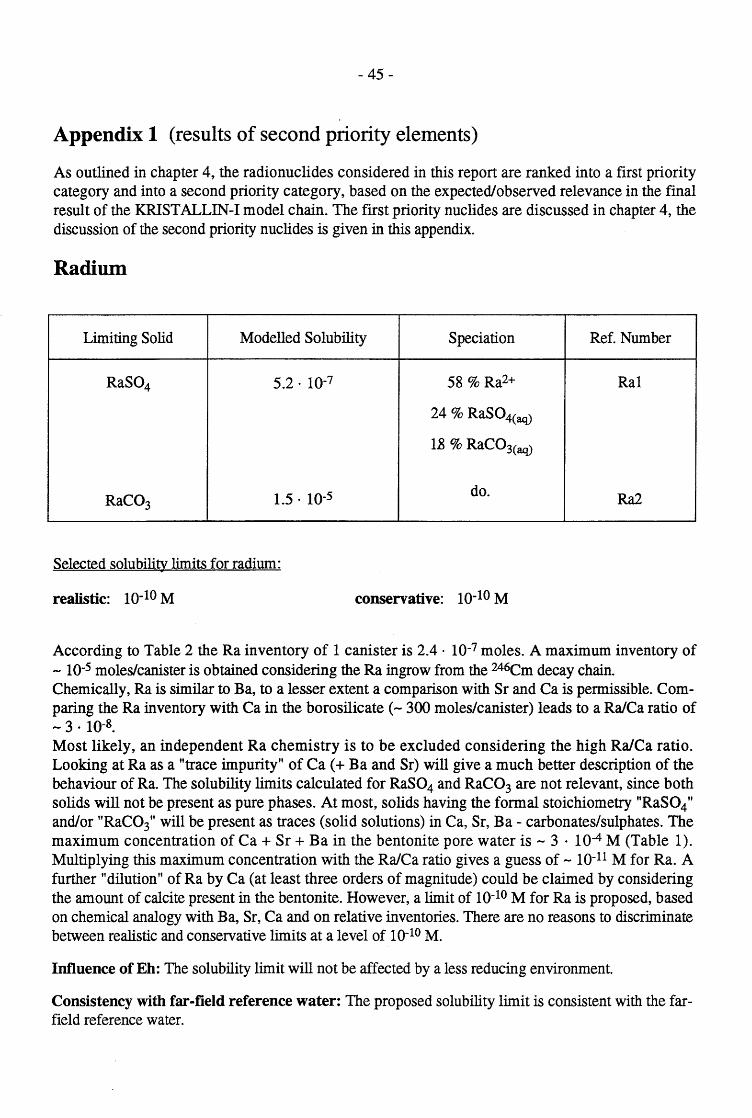
Radium
ill
IV
V
1
1
1
2
3
4
8
10
11
12 13
14
15 16
16 18
19
20
21
25
29
38
39
40
45
45
-II-
Zirconium 46 Niobium 47
Tin 48 Lead 49 Antimony 50 Bismuth 51 Samarium 52
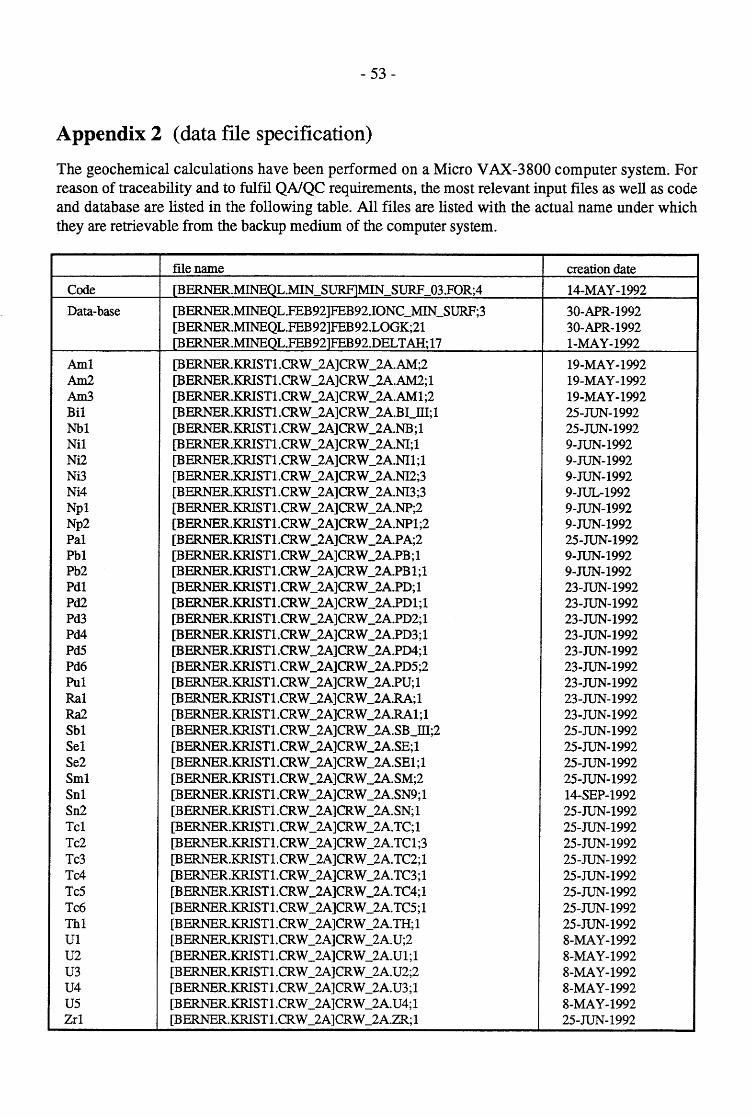
APPENDIX 2 (data file specification) 53
APPENDIX 3 (data base comparison) 54
- III-
Abstract
The safety concept for the Swiss high level radioactive waste repository is based on a multiple barrier system. Within the concept of the safety analysis KRISTALLIN-I, the waste glass starts corroding after failure of the massive steel canister and nuclides are released to the bentonite backfill. This release is limited by restricted solubility of (secondary) solid phases ("solubility limits").
The present work quantifies the maximum expected concentrations of the elements Th, Pa, U, Np, Pu, Am, Cm, Tc, Ni, Pd, Se, Ra, Zr, Nb, Sn, Pb, Sb, Bi and Sm within the reference bentonite porewater with pH = 9, Eh = -400 mV and 1= 0.08 M at 50°C. In a first step, maximum expected concentrations were calculated with a geochemical speciation code (MINEQL) based on a documented thermodynamic database. In a second step, the values obtained in this way were carefully reviewed and modified, based on extended geochemical considerations and system-dependent parameters. Thereby, the relevance of potentially limiting solids, chemical analogies, absolute and relative inventories and recent experimental findings from laboratory and natural systems were particularly considered. The expected groundwater composition in the crystalline host rock (modified by the barrier material bentonite) covers a rather narrow pH range from 8.5 to 9. Within this narrow pH range, solubility limits may be tenned as pH independent since computable pH effects are never significant compared to the general uncertainty of the solubility limits. The chemical model defining the reference groundwater predicts a system-wide Eh ranging from -400 mY up to +100 mY. A slightly oxidising near-field will stabilise the generally more soluble higher oxidation states of redox sensitive radionuclides. Based on the available thennodynamic data the elements U, Tc, Se and Pa are predicted not to be solubility limited at +75 mY. Therefore, a more detailed investigation of the redox behaviour of critical elements and, much more importantly, a very careful review of the near-field redox model is strongly recommended.
The reference solutions defined for the near- and far-field slightly differ in pH, Eh, ionic strength and carbonate content. The near-field solubility limits were therefore checked for consistency with the far-field reference water. In particular, a possible precipitation of secondary minerals (including the formation of rapidly transportable colloidal matter) was tested by means of speciation calculations. Selenium exhibits a solubility minimum in the Eh range of the far-field reference water (-180 mY), therefore the precipitation of secondary Se minerals cannot be ruled out. For americium and plutonium, the geochemical calculation predicts a moderate oversaturation but, in these cases, a clear judgement would required the review of corresponding carbonate complex data. All other predicted solubility limits are compatible with the far-field water.
The results of the geochemical speciation calculations clearly indicated inconsistencies and shortcomings in the available thermodynamic data of the actinides. The predicted behaviour is not as consistent as expected from the known chemical similarities among the actinides. Based on recently published data, a proposal for a consistent thermodynamic data set for the tetravalent actinides is made. However, a chemically consistent prediction of an overall actinide behaviour must additionally include consistent data sets for the tri-, penta- and hexavalent elements, as well as the corresponding redox equilibria.
- IV-
Zusammenfassung
Das Sicherheitskonzept für das schweizerische Endlager für hochaktive Abfälle geht von einer ganzen Kette von einzelnen Barrieren aus. Am Anfang dieser Kette steht, zusammen mit anderen Barrieren, die Begrenzung der Radionuklid-Freisetzung durch konzentrations-limitierende Festphasen, zusammengefasst unter dem Begriff "Löslichkeitslimiten" .
Im Konzept der Sicherheitsanalyse KRISTALLIN-I erfolgt die Freisetzung über ein Kristallingrundwasser, modifiziert durch das Barrierenmaterial Bentonit. Die vorliegende Arbeit beschreibt die maximal vorliegenden Konzentrationen der Elemente Th, Pa, U, Np, Pu, Am, Cm, Tc, Ni, Pd, Se, Ra, Zr, Nb, Sn, Pb, Sb, Bi und Sm in einem Referenz-Bentonitporenwasser mit pH = 9, Eh = -400 m V und I = 0.08 M bei 50°C. Die konkreten Zahlenwerte wurden vorerst mit einem geochemischen Speziationsmodell (MINEQL) errechnet und anschliessend unter Beizug erweiterter geochemischer Überlegungen und systembedingter Parameter diskutiert und gegebenenfalls modifiziert. Berücksichtigt wurden neben grundlegenden chemischen Überlegungen insbesondere die Relevanz der verfügbaren limitierenden Festphasen, chemische Analogien, absolute und relative Mengenverhältnisse im Endlager, sowie neuere experimentelle Befunde aus Labor und Natur. Die im Kristallin erwarteten Grundwässer (modifiziert durch das Barrierenmaterial Bentonit) liegen im pH-Bereich von 8.5 - 9. In diesem engen pH-Bereich können die vorgeschlagenen Löslichkeitslimiten als pH-unabhängig betrachtet werden. Verglichen mit der generellen Unsicherheit der Löslichkeitslimiten sind die rein rechnerischen pH-Effekte nicht signifIkant Je nach verwendetem Redox-Modell weist das Referenz-Grundwasser Eh-Werte von -400 bis - +100 mV auf. Ein leicht oxidierendes Nahfeld stabilisiert die höheren Oxidationsstufen der redoxsensitiven Nuklide. Aufgrund der vorliegenden thermodynamischen Daten werden bei +75 mV die Elemente U, Tc, Se und Pa nicht mehr löslichkeitslimitiert sein. Eine detaillierte Untersuchung des Redoxverhaltens kritischer Elemente und, noch wichtiger, die Überprüfung des Nahfeld-Redoxmodells werden deshalb dringend empfohlen.
Die für das N ah- und Femfeld angenommenen Referenzlösungen unterscheiden sich in pH, Eh, Ionenstärke und Carbonatgehalt. Es wurde deshalb geprüft, ob die für das Nahfeld vorausgesagten Löslichkeitslimiten im Femfeld zur Bildung sekundärer Festphasen (Kolloide) führen können. Selen hat im Parameterbereich des Femfeld-Referenzwassers (Eh = -180 mV) ein Löslichkeitsminimum, die Bildung sekundärer Festphasen ist nicht auszuschliessen. Plutonium und Americium sind im Fernfeld laut Rechnung mässig übersättigt, allerdings sind hier vorerst die verfügbaren thermodynamischen Daten der Carbonatkomplexe zu überarbeiten. Die Löslichkeitslimiten der restlichen Elemente sind mit dem Femfeldwasser verträglich.
Aus den durchgeführten Speziationsrechnungen geht klar hervor, dass die verwendeten thermodynamischen Datensätze für die Actiniden nicht in allen Teilen konsistent sind, und die erwartete chemische Ähnlichkeit dieser Elemente nur unvollständig wiedergeben. Aufgrund neuerer experimenteller Daten wird daher aufgezeigt, wie ein konsistenter thermodynamischer Datensatz für die vierwertigen Actiniden Th(IV), Pa(IV), U(IV), Np(IV) und Pu (IV) aussehen könnte. Eine konsistente Voraussage der gesamten Actiniden-Chemie wird aber nur erhalten, wenn gleichzeitig auch die thermodynamischen Daten der tri-, penta- und hexavalenten Actiniden und deren Redoxgleichgewichte konsistent überarbeitet werden.
-v-
Resumé
Le concept de sécurité du dépôt de déchets radioactifs Suisses de haute activité est basé sur une série de barrières. La limitation du relâchement des radionucléides est dictée par la dissolution des phases solides, résumée sous le thème "limite de solubilité", elle commence au début de la chaîne des barrières de sécurité.
Dans le concept de l'analyse de sécurité de KRISTALLIN-I les radionucléides sont relargués du dépôt au moyen de l'eau cristalline modifiée par la barrière de bentonite. Le présent travail décrit les concentrations maximales escomptées pour les éléments: Th, Pa, U, Np, Pu, Am, Cm, Tc, Ni, Pd, Se, Ra, Zr, Nb, Sn, Pb, Sb, Bi et Sm dans l'eau de pore de la bentonite avec pH = 9, Eh = -400 m V et I = 0.08 M à 50°C. Dans une première étape, les concentrations maximales escomptées sont calculées à l'aide du code de spéciation géochimique (MINEQL) et d'une base de données publiée. Dans une seconde étape, les valeurs obtenues ont été soigneusement revues et modifiées en se basant sur des considérations géochimiques détaillées et sur la dépendance des paramètres du système. Ici, l'importance des composés chimiques existant, les analogies chimiques, les inventaires absolus et relatifs et les propriétés des systèmes en milieux naturel et au laboratoire ont été soigneusement considérés, ainsi que l'ont été les considérations chimiques de base. La composition chimique de l'eau dans la roche Cristalline d'accueil (modifiée par la barrière de bentonite) couvre un domaine de pH étroit (8.5 à 9). Dans ce domaine de pH restreint, les limites de solubilité peuvent être estimées comme indépendantes du pH puisque les effets de pH calculés ne sont pas significatifs comparés à l'incertitude des degrés de solubilité. Le modèle chimique décrivant l'eau souterraine de "référence" prévoit un domaine de Eh de -400 mV à +100 mV. Un champ proche faiblement oxydant stabilisera les formes oxydées, en général plus solubles, des éléments sensibles du point de vue redox. Basés sur les données thermodynamiques disponibles, l'U, le Tc, le Se et le Pa sont prédits être ne plus limités à +75 mV. C'est pourquoi, une recherche plus détaillée du comportement redox des nuclides importants et une révision soigneuse du modèle redox du champ proche sont fortement recommandés.
Les solutions de référence définie pour les champs proches et lointains diffère en,pH, Eh, force ionique et contenu en carbonate. Les limites de solubilité dans le champ proche ont été vérifiées pour leur "consistance" avec l'eau de "référence" du champ lointain. En particulier, une précipitation possible de minéraux secondaires (incluant la formation de colloïdes) a été étudiée au moyen des calculs de spéciation. Le sélénium présente un minimum de solubilité dans le domaine Eh de l'eau de référence du champ lointain (-180 mV), la précipitation de minéraux secondaires du Se ne peut pas être exclue. Pour l'américium et le plutonium le calcul géochimique prévoit une légère sursaturation mais ceci nécessitera la révision des données des complexes carbonatés. Toutes les autres limites de solubilité sont compatibles avec l'eau du champ lointain.
Les résultats des calculs de spéciation géochimique montrent clairement les inconsistances et approximations des données thermodynamiques des actinides. Le comportement prédit n'est pas aussi consistant qu'escompté par les analogies entre actinides. Basé sur des données récemment publiées, il est démontré, à quoi une base de données d'actinides tétravalents peut ressembler. Quoi qu'il en soit, une prédiction sérieuse du comportement chimique des actinides nécessite aussi d'inclure les données de ces éléments aux états tri-, penta- et hexavalents et des équilibres redox correspondants.
- 1 -
1. Preliminaries
Many pieces of work contribute to a safety analysis like KRISTALLIN-I and the particular contributions need to be temporarily co-ordinated. Solubility limits had to be provided at an early stage of KRISTALLIN-I, since subsequent modelling work (release from repository, transport through geoand biosphere etc.) used the solubility limits as input parameters. This means that, once fixed, the solubility limits could/should not be changed anymore. Otherwise, many subsequent model calculations would have to be redone and given deadlines could not be kept. This had some consequences for the structure of the present report: The database used to model the solubility limits was "frozen" at the beginning of the KRISTALLIN-I analysis. During the modelling work some problems, inconsistencies and shortcomings (in the thermodynamic database) were encountered which, although recognised, could not be investigated in more detail due to the restricted time available. Up to the time of fmalising this report a considerable effort went into further investigation of thermodynamic data. Reviewers criticisms and comments to the internal report [8] preceding this work correctly pointed to inconsistencies in the predicted behaviour of the actinides. In chapter 7 these inconsistencies and shortcomings are addressed and proposals on how to improve the thermodynamic data are made, but the improved data were not fed back to the solubility limits for the reasons mentioned above. Such a feedback would lower or not change the predicted conservative limits for the actinides (Th being an exception) but would decrease the difference between realistic and conservative estimates.
2. Approach
a) General
Solubility limits for safety relevant radionuclides have already been estimated for "Projekt Gewahr 1985" [40,41 and references therein]. For Projekt Gewahr a reference groundwater based on water analyses from the "Bottstein" borehole (at a depth of 1300 m) was used [40, Tab. 4 - 9]. In the present KRISTALLIN-I safety analysis improved reference waters were defmed, based on the interaction of crystalline ground waters with the backfill. In addition the thermodynamic data base has been further developed since Projekt Gewahr [45, 46]. Therefore, new estimates for the solubility limits in the near field of the high level radioactive waste repository needed to be performed.
The present report describes the solubility limits for the base case, that means for a bentonite pore water under reducing conditions (pH = 9.0; Eh = - 400 mY; 1= 0.08 M; T = 50°C). Solubility limits for other reference waters (Table 1) are not presented, although corresponding calculations were partly performed. The influence of more oxic conditions on the solubility limits for redox sensitive nuclides is addressed (chapter 5) and the consistency of the proposed solubility limits with the farfield reference water is checked (chapter 6).
- 2 -
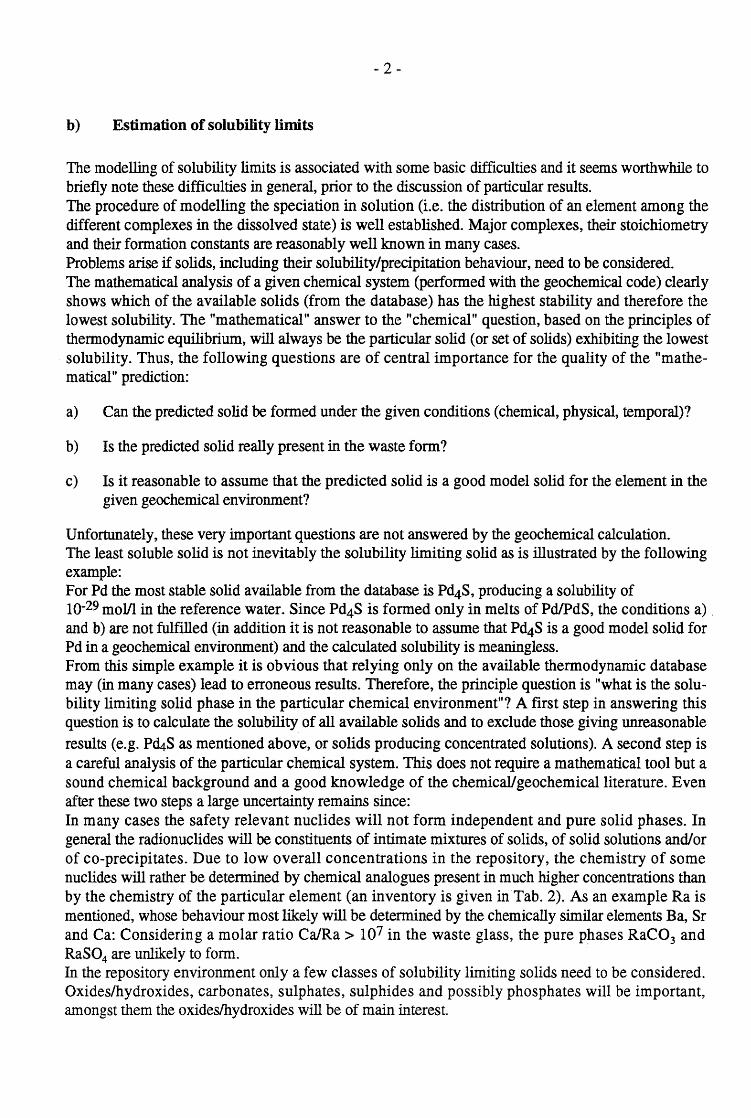
b) Estimation of solubility limits
The modelling of solubility limits is associated with some basic difficulties and it seems worthwhile to briefly note these difficulties in general, prior to the discussion of particular results. The procedure of modelling the speciation in solution (Le. the distribution of an element among the different complexes in the dissolved state) is well established. Major complexes, their stoichiometry and their formation constants are reasonably well known in many cases. Problems arise if solids, including their solubility/precipitation behaviour, need to be considered. The mathematical analysis of a given chemical system (performed with the geochemical code) clearly shows which of the available solids (from the database) has the highest stability and therefore the lowest solubility. The "mathematical" answer to the "chemical" question, based on the principles of thennodynamic eqUilibrium, will always be the particular solid (or set of solids) exhibiting the lowest solubility. Thus, the following questions are of central importance for the quality of the "mathematical" prediction:
a) Can the predicted solid be formed under the given conditions (chemical, physical, temporal)?
b) Is the predicted solid really present in the waste form?
c) Is it reasonable to assume that the predicted solid is a good model solid for the element in the given geochemical environment?
Unfortunately, these very important questions are not answered by the geochemical calculation. The least soluble solid is not inevitably the solubility limiting solid as is illustrated by the following example: For Pd the most stable solid available from the database is Pd4S, producing a solubility of 10-29 mol/l in the reference water. Since Pd4S is formed only in melts of PdlPdS, the conditions a) . and b) are not fulfilled (in addition it is not reasonable to assume that Pd4S is a good model solid for Pd in a geochemical environment) and the calculated solubility is meaningless. From this simple example it is obvious that relying only on the available thermodynamic database may (in many cases) lead to erroneous results. Therefore, the principle question is "what is the solubility limiting solid phase in the particular chemical environment"? A first step in answering this question is to calculate the solubility of all available solids and to exclude those giving unreasonable results (e.g. Pc4S as mentioned above, or solids producing concentrated solutions). A second step is a careful analysis of the particular chemical system. This does not require a mathematical tool but a sound chemical background and a good knowledge of the chemicallgeochemicalliterature. Even after these two steps a large uncertainty remains since: In many cases the safety relevant nuclides will not form independent and pure solid phases. In general the radionuclides will be constituents of intimate mixtures of solids, of solid solutions and/or of co-precipitates. Due to low overall concentrations in the repository, the chemistry of some nuclides will rather be determined by chemical analogues present in much higher concentrations than by the chemistry of the particular element (an inventory is given in Tab. 2). As an example Ra is mentioned, whose behaviour most likely will be determined by the chemically similar elements Ba, Sr and Ca: Considering a molar ratio Ca/Ra > 107 in the waste glass, the pure phases RaC03 and RaS04 are unlikely to form. In the repository environment only a few classes of solubility limiting solids need to be considered. Oxides/hydroxides, carbonates, sulphates, sulphides and possibly phosphates will be important, amongst them the oxideslhydroxides will be of main interest
- 3 -
Unfortunately, the calculated solubilities of oxideslhydroxides are often not very reliable as is exemplified by U02' For crystalline U02(cr) a solubility of 6 . 10-11 m01l1 is calculated, whereas amorphous U02(am) gives 7 . 10-5 m01l1. It is not very clear under which conditions and in which time periods U02(cr) will be formed from freshly precipitated U02(am)' A conservative estimate for the solubility limit will therefore give 7 . 10-5 molli. The potential decrease of 6 orders of magnitude cannot be assessed without further information (reviews like that from Finch and Ewing [23] may be helpful in this context).
Several times a paper given by Li [35] is cited and conclusions from this work serve as arguments in the discussions. It is clearly stated here that the data from Li (which are based on different kinds of sorption processes) are applicable for a static model concept (beaker situation) only. In a dynamic model (Le. diffusion through bentonite) sorption leads to retardation and not to decreased solubilities as long as a solubility limiting source is present
The corrosion products of the steel canisters (9000 kg Fe304/canister [27, Tab. 3]) may have an enormous sorption capacity if compared to particular radio nuclide inventories. One could argue that sorption will substantially reduce the dissolved concentrations if very low inventory/sorption capacity-ratios are considered. However, mechanistic sorption models, although available/developed [9, 20], are not yet in a fully operational state. In addition, Grauer [28] concluded that reversible sorption on corrosion products is insignificant if compared to sorption on the bentonite. Canister corrosion products are therefore neglected, an exception being the reduction of redox sensitive elements (e.g. Tc).
Although thermodynamic calculations are a very important tool, they are not sufficient on their own to estimate solubility limits (cf. Grenthe [29]). Therefore, several criteria to estimate solubility limits were considered in the present report:
i) Thermodynamic data ii) Chemical analogies iii) Repository inventories iv) Experimental values from laboratory and from natural systems
The present report presents "realistic" and "conservative" solubility limits. There is no sharp defmition of either "realistic" or "conservative" and the association of the numerical values reflects a subjective evaluation of the available facts.
c) Procedures applied
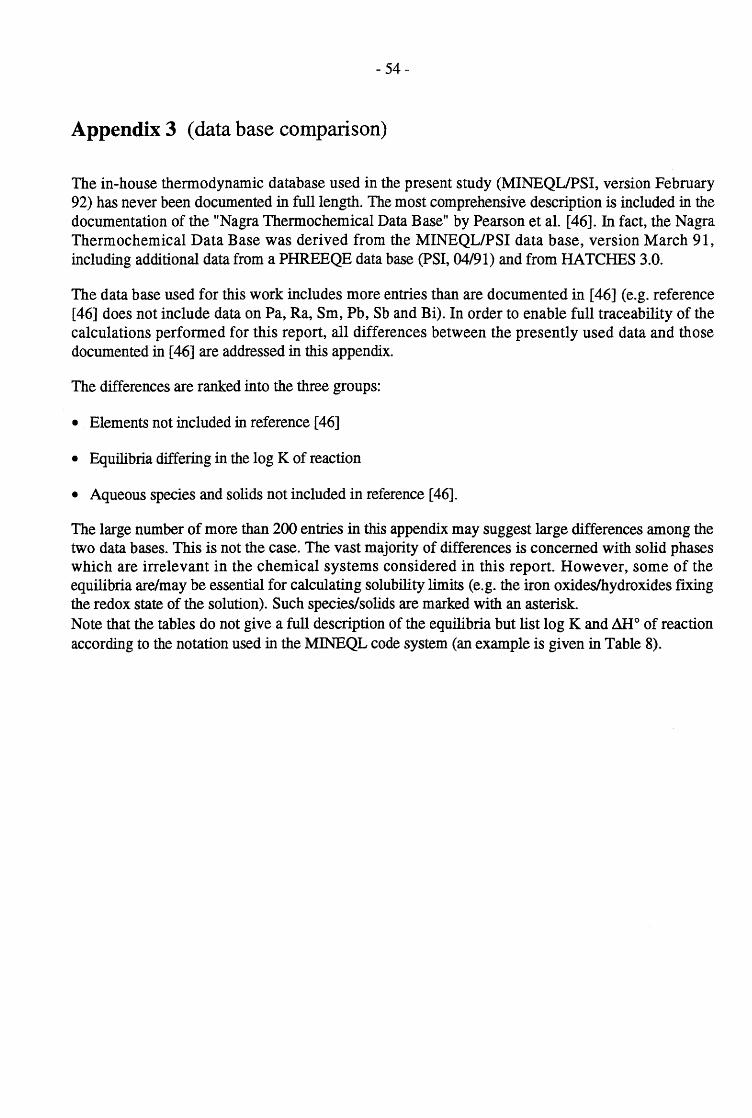
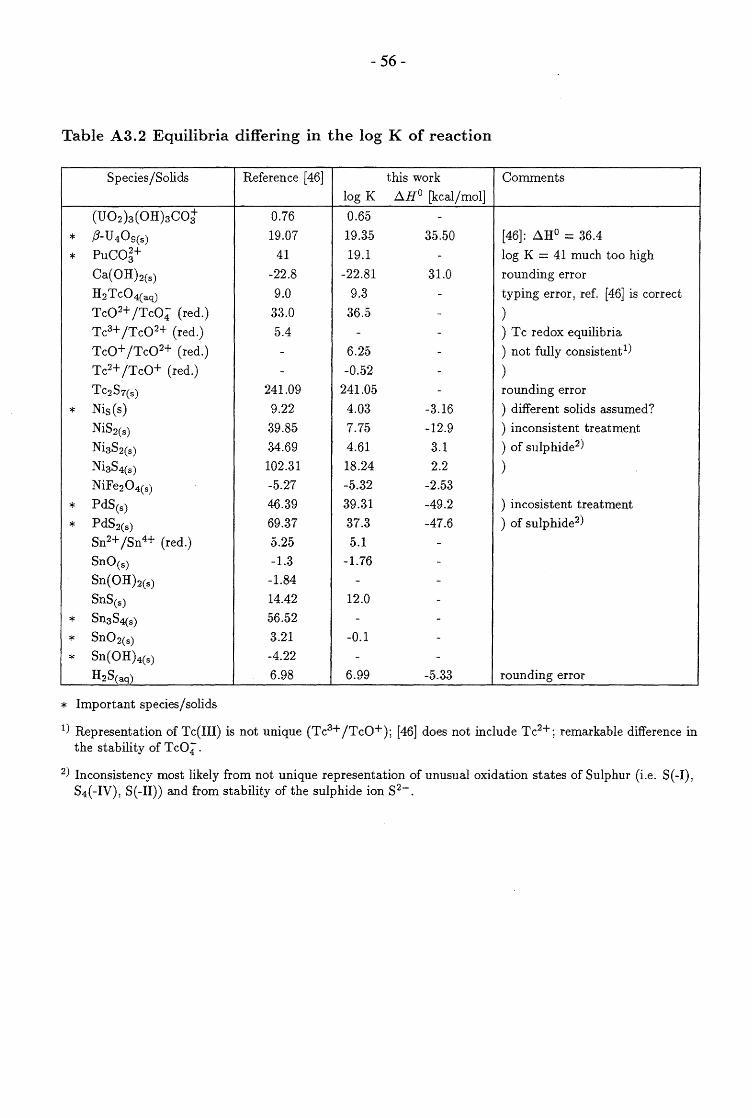
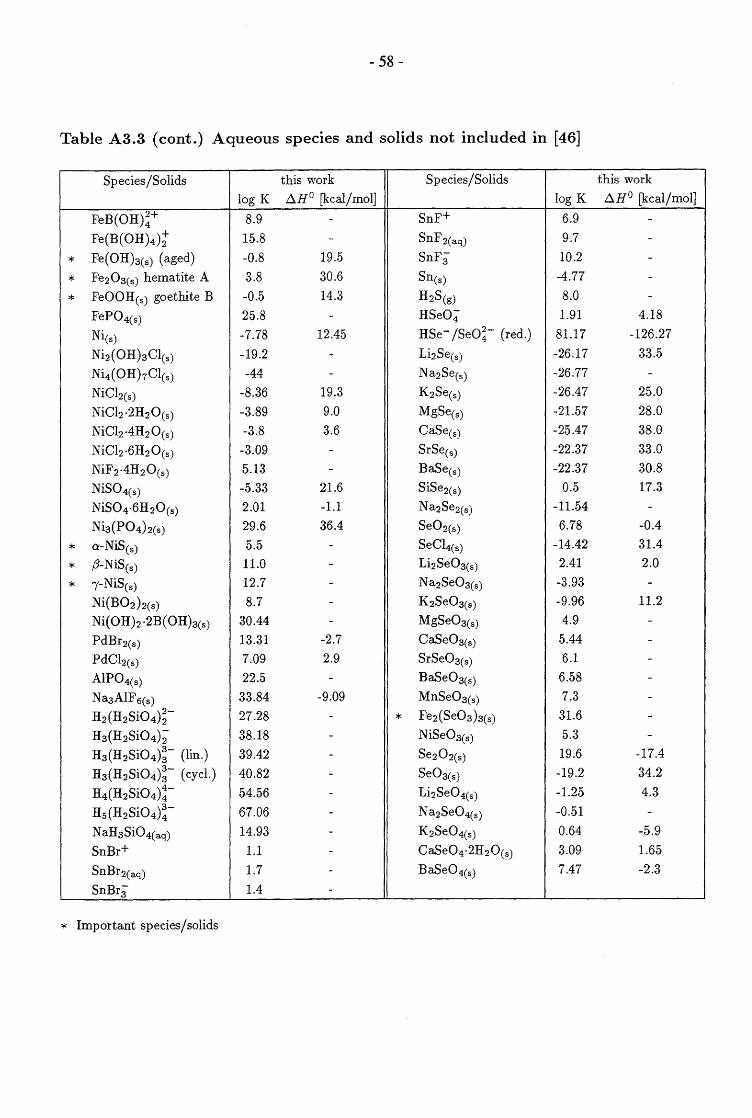
The geochemical speciation code MINEQLIPSI has been used as a "working horse" in order to calculate solubility limits and speciation in a given chemical system. The accompanying thermodynamic database was documented by Pearson et al. [45, 46]. The in-house database flie actually used for the solubility calculations (referenced in appendix 2) contains more entries than the selected set documented in [46] (e.g. reference [46] does not contain data on Pa, Ra. Sm, Pb, Sb and Bi). Most of the differences between the data actually used and those documented in [46] were already addressed in appendix B of reference [46]. However, in order to guarantee full traceability, all differences between the two data sets are listed in appendix 3. MlNEQLIPSI uses an approximated Van t'Hoff equation for the calculations at elevated temperatures (50°C; [55]), which implies a constant reaction enthalpy in the temperature range considered.
-4-
Unfortunately, enthalpy values for many of the reactions considered are not available. From this basic inconsistency, a notable uncertainty in the equilibrium constants may arise. These uncertainties are not further considered in the subsequent discussions. It should nevertheless be noted that the calculated 50°C-results have to be interpreted with care. For each element a straightforward step by step procedure was used to obtain the solubility of each solid phase available from the database:
A very slightly oversaturated solution was simulated by specifying a well-defined total concentration of the element (including inert counterions) in the set of mass balance equations of the reference bentonite pore water. The subsequent calculation quantified the precipitation of the least soluble solid phase and delivered the solution composition in equilibrium with this solid. The particular solid was then removed from the database (in tenns of MINEQL: moved to Type VI). The total concentration of the element (including inert counterions) was increased and the speciation calculation was performed again, delivering the solubility of the 2nd least soluble solid phase. This procedure was repeated until no more solids were available from the database. Such way of calculating solubilities gives no problems, as long as the precipitated counterion (CI-, F- , SO~-) is present in excess, or may be buffered by corresponding mineral dissolution
reactions (OH- , CO~-, HS -) and as long as total concentrations stay below levels for which activity coefficient corrections become significant If counterions with low concentrations contribute to solubility limits (e.g. PO~- having a Ctot of only"" 2 . 10-6 mol/l in the reference bentonite pore water), total inventories need to be considered in addition (the glass may supply a total of - 17 moles
of PO ~- per canister).
3. Reference solutions and inventories
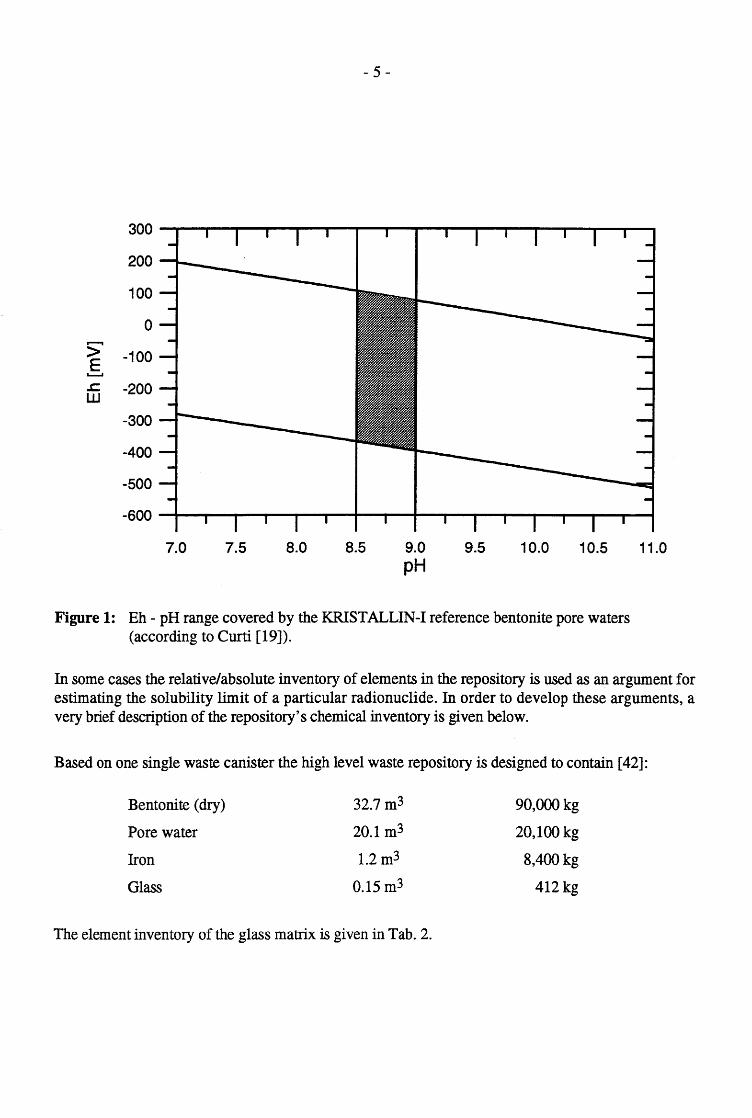
Several reference solutions were defmed, based on the modelled interaction of crystalline groundwaters with the technical barrier material bentonite. Starting groundwaters were a "Bottstein" reference groundwater used in Projekt Gewahr [40, Tab. 4 - 9] and a KRISTALLIN-I reference water called "Western Crystalline" [47]. These reference waters were "equilibrated" with an MX-80 bentonite. A detailed description of the modelling procedure and the resulting "bentonite pore waters" is given by Curti [19]. The derived bentonite pore waters cover a rather narrow pH range from 8.5 to 9 and, depending on the particularly selected redox model, a notable Eh range from reducing (-400 mY) to slightly oxidising conditions (+100 mV; Fig. 1). The most reducing conditions are considered to be most reasonable due to the large inventory of canister corrosion products and reducing species in the bentonite (FeS2) and also the fact that the deep groundwater is naturally reducing. Solubility limits for at least 4 different pore water compositions need to be evaluated to cover the whole shadowed area in Fig. 1. The modelled compositions of these 4 pore waters are given in Table 1.
300
200
100
a ,......., > -100 E ........... or:. -200 W
-300
-400
-500
-600
- 5 -
7.0 7.5 8.0 8.5 9.0 pH
9.5 10.0 10.5
Figure 1: Eh - pH range covered by the KRISTALLIN-I reference bentonite pore waters (according to Curti [19]).
11.0
In some cases the relative/absolute inventory of elements in the repository is used as an argument for estimating the solubility limit of a particular radionuclide. In order to develop these arguments, a very brief description of the repository's chemical inventory is given below.
Based on one single waste canister the high level waste repository is designed to contain [42]:
Bentonite (dry) 32.7 m3 90,000 kg
Pore water 20.1 m3 20,100 kg
Iron 1.2 m3 8,400 kg
Glass 0.15 m3 412 kg
The element inventory of the glass matrix is given in Tab. 2.
- 6-
Table 1 Modelled compositions of bentonite pore waters according to Curti [19]. The pH = 8.5 compositions are based on the "Bottstein" reference water, the pH = 9.0 compositions on the "Western Crystalline" reference water [47]. The particular redox model is indicated at the bottom of the table. Total concentrations of the indicated elements/components are given in moW, model temperature was 50°C. Values in parentheses ( ) are a consequence of the redox model and are given for completeness only. Missing charges are balanced with the proton (not shown).
Table 2 Chemical inventory of glass matrix as taken from the references [42] and [2]. The values are given in moles/canister and reflect the inventory of glass and waste 1000 years after emplacement. The inventories do not include the steel canister itself and the surrounding bentonite barrier.
First priority elements Second priority elements Other elements
Th 5.3 . 10-5 Ra 2.4· 10-7 Li 5.5 . 102
Pa 2.1 . 10-6 Zr 9.5 . 101 B 1.7 . 103
U 8.3 Nb 2.1 . 10-2 C 1.7 . 10-2
Np 3.5 Sn 1.2 Na 1.2 . 10-3
Pu 4.4 . 10-1 Pb 6.6· 10-3 AI 3.6· 102
Am 6.0· 10-1 Sb not avail. Si 3.1 . 103
Cm 3.8 . 10-3 Bi not avail. P 1.7 . 101
Tc 1.0· 101 Sm 7.8 Ca 3.0· 102
Ni 2.3 . 101 Cr 2.7 . 101
Pd 1.7 . 101 Fe 1.4· 102
Se 9.9 . 10-1 Zn 1.2 . 102
Mo 4.8 . 101
Ag 9.1 . 10-1
I 2.5 . 10-3
Cs 1.5 . 101
Ho 2.5 . 10-3
- 8 -
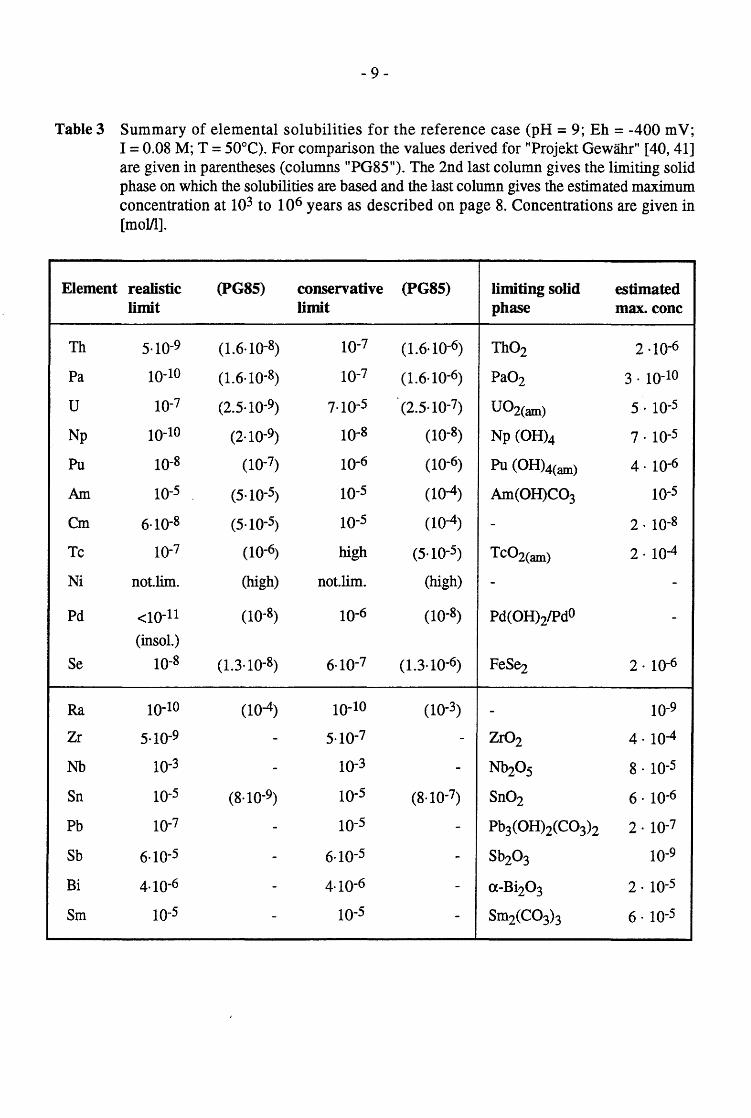
4. Results (first priority elements)
A summary of the estimated solubility limits is given in Tab. 3. For comparison the table also gives the solubility limits as calculated for "Projekt Gewahr" [40,41] and the solubility limiting solid phase used in the present particular calculation. The last column of Tab. 3 gives estimated maximum concentrations for the time span 103 to 106 years after emplacement, based on the simple release model DREG [32] by assuming congruent glass dissolution, the absence of solubility limits and diffusion barriers, and a water flux of - II/canister and year [M. Niemeyer, Colenco Power Consulting, pers. comm. 1992] (see also [42] appendix 2: Selection of safety relevant radionuclides). The elements in Tab. 3 are ranked into first (top) and second (bottom) priority, according to their expected/observed relevance in the final result of the whole KRIST ALLIN -I model chain. Hence, the detailed discussion of the solubility limits for the priority 2 nuclides is given in appendix 1.
For each element a table is given, listing the calculated solubility for each single solid phase available from the database. The distribution of species in solution (speciation) is given in column 3 and a reference number is given in the last column. In appendix 2 the reference number is translated into input-fIle names for QA/QC purposes.
- 9-
Table 3 Summary of elemental solubilities for the reference case (pH = 9; Eh = -400 mY; 1= 0.08 M; T = 50°C). For comparison the values derived for "Projekt Gewahr" [40, 41] are given in parentheses (columns "PG85"). The 2nd last column gives the limiting solid phase on which the solubilities are based and the last column gives the estimated maximum concentration at 103 to 1 06 years as described on page 8. Concentrations are given in [mol/l].
Se 10-8 (1.3.10-8) 6.10-7 (1.3-10-6) FeS~ 2 . 10-6
Ra 10-10 (10-4) 10-10 (10-3) - 10-9
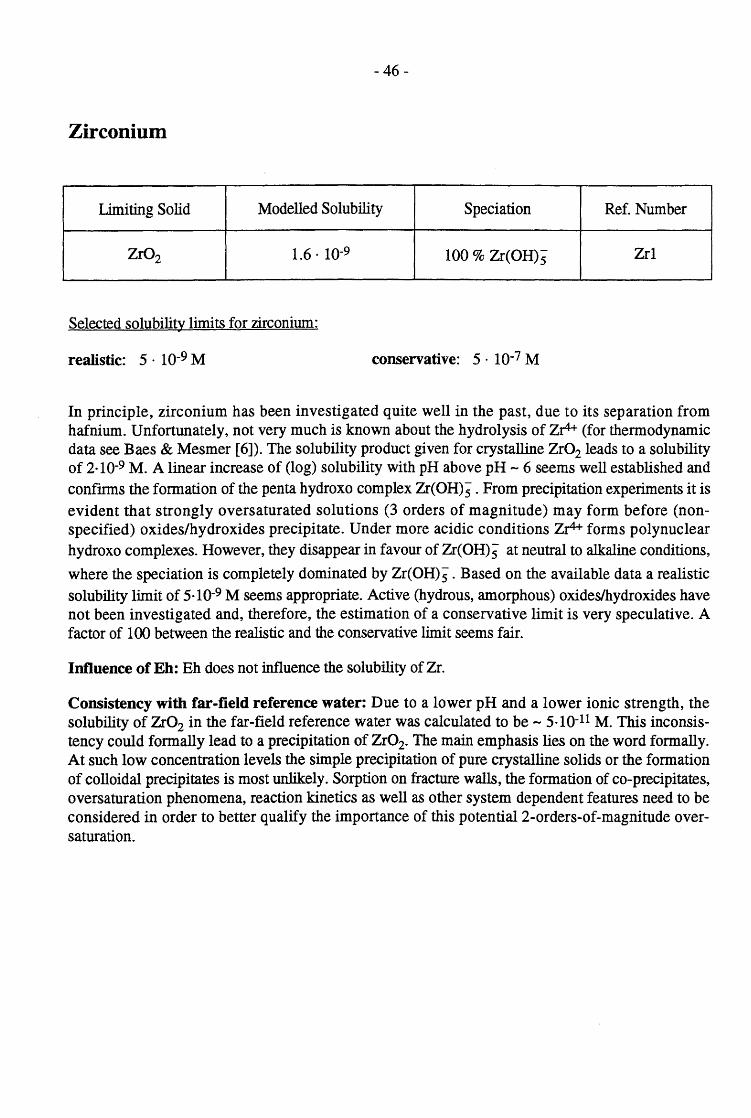
Zr 5.10-9 - 5.10-7 - Zr02 4· 10-4
Nb 10-3 - 10-3 - Nb205 8 - 10-5
Sn 10-5 (8.10-9) 10-5 (8.10-7) Sn02 6 . 10-6
Pb 10-7 - 10-5 - Pb3(OH)2(C03)2 2 . 10-7
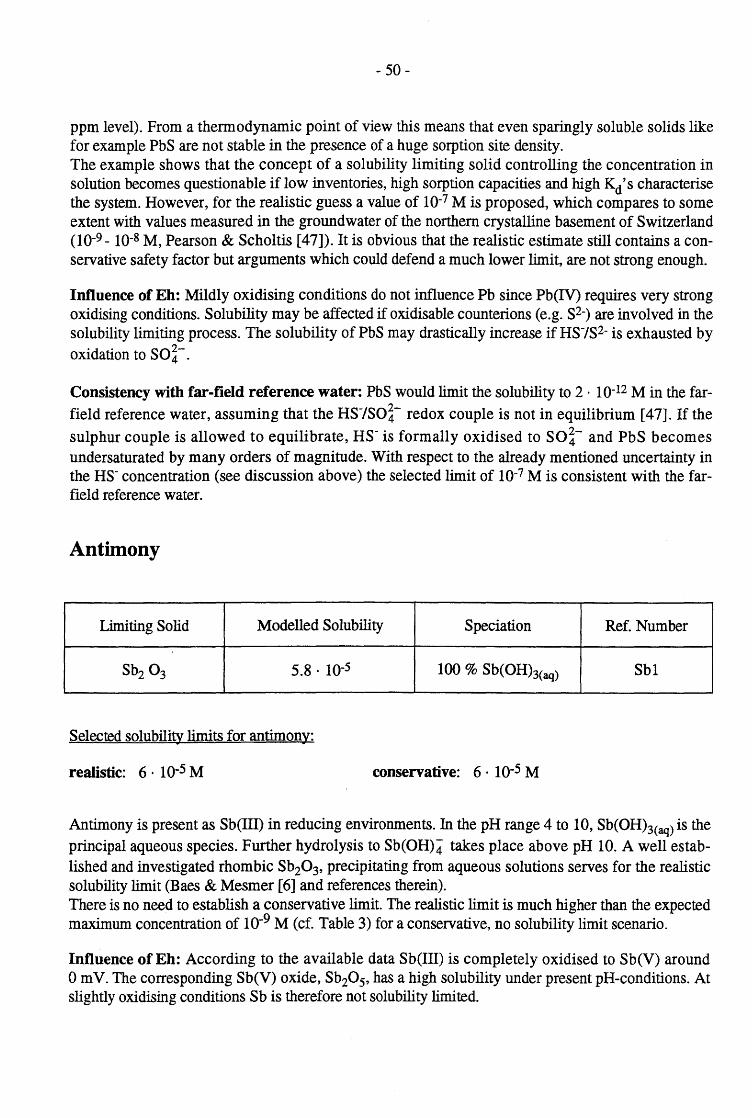
Sb 6.10-5 - 6.10-5 - Sb20 3 10-9
Bi 4.10-6 - 4.10-6 - a-Bi20 3 2 . 10-5
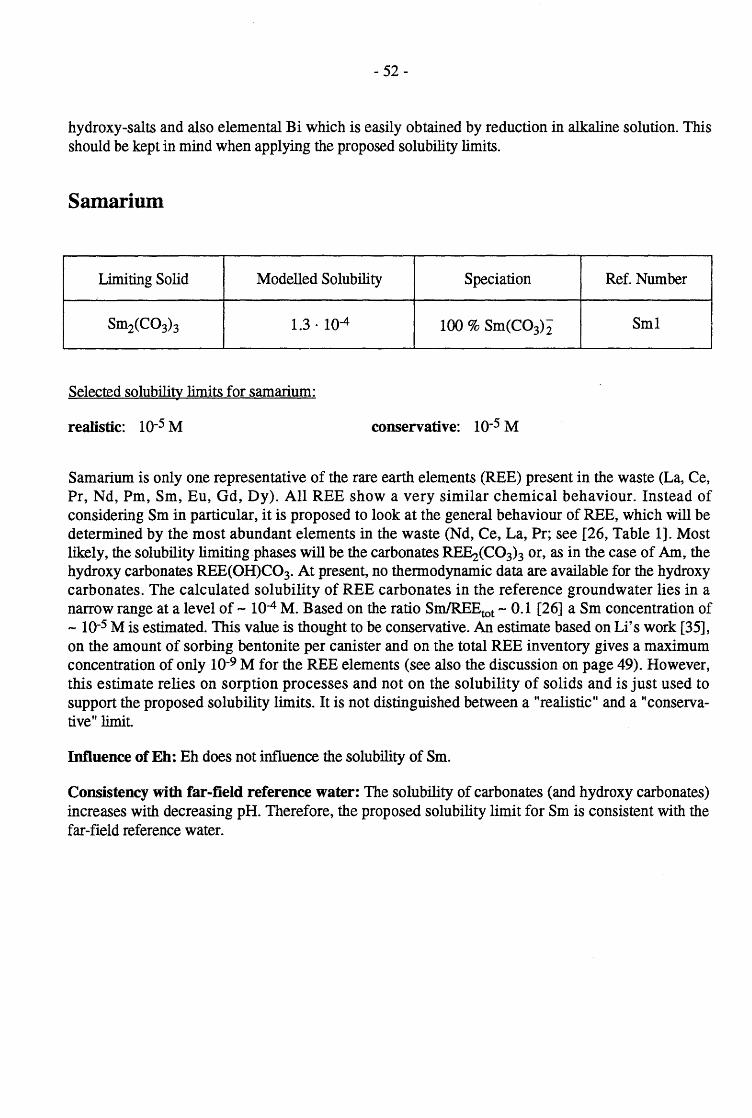
Sm 10-5 - 10-5 - Sm2(C03h 6 . 10-5
- 10-
Thorium
Limiting Solid Modelled Solubility Speciation Ref. Number
Th02 1.8 . 10-10 100 % Th(OH)4(aq) Th1
Selected solubility limits for thorium:
realistic: 5· 10-9 M conservative: 10-7 M
A well established value for the solubility of crystalline Th02 [6] produces Th concentrations around 2· 10-10 M in aqueous solutions. "Hydrous" Th02 has a higher solubility, leading to Th concentrations around 5 . 10-7 M (Baes & Mesmer [6] derived from Nabivanets [39] and Rai [SOD. This value has been confirmed very recently by Osthols [43] for a well characterised microcrystalline Th02 . 2.4 H20 with a very low degree of crystallinity. Almost nothing is known about the kinetic stability of these hydrous thorium oxides. Osthols [43] did not find any change towards a more crystalline product within 2 month. Based on the available inventory of Th in the repository, it is reasonable to exclude hydrous Th02 as solubility limiting phases. A comparison of the Th inventory with U and Zr (ZrfTh > Urrh> lOS; c.f. Table 2) reveals that Th may be regarded as an "impurity" of Zr and/or U. Therefore, it is unlikely that Th will exhibit a chemical behaviour independent of U and Zr. However, in the time span from 103 to 106 years about 300 times the original inventory of Th will be produced via different decay chains [2] and the term "impurity" must be taken with care, considering times> 103 years after closure.
Recent experiments from Ewart et al. [22] in cement pore waters (pH 13 and subsequently acidified down to pH 8.5) showed a pH-independent Th-solubility around 5 . 10-9 M, starting from 10-4 M solutions (precipitation experiments). Considering the uncertainties in the crystallinity of the precipitated phase, 5 . 10-9 M mol/l could serve as a realistic guess for Th02-solubility.
Following the hypothesis that Th solubility is dominated by u- or Zr-bearing solids, a limit can be estimated using a dilution factor of at least 105, based on the inventories (Table 2). Using the conservative estimates for U and Zr, Th concentrations of7 . 10-10 M and 5 . 10-12 M are obtained. In a strongly acidic environment Th forms polynuclear hydroxo complexes, which, in favour of
therefore an enhanced solubility at higher pH values are not to be expected (anionic carbonato complexes are addressed in chapter 7). There are no other criteria which would support a more conservative estimate and a conservative limit of 10-7 M is felt to be adequate.
- 11 -
Protactinium
Limiting solid Modelled Solubility Speciation Ref. Number
Pa02 5.1 . 10-11 100 % Pa(OH)I Pal
Selected solubility limits for protactinium:
realistic: 10-10 M conservative: 10-7 M
The ratio U : Pa in the glass matrix is at least 106 and Pa may be regarded as an "impurity" of U on the ppm level. An independent Pa chemistry can largely be excluded, the chemical behaviour of Pa will be determined by the chemistry of U (and Np + Pu). Based on the realistic estimate for U (10-7 M) and on a dilution factor of 106 (from relative inventories; see Table 2) a value of 10-13 M is obtained. Using a solubility product derived from U02 and Th02 (Baes & Mesmer [6], based on chemical analogy), a solubility of- 10-10 M is calculated for
crystalline Pa02' Thus - 10-10 M is regarded as a realistic estimate which implicitly implies a dilution factor (U : Pa) of only 103.
Pa(IV) is easily oxidised to the more soluble Pa(V)-oxide, which may participate in irreversible hydrolysis reactions. According to Baes & Mesmer [6], Pa(V) concentrations up to 10-5 M were observed in an acidic environment (pH < 3). A solubility of 10-7 M was selected as a conservative estimate, taking into account the poorly known oxidation and hydrolysis properties of Pa(lV)/ Pa(V). It should be noted that there are no additional arguments which would help to defend the given estimates and the uncertainty has to be qualified as large. However, the solubility limit for Pa is not critical since the total inventory (Table 2) and the expected maximum concentration according to the DREG model (Table 3) are very low.
- 12-
Uranium
Limiting Solid Modelled Solubility Speciation Ref. Number
U02(cr) 5.7 . 10-11 53 % U(OH)4(aq) Ul
47 % U02(C03)j-
USi04 5.4 . 10-10 do. U2
~-U409 6.3 . 10-9 do. U3
~-U307 5.0 . 10-8 do. U4
U02(am) 7.1 . 10-5 do. U5
Selected solubility limits for uranium:
realistic: 10-7 M conservative: 7· 10-5 M
For uranium, recently published and very well documented thermodynamic data are available [31], which served as the basis for the present calculations. Based on the available thermodynamic data only U02 needs to be considered as the solubility limiting phase at -400 mY, although the speciation calculation reveals about 50 % of the dissolved U being present as U(VI) due to complexation with CO~-. Oxides with mixed valences, U409, U307 and U30 8 are not considered. They are fonned by gradual oxidation of uraninite (U02) and not by precipitation from the solution (U409, U307 and U 308 may become important if fmal disposal of spent fuel is considered).
It is not defmitely known whether the thermodynamic properties of the insoluble USi04 are correct or not, but this is not the relevant question in this context. The question as to the presence/formation under repository conditions is much more interesting, unfortunately this question is not yet answered. However, one should not forget the potential formation of hexavalent uranium-silicates. The lack of thermodynamic data does not mean that such solids are not formed. The speciation in solution reveals that substantial parts of the dissolved U may be present as uranyl, even under reducing conditions. Finch and Ewing [24] state that "in fact, uranophane1 is probably the most common uranyl mineral in nature" and Atkins et al. [5] precipitated uranophane-type U-silicates from high pH solutions. Little is known about the thermodynamics of such phases and attempts at extracting thennodynamic constants from the few available experimental data were not very successful [7]. Strictly speaking, the only precipitable solid from the above list of available data is U02(am), a solid phase which is hard to characterise by means of a thermodynamic "constant",
- 13 -
The solubility ofU02 was investigated by many authors [12, 13, 14, 15,44, 53, 62]. The measured values strongly depend on the crystallinity and stoichiometry (U02 is known to be non-stoichiometric) of the solid phase and on the way the redox potential is controlled at the required low level (see the controversy between Bruno [12] and Rai [53]). The modelled solubilities of 6 . 10-11 M for U02(cr) and of 7 . 10-5 M for U02(am) reflect these effects of crystallinity (and redox control). The solubility of U02(am) measured by Bruno et al. [12] is used as the conservative limit. It is almost certain that the realistic limit is much lower (see [53] and also the discussion in chapter 7), the lowest limit is given by the solubility of the crystalline U02 (6 . 10-11 M). Whether, and how fast a freshly precipitated amorphous U02 transforms to its insoluble, crystalline form is still an open question and, therefore, it remains somewhat speculative to fix a realistic solubility limit
Natural U concentrations in groundwaters and in boreholes fall into the range 5.10-8 to 5.10-10 M [56], in sea water into the range 5 . 10-9 M [11, 35]. In alkaline cement pore waters (pH 9 to 12), U concentrations from 10-6 to 10-8 M were measured by Atkins et al. [5]. Recent experiments performed by Rai et al. [53] under rigorously controlled redox conditions (iron powder or Eu2+) showed total dissolved U concentrations from 10-7 to 10-8 M in the pH range 4 to 13. Based on these experimental information, a realistic limit of 10-7 M is selected.
Neptunium
Limiting Solid Modelled Solubility Speciation
Np02 2.6 . 10-14
Np(OH)4 8.1 . 10-11
Selected solubility limits for neptunium:
realistic: 10-10 M
97 % Np(OH)s
2% Np(OHhC03"
1 % Np(OH)4(aq)
do.
conservative: 10-8 M
Ref. Number
Npl
Np2
At -400 m V Np is present in the tetravalent state, pentavalent NpO! is not expected to be present
below -200 mY. Np(IV) forms carbonato complexes like the other tetravalent actinides but the available speciation data favour the hydroxo complexes. The calculated speciation is dominated by
Np(OH) 5 , a complex whose formation constant should be reviewed in more detail. Experiments
performed by Bruno et al. [12] showed a minor importance of the analogous uranium penta-hydroxo complex. In addition, solubility experiments in cement porewaters ([48]; pH 10 to 13) gave no
evidence for the formation of the anionic Np(OH) 5" and it is likely that the present data set over
estimates its formation constant. For Np(IV) oxides/hydroxides one would expect solubilities similar
- 14-
to those of U(N). However, the data from Baes & Mesmer [6] give 3 . 10-14 M for crystalline Np02 and 9 . 10-11 M for an unspecified Np(OH)4. U sing the few available and not very reliable data, the selection of solubility limits becomes quite speculative. Solubilities measured in cement pore waters (,... 10-8 M, Pryke & Rees [48]) serve for estimating the conservative value. The solubility of Np(OH)4 (-- 10-10 M) according to Baes & Mesmer [6] is proposed for the realistic solubility limit. However, it should be noted that the rationale behind this selection cannot be fully justified.
Plutonium
Limiting Solid Modelled Solubility Speciation
PU02(cr) 1.0.'10-9
Selected solubility limits for plutonium:
realistic: 10-8 M
100 % Pu(C03)~-
conservative: 10-6 M
Ref. Number
Pu1
Basically, a chemical behaviour similar to U(N) is expected for Pu(N), but the available thermodynamic data exhibit remarkable differences between U(IV) and Pu(IV). The reasons for these differences are still an open question (see chapter 7). Data for Pu solids are sparse, besides a nonspecified "Pu(OH)4" of very dubious quality, crystalline Pu02 is the only solid phase contained in the database. Using the carbonato complex formation constants given in the database and a solubility constant similar to that of U02(am) one would calculate an unusually high solubility of about 10-3 M Pu. It is most likely that the presently used thermodynamic data overestimate the formation of
Pu(C03)~-2x complexes by orders of magnitude.
Puigdomenech & Bruno [49] give evidence that crystalline Pu02 as well as freshly precipitated "Pu(OH)4" are radiolytically transformed to a new oxide/hydroxide. Due to the sparsity and uncertainty of thermodynamic data, the present solubility limit estimates are based on the experimental data given in [49]. According to this reference, the solubility of Pu(OH)4(am) depends on pH, decreasing linearly below pH - 8 (slope - 0.9). In the pH range from 8 to 10, solubilities around 10-10 to 10-9 M were found by Puigdomenech & Bruno [49, Table 4.2] (see also Pryke & Rees [48]). Substantially higher Pu concentrations were found in solutions containing carbonate (-10-8 M, [49, Tables 4.6,4.7]), indicating that carbonato complexes indeed are formed and need to be considered. The realistic estimate was selected as 10-8 M. The same order of magnitude is obtained, if the realistic estimate for U is multiplied with the molar ratio Pu : U calculated from the inventories (assumption of chemical analogy). The conservative estimate of 10-6 M takes into account the uncertainty of experimental values and also the observation that "Pu(OH)4" solubility increases if measured at pH-values below pH ... 8.
- 15 -
Americium
Limiting Solid Modelled Solubility Speciation Ref. Number
Am2(C03)3 7.5 . 10-7 77 % Am(OH)(C03)~- AmI
18% Am(OHhC03
2 % Am(C03)2 1 % Am(C03)~-
1 % Am(OH)C03(aq)
AmP04 1.2 . 10-6 do. Am2
Am (OH)C03 7.4· 10-6 do. Am3
Selected solubility limits for americium:
realistic: 10-5 M conservative: 10-5 M
Solid AmP04 is not considered, since the given value for total PO~- in the reference groundwater (1.6 . 10-6 M) is not well defmed, the uncertainty is at least one order of magnitude. In addition, the free [PO~-] concentration (the relevant quantity if the precipitation of AmP04 is considered) is much lower than the total phosphate (around 10-9 M). At those concentrations the precipitation of solids may be kinetically hindered. According to the database, Am2(C03h is more stable than the hydroxo carbonate Am(OH)C03' but the speciation calculation reveals that more than 95 % of the dissolved Am is present as ternary hydroxo carbonato complexes. Therefore, Am(OH)C03(s) is selected as the more realistic solubility limiting phase and the solubility is estimated to be 10-5 M.
Recently published papers by Felmy et al. [23] and Meinrath & Kim [37] draw an improved picture of the Am carbonato complexes and give more reliable data. Especially the work of Felmy et al. [23] shows, that there is no need to assume the existence of ternary hydroxo carbonato complexes in order to explain the available experimental data. Most likely, the present database overestimates the formation of ternary hydroxo carbonato complexes and, therefore, overestimates the solubility limit for Am by at least 1 - 2 orders of magnitude. However, as outlined in the preliminaries, the database could not be changed during the ongoing work. Improved thermodynamic values will be established in the next revision of the database. Compared to the recently published Am data the selected "realistic" solubility limit will in fact be a conservative value. Therefore, 10-5 M are also proposed for the "conservative" limit.
- 16 -
Curium
Selected solubility limits for curium:
realistic: 6.10-8 M conservative: 10-5 M
Thermodynamic data on em are very sparse in the open literature, solubility data are not known. The recently reported hydrolysis constants for em (log 1311 = 6.7, log 1312 = 12.1; Wimmer et ale [64]) are very close to the values available for Am(III) hydrolysis. The chemical analogy em-Am is obvious and, therefore, the selection of "solubility limits" is based on the assumptions that
a) the chemical behaviour of em is not substantially different from Am chemistry and
b) that em chemistry is dominated by Am and rare earth elements (REE) under given repository conditions.
In other words, em is treated like Am. The ratio em/(Crn + Am) in the waste is about 6 . 10-3
(Table 2). Thus, the realistic limit is obtained from the estimate for Am by multiplication with this ratio. The "realistic" value for Am is used as the conservative estimate for Cm. Note that the estimate for em is as conservative as is the estimate for Am, since Cm is directly "coupled" to Am following the assumptions above.
Technetium
Limiting Solid Modelled Solubility Speciation Ref. Number
TC2S7 - TcS2 (4 . 10-44) -- Tc1
TcO (8 . 10-21) -- Tc2
TC304 (5 . 10-19) -- Tc3
Tc(OH)3 9 . 10-16 -- Tc4
Tco 3 . 10-13 -- Tc5
TC02(am) 3.8 . 10-8 83 % TcO(OH)2(aq) Tc6
17 % (TcO(OH)2)2(aq)
- 17 -
Selected solubility limits for technetium:
realistic: 10-7 M conservative: high
The speciation calculations consider 7 different oxidation states of Tc (TcO, Tc2+, TcO+, Tc02+, TcO~-, TcO~-, TcO:;), but the available data are of dubious quality. The data were uncritically taken, as a block, from the HATCHES 4.0 database [18]. The basic source of the data was a "critical review" from Rard [54] (as an exception the solubility product of Tc02(am) was taken from an EQ3/6 database). Hydrolysis reactions ofTc are not well known: the famous Baes & Mesmer review [6] gives only 7 lines of text under the heading technetium. Unfortunately, a detailed and critical valuation (like the one for uranium [31]) of thermodynamic Tc data is not yet available.
In oxidising aqueous solution, the very soluble pertechnetate TcO:; is the stable form of Tc, but at -400 m V present data predict the tetravalent Tc to be stable.
Based on the model calculations, only TcOand Tc02(am) need to be considered as solubility limiting solids. For all the other solids (Tc2S7' TcS2' TcO, TC304' Tc(OH)3) the conditions of their formation is not clear and/or the modelled solubilities have no sensible chemical meaning. Brookins [10] proposed to use TcO and Tc(OH)2(s) as the stable phases, but no data are available for Tc(OH)2(s)'
Considering the oxidation products (magnetite) from the steel canister and their sorption properties, one may suppose a reductive sorption of soluble TcO:; , resulting in the formation of amorphous Tc02' This view is supported by a recent paper given by Eriksen et al. [21]. These authors prepared Tc(lV)-oxide by electro-reduction on a platinum mesh from aqueous solution at - 0 mY. Tc02(am) is the only solid phase for which a chemically sensible solubility is obtained and, therefore, serves as the basis for the solubility limit estimation. Based on the calculated solubility of 3.8 . 10-8
molll a realistic estimate of 10-7 M is proposed, taking into account that the database contains no data on carbonato complexes of Tc. Eriksen and his co-workers [21] found total Tc concentrations around 10-8 M (pH 6 to 10) in a carbonate-free system and concentrations around 10-7 M in bicarbonate solutions (100 % CO2 atmosphere, pH 6 to 8). A conservative solubility limit is not given, due to the uncertainty of the thermodynamic data and the sensitivity of the Tc system towards the redox potential and hence it should be termed as "high".
- 18 -
Nickel
Limiting Solid Modelled Solubility Speciation Ref. Number
NiSi03 8.6 . 10-13 99 % Ni(C03)~- Nil
1 % NiC03(aq)
"(-NiS 3.4· 10-11 do. Ni2
~-NiS 1.7 . 10-9 do. Ni3
a-NiS 6.8 ·10-4 do. Ni4
(NiC03, NiO, (0.1 - 1) -- --Ni(OH)2)
Selected solubility limits for nickel:
realistic: not limited conservative: not limited
No solubility limit can be estimated based on the available solubility data. NiSi03, with a solubility around 10-12 M, is an idealised high temperature phase (an end-member of the pyroxene group) and will not form by precipitation from aqueous solution. The three sulphides (a-, ~-, y- NiS) give solubilities ranging over 7 orders of magnitude. It is not known if any of these sulphides could form under repository conditions and, if so, what degree of crystallinity it would have. NiC03, NiO and Ni(OH)2 have not been modelled, very high solubilities around 0.1 to 1 M were estimated from their saturation indices. In pure water Ni could be limited on a level of 10-6 to 10-5 M by Ni(OH)2, but
due to the formation of stable carbonato complexes (Ni(C03)~-' NiC03(aq)) the solubility in the reference pore water is drastically increased.
However, in terms of the subsequently applied release model and based on the available solubility limiting phases, Ni has to be considered as not solubility limited.
It is obvious, that "not solubility limited" does not mean that Ni will be present in its maximum possible concentration of .... 0.6 M (23 moles (Table 2) dissolved in the reference volume for dissolution; 37 lIcanister [42]). Within the bentonite barrier the concentration of dissolved nickel will be much lower, most likely limited by the enormous sorption capacity of the barrier material. In a dynamic system sorption usually leads to retardation and not to a decrease of concentration. The present situation is somewhat different. The potentially available sorption capacity from barrier materials (and corrosion products) is much higher than the total source of Ni. The relative occupancy Ni/[available sorption sites] will not exceed 1 %. Therefore, the distribution of Ni between solid and aqueous phase should lead to low Ni concentrations. Considering .... 9 tons of iron corrosion products, 25 moles of Ni and a Rct-value of .... 103 mllg [1], the dissolved Ni is estimated to be 10-6 -
- 19-
10-5 M (with an occupancy of - 3 J,lmol NiI[g of corrosion products]). Ni sorbs strongly on clayish materials, Aksoyoglu [1] gives minimum Rd values of 102 ml/g. Considering sorption on the bentonite, a maximum of only 10-5 molll of dissolved Ni is expected. From nearly 400 analyses of Swiss groundwaters an averaged Ni-concentration of - 10-7 M is estimated, whereby the highest concentrations lie around 5 . 10-6 M. Li [35] estimates - 10-8 M Ni for seawater, based on a variety of immobilisation/sorption mechanisms.
The sum of these observations/estimates suggest that a realistic solubility limit of - 10-7 M and a conservative estimate of - 10-5 M might be defendable in a future analysis.
Palladium
Limiting Solid Modelled Solubility Speciation
(Pd4S) (2 . 10-29)
(Pdo) (1 . 10-27)
(PdS) (6 . 10-26)
(PdS2) (8 . 10-15)
Pd~ 1.3 . 10-9
Pd(OHh 1.7 . 10-6
Selected solubility limits for palladium:
realistic: insoluble (10-11 M)
--
--
--
--
100 % Pd(OH)2(aq)
do.
conservative: 10-6 M
Ref. Number
Pd1
Pd2
Pd3
Pd4
Pd5
Pd6
According to the available data, Pd speciation around pH = 9 is very simple; only Pd(OHh(aq) is formed. Pd may form strong complexes with Crand Br- but, considering reference groundwater levels of cr and Br-, halogeno complexes will not form above pH - 3. Several very insoluble Pdsulphides are known (PdS, PdS2), leading to formal solubilities in the range 10-26 M to 10-14 M. Little is known about the conditions which would support the formation of such sulphides (as already mentioned in the introduction, "Pd4S" is not formed in geochemical systems) and the fact that the platinum elements may be removed from solution by precipitation with H2S does not help, 10-26 M is effectively as "insoluble" as 10-15 M (for example). In reducing systems PdQ becomes stable but, also in this case, the calculation gives a formal solubility of 10-27 M.
For the chemist such low numbers do not have a sensible meaning (10-26 M means 1 molecule/atom per 150 litres of solution); the term "insoluble" is a better description in this case. Unfortunately,
- 20-
"insoluble" is not quantitatively defmed and, therefore, a concentration just below the presently valid detection limit of ..... 10 ppt (10-10 M) is used to give a numerical value for this tenn.
The oxide and the hydroxide of Pd2+ have been characterised, and solubilites of 2 . 10-9 (PdO) and 2 . 10-6 (Pd( OH)2) were calculated for these phases. The oxidelhydroxide phases serve as the basis for the conservative estimate, but it is unknown whether a transformation Pd(OH)2 ~ Pd~ takes place under repository conditions. The Pd-inventory in the repository is remarkably high (10 - 20 moles/canister), the dilution by inactive isotopes decreases the solubility of the active isotopes by, at most, a factor of 10. Additionally, the potential formation of strong Pd-complexes with so called soft ligands (e.g. amines from microbiological activity) should be taken into account. Although not considered in the present calculations due to a lack oidata, such ligands could play an important role especially in the case of Pd. Therefore, the solubility of Pd(OH)2 is selected for the conservative estimate.
Selenium
Limiting Solid Modelled Solubility Speciation Ref. Number
FeSe2 6.0· 10-7 100 % HSe- Sel
Sea 6.3 . 10-5 do. Se2
( Fe2(Se03h ) (high) -- --
Selected solubility limits for selenium:
realistic: 10-8 M conservative: 6· 10-7 M
In a reducing environment, selenium shows a behaviour very similar to that of sulphur. In principle, one would therefore also expect similar solubility limits for both elements. The waste glass inventories for Se and S are comparable, neglecting the fact that the surrounding bentonite contains substantial amounts of pyrite as an impurity. The argument of dilution of Se by S (as in the case of Ra by Ca; see page 45) is not applicable in these particular circumstances. At -400 mV Se is present as selenide or as elemental selenium. The repository contains sufficient amounts of metals (Fe, Pb, Ni, Pd) being able to precipitate selenide and to keep Se on a low concentration level. The selenium analogue of pyrite (FeSe2), exhibiting a solubility of ..... 6 . 10-7 M, may serve as an example. The solubility of Se calculated from the dissolution of FeSe2 compares well with the sulphide concentration (S(-ll) - 10-6 M) resulting from pyrite saturation. This value is used as a conservative estimate. It is very likely that Se will be fixed on the surface of the canister corrosion products. Corresponding indications are given by Suter [61, and references therein]. However, the chemical form of the sorbed Se is a subject of speculation since the spectrum of sorbed compounds may range from selenide (FeSe) to sorbed elemental Se. In addition, the potential formation of sparingly soluble
- 21 -
selenides (e.g. PdSe, PbSe) should be considered. The realistic solubility limit is supposed to be below the 6 . 10-7 M calculated for FeSe2' A lower limit of - 10-12 M may be estimated based on the solubility of PbS and on the analogy among sulphur and selenium. As a representative for natural systems Li [35] gives selenium concentrations around 10-9 M for sea-water, but the relevance of this number to repository systems is very uncertain. The geochemical behaviour of Se, although most likely similar to that of sulphur has not yet been worked through in full depth. A reasonably well confirmed realistic estimate cannot be given, based on the presently available data. However, a realistic estimate of 10-8 M is felt to be appropriate.
5. Influence of pH and Eh
Full calculations have been performed for only one of the reference solutions given in Table 1. The four reference solutions cover a rather narrow pH-range from 8.5 to 9. Scoping calculations using the "Bottstein"-type reference water revealed an insignificant effect of a 0.5 pH-unit shift on the solubility limit. In this context "insignificant" means that the uncertainty based on thermodynamic data and/or introduced by the selection criteria is much larger·than the calculated differences arising from a small pH shift or from an ionic strength difference.
The situation is completely different if Eh is considered. Depending on the selected redox model (either magnetite, haematite and pyrite or magnetite and goethite; see Curti [19; p. 46]) the calculated Eh varies between - -400 mV and - +100 mY. Therefore, the solubility limit of redoxsensitive radionuclides is strongly affected by the choice of the redox model. The reducing nature of the near-field seems to be well established. A still open key problem may be the kinetics of reduction of elements being present in an oxidised form in the glass leachate.
However, for the solubility of nuclides ranked into first priority (those discussed in chapter 4) the consequences of a non-reducing environment (- +75 mY) are discussed in the following paragraphs by assuming instantaneous (redox) equilibria. Table 4 on page 23 gives a summary and a comparison with the reference case.
Thorium
The aqueous chemistry of Th is limited to the tetravalent state, Th itself is not redox sensitive. Since, in addition, thorium complexes or minerals with redox sensitive anions are not considered in the present study (if they exist at all), Th solubility as presented in this report is not affected by Eh.
Protactinium
Pa(lV) is easily oxidised to Pa(V), according to Baes & Mesmer [6] the redox potential of the couple Pa(V)/Pa(IV) is below +100 mY. The same reference notes that maximum concentrations around 10-5 M were found in very acidic solutions (pH < 3), but that Pa(V) undergoes irreversible hydrolysis and precipitation above pH 5. Potentially, the solubility limit of Pa increases with increasing Eh but, following the discussion for Pa under reducing conditions, the maximum concentration does not become critical. Based on the
- 22-
relative inventories of U and Pa and on the maximum U concentration at non-reducing conditions, - 5 . 10-11 M are estimated.
Uranium
At +75 mV U(VI) becomes stable, UO~+ being the principal uranium species. Present thermodynamic data suggest that high equilibrium concentrations (- 0.1 M) have to be expected due to formation of carbonate complexes of the uranyl cation. Parameter variations showed the redoxsensitivity of the uranium system in this Eh range. If the system is modelled at -140 mY, U(IV) becomes increasingly important and the oxides U02(cr)' U 409 or U 307 would limit the solubility around 10-3 M. However, following the discussion on page 12, the limiting solid phase could also be an U-silicate of the uranophane-type.
Neptunium
The calculated solubility at +75 mVis 7 . 10-10 M, Np(OH)4 being the limiting solid. The increase by a factor of about ten compared to the concentration in the reducing environment is due to the stabilisation of Np(V) in solution. At +200 mV the prediction is 10-7 M (100 % Np(V» and at +300 m V 2 . 10-6 M are calculated (95 % Np(V) / 5 % Np(VI». With increasing Eh, an increased solubility is expected but the situation does not seem to be as critical as in the case of uranium where the +VI oxidation state is already dominant at +75 mY. Some uncertainty arises form the poorly known stability of hydroxo- and carbonato complexes (binary Np(IV)-carbonato complexes are not yet included in the database). Considering such complexes based on a comparison with other tetra-, penta- and hexavalent actinides (see chapter 7) would probably shift the stability fields of the IV-, V- and VI-oxidation states. However, at +75 mV a solubility limit of 10-9 M is selected.
Plutonium
At +75 mV Pu is still in the tetravalent state, the calculated solubility based on PU02(cr) is 10-9 M, with the dominant complex in solution being PU(C03)~-. The calculated solubility is directly coupled to the formation constants of the Pu(JV) carbonato complexes which, besides the solubility of the plutonium oxide, are the main source of uncertainty in the calculated solubility. Eh does not affect Pu solubility up to - +350 mY, the redox potential where Pu(VI) becomes significant. Even at +500 mY, a limited solubility of only 6· 10-7 M is calculated.
Americium
According to Schulz & Pennemann [57, p. 920] the stability field of Am (IV) is restricted to very concentrated solutions of H3P04, K4P20 7, phosphotungstate, NH4F or KF. Am(IV) disproportionates in nitric and perchloric acid solutions. Am(V) and Am(VI) may be prepared by oxidation of Am(ID) with strong oxidants like ozone or peroxidisulphate. The standard potential of the couple Am(lV)/Am(III) in perchloric acid is more than +2 V and, therefore, an oxidation state other than ( + ill) is not to be expected under the more oxidising repository conditions. The "solubility limit" is the same as in the reference case.
- 23-
Table 4 Influence of a non-reducing environment on the solubility limit of selected radio nuclides.
Th
Pa
U
Np
Pu
Am
Cm
Tc
Ni
Pd
Se
A comparison is made with the "reference case" limits selected in chapter 4. Concentrations are given in moUl, reference solution compositions are given in Table 1.
.t Reference case t t: Non-reducing environment reducing conditions pH = 9; Eh = -400 m V pH=9; Eh=+75mV
5 . 10-9 Th02 5 . 10-9 Solubility not affected by Eh; Th4+ not redox sensitive.
10-7 U02(am) high Hexavalent UO~+ is stable, strong com-plexes with carbonate lead to high concentrations.
10-10 Np(OH)4 10-9 Np(V) is dominant but significant amounts of Np(IV) are still present. Np(OH)4 is selected as limiting solid.
10-8 Pu02(cr) 10-8 Pu(IV) carbonato complexes still dominant at +75 mY. Oxidation to Pu(V), Pu(VI) and increased solubility is not expected below +350 m V.
10-5 Am(OH)C03 10-5 No other oxidation state than (+111) is stable under present conditions. Solubility limit is therefore identical to reference case.
6 . 10-8 -- 6 . 10-8 Cm(IV) will not form under present conditions. Solubility limit is identical to reference case.
10-7 Tc02(am) not limited Very soluble pertechnetate (Tc04J is stable at +75 mY. Tc is very sensitive to Eh in the range -400 mV to +75 mY.
not limited not limited Ni is not redox sensitive under con-sidered conditions.
< 10-11 PdQ < 10-11 Elemental Pd is stable up to +200 mY. Pd remains insoluble, which is expressed as < 10-11.
10-8 FeSez high Selenite is the stable redox state; selenate is not formed. According to present data selenites are reasonably well soluble.
- 24-
Curium
According to Schulz & Pennemann [57; p. 979] the potential of the couple Cm(IV)/Cm(ID) is very high (-- 3 V) and Cm(IV) will not form, even under less reducing repository conditions. The solubility of curium is the same as in the reference case.
Technetium
At +75 m V the pertechnetate ion TcO:; is the stable form and Tc will have a high solubility (in fact: not limited). Tc is very sensitive to the redox potential in the range +75 mV down to -400 mY. Around 0 mV TC02(am) becomes stable and limits the concentration at -- 10-5 M. The concentration continuously decreases with decreasing Eh, at -- -300 m V elemental Tc becomes more stable than TC02(am) (the calculated solubility at - 300 mV is -5 . 10-8 M).
Nickel
The aqueous chemistry is limited to the bivalent oxidation state under present conditions. Therefore, Ni is not sensitive to Eh and the "not limited" qualifier holds also for the less reducing medium.
Palladium
Pd~ and/or Pd(OH)z are not redox sensitive; Pd sulphides become unstable above -- -250 mV due to oxidation of the sulphur. The only solid which needs to be considered is elemental Pd. PdO is stable up to -- +200 mV and keeps Pd concentration very low (-10-12 M). Above -- +200 mV PdO dissolves and PdO/Pd(OH)2 will be the solubility limiting solids. It is expected that up to +200 m V Pd is not significantly affected by Eh and that the term "insoluble" (expressed as < 10-11 M) still holds.
Selenium
Selenite (SeO~-) is the stable form at +75 mY. Selenate (SeO~-), known as a strong oxidation
agent, is less relevant. The calculated solubility of selenium is very sensitive to Eh in the range from -400 mV to +100 mY. The reason for this sensitivity is the formation of insoluble, elemental selenium. Starting from the upper, more oxidising end of this range one calculates a high Se concentration since selenite is stable at + 100m V. Below - -70 m V the insoluble, elemental Se becomes
stable. The equilibrium SeO~-/Sf!(s) determines selenium solubility, which decreases with decreasing
Eh to a minimum of 10-11 to 10-10 Mat - -170 mY. At this point, the speciation in solution changes. The equilibrium determining the solubility is now given by HSe -/Se(s) and the calculated solubility increases if Eh is decreased further. At - -290 m V the pyrite analogue FeSe2 becomes stable and the solubility is limited by the equilibrium HSe -lFeSe2(s).
Present thermodynamic data suggest that high selenite concentrations are required in order to precipitate (reasonably well soluble) selenites. Based on these data, selenium is qualified as "not solubility limited" at +75 mY. However, low Se concentration levels in natural systems [35] indicate that the solubility of pure phases may not be the only controlling mechanism (for an overview see [61]).
- 25-
6. Consistency with far-field reference water
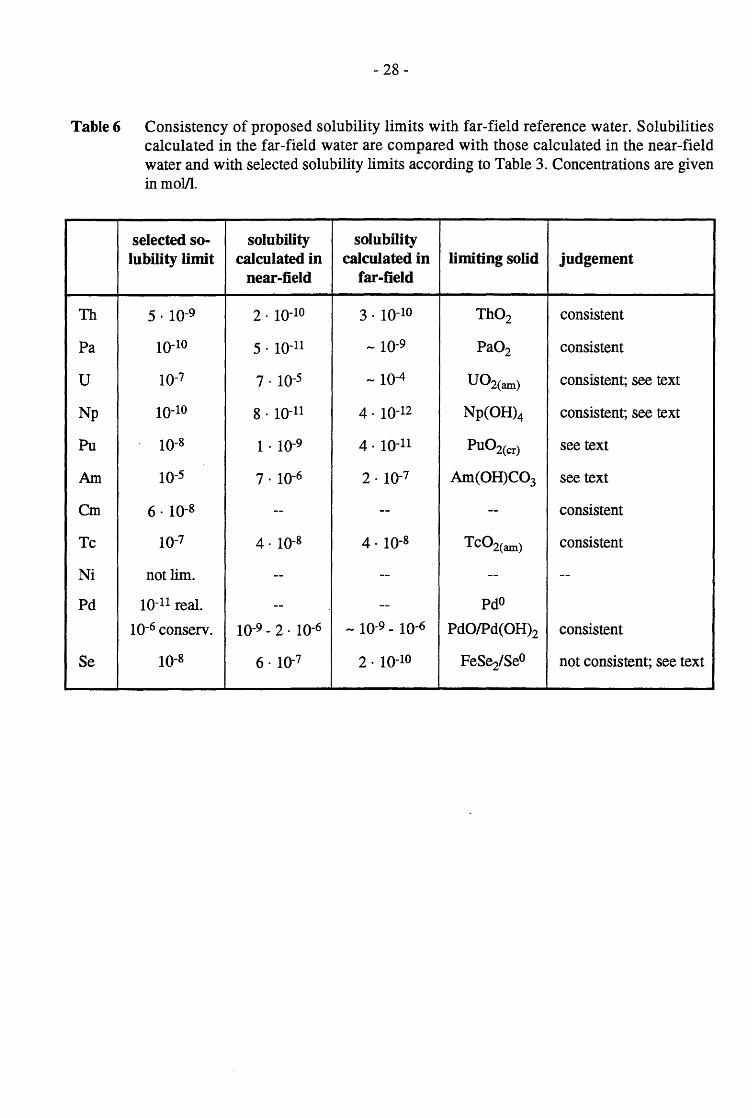
Radionuclides escaping from the near-field (leaving the bentonite barrier) are further transported by the host rock groundwater. The present model concept couples near-field and far-field by considering the radionuclide flux only. A stronger coupling (i.e. a full chemistry I transport coupling of near- and far-field water) is not yet considered and the two reference waters slightly differ in composition. Detailed compositions of the two waters are given in Table 5. Radionuclides passing from the near-field into the far-field will be faced with a different chemical environment (mainly pH, Eh, carbonate concentration and ionic strength). Concentrations as proposed for the near-field solubility limits may lead to supersaturated far-field solutions (when dilution is neglected). In principle the precipitation of secondary (radionuclide-) minerals from supersaturated solutions will further decrease concentrations and needs not to be considered (conservativity). Unfortunately, precipitation processes may also include the formation of colloids or the uptake of radionuclides by colloid surfaces. Processes involving colloidal matter can have severe consequences for the radionuclide transport and need to be addressed carefully. Therefore, the consistency of the solubility limits with the far-field reference water was checked. The procedure followed was identical to that described in chapter 4. Calculated far-field solubilities were then compared with the solubilities in the near-field. "Consistency" is shown, if precipitation of secondary minerals is not to be expected in the far-field reference water. The judgement includes the particular discussions as given in chapter 4. A summary of this consistency check is given in Table 6. For most of the radionuclides the proposed solubility limit is consistent with the far-field reference water, considering an appropriate uncertainty in the thermodynamic data and in the selected limiting phases. In some cases (U, Np, Pu, Am, Se) the consistency is not obvious. For these elements a brief discussion is given in the text below.
Uranium
The proposed solubility limit of 10-7 M is mainly based on experimental findings from different sources and not on the calculated solubility of U02(am). Small differences of U02 solubility in the two waters are therefore not relevant.
Neptunium
The calculated speciation in solution is dominated by the anionic Np(OH)s , whose formation
constant seems to be too high (see experiments performed by Pryke & Rees [48]). The lower solubility limit in the far-field water exactly reflects the lower pH. The concentration level of Np is very low and precipitation or colloid formation from such dilute solutions seems very unlikely. The uncertainty of the available data is large and, therefore, the judgement "consistent" is justified.
Plutonium
The calculated speciation is completely dominated by PU(C03)~-. The lower solubility in the far-field
water is compatible with experimental observations [48, 49], i.e. increased solubility due to lower pH
- 26-
compensated by a decreased solubility due to lower [CO~-]free concentration. The thermodynamic
data for the dominating PU(C03)~-2X - complexes are very uncertain and may, as outlined in chapter 4, overestimate the formation of the carbonato complexes. Considering an additional uncertainty from the solubility product of Pu02 and considering that the solubility limit is mainly based on experimental data, the formal oversaturation of Pu in the far-field might still be judged to be consistent.
Americium
Dominant species in the far-field water are Am(OH)C03(aq)' AmCot and Am(OH)2C03" ' according to the presently used data. Modelling the proposed solubility limit of 10-5 M in the far-field water leads to saturation indices of +1.7 for AmOHC03(s) and of +5.9 for Am2(C03h (not considering AmP04(s»' An oversaturation of 1.7 log units at a concentration level of - 10-5 M cannot anymore be judged as consistent. However, recently performed work by Pelmy et al. [23] and Meinrath & Kim [37] gives evidence that
a) the solubility limit lies in the range 10-7 to 10-6 M and that
b) the solubility in the two waters will not differ critically.
Based on this recent work the jUdgement" consistent" is justified.
Selenium
The far-field water has an Eh of -180 mY. Around this Eh selenium exhibits a solubility minimum (see page 24) and the calculated concentration of 2 . 10-10 M is more than 3 orders of magnitude lower than the near-field solubility. Although the concentration level is low, the formation of secondary minerals cannot be excluded (e.g. SeO). A more detailed investigation of the geochemical behaviour of selenium is clearly indicated.
- 27-
Table 5 Composition of the far-field reference water "Western Crystalline Basement Type" as given by Pearson & Scholtis [47]. Total concentrations in solution are given in mol/I. For comparison, the "reference case" bentonite pore water from Table 1 is also given.
Far-field reference Bentonite pore water water [47] "reference case" (Table 1)
pH 7.66 9.0 Eh -180 mV -397 mV
I 0.018 molll 0.078 molll
Temperature 55°C 50°C
Na 1.41 . 10-2 7.84· 10-2
K 2.18 . 10-4 1.66 . 10-4
Li 1.59 . 10-4 --Mg 1.24· 10-5 6.65 . 10-5
Ca 3.5 . 10-4 1.07 . 10-5
Sr 5.26· 10-6 --Ba 3.65 . 10-7 1 . 10-7
AI -- 1.04 . 10-4
H2SiO~- 5.9· 10-4 2.61 . 10-4
CI- 3.62· 10-3 3 . 10-3
F- 6.43 . 10-4 7.02 . 10-4
Br- 9.0· 10-6 --
N03" 2.0· 10-6 --
PO~- 1.29 . 10-6 1.6 . 10-6
CO~- 4.78 . 10-3 5.16 . 10-2
SO~- 3.09 . 10-3 4.5 . 10-3
B(OH)4 5.5 . 10-5 --HS- 1.5 . 10-7 1.17 . 10-6
Fe (III) (5.3 . 10-12) (5 . 10-14)
Fe (II) (1.4 . 10-8) (3.8 . 10-10)
- 28-
Table 6 Consistency of proposed solubility limits with far-field reference water. Solubilities calculated in the far-field water are compared with those calculated in the near-field water and with selected solubility limits according to Table 3. Concentrations are given in molll.
selected so- solubility solubility lubility limit calculated in calculated in limiting solid judgement
near-field far-field
Th 5 . 10-9 2 . 10-10 3 . 10-10 Th02 consistent
Pa 10-10 5 . 10-11 -- 10-9 Pa02 consistent
U 10-7 7 . 10-5 -- 10-4 U02(am) consistent; see text
Np 10-10 8 . 10-11 4· 10-12 Np(OH)4 consistent; see text
Se 10-8 6 . 10-7 2 . 10-10 FeSeiSeo not consistent; see text
- 29-
7. Discussion of actinide thermodynamic data
As outlined in the preliminaries, the thermodynamic database was "frozen" for KRISTALLIN-I. In the course of this work some important inconsistencies and shortcomings in the database were recognised and were also correctly pointed out in a review of the internal technical paper [8] preceding this report.
Therefore, the aim of this chapter is to address these inconsistencies and shortcomings and to discuss the impact of partly revised data sets on the predicted solubility limits. We concentrate on the thermodynamic data of the tetravalent actinides and try to give an idea on how more consistent data sets can be obtained. Of course, the thermodynamic data of other safety relevant elements (e.g. Am, Tc, Se etc.) need to be improved also. However, a general improvement of "all" critical thermodynamic data lies far outside the scope of the present report.
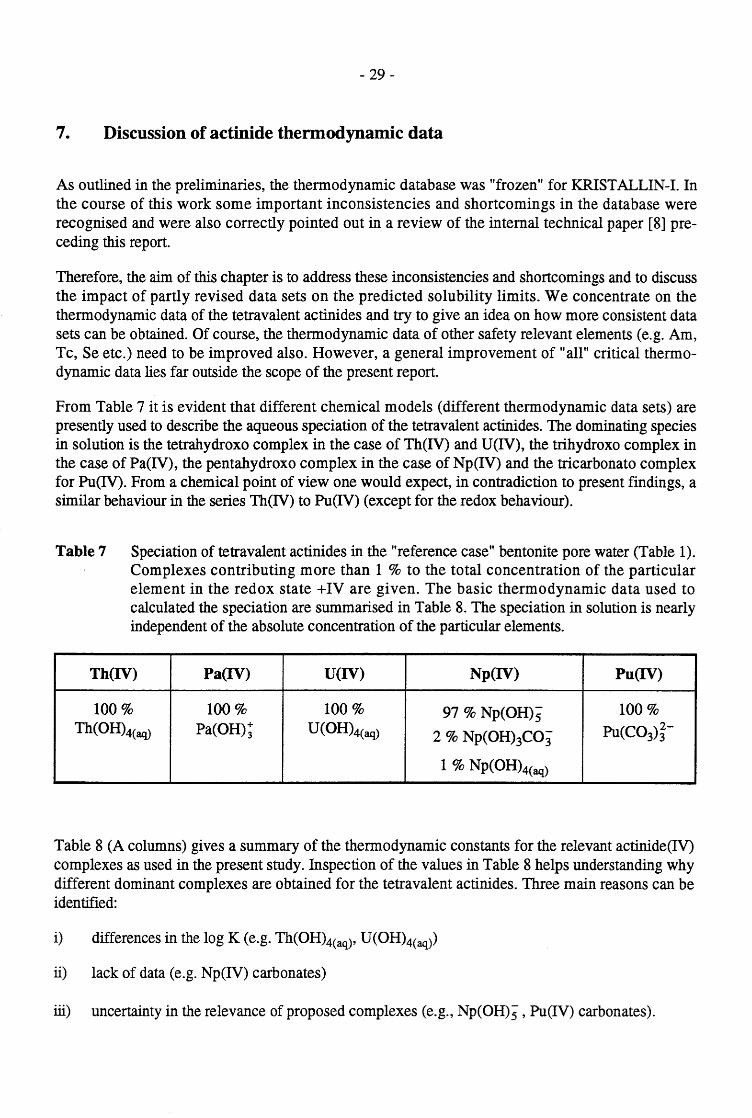
From Table 7 it is evident that different chemical models (different thermodynamic data sets) are presently used to describe the aqueous speciation of the tetravalent actinides. The dominating species in solution is the tetrahydroxo complex in the case of Th(IV) and U(IV), the trihydroxo complex in the case of Pa(IV), the pentahydroxo complex in the case of Np(IV) and the tricarbonato complex for Pu(IV). From a chemical point of view one would expect, in contradiction to present findings, a similar behaviour in the series Th(IV) to Pu(lV) (except for the redox behaviour).
Table 7 Speciation of tetravalent actinides in the "reference case" bentonite pore water (Table 1). Complexes contributing more than 1 % to the total concentration of the particular element in the redox state +IV are given. The basic thermodynamic data used to calculated the speciation are summarised in Table 8. The speciation in solution is nearly independent of the absolute concentration of the particular elements.
Table 8 (A columns) gives a summary of the thermodynamic constants for the relevant actinide(IV) complexes as used in the present study. Inspection of the values in Table 8 helps understanding why different dominant complexes are obtained for the tetravalent actinides. Three main reasons can be identified:
i) differences in the log K (e.g. Th(OH)4(aq)' U(OH)4(aq»
ii) lack of data (e.g. Np(IV) carbonates)
iii) uncertainty in the relevance of proposed complexes (e.g., Np(OH); , Pu(IV) carbonates).
- 30-
For the M(IV)-hydroxides one would expect clear trends in the series Th(OH)t-i to Pu(OH)t- i and
also in the series M(OH) i+ to M(OH) :-n , based on the chemical similarity of the elements and on
the ionic radii. This is not the case for the presently used set of data. In principle, Th as a redoxinsensitive element and the well-investigated U(N) could be used as models for all M(IV). Unfortunately, a difference of more than 11 units in the formation constants of Th(OH)4 and U(OH)4 is recognised.
A recent re-evaluation of Th hydroxide/carbonate data by Grenthe & Lagerman [30] and by Osthols et ale [43] (Table 8, column B) generally confirms the older values originally proposed by Langmuir & Herman [33]. Accepting Th(IV) hydroxides as a model for other actinide(IV) hydroxides, the formation constant of U(OH)4(aq) as proposed by Grenthe et ale [31], log B4 = - 4.53 lies far outside the expected range. This has also been recognised by Grenthe et al. [31], on page 130 they state a possible overestimation of the stability of U(OH)4(aq) by orders of magnitude, based on the uncertainty of the material properties used in the solubility experiments.
Rai et al. [53] studied the solubility of amorphous U02(s) under rigorous redox control (Eu2+, FeO),
in order to avoid oxidation to U(VI). They found a log B4 of - -12. Why this discrepancy?
Grenthe et al. [31] derived their log B4 -value from the experiments of Parks & Pohl [44] and from
the value of AfG~ (U02(cr), 298.15 K) given by Cox & Wagman [17], assuming that both studies
rely on the same solid. A second determination of log B4 is based on measurements performed by Bruno et al. [12, 13, 14]. From [13] a solubility product Kso =10 O.l±O.7 at I = 0.0 is derived (potentiometrically) and the solubility of an amorphous U02(am) was measured to be 10-4.4±O.4 M in the pH-range 4 to 10.5 [12]. Combining the two independent measurements and assuming that both studies used similar solid phases gives a log 134 identical to that derived from the former studies [17, 44]. Therefore, Grenthe et ale [31] selected this value in their review.
Unfortunately, the solubility measurements of Bruno et ale [12] give concentrations which are much too high if compared with other studies [15,44,53,62]. To some extent, Bruno's solubility data are comparable with solubility data ofU03 . H20 measured by Gayer & Leider [25]. Most likely, and as clearly pointed out by Rai et ale [53], Bruno's [12] measurements reflect the solubility of "U02" in a partly oxidised environment
Accepting that the solubilities measured by Bruno et ale [12] are too high, the consistency of the log 134 values disappears and the selection of Grenthe et ale [31] becomes questionable. The solubility study of Rai et al. [53] allows an independent determination of the U02 solubility product in the pH range 2 - 4 and of the solubility in the pH range 4 - 12 with the guarantee that both determinations are based on the same solid phase. The equilibrium constants derived from this study (Table 8, column C) are consistent with the hydrolysis data for Th(IV). It is therefore suggested that the Rai et al. [53] hydrolysis data are used instead of the presently implemented data of Grenthe et ale [31] until this open controversy has been resolved by experimental means.
If the solubility and the hydrolysis of Th(N) and U(IV) (Table 8, columns B and C) are accepted as a consistent set of basic data for the tetravalent actinides, the Pa(lV) data need to be refined.
- 31 -
Table 8 Summary of thermodynamic constants for the actinides. Presently used data, listed under the headings A, are compared to recently published data from Osthols et al. [43] (heading B) and from Rai et al. [53] (heading C). Constants (log K's) are given for the general mass action law written in the form:
a) Data given for 0.5 M NaCI04 extrapolated to I = 0.0 using the ~cific ion interaction .theory (SIT). 1) Smith & Martell [60] 2) Rai & Seme [50] 3) Langmuir & Herman [33] 4) Phillips S.L., Lawrence Berkeley Lab., LBL-14313 (1982) 5) Baes & Mesmer [6] 6) Grenthe et aI. [31] 7) Allard et aI. [3] 8) Skytte Jensen B. [59] 9) Lemire & Tremaine [34] 10) Lierse & Kim [36]
Pu(lV)
A
7.9)
_1.9)
-0.79)
-2.39)
-5.39)
-9.59)
19.110)
33.110)
42.310)
46.610)
44.510)
-1.8)
10-8/10-4 red.lox.
- 32-
Experimental data on Pa(IV) are very scarce and the few numbers given by Baes & Mesmer [6] are not consistent with Th(IV) and U (IV) data. It is therefore recommended to use the same data as for U(IV) if one really needs to consider Pa(IV) individually. This would at least give a consistent guess
of the dominating complex in solution (which most likely is Pa(OH)4 and not Pa(OH)!).
Like for Pa(IV) some refinement is also needed for Np(IV). As a consequence of log ~5 = -20,
Np(OH)5" becomes dominant in aqueous Np(IV) solutions around pH = 8. The Np(IV)-hydrolysis data as given in Table 8 represent the values estimated by Allard et al. [3], based on values taken from Smith & Martell [60]. Allard's estimation is based on the assumption of identical differences in the stepwise hydroxide complexation constant. Newer experimental work [48, 52] gives no evidence
for the anionic Np(OH)5" ,even at very high pH, and it must be concluded that the Np(IV)-hydroxide data used in chapter 4 lead to unreliable predictions. Rai & Ryan [52; referring to unpublished work] report a solubility product of 10+2.5 for hydrous Np02(s)' consistent with the values for Th02(s) (10+7.3) and U02(s) (10+4). Considering a measured Np(IV) solubility of - 10-8 M [48, 52] over a large pH range (7 to -- 14) leads to log ~4 (Np(OH)4) .... -10.5 which again is consistent with the constants of Th(IV) and U(IV) (-13.9, -12).
Hydrolysis and solubility data of Pu(IV) are based on the compilation of Lemire & Tremaine [34] and originate from Baes & Mesmer [6]. Similar values were selected by Puigdomenech & Bruno [49] based on a comprehensive collection of solubility measurements. The solubility product of the "amorphous" Pu02(s) (sometimes referred to as PU(OH)4(s» has large uncertainties. Puigdomenech & Bruno [49] give log Kso = - 0.8, Lemire & Tremaine [34] recommend log Kso = 1 ± 4 and Baes & Mesmer [6; referring to Perez-Pustamante: Energ. Nucl. (Madrid) 13 (57) (1969) p. 23] report log ~o = 2 ± 2.
A noticeable correlation: If the solubility products for the hydrous oxides as discussed above (Th: 7.29 ± 0.3 [43], U: 4 ± 0.8 [53], Np: 2.5 [52], Pu: 2 ± 2 [6]) are plotted against the inverse ionic radii of the tetravalent metal ions (94, 89, 87, 86 pm [58]) a nearly perfect linear relationship is obtained (Fig. 2). Though the error bars are large, it gives a good feeling that
a) the trend in the log Kso-values is sensible and that
b) none of the values is completely out of range.
Carbonate data for the actinides(IV) are scarce. Osthols' [43] very recently reported value for
Th(C03)g- is consistent with the values for U(C03)g- and U(C03)!- given earlier by Grenthe et al. [31]. The whole series of Pu(IV) carbonate complexes was taken from a report by Lierse & Kim [36]. Compared to Th(IV) and U(IV), Lierse & Kim's stability constants strongly overestimate the formation of Pu(IV) carbonates. Rai & Ryan [52] give a competent discussion on the expected formation constants for Pu(IV) carbonates, based on sound chemical considerations. They conclude that log ~1 should not exceed 12 to 15 and that log f34 should not exceed the value for the Pu(IV) EDTA complex (- 26).
The author agrees with the arguments given by Rai & Ryan [52] and recommends discarding the formation constants proposed by Lierse & Kim [36].
- 33-
0
Pu
-2
~ ~ -4 b.O
.Q
-6
-8
1.04 1.08 1.12 1.16
1lrj in units of 1010 m-1
Figure 2: The solubility product of the hydrous actinide(IV) oxides vs. the inverse ionic radii of the metal (+4) ions. Note that log Kso is represented according to the convention given in Table 8.
Puigdomenech & Bruno [49] recommend 10g~1 = 13 for PuCO~+ and logf35 = 39 for Pu(C03)g- but
qualify their recommendation as "speculative". However, log ~1 = 13 is consistent with the con
clusions of Rai & Ryan [52] and with log ~1 = 11 for ThCO~+. Log f35 = 39 seems to be high, following the conclusions of Rai & Ryan [52], but at least is not in contradiction with the log f35 for
Th(C03)g- and for U(C03)g-.
In order to be consistent throughout the actinides, stability constants for the Np(IV) carbonates have to be provided also. It is proposed to use the same values as for U(IV).
The ternary complex Th(OHhC03" proposed by Osthols et al. [43] has not been observed directly. Osthols et al. found experimental evidence for a mono-charged complex containing one carbonate and "found it reasonable" to propose the above complex. Other mixed complexes (e.g. Th(OHhC03,
Th(OH)4CO~-) did not improve their fit to the experimental data. It is interesting to note that Skytte Jensen [59] proposed a similar complex for Pu(IV) with a stability constant close to that of
Th(OHhC03". However it should also be noted that this agreement most likely is by chance, since addressing the source of the data, Skytte Jensen states "the ... (complex) ... has been recorded and its existence found probable". Allard [4] also discusses the formation of mixed hydroxide/carbonate
complexes and gives an estimate of log ~ = 0 for An(IV)(OH)3C03" . Unfortunately he cites a reference (B. Skytte Jensen (1981) pers. comm.!) which cannot be verified.
Why this long discussion about a complex where neither the existence is proven nor the formation constant is accurately known?
The present data suggest that the dominating complexes under natural conditions (pH 7 to 10) are
either An(OH)4(aq) or An(C03)g-, depending on the carbonate concentration. The scarcity of available experimental data, as well as their poor quality, do not allow to draw a much more differentiated picture for the series of hydroxide and carbonate complexes. Exceptions, like the well investigated hydrolysis of Th(IV) in acidic media [6], cannot be extrapolated to higher pH values.
- 34-
From the point of view of complexation chemistry, it is not obvious why the dominant complex
should directly change from (An(OH)4(aq) (coordination number 4 (+2» to An(C03)g- (coordination
number 10) if CO~- is increased. Apart from the change in coordination number a large change in charge (zero to -6) would accompany the transition from the pure hydroxo- to the pure carbonato complex. Not considering polynuclear complexes, one would expect that the transition from pure
hydroxide to pure carbonate includes mixed complexes of the form An(OH)x(C03)~-X-2Y.
The proposed complex An(N)(OH)3C03" acts as a connecting link between the hydroxides and the carbonates. It helps to improve the consistency of the overall data set, especially at intermediate
CO~- concentrations. It is therefore recommended to include such a mixed complex in the data set.
Osthols' [43] fit of a reasonable number of experimental points leads to log f3 - -O.S and confmns the estimates of Skytte Jensen [59] and Allard [4].
The above discussion of actinide(IV) thermodynamic data is summarised in Table 9. It is recommended to replace the Table 8 data set with the data proposed in Table 9, if reference waters of the type given in this report have to be considered.
However, it was not the aim of this chapter to add a further database to the variety of already existing databases. The basic idea was to provide a set of data where the main emphasis lies on a consistent chemical description in the series Th to Pu. It is well known that the actinides show a very similar chemical behaviour (not considering their redox chemistry) and the basic data set should reflect this similarity. This idea is not new, many scientists have proposed to use consistent data sets based on chemical analogies. A famous example for these analogies are the lanthanides and a generalised database for the actinides has already been proposed by Allard [4] in 1982.
What is the impact of the revised data (Table 9) on the modelled solubility and speciation of the actinides? Calculations with the revised data were performed as described in chapter 4, results are compared with the original results given in Table 10. For this comparison the temperature correction (SO°C) was suppressed for the actinides since no temperature dependency for the revised data was derived.
The predictions made with the revised data give a satisfactorily consistent picture for the speciation of the actinides (Table 10, row 1), but predicted solubilities are higher than for the original data set. This is clearly a consequence of the properties of the limiting solid. The revised data sets rely on the "conservative", amorphous form of the oxides which are well known to be less stable than the crystalline oxides. Pu02 as a known exception (due to irradiation) is discussed by Rai & Ryan [51].
Using the revised data set, uranium will no more be limited by U02(s). At -400 mV the hexavalent
UO~+ is stabilised by CO~- and U30 8(s) is calculated to be the solubility limiting solid, giving total
dissolved U of 5 . 10-8 M. A remarkable difference is observed in the behaviour of Pu. The revised data set proposes much lower stabilities for the Pu(IV)-carbonates. As a consequence, the very strong Pu(III)-carbonates ("strong" in terms of the presently used database) become dominant and Pu02 is not stable enough to limit solubility. Recently, several authors (Felmy et al. [23], Carroll [16], Meinrath et ale [37,38]) have studied the carbonates of Am3+ and Nd3+. Using similar data for Pu(III) based on chemical analogy, one predicts a solubility of 2 . 10-6 M, with Pu(OH)C03(s) being the limiting solid (Table 10, row 2).
- 35-
With the revised data much higher solubilities (5 orders of magnitude) are calculated for thorium. These fmdings could have severe consequences for the safety analysis. However, as pointed out in Osthols' work [43], observed Th concentrations in carbonate rich alkaline lakes in the U.S. are 2 orders of magnitude lower than those predicted with the revised data. Most likely, the realistic limit is much lower than the (conservative) value of 2 . 10-5 M predicted for the amorphous Th02. A lower limit is given by the solubility of the crystalline oxide at - 10-10 M.
From a scientific point of view the revision of thermodynamic data is important and interesting. In the present case the revised data give a more consistent picture of the behaviour of tetravalent actinides. Of course, similar exercises need to be performed for the tri-, penta- and hexavalent actinides and for the redox equilibria among the different oxidation states.
From a safety analysis point of view the improvement using revised data is not as relevant as (maybe) expected. The revised data may help to decrease the span between realistic and conservative limits, but the key question "what will be the solubility limiting solid in the far future?" is still open, even if perfectly consistent data sets were available. Solubility limits (better: maximum expected concentrations) for particular elements strongly depend on this key question, which cannot be answered by pure thermodynamic considerations and formalisms. Additional work is necessary to answer this question (see introduction). However, in order to improve the predictions for the very complex chemical systems considered, good and chemically sensible thermodynamic data are a minimum prerequisite. Improving the thermodynamic database is therefore strongly recommended, provided that some attention is paid to the following remarks.
The development of thermodynamic databases follows its own rules, mainly determined by the publication of "more" and "better" data and by the particular type of work of the corresponding developer. Unfortunately, the consistency of these "new" and "more accurate" data with existing data and especially with basic chemical considerations is not always checked and may lead to inconsistent data sets within a few years. The tetravalent actinides are not a single example. Many others can be found if one carefully looks through its own database using the fliter of what is known about basic chemistry and chemical analogies.
The discussion is stopped here without addressing the data for the tri-, penta- and hexavalent actinides. This may be the subject of a subsequent piece of work.
- 36-
Table 9: Proposal of a "consistent" data set for actinide(IV) hydroxides/carbonates. Values in parentheses are estimates based on the discussions in the present chapter. Log K-values are defined as outlined in Table 8.
Th(IV) Pa(IV) U(IV) Np(IV) Pu(IV)
M02 . xH2O(am) * -7.29 (-4) -4 -2.5 -2
MOH3+ -3.15 (-0.5) -0.5 (-0.5) -0.7
M(OH)~+ -2.3
M(OH)~ -5.3
M(OH)4(aq) -13.87 (-12) -12 -10.5 -9.5
MCO~+ 11 (11) (11) (11) 13
M(C03)2(aq)
M(C03)~-
M(C03)!- 35.12
M(C03)g- 32.42 (34) 34.0 (34) 39
M(OHhCOi -0.52 (-1) (-1) (-1) (-1)
* M02'xH20(am) includes oxides which are not specifically described as crystalline but are characterised with terms like amorphous, hydrous, micro-crystalline and hydroxide.
Table 10: Impact of revised data (Table 9) on solubility and speciation of actinides. For comparison the limits calculated with the original data are given in row 3. Temperature corrections (to 50°C) were suppressed for consistency.
Th Pa U Np
Calculated limit: 2.10-5 M 3 . 10-8 M 5 . 10-8 M 4.10-9 M Data from Table 9
Calculated limit: 3 .10-10 M 5 . 10-11 M 7.10-5 M 8 . 10-11 M
Original data 100 % Th(OH)4(aq) 100 % Pa(OH)j 53 % U(OH)4(aq) 97 % Np(OH)5" from [45,46] and from 47 % U02(C03) j-
2 % Np(OHhC03" appendix 3
1 % Np(OH)4(aq)
Limiting solid: Th02 Pa02 U02 Np02 -I...
Pu
high
95 % PUill(C03)j-3 % PUill(C03);-
1 % Puill(C03)+
1 % PuIV (C03)~-
--
2.10-6 M
86 % Puill(C03) j-
8 % PUill(C03);-
6 % PuIV (C03) ~-
Puill(OH)C03(s)
5.10-9 M
100 % PUIV(C03) i-
Pu02
i
I
w .......:a
- 38 -
8. Concluding remarks and recommendations
Solubility limits for a series of safety relevant radionuclides have been estimated in a modified crystalline groundwater (reference case, pH = 9, Eh = -400 mV, I = 0.08 M). A detailed discussion of particular limits is given in chapter 4 and is not repeated here. Compared to an earlier work performed for Project Gewahr [40, 41], the present study generally estimates slightly lower solubility limits, exceptions being U and Sn.
The reference solutions, crystalline groundwater modified by the barrier material bentonite, cover a rather narrow pH range of .... 0.5 pH units. Scoping calculations demonstrated that such pH variations (including variations in ionic strength) will not significantly influence the estimated solubility limits since general uncertainties accompanying the predicted limits are much larger.
Depending on the selected redox model, reducing ( - -400 mV) or slightly oxidising ( - +100 mY) conditions are predicted for the reference groundwater. It has been found that, under slightly oxidising conditions, the solubility limits of the redox sensitive elements U, Tc, Se, Pa and Np increase by orders of magnitude if compared to the limits under reducing conditions. Considering solubility limits, the redox conditions may be of key importance. It is therefore recommended to investigate the behaviour of redox sensitive elements in more detail and, even more important, to re-investigate the near-field redox models in order to narrow down the presently adopted Eh range of nearly 500 mV. With respect to reinvestigations of the redox behaviour it should be noted that the key area may rather be the kinetics of redox reactions than thermodynamic considerations (e.g. for elements like Se). The estimated solubility limits were compared to those in the far-field crystalline groundwater. A remarkable inconsistency was found in the case of Se, for which a much lower solubility was calculated in the far-field than in the near-field (due to precipitation of elemental selenium). This means that the precipitation of secondary Se minerals and/or the formation of colloidal matter comprising Se needs to be discussed further. Originally it had been foreseen to recalculate solubility limits according to the earlier "Project Gewahr" study [40, 41], using improved groundwater data (bentonite pore water) and an updated thermodynamic database [45, 46]. During the course of the work it was then recognised that the recalculation, although giving new values with the updated input parameters, did not automatically lead to qualitatively improved solubility limits. Besides the ordinary geochemical calculations based on pure phases, additional criteria were therefore brought up in order to fix and to evaluate qualitatively improved solubility limits. These additional criteria mainly include basic geochemical considerations like chemical analogies and consistent behaviour of similar elements, recent experimental findings, comparison with natural systems as well as system dependent parameters like relative/absolute inventories. Estimated solubility limits obtained in this way may deviate from calculated values based on pure solid phases. Nevertheless, it is claimed that including sucll additional criteria will lead to maximum concentration estimates of improved qUality. The prediction of the behaviour of trace elements in heterogeneous systems is a very difficult task. A variety of still unknown processes and/or of processes with still unknown thermodynamic characteristics will influence the system. In most cases, thermodynamic data for only very few basic chemical equilibra are available, leading to an incomplete deSCription of what happens. Even using very high quality thermodynamic data sets does not help too much if the essential prerequisite of having a complete and chemical sensible data set for the particular system in question is not satisfied. Of
- 39-
course, high quality data sets are important and continuously improving the quality of the thermodynamic data should be the task of each geochemical modeler. In particular, it is also recommended to improve data towards a more consistent chemical picture as demonstrated with the tetravalent actinides. However, in addition to high quality data, a conceptually correct description of the investigated chemical system is of key importance. What is a conceptually correct chemical description? This question is not answered by means of numerical calculations, but by sound knowledge and judgement of experienced chemists and geochemists. In the opinion of the author, too little attention was paid to the latter point in the past and too much to the uncritical presentation of the out-flow from computer codes. It is strongly recommended that future activities on this topic should include well balanced efforts on both, the further development of quantitative tools (codes, databases) as well as the consideration of qUalitative chemical aspects.
Acknowledgements
First of all, I would like to thank Prof. R. Grauer for the many valuable discussions and, in particular, for encouraging me to tackle the problems using extended chemical considerations. Dr. I. G. McKinley, Dr. P. Zuidema and Dr. J. Hadermann critically reviewed the manuscript and helped to improve the consistency of several argumentations. Thanks to Prof. I. Grenthe for reviewing an earlier German version of the manuscript. His critical comments initiated the discussion on thermodynamic data of the actinides (chapter 7). Thanks are also extended to colleagues at PSI for many tips and fruitful discussions. The financial support of Nagra for this work is gratefully acknowledged.
- 40-
References
[1] Aksoyoglu S., et ru., "Sorption of nickel on marl and its components", PSI internal report, TM-43-92-28, Wiirenlingen (1992).
[2] Alder, J. -Cl., McGinnes D., "Model Radioactive Waste Inventory for Swiss Waste Disposal Projects", Nagra, NTB 93-21, Wettingen (1994).
[3] Allard B., Kipatsi H., Rydberg J., KBS Technical Report No. 55, Stockholm (1977).
[4] Allard B., "Solubilites of actinides in neutral or basic solutions", in "Actinides in perspective" (Edelstein N. M., ed.), Proc. Actinides - 1981 Conference, Pacific Grove, California, USA, Sept. 1981, Pergamon Press (1982), p. 553 - 580.
[5] Atkins M., et aI., "Progress Report of the Third Radioactive Waste Management Programme for the Period May 1985 - March 1990", Commission of the European Communities, contract number F1 IW 0025 UK(H), University of Aberdeen (1990).
[6] Baes C.F.Jr., Mesmer R.E., "The Hydrolysis of Cations", John Wiley & Sons (1976), ISBN 0-471-03985-3.
[7] Berner U.R., "Thermodynamic modelling of cement degradation: Impact of redox conditions ori radionuclide release", Cement and Concrete Res. 22 (1992) p. 465-475.
[9] Bradbury M.H., Baeyens B., "A mechanistic approach to the generation of sorption data bases", in "Radionuclide Sorption from the Safety Perspective II , Proceedings of an NEA Workshop, Interlaken 16-18 October 1991, OECD, Paris (1992).
[11] Brotzen 0., "On the environmental impact of a repository for spent nuclear fuel", KBS 83-29, Stockholm (1983).
[12] Bruno 1, et aI., "The determination of the solubility of amorphous U02(s) and the mononuclear hydrolysis constants of uranium(IV) at 25°C", Mat. Res. Soc. Symp. Proc. 84 (1987) p. 153.
[13] Bruno J., et aI., "Studies on metal carbonate equilibria: 13. On the solubility of uranium(IV) dioxide, U02(s)", Acta chern. Scand. 40 (1986) p. 428.
[14] Bruno J., Grenthe I., Lagerman B., "Redox processes and U02(s) solubility: The determination of the UO ~+ 1U4+ redox potential at 25°C in HCl04 media of different strength", Mat. Res. Soc. Symp. Proc. 50 (1986) p. 299 - 308.
- 41 -
[15] Casas J., et al., "Kinetically controlled dissolution of U02(s) under oxidising conditions. A combined dissolution - oxidation model", Mat. Res. Soc. Symp. Proc. 294 (1993) p. 61 - 66, and Casas I., et aI., "Dissolution of U02(s) in MgCl2-brines under different redox conditions.", ibid., p. 67 - 72.
[16] Carroll S.A., "Precipitation of Nd-Ca carbonate solid solution at 25°C", Geochim. Cosmochim. Acta 57 (1993) p. 3383 - 3393.
[17] Cox J.D., Wagman D.O., Medvedev V.A., "CODATA Key Values for Thermodynamics", New York: Hemisphere Publishing Corp., (1989).
[18] Cross J.E., Ewart F.T., "HATCHES - a thermodynamic database and management system", Radiochimica Acta 52/53 (1991) p. 421 - 422.
[19] Curti E., "Modelling bentonite pore waters for the Swiss high-level waste repository", PSI-Bericht 93-05, Wurenlingen and Villigen (1993) and Nagra report NTB 93-45.
[20] Dzombak D.A., Morel F.M.M., "Surface complexation modeling", John Wiley & Sons (1990), ISBN 0-471-63731-9.
[21] Eriksen T.E., Ndalamba P., Bruno J., Caceci M., "The Solubility of Tc02 . nH20 in Neutral to Alkaline Solutions under Constant PC02", Radiochimica Acta 58/59 (1992) p. 67 - 70.
[22] Ewart F.T., et aI., "The Solubility of Actinides in a Cementitious Near-Field Environment", Waste Management 12 (1992) p. 241-252.
[23] Felmy A.R., Rai D., Fulton R.W., "The Solubility of AmOHC03(s) and the Aqueous Thermodynamics of the System Na+-Am3+-HC03" -CO~--OH- -H20", Radiochimica
Acta 50 (1990) p. 193-204.
[24] Finch R., Ewing R., "Uraninite alteration in an oxidizing environment and its relevance to the disposal of spent nuclear fuel", Swedish Nuclear Fuel and Waste Management (SKB), Technical Report 91-15 (1990).
[25] Gayer K.H., Leider H., J. Am. Chem. Soc. 77 (1955) p. 1448 - 1450.
[26] Grauer R., "Kristalline Stoffe zur Verfestigung hochaktiver Abfalle", EIR-Bericht Nr. 508, Wurenlingen (1984) and Nagra report NTB 84-08.
[27] Grauer R., "Zum chemischen Verhalten von Montmorillonit in einer Endlagerverfullung", PSI-Bericht Nr. 11, WurenlingenIVilligen (1988) and Nagra report NTB 88-24E.
[28] Grauer R., "Zur Sorptionskapazitat der BehaIter-Korrosionsprodukte in einem Endlager fur hochaktiven Abfall", PSI internal report AN-44-94-03 (1994).
[29] Grenthe I., "Thermodynamics in Migration Chemistry" Radiochimica Acta 52/53 (1991) p. 425 - 432.
- 42-
[30] Grenthe 1., Lagerman B., "Studies on Metal Carbonate Equilibria: 23. Complex Formation in the Th(IV) - H20 - CO2(g) System", Acta Chern. Scand. 45 (1991) p. 231-238.
[31] Grenthe I., et al., "Chemical Thermodynamics 1; Chemical Thermodynamics of Uranium" (H. Wanner and I. Forest, eds.), NEA, OECD, North-Holland Elsevier (1992), ISBN 0 444 893814.
[32] Hartley R.W., "Release of Radionuclides to the Geosphere from a Repository for HighLevel Waste; Mathematical Model and Results", EIR-Bericht Nr. 554, WUrenlingen (1985) and Nagra report NTB 85-41.
[33] Langmuir D., Herman J.S., "The Mobility of Thorium in Natural Waters at Low Temperatures", Geochim. Cosmochim. Acta 44 (1980) p. 1753 - 1766.
[34] Lemire R.J., Tremaine P.R., "Uranium and Plutonium Equilibria in Aqueous Solutions to 200 °C", J. Chern. Eng. Data 25 (1980) p. 361 - 370.
[35] Li, Y -H., "Distribution patterns of the elements in the ocean: A synthesis", Geochim. Cosmochim. Acta 55 (1991) p. 3223-3240.
[36] Lierse Ch., Kim J.I., "Chemisches Verhalten von Plutonium in natUrlichen aquatischen Systemen: Hydrolyse, Carbonatkomplexierung und Redoxreaktionen", Institut fur Radiochemie, RCM 02286 Miinchen (1986).
[37] Meinrath G., Kim J.I., "The Carbonate Complexation of the Am(III) Ion", Radiochimica Acta 52153 (1991) p. 29 - 34.
[38] Meinrath G., Takeishi H., "Solid-liquid equilibria of Nd3+ in carbonate solutions", J. Alloys and Compounds 194 (1993) p. 93 - 99.
[43] Osthols E., Bruno J., Grenthe I., "On the Influence of Carbonate on Mineral Dissolution ill: The Solubility of Microcrystalline Th02 in CO2-H20 media", Geochim. Cosmochim. Acta 58 (1994) p. 613-623.
[44] Parks G.A., Pohl D.C., "Hydrothermal solubility of uraninite", Geochim. Cosmochim. Acta 52 (1988) p. 863-875.
[45] Pearson Jr. F.J., Berner D., "Nagra Thermochemical Data Base, I. Core Data", Nagra, NTB 91-17, Wettingen (1991).
- 43-
[46] Pearson Jr. F.J., Berner U., Hummel W., "Nagra Thermochemical Data Base, II. Supplemental Data 05/92", Nagra, NTB 91-18, Wettingen (1992).
[47] Pearson Jr. F.J.-, Scholtis A., "Chemistry of Reference Waters of the Crystalline Basement of Northern Switzerland for Safety Assessment Studies", Nagra, NTB 93-07, Wetting en (1993).
[48] Pryke D.C., Rees J.H., "Understanding the behaviour of the actinides under disposal conditions: a comparison between calculated and experimental solubilities", Harwell Laboratory, AERE R 12245, Oxfordshire (1986).
[49] Puigdomenech I., Bruno l, "Plutonium solubilities", Swedish Nuclear Fuel and Waste Management (SKB), Technical Report 91-04, Stockholm (1991).
[50] Rai D., Seme J.R., "Solid phases and solution species of different elements in geologic environments", Pacific Northwest Laboratory, PNL-2651/UC-70 (1978).
[51] Rai D., Ryan J.L., "Crystallinity and Solubility of Pu(IV) Oxide and Hydrous Oxide in Aged Aqueous Suspensions", Radiochimica Acta 30 (1982) p. 213 - 216.
[52] Rai D., Ryan J.L., "Neptunium(IV) Hydrous Oxide Solubility under Reducing and Carbonate Conditions", Inorg. Chern. 24 (1985) p. 247 - 257.
[53] Rai D., Felmy A.R, Ryan J.L., "Uranium(IV), Hydrolysis Constants and Solubility Product of U02 . xH20(am)", Inorg. Chern. 29 (1990) p. 260 - 264.
[54] Rard lA., "Critical review of the chemistry and thermodynamics of technetium and some of its inorganic compounds and aqueous species", UCRL-53440, (1983).
[55] Schweingruber M., "LOslichkeits- und Speziationsberechnungen fur U, Pu, Np und Th in naturlichen Grundwassern - Theorie, thermodynamische Dateien und erste Anwendungen" , EIR-Bericht Nr. 449, Wurenlingen (1981) and Nagra report NTB81-13.
[56] Schweingruber M., "Actinide Solubility in Deep Groundwaters - Estimates for Upper Limits Based on Chemical Equilibrium Calculations", EIR-Bericht Nr. 507, Wiirenlingen (1983) and Nagra report NTB 83-24.
[57] Schulz V.W., Pennemann R.A., "Americium", in "The Chemistry of the Actinide Elements", Vol. 2 (Katz l1., Seaberg G.T., Morss L.R., Eds), Chapman and Hall LTD, New York (1986), ISBN-0-412-27370-5, p. 920.
[58] Shannon R.D., Acta Cryst. A32 (1976) p. 751-767.
[59] Skytte Jensen B., "The geochemistry of radionuclides with long half-lives. Their expected migration behaviour". Riso National Lab. Report for ELSAM/ELKRAFT's Management Project Phase 2 (draft report, April 1980).
[60] Smith R.M., Martell A.E., "Critical Stability Constants", Vol. 4, Plenum Press, New York (1976).
- 44-
[61] Suter D., "Chemistry of the redox sensitive elements; Literature Review", PSI-Bericht Nr. 113, Wiirenlingen and Villigen (1991) and Nagra report NTB 91-32.
[62] Torrero M.E., et aI., "The solubility of un irradiated U02 in both perchlorate and chloride test solution. Influence of the ionic medium", Mat. Res. Soc. Symp. Proc. 212 (1991) p.229-234.
[63] Ulrich H.J., Degueldre C., "The sorption of 210Pb, 210Bi and 21Opo on Montmorillonite: A Study with Emphasis on Reversibility Aspects and on the Effect of the Radioactive Decay of Adsorbed Nuclides", Radiochimica Acta 62(1993) p. 81-90.
[64] Wimmer H., KIenze R., Kim J.I., "A Study of Hydrolysis Reaction of Curium(III) by Time Resolved Laser Fluorescence Spectroscopy", Radiochimica Acta 56 (1992) p.79-83.
- 45-
Appendix 1 (results of second priority elements)
As outlined in chapter 4, the radio nuclides considered in this report are ranked into a first priority category and into a second priority category, based on the expected/observed relevance in the final result of the KRISTALLIN-I model chain. The first priority nuclides are discussed in chapter 4, the discussion of the second priority nuclides is given in this appendix.
Radium
Limiting Solid Modelled Solubility Speciation
RaS04 5.2 . 10-7
RaC03 1.5 . 10-5
Selected solubility limits for radium:
realistic: 10-10 M
58 % Ra2+
24 % RaS04(aq)
1.8 % RaC03(aq)
do.
conservative: 10-10 M
Ref. Number
Ra1
Ra2
According to Table 2 the Ra inventory of 1 canister is 2.4· 10-7 moles. A maximum inventory of .... 10-5 moles/canister is obtained considering the Ra ingrow from the 246Cm decay chain. Chemically, Ra is similar to Ba, to a lesser extent a comparison with Sr and Ca is permissible. Comparing the Ra inventory with Ca in the borosilicate (- 300 moles/canister) leads to a RalCa ratio of - 3 . 10-8.
Most likely, an independent Ra chemistry is to be excluded considering the high RalCa ratio. Looking at Ra as a "trace impurity" of Ca (+ Ba and Sr) will give a much better description of the behaviour of Ra. The solubility limits calculated for RaS04 and RaC03 are not relevant, since both solids will not be present as pure phases. At most, solids having the fonnal stoichiometry "RaS04" and/or "RaC03" will be present as traces (solid solutions) in Ca, Sr, Ba - carbonates/sulphates. The maximum concentration of Ca + Sr + Ba in the bentonite pore water is .... 3 . 10-4 M (Table 1). Multiplying this maximum concentration with the RalCa ratio gives a guess of .... 10-11 M for Ra. A further "dilution" of Ra by Ca (at least three orders of magnitude) could be claimed by considering the amount of calcite present in the bentonite. However, a limit of 10-10 M for Ra is proposed, based on chemical analogy with Ba, Sr, Ca and on relative inventories. There are no reasons to discriminate between realistic and conservative limits at a level of 10-10 M.
Influence of Eh: The solubility limit will not be affected by a less reducing environment.
Consistency with far-field reference water: The proposed solubility limit is consistent with the farfield reference water.
- 46-
Zirconium
Limiting Solid Modelled Solubility Speciation Ref. Number
zr02 1.6 . 10-9 100 % Zr(OH)5" Zrl
Selected solubility limits for zirconium:
realistic: 5· 10-9 M conservative: 5· 10-7 M
In principle, zirconium has been investigated quite well in the past, due to its separation from hafnium. Unfortunately, not very much is known about the hydrolysis of zr4+ (for thermodynamic data see Baes & Mesmer [6]). The solubility product given for crystalline Zr02leads to a solubility of 2.10-9 M. A linear increase of (log) solubility with pH above pH - 6 seems well established and confmns the fonnation of the penta hydroxo complex Zr(OH)5 . From precipitation experiments it is evident that strongly oversaturated solutions (3 orders of magnitude) may form before (nonspecified) oxides/hydroxides precipitate. Under more acidic conditions Zr4+ forms polynuclear hydroxo complexes. However, they disappear in favour of Zr(OH) 5" at neutral to alkaline conditions,
where the speciation is completely dominated by Zr(OH) 5" . Based on the available data a realistic solubility limit of 5.10-9 M seems appropriate. Active (hydrous, amorphous) oxides/hydroxides have not been investigated and, therefore, the estimation of a conservative limit is very speculative. A factor of 100 between the realistic and the conservative limit seems fair.
Influence of Eh: Eh does not influence the solubility of Zr.
Consistency with far-field reference water: Due to a lower pH and a lower ionic strength, the solubility of Zr02 in the far-field reference water was calculated to be - 5.10-11 M. This inconsistency could formally lead to a precipitation of Zr02. The main emphasis lies on the word formally. At such low concentration levels the simple precipitation of pure crystalline solids or the formation of colloidal precipitates is most unlikely_ Sorption on fracture walls, the formation of co-precipitates, oversaturation phenomena, reaction kinetics as well as other system dependent features need to be considered in order to better qualify the importance of this potential2-orders-of-magnitude oversaturation.
- 47-
Niobium
Limiting Solid Modelled Solubility Speciation
Nb2 0 S 8.7 . 10-4
Selected solubility limits for niobium:
realistic: 10-3 M
98 % Nb03
2% Nb(OH)s(aq)
conservative: 10-3 M
Ref. Number
Nb1
Thermodynamic data for Nb are very sparse, Baes & Mesmer [6] merely give guesses for the formation constants of freshly precipitated Nb20 S and for the complexes Nb(OH)! and Nb(OH)s(aq)'
Note (table above) that the database uses the component "Nb03 ", which formally corresponds to
the hexahydroxo complex Nb(OH) 6 . At pH 9 Nb(V) is completely hydrolysed and the anionic
Nb(OH)6 comprises 98 % of the dissolved Nb. It is reported [6] that Nb forms highly charged, anionic hexamers in concentrated solutions. These polymeric species are very sensitive to hydrolysis and decompose upon addition of small amounts of alkali to form (non-specified) precipitates. It is supposed that the calculated solubility based on Nb20 s represents a conservative guess. Since no criteria are available to make a realistic guess it is proposed to use the conservative limit. The expected maximum concentration (see Table 3) is 8 . 10-5 M. Therefore, a more detailed discussion is not sensible if no other limiting Nb phases can be identified.
Influence of Eh: Nb is not affected by Eh, Nb(V) is the only relevant oxidation state in the Eh-range considered.
Consistency with far-field reference water: The solubility of Nb20 S calculated in the far-field reference water is -- 3 . 10-4 M. This value is very close to the solubility calculated in the bentonite pore water. The proposed solubility limit is consistent with the far-field reference water.
- 48-
Tin
Limiting Solid Modelled Solubility Speciation
Sn2S3
Sn02
Selected solubility limits for tin:
realistic: 10-5 M
2.5 . 10-6
6.7 . 10-6
100 % Sn(OH)5"
do.
conservative: 10-5 M
Ref. Number
Sn1
Sn2
In aqueous systems solid SnO is less stable than Sn02' but the oxidation Sn(ll) ~ Sn(IV) (solid -solid) is slow. In natural environments cassiterite (Sn02) is the main source of tin. Sn(ll) compounds are used as reductants, which helps understanding the calculated absence of Sn(ll), even at -400 mY. In contrast to the slow oxidation of solid SnO, the oxidation of dissolved Sn(ll) is fast. Ottemannite (Sn2S3) is not considered to be a relevant solid, since this phase is obtained by stoichiometric reaction of Sn with sulphur above 500°C and never from hydrothermal precipitation. The speciation calculation reveals that all Sn(IV) is present as the penta hydroxo complex Sn(OH):S, based on
thermodynamic data taken from the HATCHES [18] database (the original reference in HATCHES is given as "NSARPIENF (89) NI6"). Baes & Mesmer [6] give an estimate of the whole series of hydroxo complexes Sn(OH)!-n (n = 1 to 4), referring to Nazarenko et a!., Russ. J. Inorg. Chern. 16 (1971) 980. Using the Baes & Mesmer data would give a solubility of - 1.10-6 M. There is some inconsistency between the two data sets which needs to be investigated further. However, the present study selects cassiterite (Sn02) as the solubility limiting phase and a value of 10-5 M for the realistic solubility limit seems appropriate. There are no arguments which would support the selection of a conservative limit, therefore, the realistic value is taken.
Influence of Eh: Sn(IV) remains dominant and no influence of Eh above -400 m V is expected.
Consistency with far-field reference water: The relative distribution of Sn(OH)~-n species is very
sensitive to pH. Compared to pH = 9, Sn(OH):S is less stable at pH = 7.6 and a small oversaturation
with respect to cassiterite (Sn02) results from the calculation. Compared with the large uncertainties of the Sn(IV) hydrolysis data this formal oversaturation can be neglected. 10-5 M is consistent with the far-field reference water.
- 49-
Lead
Limiting Solid Modelled Solubility Speciation
PbS
Pb3(C03h(OH)2
~ PbC03
Selected solubility limits for lead:
realistic: 10-7 M
8.1 . 10-12
9.2 . 10-6
92 % Pb(C03)~-
8 % Pb(CO~h(ao)
do.
conservative: 10-5 M
Ref. Number
Pb1
Pb2
The chemistry of lead is well known, at -400 m V Pb(II) is predominant. Based on the quite high
CO ~- concentration, the Pb(II) speciation is dominated by the carbonato complexes Pb(C03)~- and
PbC03(aq)' In accordance with the speciation in solution the carbonate PbC03 and the hydroxide carbonate 2PbC03· Pb(OHh were assumed to be the most plausible solubility limiting solids. Both solids have very similar solubilities. Due to the dissolution of pyrite (an impurity within the bentonite) a substantial source (compared to the total Ph inventory) of sulphide is present. Lead forms very sparingly soluble sulphides which should be considered as potential solubility limiting solids in addition to the carbonates. It is proposed that the Pb hydroxide carbonate solid serves to fix the conservative solubility limit at 10-5 M. Most likely, the realistic solubility limit will be lower. A lower limit is given by the solubility of PbS (10-11 M). A weak point in selecting PbS as a potential limiting solid is the uncertainty of the HS-/S2- concentration. In the present porewater total HS- is - 10-6 M, which is a consequence of the modelled redox state including pyrite saturation (oxidation to sulphate as well as sulphide control by other sparingly soluble metal sulphides is not considered). HS-/S2- concentration is not a robust quantity, but depends on several parameters/assumptions and may vary by orders of magnitude. The solubility calculated for PbS is therefore not very reliable, however, it may give an indication that total Pb in solution could be much lower than 10-5 M. The lead inventory per canister is very low (6.6 . 10-3
moles; Table 2) compared to the enormous sorption capacity of the bentonite. An estimate of this sorption capacity (only edge sites considered) is 4.5 kmoles per canister, corresponding to 50 [moles of edge sites]/[kg of bentonite]. Note that the total cation exchange capacity of the bentonite (including all exchangeable sites) is ten times higher. Distribution coefficients (Kd's) for Pb(II) on clays are high. Li [35] states that the Kd for Pb(II) on clayish sediments in sea water is at least 107 mllg, Ulrich & Degueldre [63] give Kd's around loS mllg for montmorillonite at pH 7. Let us consider that the lead inventory is homogeneously distributed among the bentonite pore water. A rough calculation with Kd = 105 mllg in a system consisting of 6.6 mmoles of Pb(II) , 90 tons of bentonite and 20 tons of water immediately reveals that the equilibrium concentration of lead in the pore water will be irrelevant (- 10-12 M). All the lead will sorb on the bentonite (occupancy at
- 50-
ppm level). From a thermodynamic point of view this means that even sparingly soluble solids like for example PbS are not stable in the presence of a huge sorption site density. The example shows that the concept of a solubility limiting solid controlling the concentration in solution becomes questionable if low inventories, high sorption capacities and high Kd's characterise the system. However, for the realistic guess a value of 10-7 M is proposed, which compares to some extent with values measured in the groundwater of the northern crystalline basement of Switzerland (10-9 - 10-8 M, Pearson & Scholtis [47]). It is obvious that the realistic estimate still contains a conservative safety factor but arguments which could defend a much lower limit, are not strong enough.
Influence of Eh: Mildly oxidising conditions do not influence Pb since Pb(IV) requires very strong oxidising conditions. Solubility may be affected if oxidisable counterions (e.g. S2-) are involved in the solubility limiting process. The solubility of PbS may drastically increase if HS-/S2- is exhausted by oxidation to So~- .
Consistency with far-field reference water: PbS would limit the solubility to 2 . 10-12 M in the farfield reference water, assuming that the HS-ISO~- redox couple is not in equilibrium [47]. If the
sulphur couple is allowed to equilibrate, HS- is formally oxidised to So~- and PbS becomes undersaturated by many orders of magnitude. With respect to the already mentioned uncertainty in the HS- concentration (see discussion above) the selected limit of 10-7 M is consistent with the farfield reference water.
Antimony
Limiting Solid Modelled Solubility Speciation
Sb2 0 3 5.8 . 10-5
Selected solubility limits for antimony:
realistic: 6· 10-5 M
100 % Sb(OHh(aq)
conservative: 6· 10-5 M
Ref. Number
Sbl
Antimony is present as Sb(III) in reducing environments. In the pH range 4 to 10, Sb(OHh(aq) is the principal aqueous species. Further hydrolysis to Sb(OH)4 takes place above pH 10. A well established and investigated rhombic Sb20 3, precipitating from aqueous solutions serves for the realistic solubility limit (Baes & Mesmer [6] and references therein). There is no need to establish a conservative limit. The realistic limit is much higher than the expected maximum concentration of 10-9 M (cf. Table 3) for a conservative, no solubility limit scenario.
Influence of Eh: According to the available data Sb(III) is completely oxidised to Sb(V) around o mY. The corresponding Sb(V) oxide, Sb20 5, has a high solubility under present pH-conditions. At slightly oxidising conditions Sb is therefore not solubility limited.
- 51 -
Consistency with far-field reference water: At Eh = -180 mY, pH = 7.66 Sb is still limited at 5.8 . 10-5 M by Sb20 3. A very small amount (- 0.5 %) of Sb(V) is present at this Eh. Since the solubility is sensitive to Eh and not to pH (Sb(OHh is dominant over a large pH range) and since Sb20 5 does not limit the solubility, the proposed realistic limit of 6 . 10-5 M is consistent with the far-field reference water.
Bismuth
Limiting Solid Modelled Solubility Speciation Ref. Number
a - Bi20 3 4.0· 10-6 100 % Bi(OH)3(aq) Bil
Selected solubility limits for bismuth:
realistic: 4· 10-6 M conservative: 4· 10-6 M
According to Baes & Mesmer [6] and references therein, the hydrolysis of Bi(lII) has been investigated very intensively. In acidic solutions, very high concentrations of Bi(Ill) can be stabilised and interesting polymers such as Bi6(OH)~; and Bi9(OH)~o~~~22 are formed. In the pH-range 8 to
11, the neutral Bi(OH)3(aq) is predominant. The further hydrolysis to Bi(OH)4 (and, in parallel, an increase in Bi solubility) becomes important above pH - 12. Bi(lll) forms hydroxy-salts with different anions (N03", SO~-, SeO~-, CrO~), and, in particular, slightly soluble basic carbonates are
formed. However, their solubilities as well as the conditions of their formation were not available for the present work. Merely available for the calculations were the hydrolysis data (important for the less relevant acidic domain) and the solubility data for (l-Bi20 3 which lead to the calculated solubility of 4 . 10-6 M. In natural environments, Bi often occurs as Bi2S3, associated with Pb- and Cu sulphides (sulfo-salts) and also with Sn02 (cassiterite). This indicates a certain correlation between Bi and Pb, Cu and Sn. The calculated solubility is in fair agreement with the conservative estimates for Pb and Sn. The conservative solubility limit of Bi is set to 4 . 10-6. Presently no additional criteria are available which would support a realistic solubility limit different from 4 . 10-6 (data for Bi2S3 were not available). The conservative limit is therefore proposed to serve for the realistic limit also.
Influence ofEh: Bi(V) is a strong oxidising agent and will not form under moderate Eh conditions. An increased Eh will therefore not influence the solubility of Bi.
Consistency with far-field reference water: The proposed limit of 4 . 10-6 M is consistent with the far-field reference water, a-Bi20 3 still being close to saturation.
Note: The available thermodynamic data describe only a very small extract of a much larger variety of bismuth complexes and solids. Examples are the already mentioned sulphides and slightly soluble
- 52-
hydroxy-salts and also elemental Bi which is easily obtained by reduction in alkaline solution. This should be kept in mind when applying the proposed solubility limits.
Samarium
Limiting Solid Modelled Solubility Speciation Ref. Number
Sm2(C03h 1.3 . 10-4 100 % Sm(C03)2 Sml
Selected solubility limits for samarium:
realistic: 10-5 M conservative: 10-5 M
Samarium is only one representative of the rare earth elements (REE) present in the waste (La, Ce, Pr, Nd, Pm, Sm, Eu, Od, Dy). All REE show a very similar chemical behaviour. Instead of considering Sm in particular, it is proposed to look at the general behaviour of REE, which will be determined by the most abundant elements in the waste (Nd, Ce, La, Pr; see [26, Table 1]. Most likely, the solubility limiting phases will be the carbonates RE~(C03h or, as in the case of Am, the hydroxy carbonates REE(OH)C03. At present, no thermodynamic data are available for the hydroxy carbonates. The calculated solubility of REE carbonates in the reference groundwater lies in a narrow range at a level of - 10-4 M. Based on the ratio SmlREEtot - 0.1 [26] a Sm concentration of - 10-5 M is estimated. This value is thought to be conservative. An estimate based on Li's work [35], on the amount of sorbing bentonite per canister and on the total REE inventory gives a maximum concentration of only 10-9 M for the REE elements (see also the discussion on page 49). However, this estimate relies on sorption processes and not on the solubility of solids and is just used to support the proposed solubility limits. It is not distinguished between a "realistic" and a "conservative" limit
Intluence of Eh: Eh does not influence the solubility of Sm.
Consistency with far-field reference water: The solubility of carbonates (and hydroxy carbonates) increases with decreasing pH. Therefore, the proposed solubility limit for Sm is consistent with the far-field reference water.
- 53-
Appendix 2 (data file specification)
The geochemical calculations have been performed on a Micro V AX-3800 computer system. For reason of traceability and to fulfil QAlQC requirements, the most relevant input files as well as code and database are listed in the following table. All files are listed with the actual name under which they are retrievable from the backup medium of the computer system.
The in-house thermodynamic database used in the present study (MINEQL/PSI, version February 92) has never been documented in full length. The most comprehensive description is included in the documentation of the "Nagra Thermochemical Data Base" by Pearson et al. [46]. In fact, the Nagra Thermochemical Data Base was derived from the MINEQL/PSI data base, version March 91, including additional data from a PHREEQE data base (pSI, 04/91) and from HATCHES 3.0.
The data base used for this work includes more entries than are documented in [46] (e.g. reference [46] does not include data on Pa, Ra, Sm, Pb, Sb and Bi). In order to enable full traceability of the calculations performed for this report, all differences between the presently used data and those documented in [46] are addressed in this appendix.
The differences are ranked into the three groups:
• Elements not included in reference [46]
• Equilibria differing in the log K of reaction
• Aqueous species and solids not included in reference [46].
The large number of more than 200 entries in this appendix may suggest large differences among the two data bases. This is not the case. The vast majority of differences is concerned with solid phases which are irrelevant in the chemical systems considered in this report. However, some of the equilibria are/may be essential for calculating solubility limits (e.g. the iron oxides/hydroxides fixing the redox state of the solution). Such species/solids are marked with an asterisk. Note that the tables do not give a full description of the equilibria but list log K and LlHO of reaction according to the notation used in the MINEQL code system (an example is given in Table 8).
- 55 -
Table A3.1 Elements not included in reference [46]
Species/Solids this work Species /Solids this work
1) Representation of Tc(III) is not unique (Tc3+ /TcO+); [46] does not include Tc~2+; remarkable difference in the stability of TcO;.
2) Inconsistency most likely from not unique representation of unusual oxidation states of Sulphur (Le. S(-I), S4(-IV), S(-II» and from stability of the sulphide ion S2-.
- 57-
Table A3.3 Aqueous species and solids not included in [46]
Species /Solids this work Species /Solids this work