76
Technical Report A - Parking Demand Analysis Downtown Parking Strategy for Stratford Ontario D Sorbara Parking & Systems Consulting 5/20/2016
Technical Report A - Parking Demand Analysis Downtown Parking Strategy for Stratford Ontario
D Sorbara Parking & Systems Consulting 5/20/2016
Technical Report A - Parking Demand Analysis
DSorbara Parking & Systems Consulting
May 2016
2
Contents FIGURES ......................................................................................................................................................... 3
TABLES ........................................................................................................................................................... 5
Project Methodology .................................................................................................................................... 6
Technical Approach to Parking Demand Analysis ..................................................................................... 6
Analysis of Factors that Shape the Parking Demand Profile ......................................................................... 9
Factor 1: The Physical Environment ...................................................................................................... 9
Current Land Use Profile ................................................................................................................... 9
Current and Potential Level of Market Service ............................................................................... 13
Potential Changes to the Physical Environment and Nature of the Downtown ........................ 16
Factor 2: The Dynamic between Land Use Type and Trip Characteristic ........................................... 19
Parking Demands by Land Use Type ............................................................................................... 19
Temporal Variation of Parking Demand Makes Efficient Use of Supply ......................................... 20
Multiple Destinations for a Trip ...................................................................................................... 21
Market Synergy – Walk-ins [Captive Market Effects] ..................................................................... 22
Factor 3: The Dynamic between Parking Demand and Parking Supply .............................................. 24
Role of Walking Distance to the Definition of a Parking Problem .................................................. 24
Walking Distance – To/from Demand and Supply .......................................................................... 29
Walking Distance - Time Taken ....................................................................................................... 30
Walking Distance – Implied Level of Service ................................................................................... 30
Work Trip Market Segment ........................................................................................................ 31
Visitor Trip Market Segment ....................................................................................................... 32
Factor 4: The Dynamic between Parking Demand and Parking Operations ....................................... 33
Potential Impact of Free Parking Supply on Non-commercial Areas - Downtown ......................... 33
Impact on Parking Demand of Municipal Parking Promotions ....................................................... 34
Potential Impact of the Enforcement of Time Restriction .............................................................. 34
Factor 5: The Customer Experience .................................................................................................... 37
Customer Profile ............................................................................................................................. 37
Trip Destinations and Time Spent in the Downtown ...................................................................... 38
Customer Use of Different Parking Products .................................................................................. 38
Evaluation of Current Parking Demand and Supply .................................................................................... 40

Technical Report A - Parking Demand Analysis
DSorbara Parking & Systems Consulting
May 2016
3
Overview of Methodology ...................................................................................................................... 40
Step 1: Calculate Peak Hour Parking Demand ........................................................................................ 41
Employee and Visitor Peak Hour Parking Demand Ratios .................................................................. 41
Total Downtown Peak Hour Parking Demand .................................................................................... 42
Step 2: Compute Block Level Peak Hour Demands ................................................................................. 43
Analysis of Spatial Patterns of Demand .............................................................................................. 43
Step 3: Compare Block Parking Demands to Block Parking Supply ........................................................ 44
Analysis of Current Balance of Parking Demands and Parking Supply ............................................... 47
Step 4: Apply Walking Distance Characteristics to Parking Demand ...................................................... 48
Distribution of Block Level Trips Applying Walking Distance .............................................................. 49
Analysis of Block Demand Distributed by Applying Walking Distance ............................................... 53
Step 5: Compare Distributed Parking Demand to Parking Supply .......................................................... 54
Market Potential Opportunities Resulting from Changes .......................................................................... 57
Assessment of the Impact of Changes .................................................................................................... 57
Background Analytic Framework ........................................................................................................ 57
Market Square Re-development Options ........................................................................................... 60
Cooper Site Potential Re-development .............................................................................................. 62
Erie Site Potential Re-development .................................................................................................... 63
Intensification of Residential Use ....................................................................................................... 63
Impact of Changes in Technology and Character of Downtown ........................................................ 67
Summary ..................................................................................................................................................... 68
Parking Demand Analysis ................................................................................................................ 68
Evaluation of Current Parking Demand and Supply ........................................................................ 72
Market Potential Opportunities Resulting from Changes .............................................................. 74
FIGURES
Figure 1: Sample of Online Form .................................................................................................................. 7
Figure 2: Illustration of Parking Demand Analysis Process ........................................................................... 8
Figure 3: Location of Food Related Land Uses [from BIA website] ............................................................. 11
Figure 4: Location of Professional Services [from BIA website] ................................................................. 11

Technical Report A - Parking Demand Analysis
DSorbara Parking & Systems Consulting
May 2016
4
Figure 5: Distribution of Retail Land Uses [from BIA website] ................................................................... 11
Figure 6: Distribution of Services [from BIA website] ................................................................................. 11
Figure 7: Parking Demand Analysis Process - Trip Characteristics.............................................................. 19
Figure 8: Theoretical Temporal Patterns of Parking Demand for Typical Land Uses ................................. 20
Figure 9: Sketch of multiple destinations associated with one parking location ....................................... 22
Figure 10: Parking Demand Analysis - Attraction of Parking Supply .......................................................... 24
Figure 11: Library Evidence of Walking Distance by Duration of Stay ........................................................ 26
Figure 12: Duration of Stay versus Search Time [Off-street Users] ............................................................ 27
Figure 13: Spatial Distribution of Destinations from Market Square Block (C104) .................................... 28
Figure 14: Spatial Distribution of Destinations from Albert Block (E100) .................................................. 28
Figure 15: Spatial Distribution of Destination from Erie Block (C101) ........................................................ 28
Figure 16: Spatial Distribution of Destinations from Free Lot (C108) ......................................................... 29
Figure 17: Field Surveyed Spatial Distribution of Average Walking Distance per Block ............................. 30
Figure 18: Parking Demand Analysis - Impact of Parking Operations......................................................... 33
Figure 19: Parking Demand Analysis - Impact of Customer Experience ..................................................... 37
Figure 20: Generate Peak Hour Demand Ratios and Apply to Block Land Uses ......................................... 40
Figure 21: Distribute Block Parking Demands to Block Supply by Walking Distance ................................. 40
Figure 22: Typical Peak Hour Parking Demand Ratios (Spaces per 100 Sq. M of Land Use) ...................... 42
Figure 23: Work Parking Demand by Block ................................................................................................. 43
Figure 24: Visitor Parking Demand by Block ............................................................................................... 43
Figure 25: Total Parking Demand by Block ................................................................................................. 43
Figure 26: Info graphic Showing Comparison of Block Demand to Block Supply - Long Stay Demand ...... 45
Figure 27: Info graphic Showing Comparison of Block Demand to Block Supply - Short Stay Demand ..... 46
Figure 28: Info graphic Showing Analysis of Current Demand to Supply Balance ...................................... 47
Figure 29: Long Stay (Work) Parking Demand Applying Walking Distance ................................................ 50
Figure 30: Short Stay (Visitor) Parking Demand Applying Walking Distance .............................................. 51
Figure 31: Total Parking Demand Applying Walking Distance .................................................................... 52
Figure 32: Info graphic Showing Distributed Parking Demand as per Walking Distances .......................... 53
Figure 33: Info graphic Showing Current Parking Demand to Parking Supply ............................................ 56
Figure 34: Retail Space within 100 Meters of Municipal Lots .................................................................... 57
Figure 35: Spatial Distribution of Primary Destinations for Users of Albert St Lot ..................................... 58
Figure 36: Spatial Distribution of Primary Destinations of Users of Market Square On-street Spaces ...... 58
Figure 37: Spatial Distribution of Primary Destinations of Erie Lot Users .................................................. 59
Figure 38: Spatial Distribution of Primary Destinations of Users of Cooper Free Lot ................................ 59
Figure 39: Info graphic Showing Impact on Customer Demand if 45 Spaces Lost on Market Square ....... 61
Figure 40: Info graphic Showing Impacts of Losing Cooper Site Parking .................................................... 65
Figure 41: Info graphic Showing Impacts of Losing Erie Lot Spaces ........................................................... 66
Figure 42: Block Summary of Walking Distances [Total, Average, Low & High] ......................................... 69
Technical Report A - Parking Demand Analysis
DSorbara Parking & Systems Consulting
May 2016
5
TABLES
Table 1: Estimated Quantity of Floor Space by Land Use Type (Sq. Meters) ............................................... 9
Table 2: Proximity of key sources of attraction within 50 and 100 Meters of Municipal Off-street
Facilities ...................................................................................................................................................... 13
Table 3: Current Level of Service ................................................................................................................ 16
Table 4: Temporal Variation Factors for Selected Land Uses ..................................................................... 21
Table 5: Customer Durations of Stay and Number of Destinations ............................................................ 22
Table 6: Walking statistics derived from surveys ........................................................................................ 29
Table 7: Graphic Showing a Measure of the Level of Customer Service .................................................... 31
Table 8: Customer Responses to Online Enforcement Questions .............................................................. 35

Technical Report A - Parking Demand Analysis
DSorbara Parking & Systems Consulting
May 2016
6
Project Methodology In the course of this parking management study, three data collection tasks are conducted. They are:
Parking Demand Analysis, Parking Supply Response1 [to
the demand] and the Market Potential Identification.
The results of these three tasks feed into a fourth task:
Policy Development and Analysis and then into a fifth
task: Parking Management Strategy.
This report speaks to Task 1: Parking Demand Analysis
and informs:
- what is attracting people to the downtown;
- when are they in need of parking spaces;
- how long do they typically need parking; and,
- What factors are important to visitors to the
downtown in choosing their parking space?
Technical Approach to Parking Demand Analysis The essence of parking demand analysis is to capture, interpret and understand the profile of the
parking market. Parking space is considered as a product to sell to the public. The parking demand
analyses are specifically geared towards identifying the share of the parking market that can be
expected to "buy" the product.
The extent and the nature of the "market" guide the decision to locate a new facility, or expand an
existing one. The parking user profile will dictate the operational method, the parking rates (if applicable)
and the capacity of each facility.
The specific objectives of this process are:
Develop a set of peak hour parking demand rates for visitors and employees relating to land uses;
Identify and summarize the trip characteristics specific to certain land uses (duration of stay, rhythm of trips over the course of the day, week and season, number of stores visited, etc.); and
Determine the range of walking distances (how far people are willing to walk to and from a parking stall) relating to visitor and employee trips.
The process to meet these objectives involved the following:
Build a profile of the land uses that attract visitors, employees to the downtown study area. 1 The concept of parking supply response surveys is synonymous with the terms: parking utilization studies, Licence plate surveys, turnover and duration of stay surveys.
Technical Report A - Parking Demand Analysis
DSorbara Parking & Systems Consulting
May 2016
7
Spatial market analysis will provide the
framework for answering questions related to
the displacement of current parking space in
one area and its impact on another.
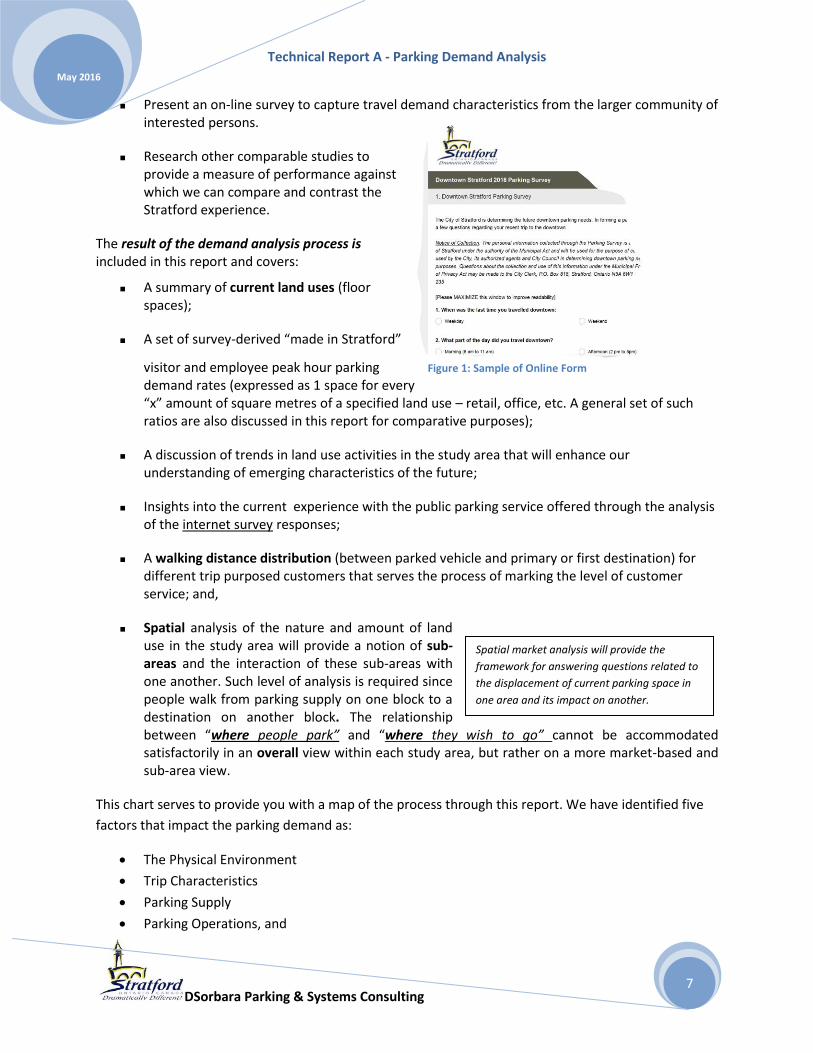
Present an on-line survey to capture travel demand characteristics from the larger community of interested persons.
Research other comparable studies to provide a measure of performance against which we can compare and contrast the Stratford experience.
The result of the demand analysis process is included in this report and covers:
A summary of current land uses (floor spaces);
A set of survey-derived “made in Stratford”
visitor and employee peak hour parking demand rates (expressed as 1 space for every “x” amount of square metres of a specified land use – retail, office, etc. A general set of such ratios are also discussed in this report for comparative purposes);
A discussion of trends in land use activities in the study area that will enhance our understanding of emerging characteristics of the future;
Insights into the current experience with the public parking service offered through the analysis of the internet survey responses;
A walking distance distribution (between parked vehicle and primary or first destination) for different trip purposed customers that serves the process of marking the level of customer service; and,
Spatial analysis of the nature and amount of land use in the study area will provide a notion of sub-areas and the interaction of these sub-areas with one another. Such level of analysis is required since people walk from parking supply on one block to a destination on another block. The relationship between “where people park” and “where they wish to go” cannot be accommodated satisfactorily in an overall view within each study area, but rather on a more market-based and sub-area view.
This chart serves to provide you with a map of the process through this report. We have identified five
factors that impact the parking demand as:
The Physical Environment
Trip Characteristics
Parking Supply
Parking Operations, and
Figure 1: Sample of Online Form

Technical Report A - Parking Demand Analysis
DSorbara Parking & Systems Consulting
May 2016
8
The impact that Customer Experience may have on parking demand.
Figure 2: Illustration of Parking Demand Analysis Process
From a planning point of view
these factors measure the
extent and type of parking
demand and assist in the
evaluation of the level of
service that is currently
delivered by the municipal
parking service. Specifically,
the study examines:
Land uses that draw
customers on a consistent
basis – personal services such
as hair care/drug stores,
medical services, entertainment venues, recreation facilities, grocery stores for example;
Land uses that interact off each other – entertainment use such as the Theatres, special
(seasonal) events in the commercial area and pre- or post-theatre activities such as restaurants
or dessert cafes;
Land uses that exhibit temporal variation of their demand over the course of the day (uses that
attract customers at different times of the day serve to make efficient use of parking supply)-
from coffee shops in the morning and afternoon to dessert/pastry shops, luncheon dining to
formal sit-down dining in the evenings;
Land uses that provide a multi-destination experience and therefore stretch the time spent in
the downtown and promote the "collective" role of public parking space2;
The geography between the attraction (the land use) and the parking supply service – the
walking distance;
The physical landscape of the commercial land use – how compactness and density play key
roles in parking space allocation and in level of ambience in the study areas; and,
The competitive commercial market that draws customers to and away from the downtown.
The next sections elaborate on each factor on Figure 2. Each factor is shown and discussed as discrete,
but the reality is – as represented by the two-way arrow on Figure 2 –there is a significant amount of
interaction among these factors.
2 Collective parking space refers to space that serves a broader area versus a parking space that restricts its use to a specific site.
Technical Report A - Parking Demand Analysis
DSorbara Parking & Systems Consulting
May 2016
9
Analysis of Factors that Shape the Parking Demand Profile
Factor 1: The Physical Environment
A familiarity with the land use activity is a necessary input to our
understanding of the relationship between parking demand and
parking supply. Floor areas were obtained from the field, visual and
internet inspection of the downtown and through a comparison with
previous studies3. Land use classified by type of activity is a critical
input because different types of land use exhibit different:
Peak hour parking demand rates;
Patterns of parking demand over the course of a day;
Patterns of parking demand over seasons of the year; and
different
Peak demand days of the week.
Current Land Use Profile
The geographic scope and the quantities of land use for the
investigation of the parking demand are on Table 1.
These land use data are estimates of space and type of use. Table 1 is an extract of only those land uses
that have an impact on public parking demand in the study area. Typical for many downtowns, primary
land use activity is comprised of commercial offices and retail. The service and financial investment
services as well as banking represents a small proportionate share of the total space, but as will be
discussed in greater detail, these activities generate a significant number of customers each day. They
represent a vital component to the characterization of the customer market - one that returns to the
study area on a daily or weekly basis thus creating a core of the transient community in the downtown.
The uniqueness of Stratford's downtown land uses is reflected in the theatre component and in the
geographic layout of the roads that are non-traditional (triangular and block faces that are longer than
other more traditional urban designs found in downtowns).
Table 1: Estimated Quantity of Floor Space by Land Use Type (Sq. Meters)
Table 1: Estimated Quantity of Floor Space by Land Use Type (Sq. Meters) - Downtown -
Land Use Activity Quantity (Sq. Meters)
Retail (includes categories personal services, fitness clubs, specialty food) 38 920
Finance (banks, investment advice) 2 496
Professional Office 13 819
Government Services (Courts, Library, City Hall, Police services, etc) 19 982
3 City of Stratford Cooper Site Building: Community Workshop & Recommendations, Malone Given Parsons LTD, October 2013. As well, City of Stratford: Assessment of Structured Parking on Erie Parking Lot, Read Voorhees and Associates, September 1988.

Technical Report A - Parking Demand Analysis
DSorbara Parking & Systems Consulting
May 2016
10
Table 1: Estimated Quantity of Floor Space by Land Use Type (Sq. Meters) - Downtown -
Medical Services 5 874
Restaurant (Fast Food, Sit-down, Cafes, etc) 5 937
Learning Centres 8 149
Entertainment/Social (includes Theatres, Assembly Halls, Legion) 14 870
Residential (conservative estimate) 35 982
Estimated Total Space 143 029
The intensification of the residential land uses in the downtown means that the market for
entertainment, and daily goods (food) and services (financial, personal care) will continue to expand.
The development of a resident community will require some parking space for storage but in term will
reduce the number of parking spaces required to service visitor parking.
Figures 3 to 6 - drawn from the BIA's website - serve to give some spatial context and a notion of the
quantity of commercial services in the Stratford downtown.

Technical Report A - Parking Demand Analysis
DSorbara Parking & Systems Consulting
May 2016
11
Reflecting on the above the following salient findings are offered:
There are over 55 food services (fast/take out, sit-down etc)
There are over 70 professional services that include: accountants, lawyers, health care, financial investment advisors, real estate etc.
Over 100 retail (19 Fashion Ladies, 13 Specialty and 3 gift shops, etc)
Over 90 service outlets that include hairstylists (18 of them), health care (7) and fitness centers
(5). This classification on the BIA site includes the University of Waterloo as well.
The general breakdown of the floor space in the study area is primarily residential, retail and
office in nature with close to half of the total surveyed buildings.
While the categories of banks and restaurants are relatively small in comparison to others, they
nonetheless represent a significant impact on the volume and - as we shall see later - on the
pattern of parking activity over the course of the day.
Figure 3: Location of Food Related Land Uses [from BIA website]
Figure 4: Location of Professional Services [from BIA website]
Figure 5: Distribution of Retail Land Uses [from BIA website] Figure 6: Distribution of Services [from BIA website]
Technical Report A - Parking Demand Analysis
DSorbara Parking & Systems Consulting
May 2016
12
1. Services such as finance and medical and hair care establishments are critical to the draw of
visitors over the course of the day. Such uses serve to parlay into multi-destination trips in the
downtown area which in turn increase duration of stay. Such uses also tend to attract visitors on
a more regular basis – weekly or monthly for example. In terms of parking demand then, these
particular land use categories provide a set of sustained visitors to the downtown – they provide
a pivotal base for our parking supply user market.
2. The quantity of the various land uses is important to know, but from a parking demand analysis
point of view, it is the spatial distribution of that land use that drives where we need to provide
support parking spaces.
3. Lastly, from a building-by-building perspective the commercial space is concentrated in a dense
building form. The facades of the buildings along Ontario, Wellington and Downie form a solid
unified commercial visual address along the horizontal, and residential, service and offices that
sit on top of the grade level commercial use along the vertical. This urban form serves the
following important input to the study of parking demand:
o People driving along Ontario, Wellington and Downie can more easily see the shops as
the solid urban facade presents a “billboard” of sorts;
o Once the motorist finds the intended primary destination point, the focus of the
motorist turns to reading the signs that direct them to parking space – be it along
Ontario, Wellington or Downie in an on-street space or directed to an off-street parking
space; and
o The transportation network of streets provides the various channels that allow the
motorist to safely park their vehicle or negotiate movement in and around the
downtown.
This range of uses will play into the computation of parking demand as a number of different land use
types attract parking demand at varying peak hours of the day, varying days of the week, and at varying
magnitudes. The interplay of these factors will provide an estimate of the potential size of the parking
demand. Walking distance to and from parking space and these land uses will help distribute that
parking demand to the parking supply.
Shaped by the analysis of walking distance to and from parking space and primary destination, we chose
to view how key land use types, (retail, office, medical and personal services) are served by the key
parking facilities in the study area. In this way, these two study deliverables were formed: the
identification of where potential parking supply opportunities exist, and the measurement of a customer
level of service.

Technical Report A - Parking Demand Analysis
DSorbara Parking & Systems Consulting
May 2016
13
Current and Potential Level of Market Service
Table 2 describes the distribution of various key land uses relative to the off street parking facilities
provided by the municipality. Here the geographic scope is 50 and 100 meters from the center of each
off street parking facility. The online survey results point to this as a walking threshold for shorter stay
trips to the downtown.
The size of the relative red dot serves to indicate visually the physical relationship between the potential
parking demand generator (the land use) and the major parking infrastructure (the off street carpark).
Important relationships to maintain it seems are:
Erie
Albert
Cobourg, and
Perhaps surprising the opportunity that the St Patrick Street lot has.
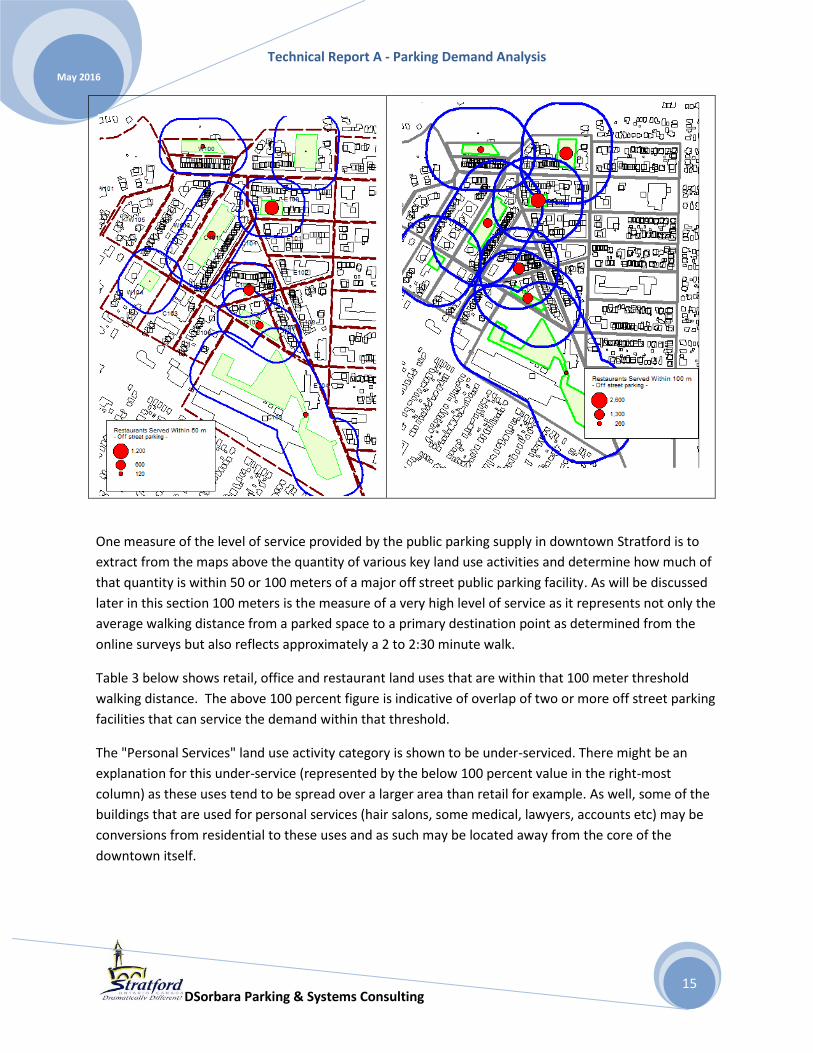
Table 2: Proximity of key sources of attraction within 50 and 100 Meters of Municipal Off-street Facilities
Retail Attraction
Relative amount of retail space within 50 and 100 meters of each major parking site. The size of the red dot illustrates the relative amount of retail floor space.
Office Attraction
Relative amount of office space within 50 and 100 meters of each major parking site. The size of the red dot illustrates the relative amount of retail floor space.

Technical Report A - Parking Demand Analysis
DSorbara Parking & Systems Consulting
May 2016
14
Service Attraction
Relative amount of service space within 50 and 100 meters of each major parking site. The size of the red dot illustrates the relative amount of retail floor space.
Restaurant/ Food Attraction
Relative amount of restaurant space within 50 and 100 meters of each major parking site. The size of the red dot illustrates the relative amount of retail floor space.
Technical Report A - Parking Demand Analysis
DSorbara Parking & Systems Consulting
May 2016
15
One measure of the level of service provided by the public parking supply in downtown Stratford is to
extract from the maps above the quantity of various key land use activities and determine how much of
that quantity is within 50 or 100 meters of a major off street public parking facility. As will be discussed
later in this section 100 meters is the measure of a very high level of service as it represents not only the
average walking distance from a parked space to a primary destination point as determined from the
online surveys but also reflects approximately a 2 to 2:30 minute walk.
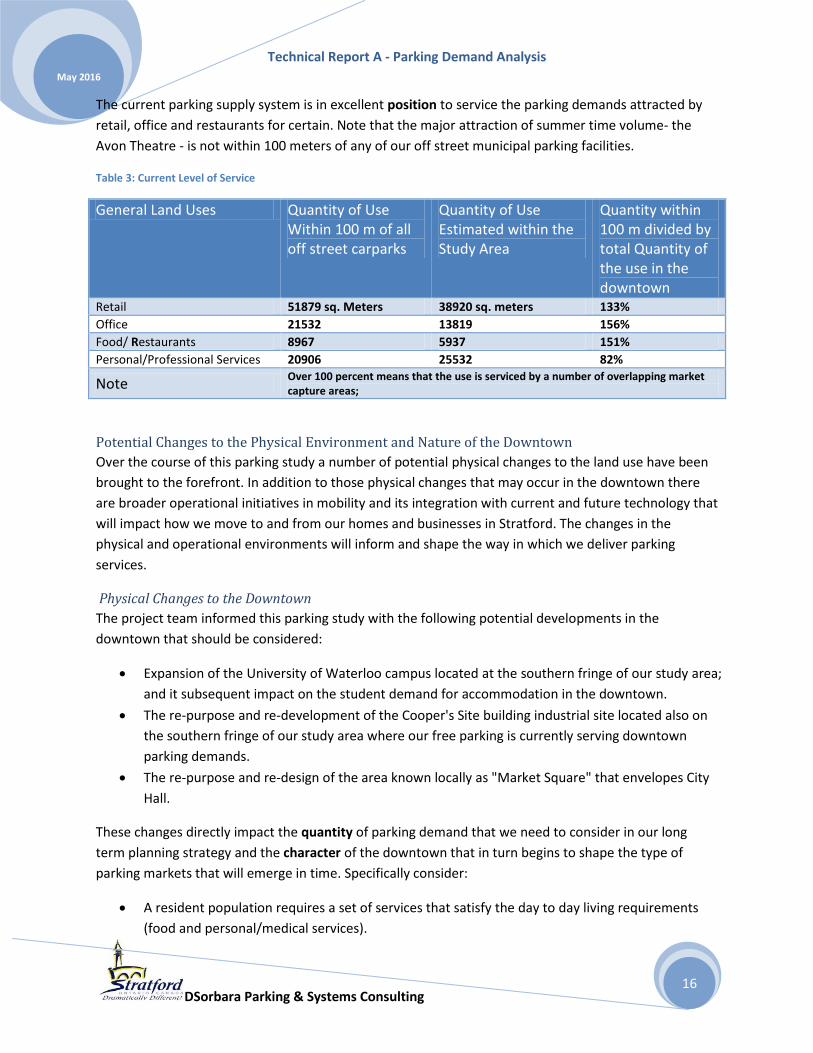
Table 3 below shows retail, office and restaurant land uses that are within that 100 meter threshold
walking distance. The above 100 percent figure is indicative of overlap of two or more off street parking
facilities that can service the demand within that threshold.
The "Personal Services" land use activity category is shown to be under-serviced. There might be an
explanation for this under-service (represented by the below 100 percent value in the right-most
column) as these uses tend to be spread over a larger area than retail for example. As well, some of the
buildings that are used for personal services (hair salons, some medical, lawyers, accounts etc) may be
conversions from residential to these uses and as such may be located away from the core of the
downtown itself.
Technical Report A - Parking Demand Analysis
DSorbara Parking & Systems Consulting
May 2016
16
The current parking supply system is in excellent position to service the parking demands attracted by
retail, office and restaurants for certain. Note that the major attraction of summer time volume- the
Avon Theatre - is not within 100 meters of any of our off street municipal parking facilities.
Table 3: Current Level of Service
General Land Uses Quantity of Use Within 100 m of all off street carparks
Quantity of Use Estimated within the Study Area
Quantity within 100 m divided by total Quantity of the use in the downtown
Retail 51879 sq. Meters 38920 sq. meters 133%
Office 21532 13819 156%
Food/ Restaurants 8967 5937 151%
Personal/Professional Services 20906 25532 82%
Note Over 100 percent means that the use is serviced by a number of overlapping market capture areas;
Potential Changes to the Physical Environment and Nature of the Downtown
Over the course of this parking study a number of potential physical changes to the land use have been
brought to the forefront. In addition to those physical changes that may occur in the downtown there
are broader operational initiatives in mobility and its integration with current and future technology that
will impact how we move to and from our homes and businesses in Stratford. The changes in the
physical and operational environments will inform and shape the way in which we deliver parking
services.
Physical Changes to the Downtown
The project team informed this parking study with the following potential developments in the
downtown that should be considered:
Expansion of the University of Waterloo campus located at the southern fringe of our study area;
and it subsequent impact on the student demand for accommodation in the downtown.
The re-purpose and re-development of the Cooper's Site building industrial site located also on
the southern fringe of our study area where our free parking is currently serving downtown
parking demands.
The re-purpose and re-design of the area known locally as "Market Square" that envelopes City
Hall.
These changes directly impact the quantity of parking demand that we need to consider in our long
term planning strategy and the character of the downtown that in turn begins to shape the type of
parking markets that will emerge in time. Specifically consider:
A resident population requires a set of services that satisfy the day to day living requirements
(food and personal/medical services).
Technical Report A - Parking Demand Analysis
DSorbara Parking & Systems Consulting
May 2016
17
A resident population grows into a community. This community becomes more engaged in its
surroundings by protecting it from invasive traffic and demanding a set of urban design
standards that encourages a more pedestrian environment.
A resident population requires parking space on-site for their own vehicles and more likely to
face a conflict with their visitors and people who are shopping, dining and engaging in
commercial activities.
A year-round entertainment and community focus point such as Market Square generates
pedestrian traffic that needs to be woven safely into the existing urban transportation network.
Both Cooper and Market Square redevelopment areas currently provide critical parking
inventory that serves current downtown visitors and employees.
Market Square redevelopment concepts to date have had to consider the temporary re-location
of the town's transit hub.
Within the scope of this parking strategy study, we want to be able to inform this planning process with
a framework that allows us to manage the parking services effectively. We want to be able to provide
evidence that serves to find suitable alternatives to parking infrastructure that will still provide the
expected level of service to our customers. Within this study's scope we want to indicate clear
alternatives.
Technological Changes and their Impact on Future Parking
Services
Technological changes have and will have an impact on our
mobility means, on the quantity and ultimately the need for
parking. This parking strategy needs to acknowledge that
changes in the way we move around town will impact the urban landscape. The technologies are:
- Driverless vehicles;
- Shared economy or "dial-up" service;
- Continuation of internet based shopping for and purchase of
services and products from the comforts of your home or
office, and
- Technology that finds and directs to vacant parking space for
you.
Driverless Vehicles and Shared Economy
Stratford stands out a major player in this technological development. Mayor Mathieson discussed the
testing program now underway in Stratford. The Province of Ontario also made it clear that it is
investing in the provision of infrastructure to service automated vehicle innovation. The technology is
fairly clear to most so there is no need to describe it in any great detail here. Important to our study is
Technical Report A - Parking Demand Analysis
DSorbara Parking & Systems Consulting
May 2016
18
the potential impact on the way in which we think about parking. A scan of commentary on this
technology finds the following key points:
Combining the driverless vehicle with the "shared economy" technology, the on-demand service
will not require a vehicle to rest in a parking space. Circulating around the block looking for a
vacant parking space is not necessary as a driverless vehicle need only to pick up or drop off its
passengers. Remember that a vehicle spends 96 percent of its time parked.
Infrastructure changes are required so that this technology works - from clear network sensors,
availability of charging stations to broadband wireless network that allows for communication
between vehicles and that infrastructure.
Most analysts believe that this technology will provide a safer and more efficient mobility
service to us. It will also promise a cleaner environment as it is based on non-fossil fuel
technology.
Industry is well into the development of vehicles that can operate as such.
Dialing up the service will be economical when compared to the outright purchase of your own
vehicle.
The technology will likely not reduced road congestion, however it will reduce the traffic that
circulates looking for parking spaces (estimated to be of the order of 35 to 45 percent of the
total volume)
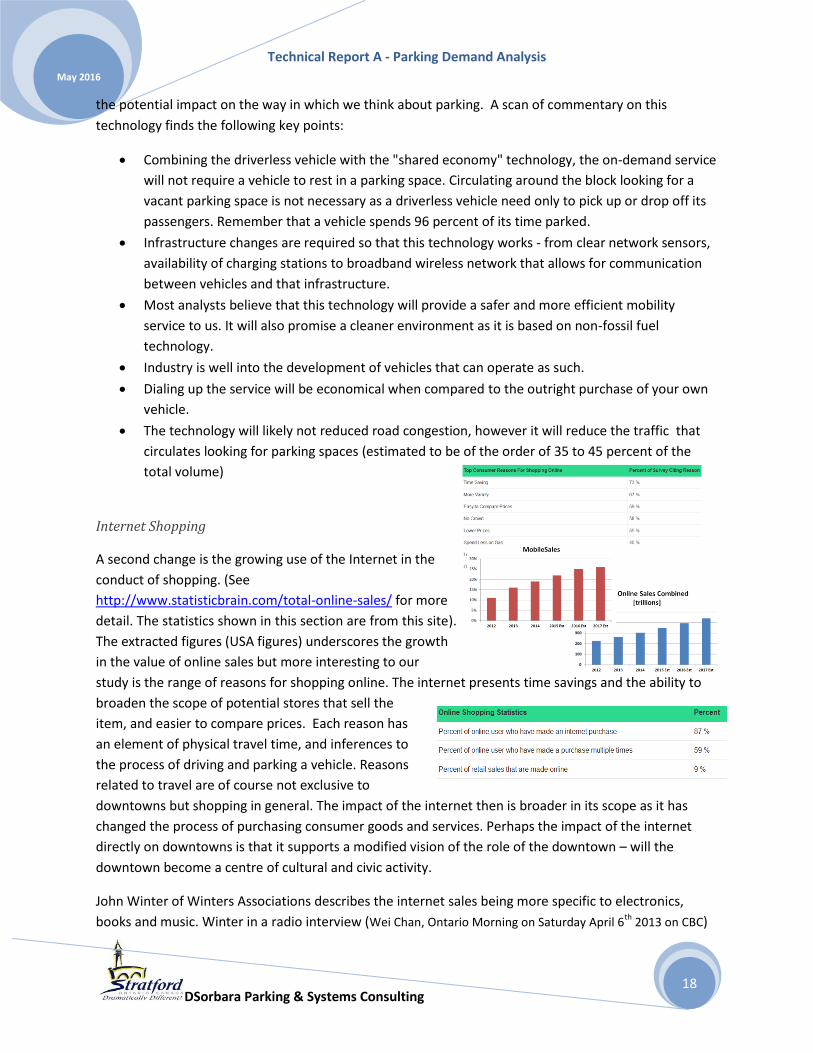
Internet Shopping
A second change is the growing use of the Internet in the
conduct of shopping. (See
http://www.statisticbrain.com/total-online-sales/ for more
detail. The statistics shown in this section are from this site).
The extracted figures (USA figures) underscores the growth
in the value of online sales but more interesting to our
study is the range of reasons for shopping online. The internet presents time savings and the ability to
broaden the scope of potential stores that sell the
item, and easier to compare prices. Each reason has
an element of physical travel time, and inferences to
the process of driving and parking a vehicle. Reasons
related to travel are of course not exclusive to
downtowns but shopping in general. The impact of the internet then is broader in its scope as it has
changed the process of purchasing consumer goods and services. Perhaps the impact of the internet
directly on downtowns is that it supports a modified vision of the role of the downtown – will the
downtown become a centre of cultural and civic activity.
John Winter of Winters Associations describes the internet sales being more specific to electronics,
books and music. Winter in a radio interview (Wei Chan, Ontario Morning on Saturday April 6th
2013 on CBC)

Technical Report A - Parking Demand Analysis
DSorbara Parking & Systems Consulting
May 2016
19
noted that the sectors that are most vulnerable to both internet sales and the influx of the “big box”
stores are: small “mom and pop” stores and downtowns! The discount stores are continuing to
dominate the retail landscape. Winter suggests that price and shopping in a climate controlled
environment are the key reasons for the big box success.
Within a dynamic market place that features the aforementioned "big box" destinations, how do citizens
define the downtown and its linear, compact and specialty store landscape? How do citizens define the
role of their downtown in their business, cultural and community experience in Stratford? Is that role
changing over time?
Physical changes to the downtown may occur through new developments, re-developments and
changes to the infrastructure that will impact the attraction of parking demand to the downtown.
Potential developments are discussed and woven into the computation of future parking demands
below. At this point, these developments are limited
in details of quantity and type of use changes but
their discussion serve to form the potential
opportunities that may arise in the near and longer
term planning horizon.
Factor 2: The Dynamic between Land Use Type
and Trip Characteristic
We now turn our attention to the inherent
differences that arise among different land uses in
terms of trip characteristics, namely:–patterns of
parking demand over the course of the day, week and
season; magnitude of parking attracted per land use type and other trip characteristics that assist in
defining the parking demand.
Parking Demands by Land Use Type
While feedback from visitors and employees, and employers regarding the state of balance between the
parking demand and the parking supply is important, a solid unbiased computation needs to be
presented as well. This metric is expressed typically as the peak number of parking spaces demanded for
every 100 square metres of land use. The magnitude of the parking ratio is the result of the cumulative
effect of a number of trip characteristics, such as:
The type of land use (retail, office, restaurant, and services, etc);
Each land use may peak at different times of the day;
Each land use may peak at different days of the week;
Each land use may peak on different months of the year;
Observed work trip parking demand is impacted by:
o Compressed work week,
o Holidays,
Figure 7: Parking Demand Analysis Process - Trip Characteristics

Technical Report A - Parking Demand Analysis
DSorbara Parking & Systems Consulting
May 2016
20
o Absenteeism,
o Work from home, and those who
o Leave the work place during the day as part of the work.
Each land use may attract volume of traffic that is already parked in the area for other purposes
– in other words, there is an element of “market synergy”; and,
The effect of parking once and having multiple places to visit.
Detailed computation will be presented in the section: Current and Future Market Opportunities. Suffice
to say at this point that although the major land use categories had some empirical data to back up the
parking demand ratio used for the generation of parking demands over the study areas, some land uses
required some estimation based on previous land use type specific analysis.
Temporal Variation of Parking Demand
Makes Efficient Use of Supply
The parking characteristics of the downtown
are driven by the land use mix and the
temporal (time of day) variation in business
activity. This temporal variation forms a
rhythm of parking requirement and provides
the opportunity for parking spaces throughout
the downtown to be time-shared. For example,
morning parking demand is generated by a
number of medical and commercial offices,
personal service and coffee shops
throughout the commercial area. Within
the mid-morning to late afternoon, incoming traffic is related to the attraction of general and specialty
retail stores, financial institutions as well as the lunch time restaurants. Evening or matinee attractions
at the Avon, Studio and Tom Patterson (1800, 260 and 410 respectively) provide significant traffic to the
downtown but also provide a market for quality sit-down restaurants. The parking supply as such is
constantly used and re-used by many different clients throughout the day.
The temporal variation of parking demand by land use type is a crucial concept because people who
observe specific developments in an area of the downtown often over react to their impact on the
balance between parking demand and supply. It is important then to understand that different land
uses generate different patterns of demand over the course of the day. And often, these differing
individual patterns complement one another to make efficient use of the same parking supply. Further,
as will be developed later, these characteristically different patterns of individual parking demands,
come together to form an overall pattern of parking demand over the course of a weekday or weekend.
It is the resulting peak or set of peak points on this collective view of parking demand that becomes the
focus of comparison of parking supply to parking demand.
Figure 8: Theoretical Temporal Patterns of Parking Demand for Typical Land Uses
Technical Report A - Parking Demand Analysis
DSorbara Parking & Systems Consulting
May 2016
21
Figure 14 shows the interplay of sample land uses – each curve represents the pattern of parking
demand over the course of a typical weekday. The thicker “Cumulative” line one each chart represents
the aggregate pattern of parking demand that would be formed by these individual land uses. Thus,
while individual land uses form different patterns of parking demand -peak demand occur at different
times of the day, the cumulative overall demand pattern shows that parking space can be shared among
these different land uses.
In determining peak parking space requirements in a downtown or commercial strip setting, their
calculation is not a matter of adding individual peak parking demands, but rather to construct a model
of these individual peak parking demands over the course of a day – the peak parking space
requirements then becomes the aggregated cumulative effect of the individual land uses.4
The process also requires an iterative approach. While best practice review, empirical evidence provided
by the online surveys, and consultant’s experience are valuable inputs to the calibration of these
temporal factors, the ultimate test is to match what was observed in the field through the use of the
parking supply. The way in which the supply responds to the parking demand is the subject of the next
technical report, but presented here are the results.
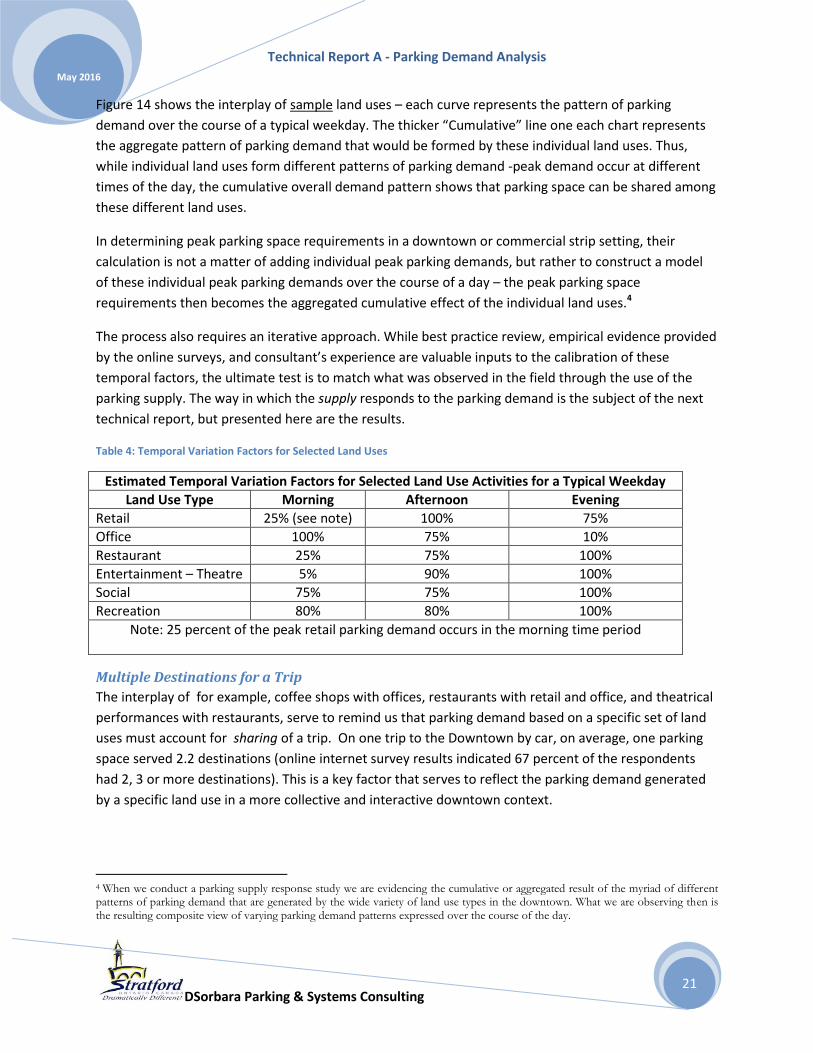
Table 4: Temporal Variation Factors for Selected Land Uses
Estimated Temporal Variation Factors for Selected Land Use Activities for a Typical Weekday
Land Use Type Morning Afternoon Evening
Retail 25% (see note) 100% 75%
Office 100% 75% 10%
Restaurant 25% 75% 100%
Entertainment – Theatre 5% 90% 100%
Social 75% 75% 100%
Recreation 80% 80% 100%
Note: 25 percent of the peak retail parking demand occurs in the morning time period
Multiple Destinations for a Trip
The interplay of for example, coffee shops with offices, restaurants with retail and office, and theatrical
performances with restaurants, serve to remind us that parking demand based on a specific set of land
uses must account for sharing of a trip. On one trip to the Downtown by car, on average, one parking
space served 2.2 destinations (online internet survey results indicated 67 percent of the respondents
had 2, 3 or more destinations). This is a key factor that serves to reflect the parking demand generated
by a specific land use in a more collective and interactive downtown context.
4 When we conduct a parking supply response study we are evidencing the cumulative or aggregated result of the myriad of different patterns of parking demand that are generated by the wide variety of land use types in the downtown. What we are observing then is the resulting composite view of varying parking demand patterns expressed over the course of the day.
Technical Report A - Parking Demand Analysis
DSorbara Parking & Systems Consulting
May 2016
22
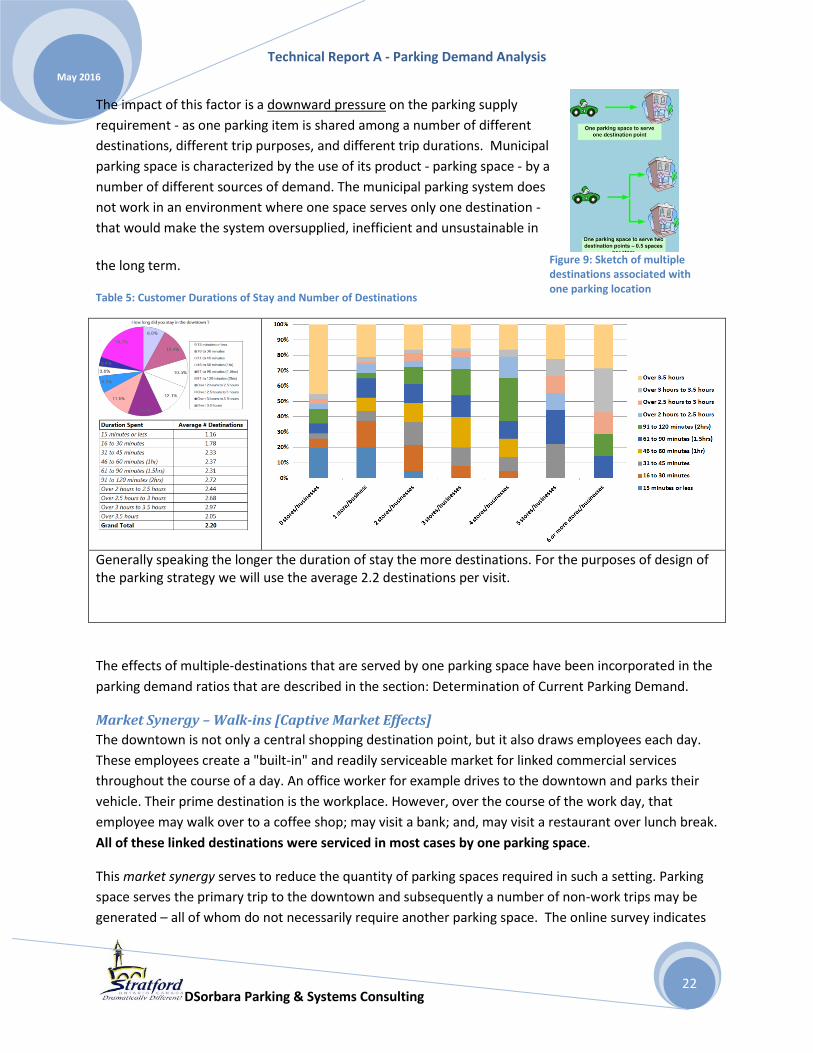
The impact of this factor is a downward pressure on the parking supply
requirement - as one parking item is shared among a number of different
destinations, different trip purposes, and different trip durations. Municipal
parking space is characterized by the use of its product - parking space - by a
number of different sources of demand. The municipal parking system does
not work in an environment where one space serves only one destination -
that would make the system oversupplied, inefficient and unsustainable in
the long term.
Table 5: Customer Durations of Stay and Number of Destinations
Generally speaking the longer the duration of stay the more destinations. For the purposes of design of the parking strategy we will use the average 2.2 destinations per visit.
The effects of multiple-destinations that are served by one parking space have been incorporated in the
parking demand ratios that are described in the section: Determination of Current Parking Demand.
Market Synergy – Walk-ins [Captive Market Effects]
The downtown is not only a central shopping destination point, but it also draws employees each day.
These employees create a "built-in" and readily serviceable market for linked commercial services
throughout the course of a day. An office worker for example drives to the downtown and parks their
vehicle. Their prime destination is the workplace. However, over the course of the work day, that
employee may walk over to a coffee shop; may visit a bank; and, may visit a restaurant over lunch break.
All of these linked destinations were serviced in most cases by one parking space.
This market synergy serves to reduce the quantity of parking spaces required in such a setting. Parking
space serves the primary trip to the downtown and subsequently a number of non-work trips may be
generated – all of whom do not necessarily require another parking space. The online survey indicates
Figure 9: Sketch of multiple destinations associated with one parking location
Technical Report A - Parking Demand Analysis
DSorbara Parking & Systems Consulting
May 2016
23
that 12 percent of the trips within the downtown start from a work place within the downtown.
Relative to other downtown studies that the consultant has reported on this level of walk-in is about
half the number.
Technical Report A - Parking Demand Analysis
DSorbara Parking & Systems Consulting
May 2016
24
The potential impacts of not finding
a convenient parking space:
Parking illegally and taking
a chance that they will not
be caught by enforcement
officers;
Choosing to park in free
un-regulated areas of the
downtown;
Choosing to park on
spaces that are offered by
business owners on site;
Choosing not to pay for
the use of parking space
that is perceived to be
inconvenient relative to
trip destination or
purpose;
Increasing the traffic in the
area due to motorists
circulating the
transportation network
looking for parking space;
Increasing the stress
related to finding that
perfect parking space;
Lowering the customer
experience with driving
downtown for other-than-
necessary trip purposes
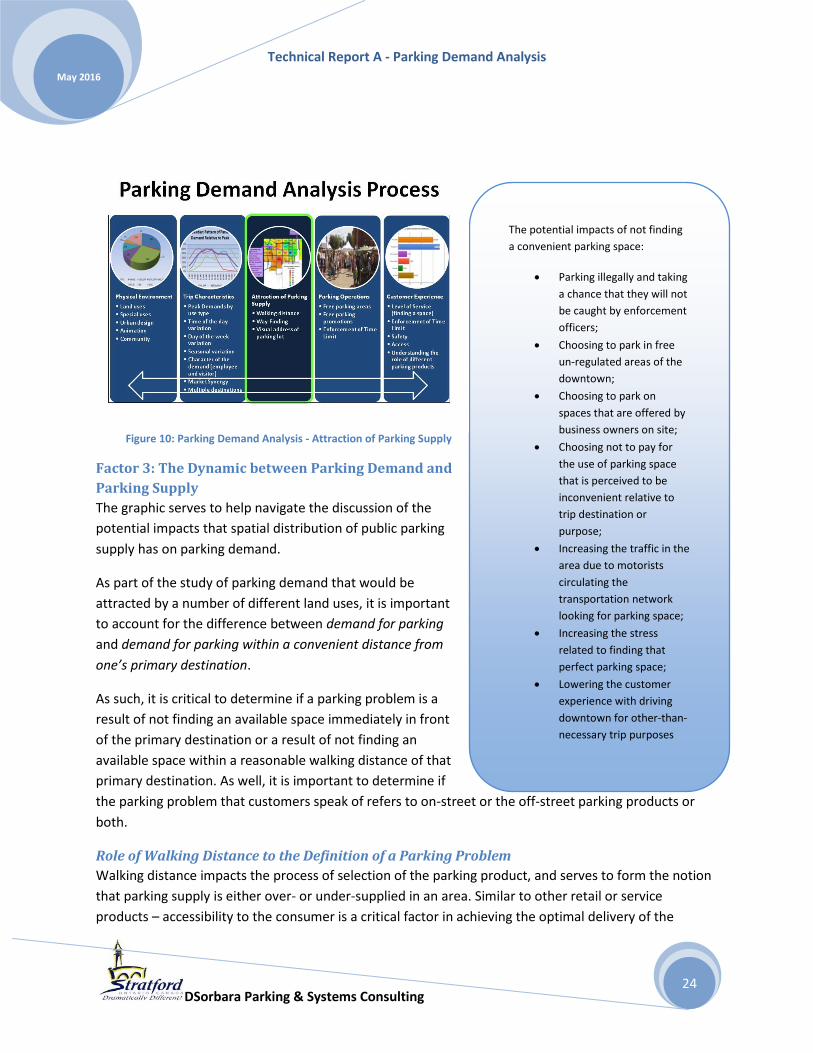
Factor 3: The Dynamic between Parking Demand and
Parking Supply
The graphic serves to help navigate the discussion of the
potential impacts that spatial distribution of public parking
supply has on parking demand.
As part of the study of parking demand that would be
attracted by a number of different land uses, it is important
to account for the difference between demand for parking
and demand for parking within a convenient distance from
one’s primary destination.
As such, it is critical to determine if a parking problem is a
result of not finding an available space immediately in front
of the primary destination or a result of not finding an
available space within a reasonable walking distance of that
primary destination. As well, it is important to determine if
the parking problem that customers speak of refers to on-street or the off-street parking products or
both.
Role of Walking Distance to the Definition of a Parking Problem
Walking distance impacts the process of selection of the parking product, and serves to form the notion
that parking supply is either over- or under-supplied in an area. Similar to other retail or service
products – accessibility to the consumer is a critical factor in achieving the optimal delivery of the
Figure 10: Parking Demand Analysis - Attraction of Parking Supply

Technical Report A - Parking Demand Analysis
DSorbara Parking & Systems Consulting
May 2016
25
service. Contemporary retail and service enterprises make use of advertisement, the Internet, and word-
of-mouth techniques to draw their consumers. Parking is no different in that it needs to respond to and
cultivate its consumers.
Parking has a significant challenge in that its response to the market demand is constrained by the
physical environment. On-street parking supply is by and large fixed capacity. Off-street parking
“franchises” may present opportunities for expansion – from surface to multi-tiered structures, but not
only at a significant cost but also is constrained by the geometry of the site. Not every surface lot can be
converted to a parking structure without serious investigation from traffic, aesthetic, economics and
operational points of view.
The act of parking a vehicle in a particular location is a synthesis of a number of customer decisions. The
process entails an investigation of:
How far are people willing to walk to and from a parking space to primary destination?
What factors influence the selection of a parking space?
Does the customer know what the municipal parking system is selling in terms of its location, its
cost, condition of sale (time restrictions, for example) and level of service (what kind of access
control, payment options, secured environment)?
From a transportation network point of view, how is the product (parking space) integrated
(street access and pedestrian connections after one parks their vehicle)? and,
How is the product (parking space) advertised to the customer – signage, pedestrian routes and
safety look and feel?
The amount of time it takes to find a parking space forms the consumer’s perception of whether or not
there is a “parking problem”. Finding an available parking space that meets the consumer’s value of time,
distance and cost serves to paint the picture of parking demand versus parking supply differently than
the situation where a consumer has to circulate the streets to find an available space. The study
provides this kind of data through the online survey tool, as well as, research conducted by the
consultant helps to assess how well the parking supply is positioned to service the demands of a number
of different market segments (customers).
Technical Report A - Parking Demand Analysis
DSorbara Parking & Systems Consulting
May 2016
26
The purpose of the trip impacts the perception of
whether or not there is a parking problem. For example if
the purpose of the trip was to make a medical
appointment, then one might be expecting to find an
available parking space immediately in front of the
medical office. On the other hand, if the trip purpose was
not site-specific or time-constrained such as a stroll,
window-shopping, having a coffee; then one would
expect that the visitor would spend more time looking for
spaces available within a larger geographic scope.
The analysis of walking distance serves to identify parking
space that is marketable to various types of customers
and as such it does impact where and what type of
parking services are in demand.
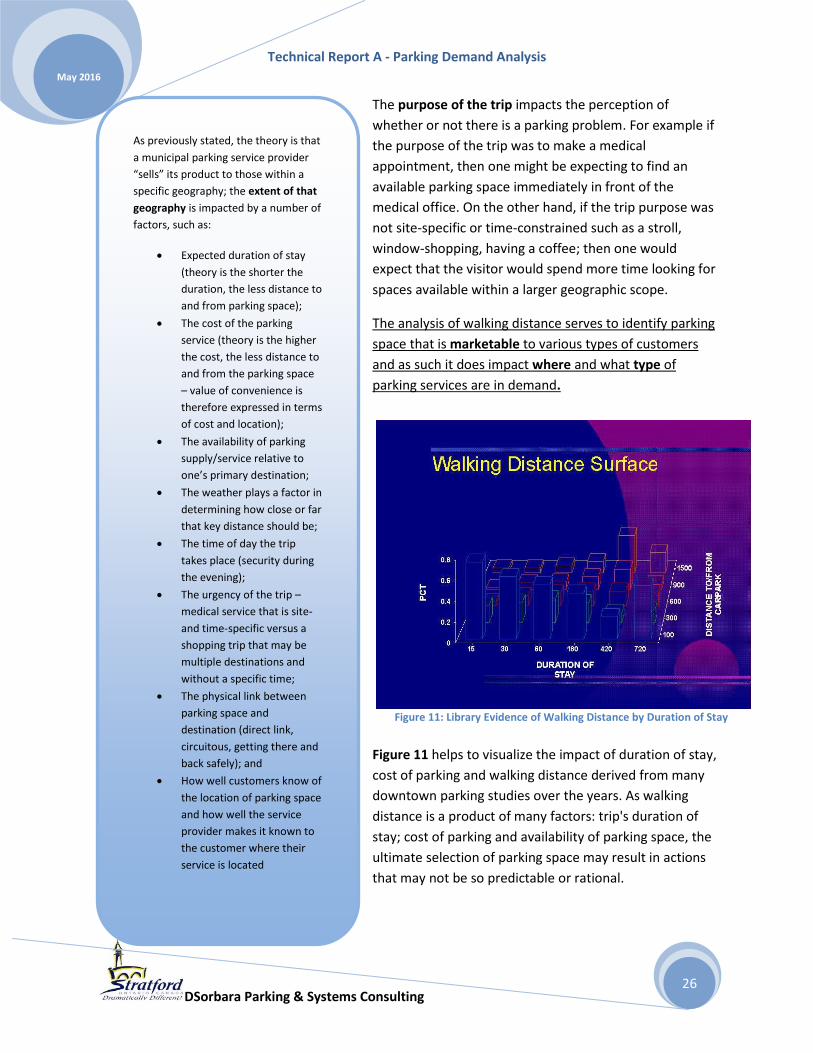
Figure 11 helps to visualize the impact of duration of stay,
cost of parking and walking distance derived from many
downtown parking studies over the years. As walking
distance is a product of many factors: trip's duration of
stay; cost of parking and availability of parking space, the
ultimate selection of parking space may result in actions
that may not be so predictable or rational.
Figure 11: Library Evidence of Walking Distance by Duration of Stay
As previously stated, the theory is that
a municipal parking service provider
“sells” its product to those within a
specific geography; the extent of that
geography is impacted by a number of
factors, such as:
Expected duration of stay
(theory is the shorter the
duration, the less distance to
and from parking space);
The cost of the parking
service (theory is the higher
the cost, the less distance to
and from the parking space
– value of convenience is
therefore expressed in terms
of cost and location);
The availability of parking
supply/service relative to
one’s primary destination;
The weather plays a factor in
determining how close or far
that key distance should be;
The time of day the trip
takes place (security during
the evening);
The urgency of the trip –
medical service that is site-
and time-specific versus a
shopping trip that may be
multiple destinations and
without a specific time;
The physical link between
parking space and
destination (direct link,
circuitous, getting there and
back safely); and
How well customers know of
the location of parking space
and how well the service
provider makes it known to
the customer where their
service is located

Technical Report A - Parking Demand Analysis
DSorbara Parking & Systems Consulting
May 2016
27
The online survey responses provided insight into the walking thresholds that currently are exhibited in
the downtown. This walking pattern will be critical in the estimation of
parking demand/parking supply response at the block level. The value of
knowing this threshold in our parking investigation is to help to determine
the market for on- and off-street parking space.
With the discussion above as a background, the results of the analysis of
walking distances, walking times and implied levels of service are
presented in the sections that follow.
The snippet to the right shows the number of online respondents who
found parking space on the block that also contained their primary
destination point. For example, 52 percent of those whose primary
destination was on block C100 found a parking space to serve that trip on
the same block.
We offer these observations:
1. Fifty-five (55) percent of respondents parked their vehicles and had their primary destinations
on the very same block.
For those who parked on a municipal off street parking facility, surveys indicated that 83
percent were able to find a space within 5 minutes, while those who parked on an on-street
parking space 63 percent were able to
do so. This is not unusual as on-street
space is clearly a preferred choice and
clearly much more restrictive in terms
of inventory. As well, 73 percent of
those survey takers who chose to park
on a private customer only parking
facility were able to find space within 5
minutes!
Figure 12: Duration of Stay versus Search Time [Off-street Users]
Technical Report A - Parking Demand Analysis
DSorbara Parking & Systems Consulting
May 2016
28
Often the perception that parking supply is deficient to the
needs of customers is based on the relative amount of
time it takes to find a vacant parking space against the
amount of time that they wish to stay in the downtown.
Figure 12 shows on average 68 percent of the survey
takers who found space within 5 minutes those who had
durations of 15 minutes or less a significant portion (83%)
found that space within 15 minutes. Closer to the average
duration of stay of customers in the downtown - just under
two hours, the average 5 minutes or less service delivery
was of the order 63 percent with a significant 25 percent
of 1:30 to 2:00 hrs duration needing 6 to 10 minutes to
find a space. So we are still able to deliver the service
within ten percent of the total time a customer wants to
spend in the downtown.
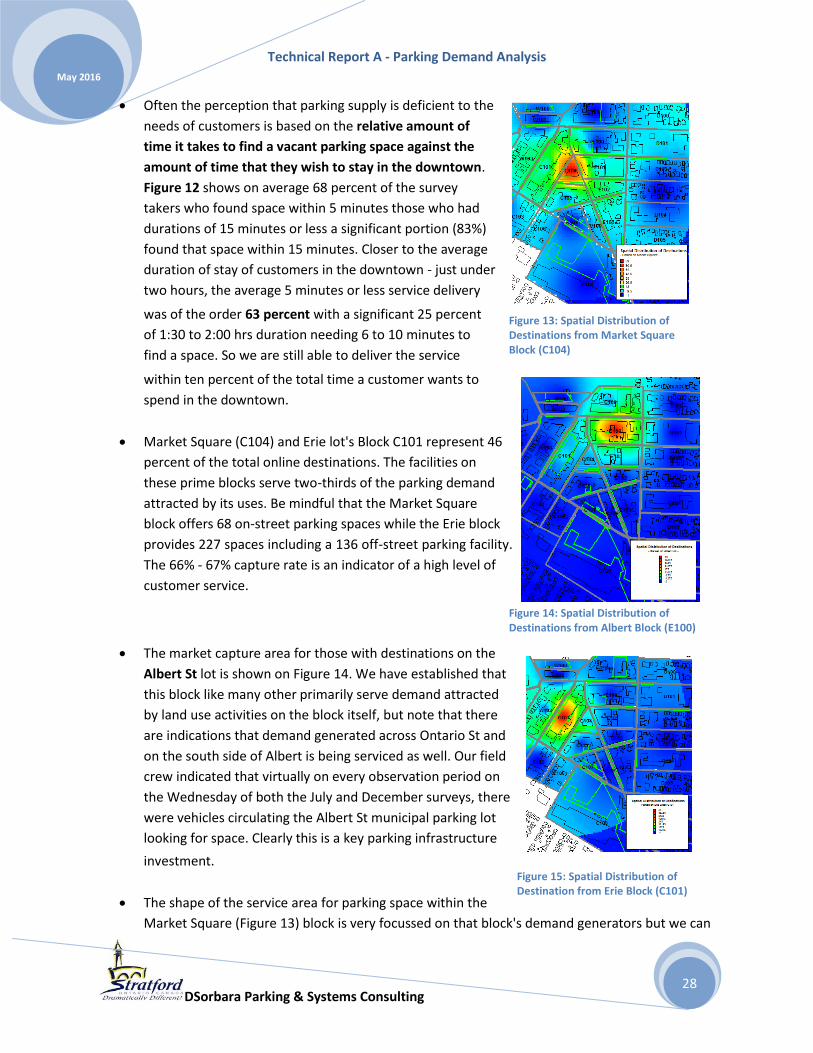
Market Square (C104) and Erie lot's Block C101 represent 46
percent of the total online destinations. The facilities on
these prime blocks serve two-thirds of the parking demand
attracted by its uses. Be mindful that the Market Square
block offers 68 on-street parking spaces while the Erie block
provides 227 spaces including a 136 off-street parking facility.
The 66% - 67% capture rate is an indicator of a high level of
customer service.
The market capture area for those with destinations on the
Albert St lot is shown on Figure 14. We have established that
this block like many other primarily serve demand attracted
by land use activities on the block itself, but note that there
are indications that demand generated across Ontario St and
on the south side of Albert is being serviced as well. Our field
crew indicated that virtually on every observation period on
the Wednesday of both the July and December surveys, there
were vehicles circulating the Albert St municipal parking lot
looking for space. Clearly this is a key parking infrastructure
investment.
The shape of the service area for parking space within the
Market Square (Figure 13) block is very focussed on that block's demand generators but we can
Figure 13: Spatial Distribution of Destinations from Market Square Block (C104)
Figure 14: Spatial Distribution of Destinations from Albert Block (E100)
Figure 15: Spatial Distribution of Destination from Erie Block (C101)
Technical Report A - Parking Demand Analysis
DSorbara Parking & Systems Consulting
May 2016
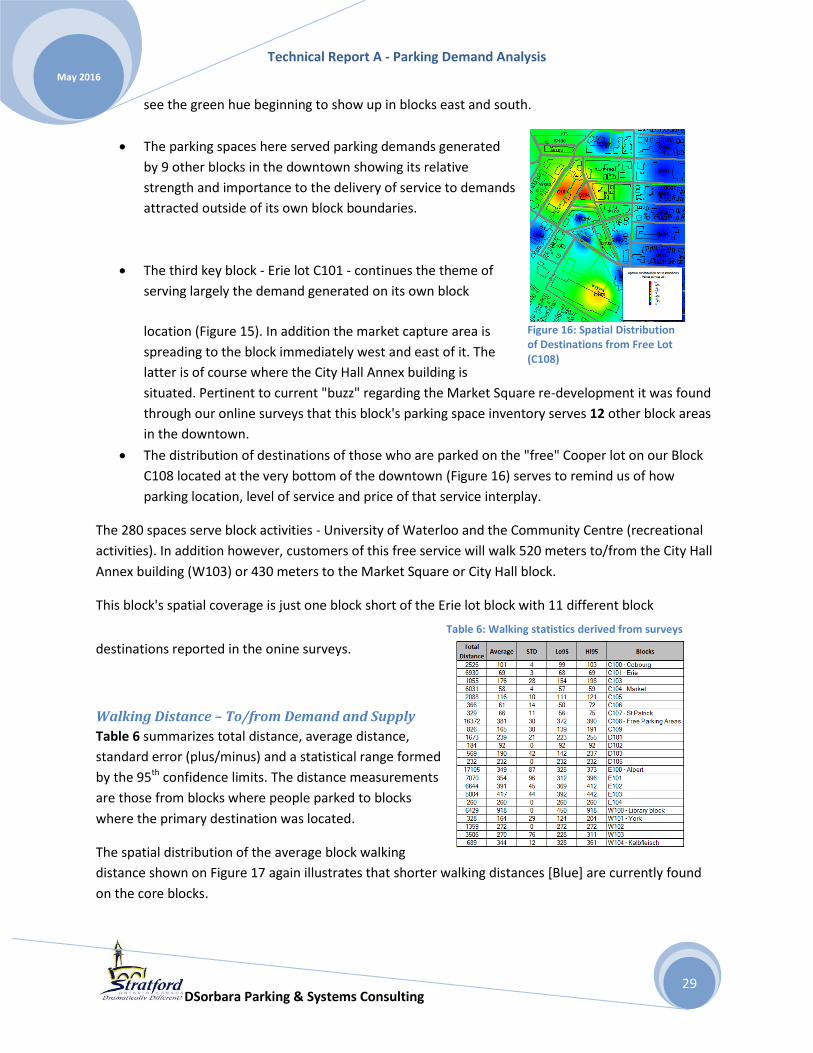
29
see the green hue beginning to show up in blocks east and south.
The parking spaces here served parking demands generated
by 9 other blocks in the downtown showing its relative
strength and importance to the delivery of service to demands
attracted outside of its own block boundaries.
The third key block - Erie lot C101 - continues the theme of
serving largely the demand generated on its own block
location (Figure 15). In addition the market capture area is
spreading to the block immediately west and east of it. The
latter is of course where the City Hall Annex building is
situated. Pertinent to current "buzz" regarding the Market Square re-development it was found
through our online surveys that this block's parking space inventory serves 12 other block areas
in the downtown.
The distribution of destinations of those who are parked on the "free" Cooper lot on our Block
C108 located at the very bottom of the downtown (Figure 16) serves to remind us of how
parking location, level of service and price of that service interplay.
The 280 spaces serve block activities - University of Waterloo and the Community Centre (recreational
activities). In addition however, customers of this free service will walk 520 meters to/from the City Hall
Annex building (W103) or 430 meters to the Market Square or City Hall block.
This block's spatial coverage is just one block short of the Erie lot block with 11 different block
destinations reported in the onine surveys.
Walking Distance – To/from Demand and Supply
Table 6 summarizes total distance, average distance,
standard error (plus/minus) and a statistical range formed
by the 95th confidence limits. The distance measurements
are those from blocks where people parked to blocks
where the primary destination was located.
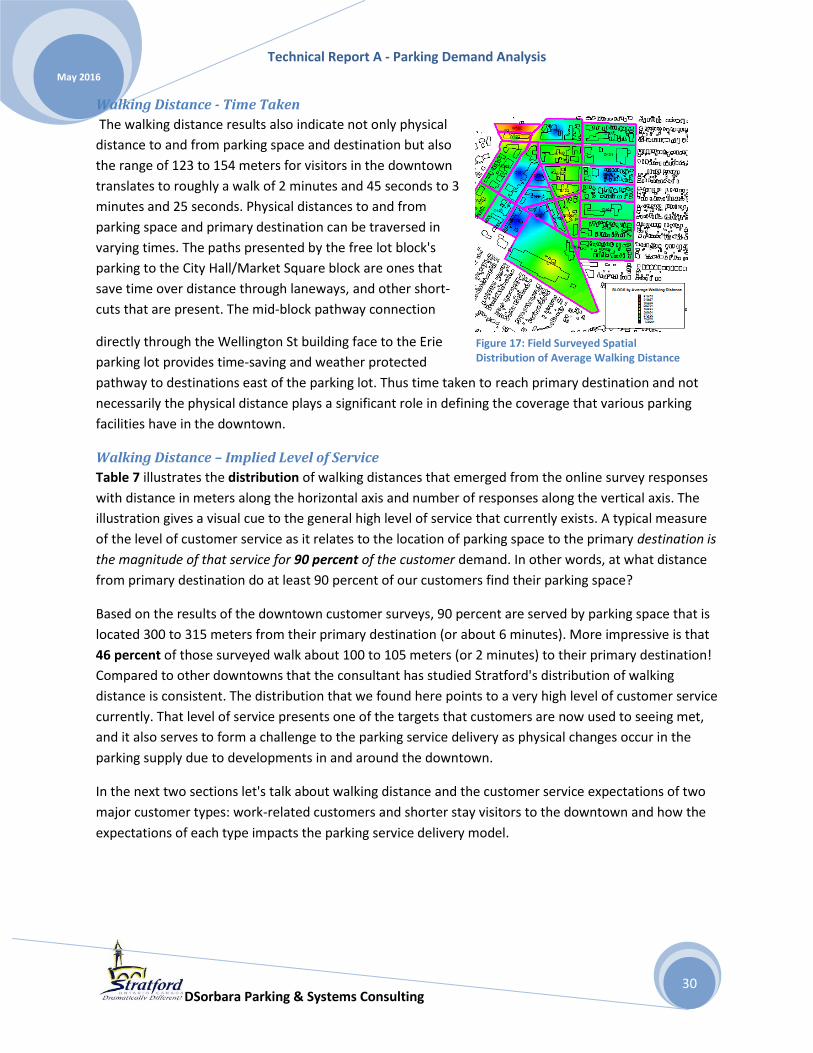
The spatial distribution of the average block walking
distance shown on Figure 17 again illustrates that shorter walking distances [Blue] are currently found
on the core blocks.
Table 6: Walking statistics derived from surveys
Figure 16: Spatial Distribution of Destinations from Free Lot (C108)
Technical Report A - Parking Demand Analysis
DSorbara Parking & Systems Consulting
May 2016
30
Walking Distance - Time Taken
The walking distance results also indicate not only physical
distance to and from parking space and destination but also
the range of 123 to 154 meters for visitors in the downtown
translates to roughly a walk of 2 minutes and 45 seconds to 3
minutes and 25 seconds. Physical distances to and from
parking space and primary destination can be traversed in
varying times. The paths presented by the free lot block's
parking to the City Hall/Market Square block are ones that
save time over distance through laneways, and other short-
cuts that are present. The mid-block pathway connection
directly through the Wellington St building face to the Erie
parking lot provides time-saving and weather protected
pathway to destinations east of the parking lot. Thus time taken to reach primary destination and not
necessarily the physical distance plays a significant role in defining the coverage that various parking
facilities have in the downtown.
Walking Distance – Implied Level of Service
Table 7 illustrates the distribution of walking distances that emerged from the online survey responses
with distance in meters along the horizontal axis and number of responses along the vertical axis. The
illustration gives a visual cue to the general high level of service that currently exists. A typical measure
of the level of customer service as it relates to the location of parking space to the primary destination is
the magnitude of that service for 90 percent of the customer demand. In other words, at what distance
from primary destination do at least 90 percent of our customers find their parking space?
Based on the results of the downtown customer surveys, 90 percent are served by parking space that is
located 300 to 315 meters from their primary destination (or about 6 minutes). More impressive is that
46 percent of those surveyed walk about 100 to 105 meters (or 2 minutes) to their primary destination!
Compared to other downtowns that the consultant has studied Stratford's distribution of walking
distance is consistent. The distribution that we found here points to a very high level of customer service
currently. That level of service presents one of the targets that customers are now used to seeing met,
and it also serves to form a challenge to the parking service delivery as physical changes occur in the
parking supply due to developments in and around the downtown.
In the next two sections let's talk about walking distance and the customer service expectations of two
major customer types: work-related customers and shorter stay visitors to the downtown and how the
expectations of each type impacts the parking service delivery model.
Figure 17: Field Surveyed Spatial Distribution of Average Walking Distance per Block

Technical Report A - Parking Demand Analysis
DSorbara Parking & Systems Consulting
May 2016
31
Table 7: Graphic Showing a Measure of the Level of Customer Service
Work Trip Market Segment
Public parking managers rely on the judicious allocation of off-street parking space to work market
segment through the sale of monthly permits. The number of permits is limited as it would be prudent
to make enough parking inventory for the service of higher volume, broader customer base short stay
visitors. In contrast to parking space that is marketed to the shorter stay – first-come first-served group,
the allocation of monthly parking permits is most often done through subscription, or a lottery approach.
As such, the designation of specific parking areas to specific employees/employers distorts the spatial
distribution. Market forces are skewed to operations - that is, only to those locations that sell permits.
Parking space for the work trip is limited – not only in physical terms, but also by the need to provide
enough of that limited inventory to meet shorter stay customer needs. Further, the temporal difference
between the two markets presents a challenge. The work market arrives earlier to the area and has first
“pick” of the parking spaces while the shoppers, visitors arrive to the area some time later. The
municipal parking system is forever trying to balance these two markets for its limited products.
The municipality is not always the sole provider of employee parking space. Depending on local zoning
requirements, urban design and planning standards, private development sites within the downtown
can also provide parking exclusively for their employees –on-site or on a collective privately operated
off-street parking facility. In terms of walking distance the factors that influence where employers and
their employees park their vehicle during the day are as follows:
Reasonable price and the acceptance that parking in the downtown has a monetary value;
Technical Report A - Parking Demand Analysis
DSorbara Parking & Systems Consulting
May 2016
32
Relationship of cost of parking and the distance to and from their destination (again the theory
is this: the consumer would balance cheaper (or in Stratford's case: free) parking rates against
longer walking distance);
Availability of private space either on-site or in a shared private off-street lot; and,
Requirement for work-related parking space very close to work place of employment is directly
related to the type of work done during the day (one may require vehicle to load and unload
goods, for example).
We recognize the challenge of finding a parking space for those workers that are either part-time
employees or have afternoon shifts. The schedule presents a challenge because they would have to
compete with transient visitors to the downtown.
Visitor Trip Market Segment
Visitors to the downtown exhibit different decision process when choosing where to park relative to
their primary destination. Firstly, in some cases, there is no primary destination as people may choose to
travel downtown to browse shops rather than specific stores. Because of this their parking decision may
be largely a result of:
How they approached the study area (from which streets);
The cost of parking; and the level of, and
Prior knowledge of where the available spaces are in the area.
Depending on their anticipated duration of stay in the downtown, convenience plays a significant role in
their decision. As addressed by the comments received from respondents, the role of the on-street
parking supply is crucial to this type of customer.
The configuration of the municipal off-street lots in the downtown features pedestrian links that
directly bring a parking customer to the core street of Wellington and Ontario streets. This is the case
with municipal lot on Erie and to a lesser extent for Cobourg and Albert.

Technical Report A - Parking Demand Analysis
DSorbara Parking & Systems Consulting
May 2016
33
Factor 4: The Dynamic between Parking Demand and Parking Operations
Figure 18 serves to focus our discussion in
this section on the potential impacts that
our public parking operations may have
on parking demand in general and the
whole customer parking experience
specifically.
Potential Impact of Free Parking
Supply on Non-commercial Areas -
Downtown
In the downtown there are few streets
that provide free parking5 and of course
the major surface lot (280 spaces) on the
southern fringe of the downtown. A
perusal of the online survey responses
however did not indicate any reflection on the possible conflict that arises when commercial activity
spills over into residential areas. This lack of concern may be an expression that there is little in the way
of impinging on residential and that supply within the commercial area manages the demand
adequately.
The use of this un-controlled6 parking supply is only managed through the enforcement of the time
restriction (72 hours in the case of the Cooper lot). Enforcement of un-controlled parking space is labour
intensive and time consuming practice. There may be an opportunity to implement the more
contemporary technique of License Plate Recognition technology to reduce the investment of time in
maintaining time restrictions.
The provision of free parking and its impact on walking distances is documented in prior sections of this
report. The walking threshold for both longer and shorter stay customers (250 and 100 meters
respectively) is completely shattered with recorded distances of 300 to 350 meters to/from that Cooper
lot. Thus the traditional relationship of duration of stay and walking distance is shattered when price of
parking is taken into account. From a parking planning point of view, if cost recovery for the parking
service is not a business requirement for the municipality, then all parking can be distributed to the
fringe areas of the downtown, producing a very different landscape in terms of service and land use.
The other potential policy action may be to begin to think about the acceptance of "re-parking" in the
downtown. This concept allows a customer to pay for parking within time restrictions as today, but to be
5 On-street areas such as Church St, Erie St south of St Patrick, Wellington St south of St Patrick, and some areas east of Waterloo St South.
6 Un-controlled as in there is no pay and display machine or meter.
Figure 18: Parking Demand Analysis - Impact of Parking Operations
Technical Report A - Parking Demand Analysis
DSorbara Parking & Systems Consulting
May 2016
34
allowed to move their vehicle to any space within the study area within that time restriction. More
simply this technique asks the customer to pay once and park anywhere within the defined commercial
area without having to pay again.
Impact on Parking Demand of Municipal Parking Promotions
Many municipalities have incentive programs that feature free parking. While it is difficult to determine
if this feature directly contributes to the decision to drive a vehicle or not, such programs show some
community spirit. Notices of such events on the pay and display machines help to create a unified event
that serves to bring the community together.
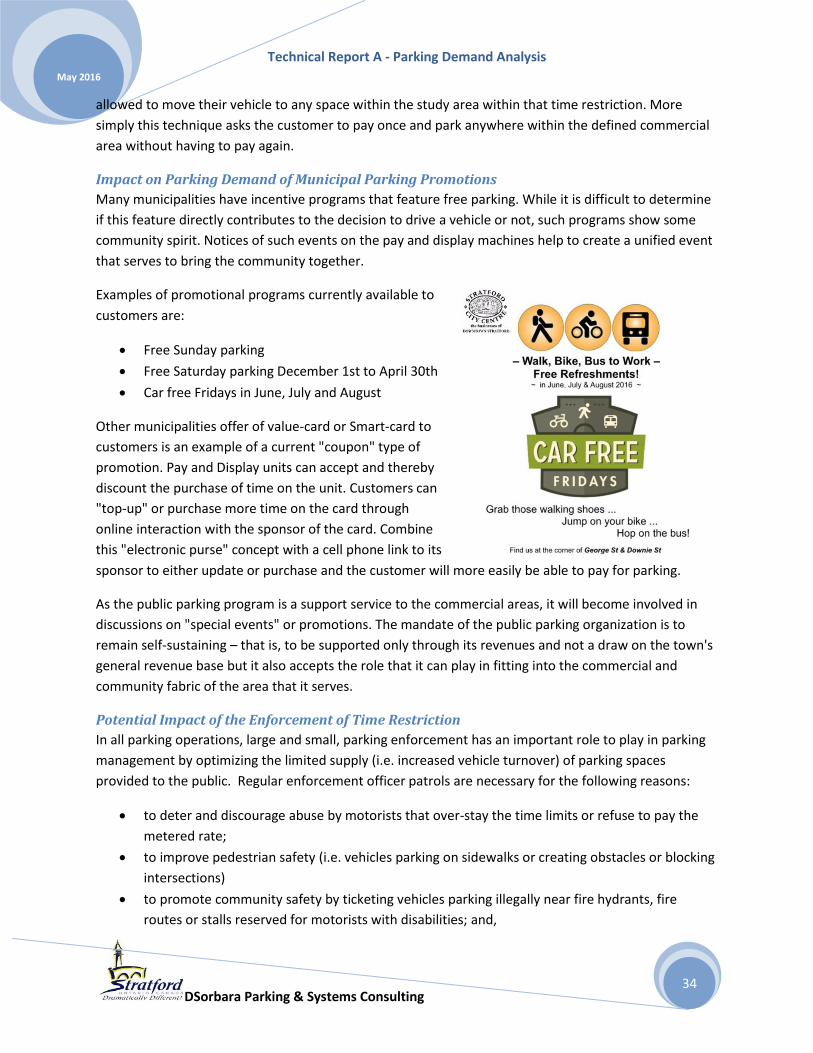
Examples of promotional programs currently available to
customers are:
Free Sunday parking
Free Saturday parking December 1st to April 30th
Car free Fridays in June, July and August
Other municipalities offer of value-card or Smart-card to
customers is an example of a current "coupon" type of
promotion. Pay and Display units can accept and thereby
discount the purchase of time on the unit. Customers can
"top-up" or purchase more time on the card through
online interaction with the sponsor of the card. Combine
this "electronic purse" concept with a cell phone link to its
sponsor to either update or purchase and the customer will more easily be able to pay for parking.
As the public parking program is a support service to the commercial areas, it will become involved in
discussions on "special events" or promotions. The mandate of the public parking organization is to
remain self-sustaining – that is, to be supported only through its revenues and not a draw on the town's
general revenue base but it also accepts the role that it can play in fitting into the commercial and
community fabric of the area that it serves.
Potential Impact of the Enforcement of Time Restriction
In all parking operations, large and small, parking enforcement has an important role to play in parking
management by optimizing the limited supply (i.e. increased vehicle turnover) of parking spaces
provided to the public. Regular enforcement officer patrols are necessary for the following reasons:
to deter and discourage abuse by motorists that over-stay the time limits or refuse to pay the
metered rate;
to improve pedestrian safety (i.e. vehicles parking on sidewalks or creating obstacles or blocking
intersections)
to promote community safety by ticketing vehicles parking illegally near fire hydrants, fire
routes or stalls reserved for motorists with disabilities; and,

Technical Report A - Parking Demand Analysis
DSorbara Parking & Systems Consulting
May 2016
35
To ensure the efficient delivery and exchange of goods and services to businesses by enforcing
loading zones.
It is recognized that parking enforcement has grown in controversy and no one likes getting parking
tickets. The public and motorists should realize that enforcement is required for their own safety and
broader benefit of the community. Public awareness programs that explain to motorists what to look
for when they park and why the various restrictions are in place will help foster improved understanding
of enforcement practices.
Table 8: Customer Responses to Online Enforcement Questions
A necessary component of parking management is the enforcement of parking regulations, particularly
as they relate to the restriction of time spent on parking spaces. Certain types of parking space are
obviously more attractive than others for one hour parkers, two hours or more parkers and all-day
employee parkers and so on. Clearly, on street space is critical to the service of the very short stay
customer parking market. This space is convenient and self-advertising. Since a significant proportion of
people visiting are of the short stay type, such spaces need to turn over at a rapid rate to provide a high
probability of servicing that market.7
Multi-space pay and display units and/or single metered space controls the duration of use through the
concept of maximum amount of time one can purchase. Enforcement of on-street space in the
downtown commercial areas provides the necessary mechanism to ensure that convenient and self-
advertising on-street parking space presents opportunity for a number of different customers. Over use
of time-restricted on-street space impacts the volume of traffic on residential and side streets by those
customers who are forced to circulate to find available parking space. Herein is the challenge to the
parking program: market the role of the off-street parking resource as an attraction to longer stay
customers' needs through its advertisement and priced in order to draw customers to it.
7 On street parking plays a role in slowing down traffic and providing a buffer between pedestrians on a sidewalk and vehicles on the street.
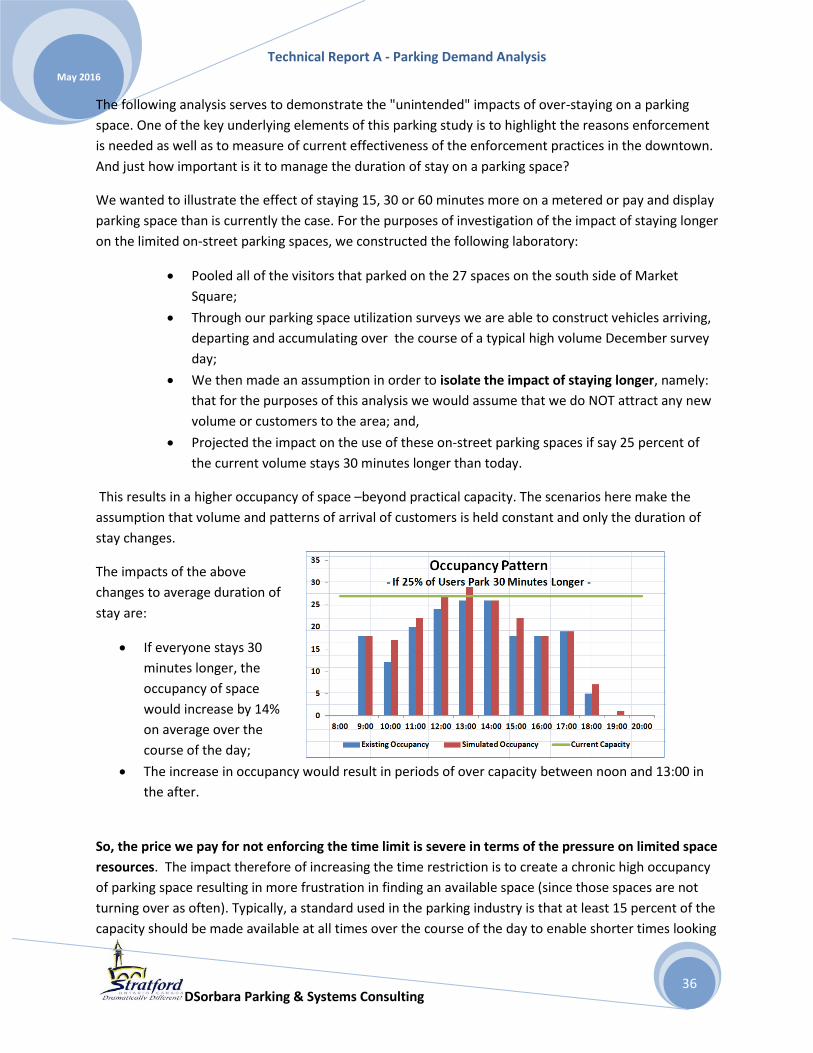
Technical Report A - Parking Demand Analysis
DSorbara Parking & Systems Consulting
May 2016
36
The following analysis serves to demonstrate the "unintended" impacts of over-staying on a parking
space. One of the key underlying elements of this parking study is to highlight the reasons enforcement
is needed as well as to measure of current effectiveness of the enforcement practices in the downtown.
And just how important is it to manage the duration of stay on a parking space?
We wanted to illustrate the effect of staying 15, 30 or 60 minutes more on a metered or pay and display
parking space than is currently the case. For the purposes of investigation of the impact of staying longer
on the limited on-street parking spaces, we constructed the following laboratory:
Pooled all of the visitors that parked on the 27 spaces on the south side of Market
Square;
Through our parking space utilization surveys we are able to construct vehicles arriving,
departing and accumulating over the course of a typical high volume December survey
day;
We then made an assumption in order to isolate the impact of staying longer, namely:
that for the purposes of this analysis we would assume that we do NOT attract any new
volume or customers to the area; and,
Projected the impact on the use of these on-street parking spaces if say 25 percent of
the current volume stays 30 minutes longer than today.
This results in a higher occupancy of space –beyond practical capacity. The scenarios here make the
assumption that volume and patterns of arrival of customers is held constant and only the duration of
stay changes.
The impacts of the above
changes to average duration of
stay are:
If everyone stays 30
minutes longer, the
occupancy of space
would increase by 14%
on average over the
course of the day;
The increase in occupancy would result in periods of over capacity between noon and 13:00 in
the after.
So, the price we pay for not enforcing the time limit is severe in terms of the pressure on limited space
resources. The impact therefore of increasing the time restriction is to create a chronic high occupancy
of parking space resulting in more frustration in finding an available space (since those spaces are not
turning over as often). Typically, a standard used in the parking industry is that at least 15 percent of the
capacity should be made available at all times over the course of the day to enable shorter times looking

Technical Report A - Parking Demand Analysis
DSorbara Parking & Systems Consulting
May 2016
37
for available parking space. The longer people stay on this critical on-street parking resource, the greater
the difficulty in making space available to others.
Another industry standard is that to maintain this 15 percent of capacity available, the pricing
mechanism is applied. Typically, when occupancy reaches and exceeds 85 percent of capacity, parking
operators raise the parking rates to push customers to the off-street parking facilities thereby freeing up
spaces for the shorter stay, higher turnover business customers.
This is not to say that staying in the downtown is not a good idea, but underscores that critical and very
time sensitive on-street parking space should remain for very short stay visitors. It is the expressed role
of the off-street parking product to serve the longer stay customer.
Factor 5: The Customer Experience
This section serves to provide valuable
information regarding customer
experience with public parking in the
downtown. As was the case with the
other four factors the graphic below
serves to provide the map for the
analysis.
The results of online survey form the
core of the discussion that follows. A
copy of the online questionnaire is
shown in Appendix A – Online Survey 2016. The public was engaged and definitely interested in parking
(over 500 responses), as exhibited by the many thoughtful comments received. The fact that people not
only answered the questions, but took the time to provide extensive commentary, shows a community
that is concerned about the parking services provided by their municipality.
Customer Profile
Flowing from the surveys, the downtown attracts this typical customer:
1. Eight-three percent of our responses were from customers who visited the downtown on a
weekday.
2. Thirty-seven percent of our responses were from customers who visited the downtown in the
morning (8 am to 11 am).
3. Thirty percent of our responses were from customers who are in the downtown for work-
related or business meeting purposes.
4. Seventy-seven percent came to the downtown from their place of residence.
5. Eighty-three percent came by car or truck, with a significant 12.5% who walked from their
residence.
6. Sixty-five percent of those who drove to the downtown parked on-street, and 23% in a
municipal off-street facility.
Figure 19: Parking Demand Analysis - Impact of Customer Experience

Technical Report A - Parking Demand Analysis
DSorbara Parking & Systems Consulting
May 2016
38
Trip Destinations and Time Spent in the Downtown
7. On average each visitor had 2.2
destination points in the downtown on
their trip.
8. Top draws for visitor's primary
destination are shown in red on the
snippet table to the right.
9. Pulling out just those who drove their
vehicles and had indicated that either
dining, shopping or entertainment was
their primary trip purpose, the average
duration of stay is 1:53 hr.
10. Generally speaking the longer the
duration of stay the more destinations.
11. About 32% of respondents stay for more than two hours. The duration of stay category – 1 to
1.5 hours – serves the broadest range of stores visited.
Customer Use of Different Parking Products
12. Parking Space Choice and parking space type by customer duration of stay is shown in the
graphics below. Note the wide coverage of durations that the on-street service. The private
customer lots (free of charge) also provide that same wide range of customer durations. The
municipal off-street facilities seem to be more attractive to not only less numbers of customers
but also those with longer durations of stay.

Technical Report A - Parking Demand Analysis
DSorbara Parking & Systems Consulting
May 2016
39
13. Looking at the parking type choice from another perspective. The on-street parking space here
in the downtown has a very wide customer stay market range. The off-street space is continuing
to attract customers with slightly longer durations of stay, but in most of the other durations of
stay categories on-street space provides a very high level of service.
We are now prepared to define current and future emerging parking market opportunities armed with
the analysis of five parking demand factors:
The physical environment (land uses)
The trip characteristics(duration of stay, choice of parking space type, time of arrival/departure)
The attraction of parking demand (walking distances)
The effect of parking operations on parking demand (pay or free), and
Customer experience with the parking service.

Technical Report A - Parking Demand Analysis
DSorbara Parking & Systems Consulting
May 2016
40
Evaluation of Current Parking Demand and Supply Having built a body of evidence to assist in characterizing current parking demand attracted by the
quantity and type of land uses in the downtown, this section quantifies the volume of parking demand,
distributes that demand to the various blocks in the downtown and then evaluates the balance between
that demand to the supply on those blocks. The outcomes from this task feed into the Market Potential
Identification which is the subject of the next major chapter of this report.
Overview of Methodology Against a back drop of calibration of parking supply usage observed in the field against customer trip
characteristics and a library of downtown
studies, the following five steps were
followed in order to provide a framework
for the discussion of where new service
areas might emerge in Stratford.
1. Compute the peak hour parking
demand attracted by the quantity and type
of land use found in the downtown. These
demand ratios make use of a number of
factors as shown on Figure 20. The outcome
of this process is a set of block specific
quantities of long stay (employee) and
shorter stay (visitor) parking demand.
2. Spatially distribute that parking
demand to the blocks in the downtown by
applying the peak hour ratios computed in
step 1 to land use quantities in each block
3. Compare the block distributed
parking demands (step 2) to the block
parking supply.
4. Refine the capture of parking
demand by introducing walking distance.
Figure 21 illustrates this key step.
5. Through the understanding of
current parking supply, and the current
walking distance profile of both customers and workers, optimize where parking supply should
be located with respect to its demand.
Figure 20: Generate Peak Hour Demand Ratios and Apply to Block Land Uses
Figure 21: Distribute Block Parking Demands to Block Supply by Walking Distance

Technical Report A - Parking Demand Analysis
DSorbara Parking & Systems Consulting
May 2016
41
Based on parking
demand surveys, and
research from other
studies, here are some
of the values for each
of these factors that
impact parking
demand ratios for
employee:
DENSITY – ranges
from 1 to 4.2
employees per 1000
square feet depending
on land use type
AUTO DRIVERS –
average across land
use types is about 80
to 85 percent drivers
DAYTIME DEMAND –
ranges from 70 to 100
percent
ABSENTEEISM/OFF
SITE – ranges from 5
to 7 percent of the
total employed
Step 1: Calculate Peak Hour Parking Demand The computation of peak hour parking demands in the downtown is a
result of the following:
Peak hour demand for parking attracted by workers taking note
of the effects of:
o absenteeism;
o density (floor space per employee);
o mode of travel;
o vehicle occupancy, and estimates of the number of
employees present at peak hours of the day; and
Peak hour demand for visitors taking note of the effects of:
o multi-destinations,
o market synergy,
o Effect of temporal variation in the demand profile.
The computed peak hour parking ratios are adjusted to reflect a number
of land use characteristics such as:
different land uses peak at different times of the day;
different land uses peak on different days of the week;
different land uses exhibit seasonal variation in their peak
demand; and
The amount of walk-in trips (that is, trips that originate from
people already working in each study area.
Employee and Visitor Peak Hour Parking Demand Ratios
The peak hour demands attracted by employee trips to the downtown shown on Figure 22 are based on
the evidence:
the results of the parking demand surveys (online);
travel characteristics as described in the text box on previous page;
the process of calibrating what was observed in the field (through parking activity surveys) and
the computed peak hour demands generated in this section; and,
What theoretically should be attracted by the quantity and type of land use based on industry
standards and consulting experience for comparable study areas.
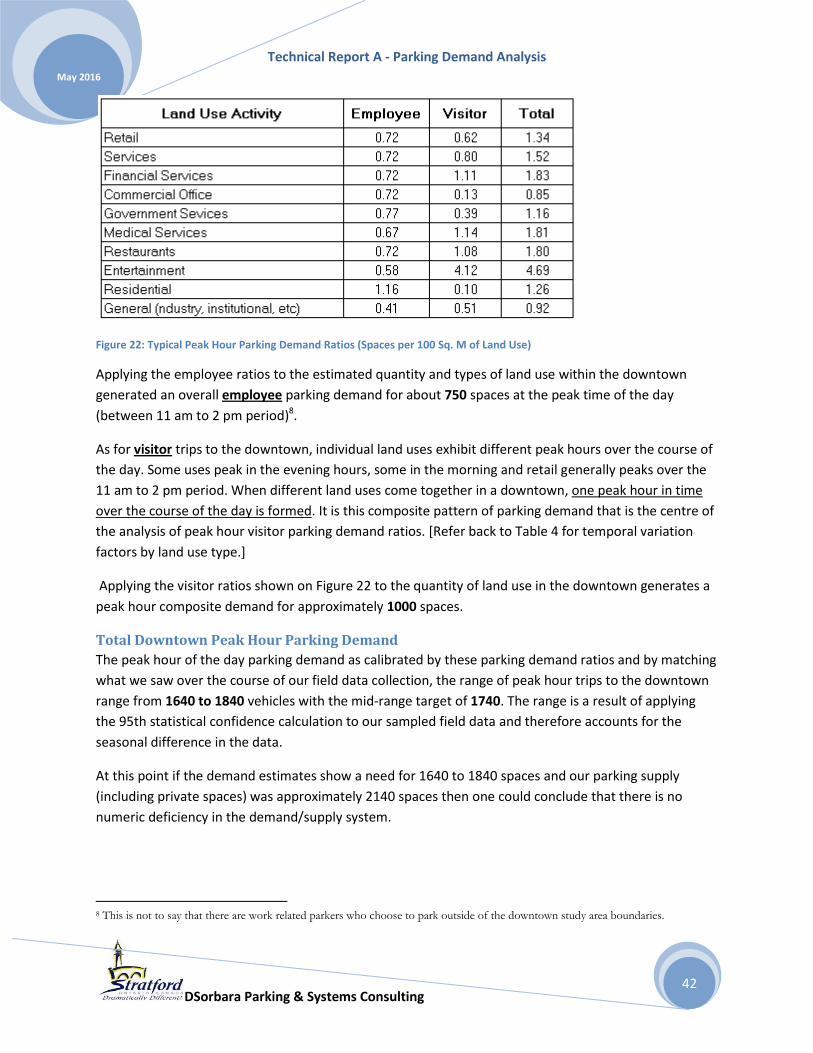
Technical Report A - Parking Demand Analysis
DSorbara Parking & Systems Consulting
May 2016
42
Figure 22: Typical Peak Hour Parking Demand Ratios (Spaces per 100 Sq. M of Land Use)
Applying the employee ratios to the estimated quantity and types of land use within the downtown
generated an overall employee parking demand for about 750 spaces at the peak time of the day
(between 11 am to 2 pm period)8.
As for visitor trips to the downtown, individual land uses exhibit different peak hours over the course of
the day. Some uses peak in the evening hours, some in the morning and retail generally peaks over the
11 am to 2 pm period. When different land uses come together in a downtown, one peak hour in time
over the course of the day is formed. It is this composite pattern of parking demand that is the centre of
the analysis of peak hour visitor parking demand ratios. [Refer back to Table 4 for temporal variation
factors by land use type.]
Applying the visitor ratios shown on Figure 22 to the quantity of land use in the downtown generates a
peak hour composite demand for approximately 1000 spaces.
Total Downtown Peak Hour Parking Demand
The peak hour of the day parking demand as calibrated by these parking demand ratios and by matching
what we saw over the course of our field data collection, the range of peak hour trips to the downtown
range from 1640 to 1840 vehicles with the mid-range target of 1740. The range is a result of applying
the 95th statistical confidence calculation to our sampled field data and therefore accounts for the
seasonal difference in the data.
At this point if the demand estimates show a need for 1640 to 1840 spaces and our parking supply
(including private spaces) was approximately 2140 spaces then one could conclude that there is no
numeric deficiency in the demand/supply system.
8 This is not to say that there are work related parkers who choose to park outside of the downtown study area boundaries.

Technical Report A - Parking Demand Analysis
DSorbara Parking & Systems Consulting
May 2016
43
However, the numerical comparison of parking supply to
demand over the landscape of a study area is counter to the
dynamic characteristic of parking demand and supply. That
dynamic is that people walk form one block’s parking supply to
another block’s destination point. The fluid nature then makes
this overall peak use of space discussion useful only in that it
provides a ready-made, easy to understand metric that gives
an overall indication of the balance of parking demand and its
supply.
The next steps will provide more of a market approach to the
service of block parking demand by parking supply that is
within comfortable walking distance. But before we can do
that let us generate peak hour parking demand by block by
building on the results here.
Step 2: Compute Block Level Peak Hour
Demands Figure 23 displays the product of multiplying peak hour work
ratios by land use quantity (by type of use) for each block in
the study area. The yellow to red colour represents relatively
higher number of longer stay customers.
Figure 24 displays the product of multiplying peak hour visitor
ratios by land use quantity (by type of use) for each block in
the study area. The yellow to red colour represents relatively
higher number of block visitor parking demand.
Finally Figure 25 displays the sum of long and short stay
demand by block.
Analysis of Spatial Patterns of Demand
Step 2 results show only the product of peak parking ratios
and quantity of land use. That product to repeat is the peak
hour parking demand attracted by land uses on that block.
The current parking supply on each block does not come into
play at this point of the process – we are simply determining
the extent and distribution of trips.
The result highlights are summarized here:
Solid demand for long and short parking east of
Downie north of George and well as an intense
Figure 23: Work Parking Demand by Block
Figure 24: Visitor Parking Demand by Block
Figure 25: Total Parking Demand by Block
Technical Report A - Parking Demand Analysis
DSorbara Parking & Systems Consulting
May 2016
44
demand generated by uses just west of Wellington north of St Patrick;
Longer stay parking demand focus points are: west of Erie Street (annex City Hall), central
corridor blocks formed by Brunswick and Ontario on the south and north and by Waterloo /
Downie on the east and west;
Short stay parking demand distribution opens up two new blocks: E100 (Ontario /Waterloo/
Albert and Downie) and C108 where the Cooper site is located;
Major generators of longer stay parking demand are: public services as the courts, city hall
and a pocket of personal service professional offices; and
Major generators of shorter stay visitor parking demand are: theatre, retail and restaurants
along Ontario corridor as well as Downie and Waterloo.
The next step is to explore the deficits/surpluses that occur when the parking demand attracted by each
block is compared to the parking supply on each block.
Step 3: Compare Block Parking Demands to Block Parking Supply Two figures in this section illustrate the result of comparing block parking demand (long and short stay
customer demand) to block parking supply (long and short stay customer supply). In this way, areas in
the downtown where parking supply compared to block demands are in deficit (demand is greater than
supply).
Figure 26 is an illustration of the numeric comparison of parking demand and parking supply for our
longer stay customers. Red or lighter colours represent numeric surplus when block supply is greater
than computed demand.
Figure 27 is an illustration of the numeric comparison of parking demand and parking supply for our
shorter stay customers. Blue or darker colours represent numeric deficits when block supply is lower
than computed demand.
Both figures show the numeric surplus or deficiency of parking space would be if all demand generated
on a block was to be serviced by supply on that block - in other words under a condition that no
customer would walk from supply on Block A to their destination on Block B.

Technical Report A - Parking Demand Analysis
DSorbara Parking & Systems Consulting
May 2016
45
Figure 26: Info graphic Showing Comparison of Block Demand to Block Supply - Long Stay Demand

Technical Report A - Parking Demand Analysis
DSorbara Parking & Systems Consulting
May 2016
46
Figure 27: Info graphic Showing Comparison of Block Demand to Block Supply - Short Stay Demand

Technical Report A - Parking Demand Analysis
DSorbara Parking & Systems Consulting
May 2016
47
Analysis of Current Balance of Parking Demands and Parking Supply
The salient findings of the analysis of the balance between current demand and supply are annotated on
info graphic Figure 28.
Figure 28: Info graphic Showing Analysis of Current Demand to Supply Balance
The E-corridor and W-corridor show numerical deficits where parking demand is greater than the
parking supply. Specifically E-corridor formed by four blocks bounded by Ontario / Waterloo / St Patrick
and Downie does not have enough parking supply on the blocks to provide the highest level of customer
service. Looking at the table within Figure 28 shows us that every block within the E corridor show
demand greater than supply without exception. However, the supply found on the blocks that form the
C corridor are clearly within easy walking distance of that demand.
The W-corridor on the west side of our downtown study area also shows numerical deficit for longer
stay parking demand. As described in the land use sections of this report, the W-corridor has a number
Technical Report A - Parking Demand Analysis
DSorbara Parking & Systems Consulting
May 2016
48
of public institutions that draw higher number of employees. The Court, the Library and a number of
financial offices draw employees and visitors alike.
If the business objective then was to provide the highest possible level of customer service - where block
demand is served by block supply - then the deficits shown on Figure 28 would provide block level
targets. The reality is that:
1. The physical opportunity to provide a parking space on each block is limited.
2. The cost of provision of parking supply on each block to service estimated block parking demand is
prohibitive, and would require a program of property acquisition or a series of joint partnerships with
current and future property owners.
3. And finally, this business target does not reflect the dynamic nature of where people park and where
their primary destination is located. The Parking Management Strategy for the downtown needs to
embrace quality of service, innovation of service delivery to the customer, and sustainability (economic
and within the family of transportation strategies).
The next step provides a way in which we incorporate the dynamic nature of parking demand and
current supply in order to formulate a parking strategy that fulfills the aforementioned strategic ideals.
Step 4: Apply Walking Distance Characteristics to Parking Demand In the previous section, the number of block-level trips was estimated using the peak hour attraction
ratios. Now we distribute those block-level demands to blocks within walking distance. This dynamic
provides some fluidity to the parking demand and where the parking supply can be located to service
that demand. The geographic distribution of the parking demands attracted by long and shorter stay
visitor trips uncover areas where parking supply needs to be in proximity in order to more effectively
service those demands.
The outcomes of this step build on these processes:
Distribute the quantity of peak hour trips expected on each block given its profile of land use
types [Demand] to surrounding blocks according to observed walking distances for long and
short stay trips to the downtown;
Compare this distribution of demand to the parking supply on each block in the downtown; and
Determine where parking supply or its operation type might change in order to respond to the
distributed parking demand [Potential].

Technical Report A - Parking Demand Analysis
DSorbara Parking & Systems Consulting
May 2016
49
Distribution of Block Level Trips Applying Walking Distance
The three figures in this section illustrate the distribution of the individual block parking demand to
blocks within observed walking distances to and from parking space and primary destination.
Figures 29 (Long stay or work trips), 30 (Short stay or visitor trips) and 31 (total long and short stay trips)
were examined and the following salient findings drive the direction of our parking management
strategy:
Based on its location - central to parking demand and within the local characteristic walking
distance - Block E101 is in position to serve significant portion of shorter stay parking demand.
This block is bounded by Albert / Waterloo / Brunswick and Downie streets.
Block W103 - west of the Erie lot block - also is strategic to serve both long and short stay
parking demand.
The triangle formed by Blocks C108, Block E101 and Block W103 is in strategic position to
provide parking service when walking distances are taken into account.
A cautionary note is that the significant draw that Block C108 (Cooper site) shows is a result of a
walking distance profile that results from a somewhat distorted market coverage; this block
presents parking service at no charge; this operation characteristic lengthens the walking
distance threshold for both long and short stay trip types;
What we have not done is examined the current parking supply on these key areas to see if there is a
deficiency or an opportunity to raise the level of customer service.

Technical Report A - Parking Demand Analysis
DSorbara Parking & Systems Consulting
May 2016
50
Figure 29: Long Stay (Work) Parking Demand Applying Walking Distance
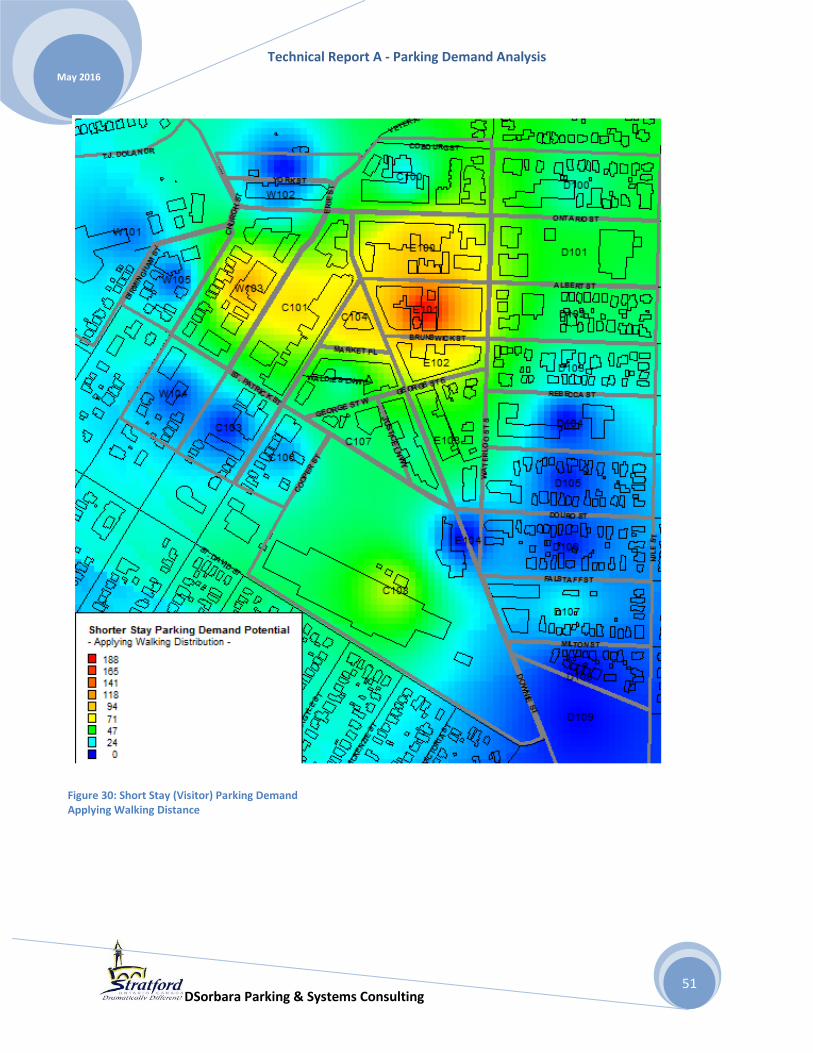
Technical Report A - Parking Demand Analysis
DSorbara Parking & Systems Consulting
May 2016
51
Figure 30: Short Stay (Visitor) Parking Demand Applying Walking Distance

Technical Report A - Parking Demand Analysis
DSorbara Parking & Systems Consulting
May 2016
52
Figure 31: Total Parking Demand Applying Walking Distance
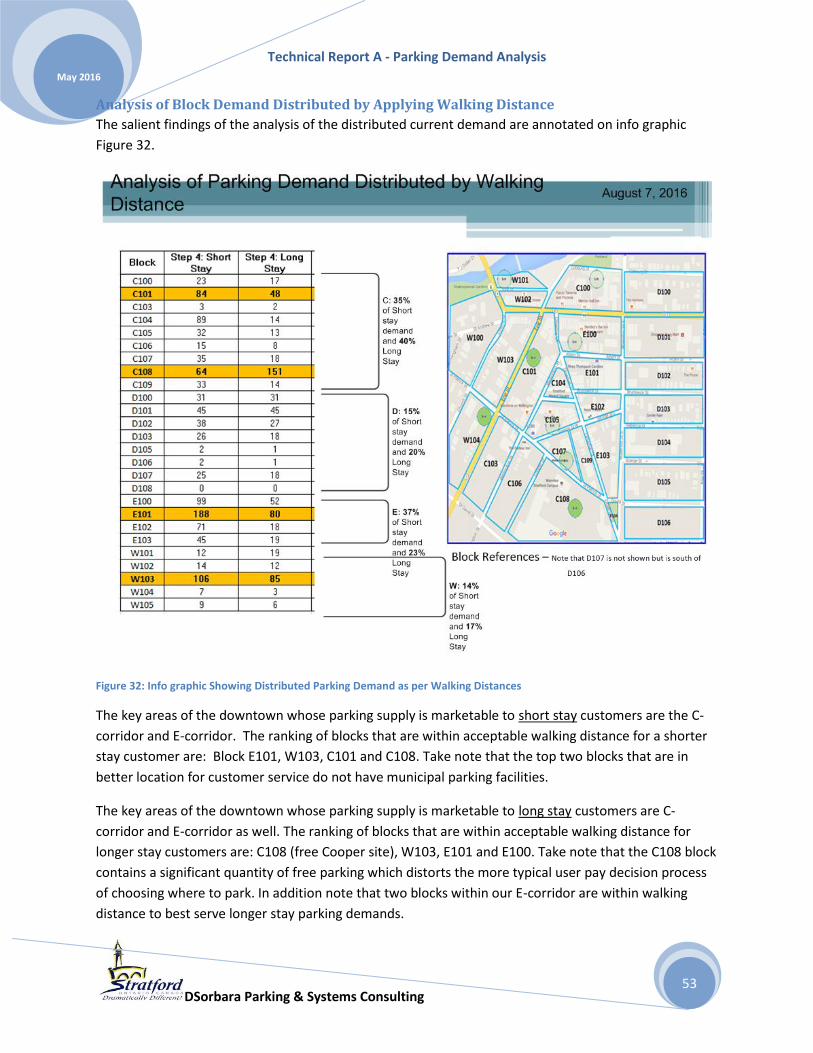
Technical Report A - Parking Demand Analysis
DSorbara Parking & Systems Consulting
May 2016
53
Analysis of Block Demand Distributed by Applying Walking Distance
The salient findings of the analysis of the distributed current demand are annotated on info graphic
Figure 32.
Figure 32: Info graphic Showing Distributed Parking Demand as per Walking Distances
The key areas of the downtown whose parking supply is marketable to short stay customers are the C-
corridor and E-corridor. The ranking of blocks that are within acceptable walking distance for a shorter
stay customer are: Block E101, W103, C101 and C108. Take note that the top two blocks that are in
better location for customer service do not have municipal parking facilities.
The key areas of the downtown whose parking supply is marketable to long stay customers are C-
corridor and E-corridor as well. The ranking of blocks that are within acceptable walking distance for
longer stay customers are: C108 (free Cooper site), W103, E101 and E100. Take note that the C108 block
contains a significant quantity of free parking which distorts the more typical user pay decision process
of choosing where to park. In addition note that two blocks within our E-corridor are within walking
distance to best serve longer stay parking demands.
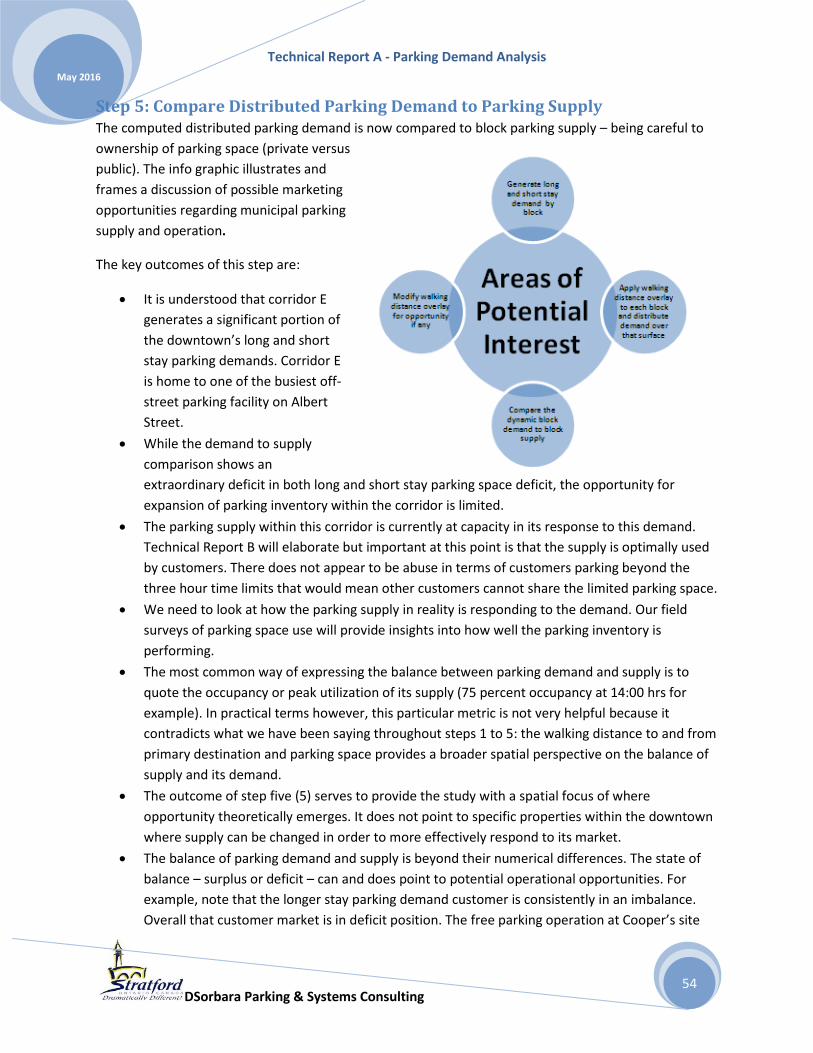
Technical Report A - Parking Demand Analysis
DSorbara Parking & Systems Consulting
May 2016
54
Step 5: Compare Distributed Parking Demand to Parking Supply The computed distributed parking demand is now compared to block parking supply – being careful to
ownership of parking space (private versus
public). The info graphic illustrates and
frames a discussion of possible marketing
opportunities regarding municipal parking
supply and operation.
The key outcomes of this step are:
It is understood that corridor E
generates a significant portion of
the downtown’s long and short
stay parking demands. Corridor E
is home to one of the busiest off-
street parking facility on Albert
Street.
While the demand to supply
comparison shows an
extraordinary deficit in both long and short stay parking space deficit, the opportunity for
expansion of parking inventory within the corridor is limited.
The parking supply within this corridor is currently at capacity in its response to this demand.
Technical Report B will elaborate but important at this point is that the supply is optimally used
by customers. There does not appear to be abuse in terms of customers parking beyond the
three hour time limits that would mean other customers cannot share the limited parking space.
We need to look at how the parking supply in reality is responding to the demand. Our field
surveys of parking space use will provide insights into how well the parking inventory is
performing.
The most common way of expressing the balance between parking demand and supply is to
quote the occupancy or peak utilization of its supply (75 percent occupancy at 14:00 hrs for
example). In practical terms however, this particular metric is not very helpful because it
contradicts what we have been saying throughout steps 1 to 5: the walking distance to and from
primary destination and parking space provides a broader spatial perspective on the balance of
supply and its demand.
The outcome of step five (5) serves to provide the study with a spatial focus of where
opportunity theoretically emerges. It does not point to specific properties within the downtown
where supply can be changed in order to more effectively respond to its market.
The balance of parking demand and supply is beyond their numerical differences. The state of
balance – surplus or deficit – can and does point to potential operational opportunities. For
example, note that the longer stay parking demand customer is consistently in an imbalance.
Overall that customer market is in deficit position. The free parking operation at Cooper’s site
Technical Report A - Parking Demand Analysis
DSorbara Parking & Systems Consulting
May 2016
55
however demonstrates how the parking management strategy can manipulate the parking
space choice decision by selling its service free of user charges. This operational characteristic
serves to manipulate customers' acceptance of longer walking distance by off-setting its cost to
the customer.
Building on the walking distance and the impact of operational characteristic, the outcome of
steps 1 to 5 point to the need to measure how stable the parking space inventory is over the
short and longer term planning horizon.
The next section tests the balance between parking demand and supply under scenarios of change in
that parking supply infrastructure.

Technical Report A - Parking Demand Analysis
DSorbara Parking & Systems Consulting
May 2016
56
Figure 33: Info graphic Showing Current Parking Demand to Parking Supply
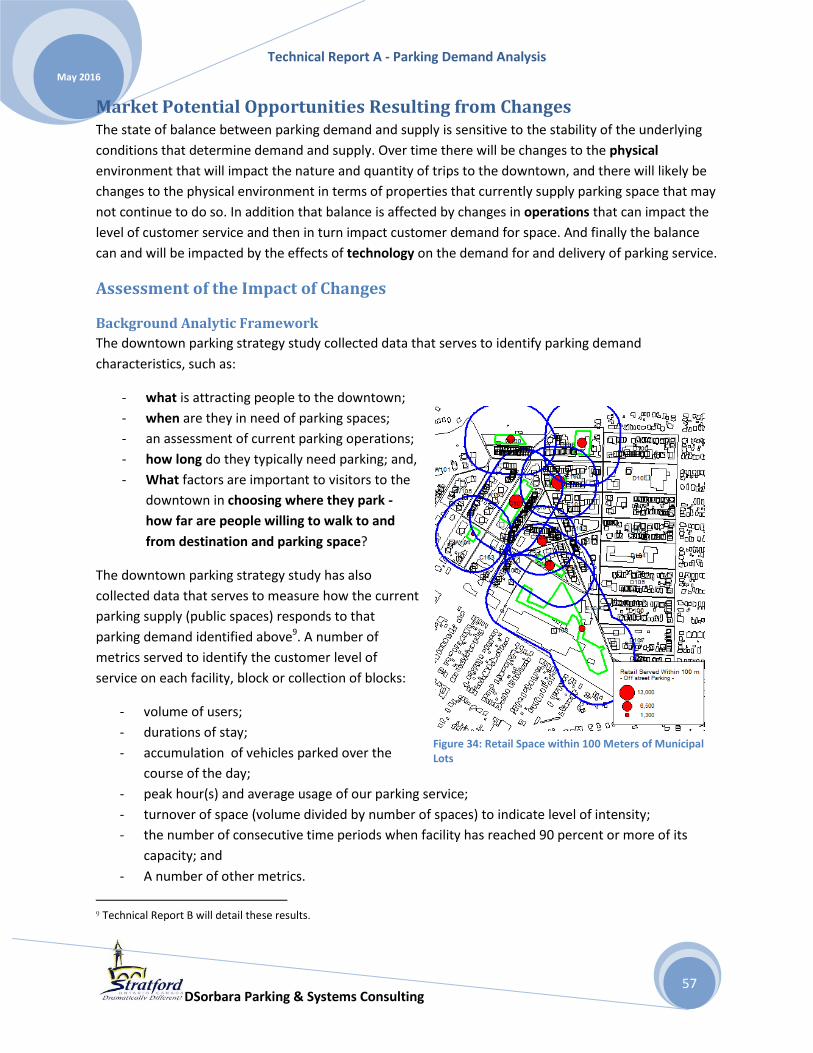
Technical Report A - Parking Demand Analysis
DSorbara Parking & Systems Consulting
May 2016
57
Market Potential Opportunities Resulting from Changes The state of balance between parking demand and supply is sensitive to the stability of the underlying
conditions that determine demand and supply. Over time there will be changes to the physical
environment that will impact the nature and quantity of trips to the downtown, and there will likely be
changes to the physical environment in terms of properties that currently supply parking space that may
not continue to do so. In addition that balance is affected by changes in operations that can impact the
level of customer service and then in turn impact customer demand for space. And finally the balance
can and will be impacted by the effects of technology on the demand for and delivery of parking service.
Assessment of the Impact of Changes
Background Analytic Framework
The downtown parking strategy study collected data that serves to identify parking demand
characteristics, such as:
- what is attracting people to the downtown;
- when are they in need of parking spaces;
- an assessment of current parking operations;
- how long do they typically need parking; and,
- What factors are important to visitors to the
downtown in choosing where they park -
how far are people willing to walk to and
from destination and parking space?
The downtown parking strategy study has also
collected data that serves to measure how the current
parking supply (public spaces) responds to that
parking demand identified above9. A number of
metrics served to identify the customer level of
service on each facility, block or collection of blocks:
- volume of users;
- durations of stay;
- accumulation of vehicles parked over the
course of the day;
- peak hour(s) and average usage of our parking service;
- turnover of space (volume divided by number of spaces) to indicate level of intensity;
- the number of consecutive time periods when facility has reached 90 percent or more of its
capacity; and
- A number of other metrics.
9 Technical Report B will detail these results.
Figure 34: Retail Space within 100 Meters of Municipal Lots
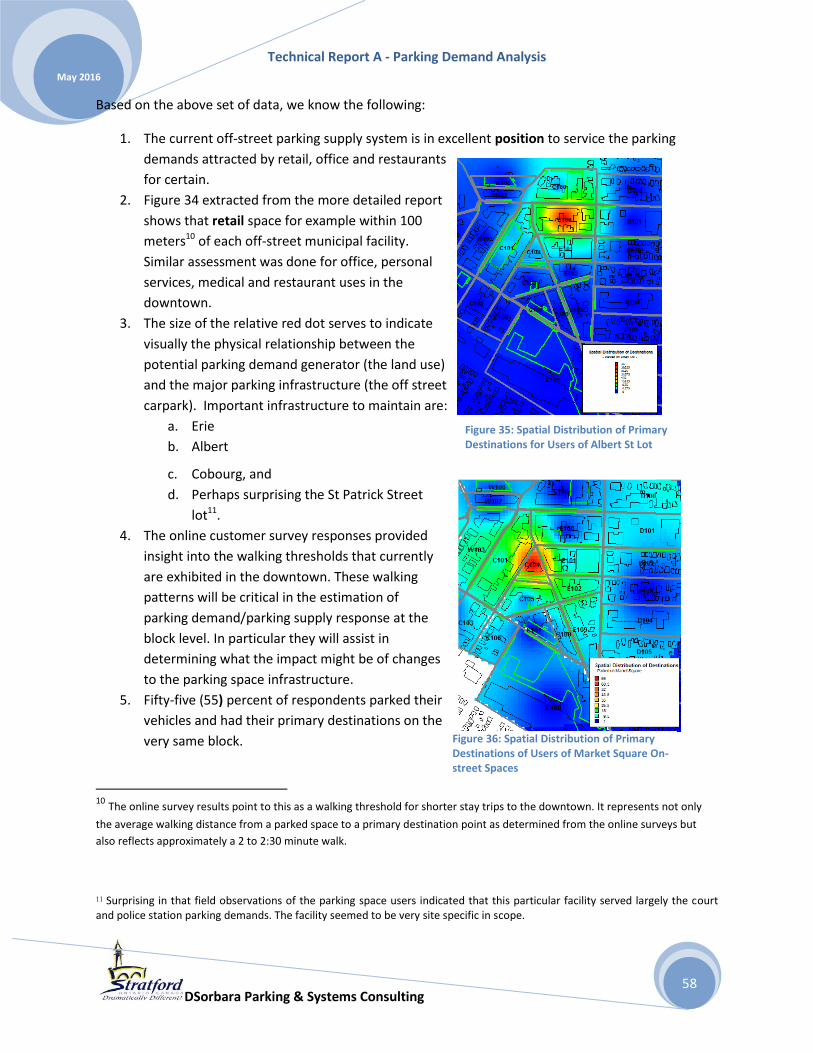
Technical Report A - Parking Demand Analysis
DSorbara Parking & Systems Consulting
May 2016
58
Based on the above set of data, we know the following:
1. The current off-street parking supply system is in excellent position to service the parking
demands attracted by retail, office and restaurants
for certain.
2. Figure 34 extracted from the more detailed report
shows that retail space for example within 100
meters10 of each off-street municipal facility.
Similar assessment was done for office, personal
services, medical and restaurant uses in the
downtown.
3. The size of the relative red dot serves to indicate
visually the physical relationship between the
potential parking demand generator (the land use)
and the major parking infrastructure (the off street
carpark). Important infrastructure to maintain are:
a. Erie
b. Albert
c. Cobourg, and
d. Perhaps surprising the St Patrick Street
lot11.
4. The online customer survey responses provided
insight into the walking thresholds that currently
are exhibited in the downtown. These walking
patterns will be critical in the estimation of
parking demand/parking supply response at the
block level. In particular they will assist in
determining what the impact might be of changes
to the parking space infrastructure.
5. Fifty-five (55) percent of respondents parked their
vehicles and had their primary destinations on the
very same block.
10 The online survey results point to this as a walking threshold for shorter stay trips to the downtown. It represents not only
the average walking distance from a parked space to a primary destination point as determined from the online surveys but
also reflects approximately a 2 to 2:30 minute walk.
11 Surprising in that field observations of the parking space users indicated that this particular facility served largely the court and police station parking demands. The facility seemed to be very site specific in scope.
Figure 35: Spatial Distribution of Primary Destinations for Users of Albert St Lot
Figure 36: Spatial Distribution of Primary Destinations of Users of Market Square On-street Spaces
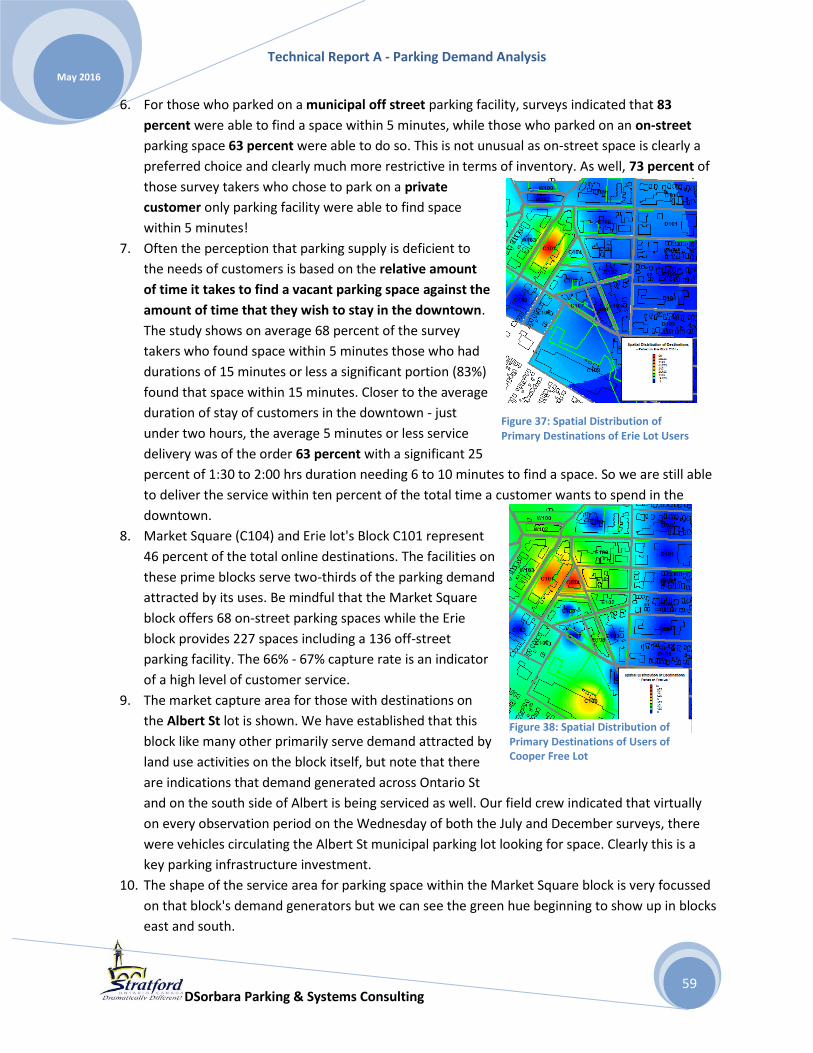
Technical Report A - Parking Demand Analysis
DSorbara Parking & Systems Consulting
May 2016
59
6. For those who parked on a municipal off street parking facility, surveys indicated that 83
percent were able to find a space within 5 minutes, while those who parked on an on-street
parking space 63 percent were able to do so. This is not unusual as on-street space is clearly a
preferred choice and clearly much more restrictive in terms of inventory. As well, 73 percent of
those survey takers who chose to park on a private
customer only parking facility were able to find space
within 5 minutes!
7. Often the perception that parking supply is deficient to
the needs of customers is based on the relative amount
of time it takes to find a vacant parking space against the
amount of time that they wish to stay in the downtown.
The study shows on average 68 percent of the survey
takers who found space within 5 minutes those who had
durations of 15 minutes or less a significant portion (83%)
found that space within 15 minutes. Closer to the average
duration of stay of customers in the downtown - just
under two hours, the average 5 minutes or less service
delivery was of the order 63 percent with a significant 25
percent of 1:30 to 2:00 hrs duration needing 6 to 10 minutes to find a space. So we are still able
to deliver the service within ten percent of the total time a customer wants to spend in the
downtown.
8. Market Square (C104) and Erie lot's Block C101 represent
46 percent of the total online destinations. The facilities on
these prime blocks serve two-thirds of the parking demand
attracted by its uses. Be mindful that the Market Square
block offers 68 on-street parking spaces while the Erie
block provides 227 spaces including a 136 off-street
parking facility. The 66% - 67% capture rate is an indicator
of a high level of customer service.
9. The market capture area for those with destinations on
the Albert St lot is shown. We have established that this
block like many other primarily serve demand attracted by
land use activities on the block itself, but note that there
are indications that demand generated across Ontario St
and on the south side of Albert is being serviced as well. Our field crew indicated that virtually
on every observation period on the Wednesday of both the July and December surveys, there
were vehicles circulating the Albert St municipal parking lot looking for space. Clearly this is a
key parking infrastructure investment.
10. The shape of the service area for parking space within the Market Square block is very focussed
on that block's demand generators but we can see the green hue beginning to show up in blocks
east and south.
Figure 37: Spatial Distribution of Primary Destinations of Erie Lot Users
Figure 38: Spatial Distribution of Primary Destinations of Users of Cooper Free Lot
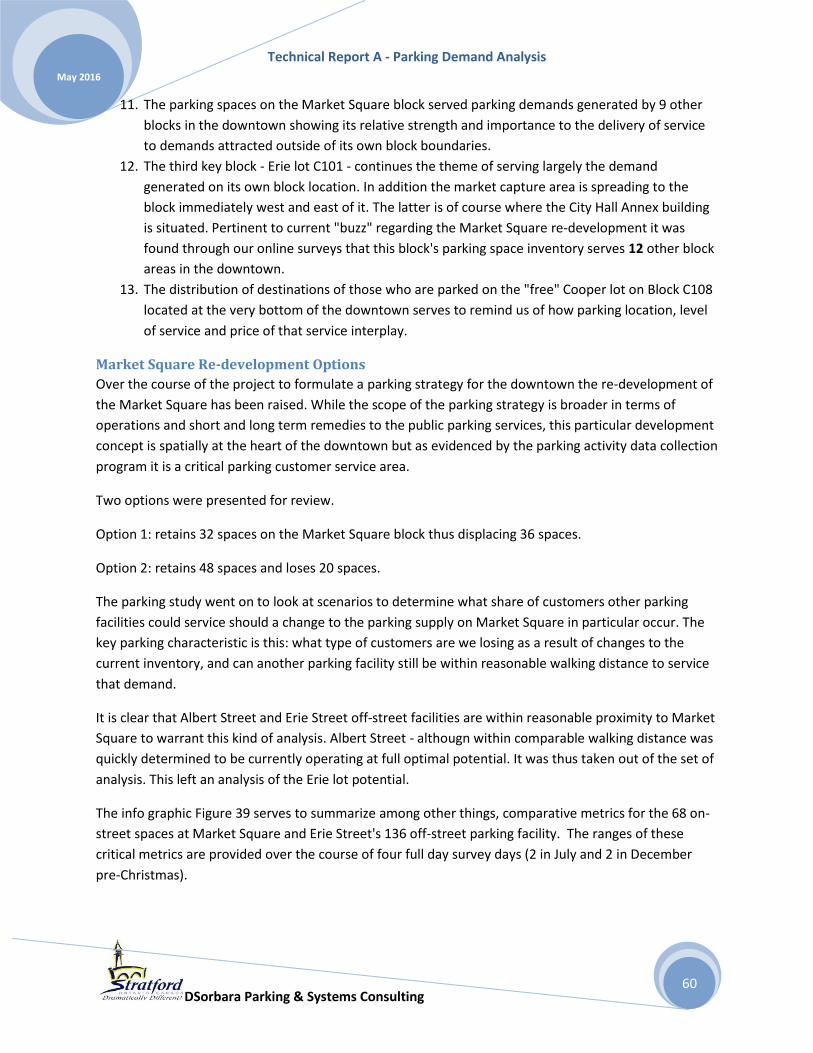
Technical Report A - Parking Demand Analysis
DSorbara Parking & Systems Consulting
May 2016
60
11. The parking spaces on the Market Square block served parking demands generated by 9 other
blocks in the downtown showing its relative strength and importance to the delivery of service
to demands attracted outside of its own block boundaries.
12. The third key block - Erie lot C101 - continues the theme of serving largely the demand
generated on its own block location. In addition the market capture area is spreading to the
block immediately west and east of it. The latter is of course where the City Hall Annex building
is situated. Pertinent to current "buzz" regarding the Market Square re-development it was
found through our online surveys that this block's parking space inventory serves 12 other block
areas in the downtown.
13. The distribution of destinations of those who are parked on the "free" Cooper lot on Block C108
located at the very bottom of the downtown serves to remind us of how parking location, level
of service and price of that service interplay.
Market Square Re-development Options
Over the course of the project to formulate a parking strategy for the downtown the re-development of
the Market Square has been raised. While the scope of the parking strategy is broader in terms of
operations and short and long term remedies to the public parking services, this particular development
concept is spatially at the heart of the downtown but as evidenced by the parking activity data collection
program it is a critical parking customer service area.
Two options were presented for review.
Option 1: retains 32 spaces on the Market Square block thus displacing 36 spaces.
Option 2: retains 48 spaces and loses 20 spaces.
The parking study went on to look at scenarios to determine what share of customers other parking
facilities could service should a change to the parking supply on Market Square in particular occur. The
key parking characteristic is this: what type of customers are we losing as a result of changes to the
current inventory, and can another parking facility still be within reasonable walking distance to service
that demand.
It is clear that Albert Street and Erie Street off-street facilities are within reasonable proximity to Market
Square to warrant this kind of analysis. Albert Street - althougn within comparable walking distance was
quickly determined to be currently operating at full optimal potential. It was thus taken out of the set of
analysis. This left an analysis of the Erie lot potential.
The info graphic Figure 39 serves to summarize among other things, comparative metrics for the 68 on-
street spaces at Market Square and Erie Street's 136 off-street parking facility. The ranges of these
critical metrics are provided over the course of four full day survey days (2 in July and 2 in December
pre-Christmas).

Technical Report A - Parking Demand Analysis
DSorbara Parking & Systems Consulting
May 2016
61
Using the metrics above, the analysis of current walking distances from each site (Erie and the Market
Square block), we concluded that there is an opportunity to currently accommodate displaced
customers in either of the two development options.
Figure 39: Info graphic Showing Impact on Customer Demand if 45 Spaces Lost on Market Square

Technical Report A - Parking Demand Analysis
DSorbara Parking & Systems Consulting
May 2016
62
The Erie lot can accommodate the displacement of either 20 or 36 spaces. Just to further understand
the conclusion please note that this is not a numerical calculation but the analysis looked at duration of
stay, turnover and peak and average occupancy of space on both exisitng Market Square on-street
facilities and on the Erie lot.
To be clear, each displaced parking stall on the Market Square on average means a displacement of 3.5
to 4.4 vehicles per space over the course of the day. In the design options above this translates to asking
126 to 158 customers who drive to that block to find parking on Erie (and elsewhere) under Option 1.
Under Option 2, it means asking 70 to 88 customers who drive and park there now to find alternative.
As shown in the metrics table on info graphic Figure 39, the current user profile of the Market Square
on-street parking faciliites indicates a relatively high portion of users to over-stay the three hour time
restriction (VOL Outside Limit statistic shown in the table). The overstay element of the profile equates
to a manageable 7 percent of total daily volume to a high of 15 percent. This is important to consider
because it defines the nature of those customers that we might be displacing. Displacing higher turnover
visitors to the downtown is somewhat more critical to the economic health of the downtown versus
displacing longer stay (possibly business owners) customers who can seek out less conveniently located
parking space in the downtown.
We would likely need to consider reducing monthly contract or longer stay parking on the Erie lot to
ensure that we have excess capacity to accommodate this transferred usage.
Cooper Site Potential Re-development
The parking strategy study has to deal with not only the possible redevelopment of Market Square but
with the potential re-development of this site. At the time of writing this report some designs were
presented but nothing firm has been recommended. The re-development of the structure on this site
impacts a historical physical structure. The contemplated re-build program on this site would restore
and re-purpose the historic building. In addition to it commercial/residential potential the site currently
plays a vital role in the supply of over 400 surface municipal parking spaces.
Some 300 spaces on the Cooper site are offered to customers free of charge. This report has spoken to
the key role that these spaces play in the delivery of parking service. This report has pointed out the
impact that these free spaces have on walking distance to and from primary destinations in the
downtown.
The info graphic Figure 40 speaks to a significant impact on parking service delivery system. The loss of
Cooper site parking impacts not only the immediately surrounding area but impacts the C-corridor block
supply. The Cooper site is clearly an integral piece to the current and future balance of parking demand
and supply. The re-development designs therefore need to take into account a public parking space
component. But it is important to keep in mind that the current importance that Cooper's parking
supply plays in the overall balance of demand and supply may lie only with the fact that currently it
offers parking service free of charge.

Technical Report A - Parking Demand Analysis
DSorbara Parking & Systems Consulting
May 2016
63
The Downie St municipal facility provides an important role here as well. Over the course of the past few
months, there are indications that those spaces are drawing from overflow conditions on the Cooper
site as well as continuing to provide vital service for buses that cater to the summer theatre attractions
in the downtown.
In addition to the Cooper site's historical building re-development potential the University of Waterloo
property is set for expansion as well. There may be opportunities here to consolidate the municipal
parking on this site that would serve strategically the varied parking demand sources - the Cooper re-
development and the University.
As noted in the info graphic, if public parking cannot be replaced on the site, then significant pressure
will result throughout the parking infrastructure system specifically pressure east of Downie and
certainly along the C-corridor blocks. To re-iterate the pressure on those existing facilities along the C-
corridor will require partnerships with private land owners to provide replacement supply as noted in
the info graphic.
Erie Site Potential Re-development
While there are currently no talk of re-development of the 138 space municipal parking facility at the
time of this report, we wanted to measure the impact of its loss to the parking infrastructure system.
The site is one that geometrically is suited for not only parking but likely commercial/residential uses.
This site was also the subject of a proposal to build a half-module deck above the surface lot. That
proposal is discussed in Technical Appendix C. It should also be noted that the Erie lot is well served by
pedestrian routes formed by archway from the lot to Wellington at mid-block and by an urban
landscaped route that leads the customer to the north end of the block towards Ontario St.
Suffice to say here that Erie site is crucial to the parking service and its loss or reduction in parking space
would put significant pressure on the service delivery system. Info graphic Figure 41 shows blocks to the
west of Erie (W-corridor) and again blocks within the C-corridor would be under severe pressure to
absorb the loss of the Erie lot parking spaces.
Intensification of Residential Use
While at the time of writing, no specific proposals have been tabled (aside from the Market Square re-
development), there was some project team discussion that infill projects were likely to come. The
University of Waterloo's Stratford downtown campus is scheduled for expansion which would likely
generate the need for accommodation units close to it in the downtown.
The intensification of residential development in the downtown might have the following effects on
parking demand and supply:
Should future downtown development include a resident population, it would require a wide
range of services that satisfy the day to day living requirements (food and personal/medical
services). These uses would generate a walk-in market not one that requires driving a vehicle.
Technical Report A - Parking Demand Analysis
DSorbara Parking & Systems Consulting
May 2016
64
A resident population grows into a community. This community becomes more engaged in its
surroundings by protecting it from invasive traffic and demanding a set of urban design
standards that encourages a more pedestrian environment. Any future parking space
development would need to be evidenced and need to reflect sensitivity to resident population
in terms of its size and urban design.
A resident population requires parking space on-site for the storage of their own vehicles and
more likely to face a conflict with their visitors and people who are shopping, dining and
engaging in commercial activities.
A year-round entertainment and community focus point such as Market Square generates
pedestrian traffic that needs to be woven into the existing urban transportation network.
Quantifying the singular or cumulative impact of changes in character of the downtown would be very
difficult. However the impact of most of what we discussed here is that there would be a downward
pressure on parking demand in the longer term planning horizon.
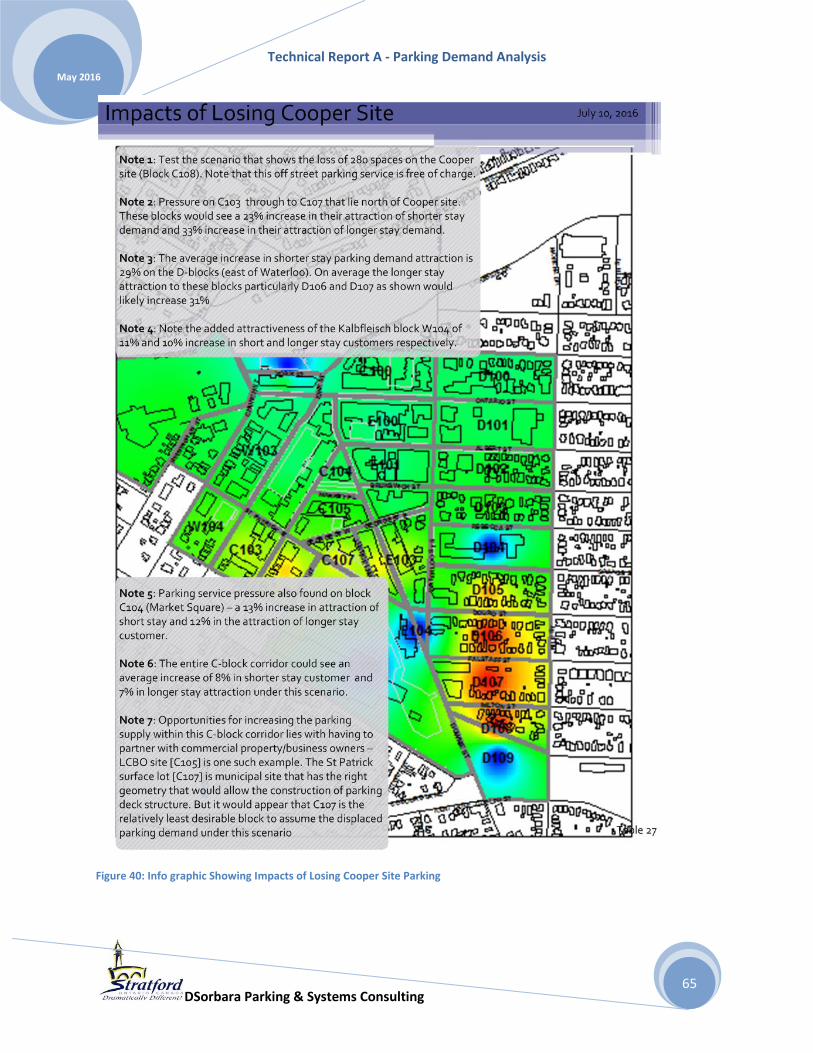
Technical Report A - Parking Demand Analysis
DSorbara Parking & Systems Consulting
May 2016
65
Figure 40: Info graphic Showing Impacts of Losing Cooper Site Parking
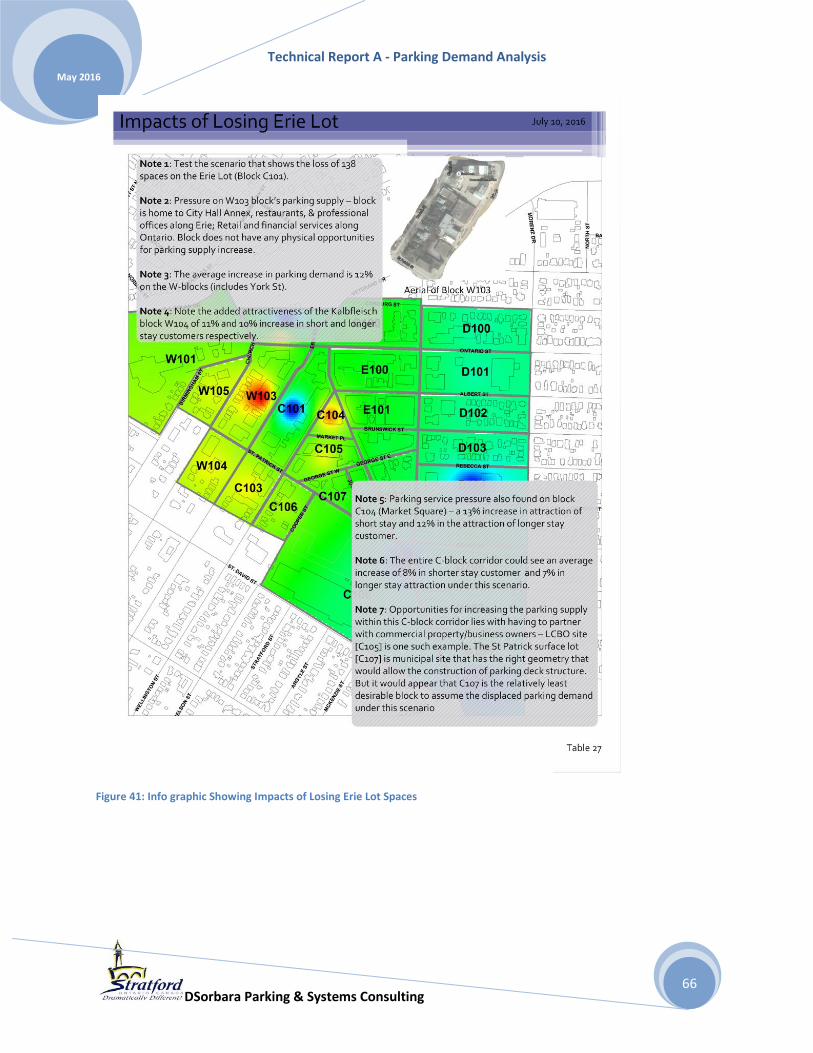
Technical Report A - Parking Demand Analysis
DSorbara Parking & Systems Consulting
May 2016
66
Figure 41: Info graphic Showing Impacts of Losing Erie Lot Spaces

Technical Report A - Parking Demand Analysis
DSorbara Parking & Systems Consulting
May 2016
67
Impact of Changes in Technology and Character of Downtown
Technological changes have and will have an impact on mobility means, on the quantity and ultimately
the need for parking. The delivery of parking service to the customer is one of the five factors that we
discussed in this report. Specifically we discussed how our customers felt concerning payment options,
time restrictions on the use of parking space and enforcement. This parking strategy needs to
acknowledge that changes in the way we move around town will impact the urban landscape. The
technologies are:
- Driverless vehicles
- Shared economy or "dial-up" service
- Continuation of internet based shopping for and purchase of services and products
from the comforts of your home or office, and
- Technology that finds a vacant parking space for you if you are driving your own
vehicle
The introduction of technology specific to mobility may effect parking demand and supply as follows:
Combining the driverless vehicle with the "shared economy" technology, the on-demand service
will not require a vehicle to rest in a parking space. Circulating around the block looking for a
vacant parking space is not necessary as a driverless vehicle need only to pick up or drop off its
passengers. Remember that a vehicle spends 96 percent of its time parked;
Infrastructure changes are required so that assisted driving works - from clear network sensors,
availability of charging stations to broadband wireless network that allows for communication
between vehicles and that infrastructure;
Most analysts believe that this technology will provide a safer and more efficient mobility
service to us. It will also promise a cleaner environment as it is based on non-fossil fuel
technology;
Auto industry is well into the development of vehicles that can operate as such. Stratford is a
test site for driver-assisted technology;
Dialing up a transportation service will become more economical when compared to the
outright purchase of your own vehicle; and,
The driver technology will likely not reduce road congestion, however it will reduce traffic that
circulates the downtown looking for parking spaces (estimated to be of the order of 35 to 45
percent of the total volume).
Quantifying the singular or cumulative impact of these technology changes would be very difficult.
However the impact of most of what we discussed here is that there would be a downward pressure on
parking demand in the longer-term planning horizon. The introduction of the parking space guidance
technology (where we indicate where vacant parking space is available) would contribute to the
Technical Report A - Parking Demand Analysis
DSorbara Parking & Systems Consulting
May 2016
68
optimization of existing parking space use which supports a tenant of a contemporary transportation
strategy.
Summary
Parking Demand Analysis
This technical report presents an analysis of the parking demand side of the public parking service. The
report begins with discussion of five factors: physical environment, trip characteristics, and attraction of
parking supply, parking operations and the customer experience. Each has a significant impact on
parking demand.
Reflecting on the outcomes of this parking demand analysis process the following salient findings are
offered:
Factor 1: Physical Environment
1. The commercial land use space is concentrated in a dense building form. The facades of the
buildings along Ontario, Wellington and Downie form a solid unified commercial visual address
along the horizontal, and residential, service and offices that sit on top of the grade level
commercial use along the vertical. This urban form serves the following impact on the study of
parking demand:
a. People driving along Ontario, Wellington and Downie can more easily see the shops as
the solid urban facade presents a “billboard” of sorts;
b. Once the motorist finds the intended primary destination point, the focus of the
motorist turns to reading the signs that direct them to parking space – be it along
Ontario, Wellington or Downie in an on-street space or to an off-street parking space;
and,
c. The network of streets provides various channels that allow the motorist to safely park
their vehicle or negotiate movement in and around the downtown.
2. The broad range of land uses will play into the computation of parking demand as a number of
different land use types attract parking demand at varying peak hours of the day, varying days of
the week, and at varying magnitudes.
3. The interplay of these factors will provide an estimate of the potential size of the parking
demand. Walking distance to and from parking space and these land uses will help distribute
that parking demand to the parking supply and assess the level of customer service

Technical Report A - Parking Demand Analysis
DSorbara Parking & Systems Consulting
May 2016
69
4. The study discusses the potential physical changes to the downtown environment that will
affect parking demand and parking supply options in the short and longer-term planning horizon.
Specific discussion centered on re-development on Market Square, the Cooper site and the
expansion of the University of Waterloo campus. Some of these developments will take parking
supply away, add new demand, or intensify the demand for space even more in the longer term.
5. The study went beyond the physical changes that will exert a downward pressure on future
parking demand and supply and spoke to the impacts generated by technology:
a. Driverless or driver-assisted vehicles
b. Shared economy or dial-up travel service
c. Online internet sourced shopping and purchase of goods and services
d. Live and interactive available parking space guidance system
Factor 2. Trip Characteristics
This factor discusses the inherent differences that arise among different land uses in terms of trip
characteristics, namely: patterns of parking demand over the course of the day, week, and season;
magnitude of parking attracted per land use type and other trip characteristics that assist in defining the
parking demand.
The discussion also spoke to the impact on peak hour parking attraction of such trip characteristics such
as having multiple destinations for one trip - essentially sharing one parking space among several
destinations.
Factor 3. Attraction of Parking Supply (Walking)
Emerging from the online surveys one of our most
critical factors that affect parking demand specifically
the decision of where people will park is the
measurement of an acceptable walking distance to
and from parking space and primary destination.
The analysis of walking distance serves to identify
parking space that is marketable to various types of
customers and as such it does impact where and
what type of parking services are in demand.
We offered these observations:
6. Fifty-five (55) percent of respondents parked
their vehicles and had their primary destinations on the very same block.
7. For those who parked on a municipal off street parking facility, surveys indicated that 83
percent were able to find a space within 5 minutes, while those who parked on an on-street
Figure 42: Block Summary of Walking Distances [Total, Average, Low & High]
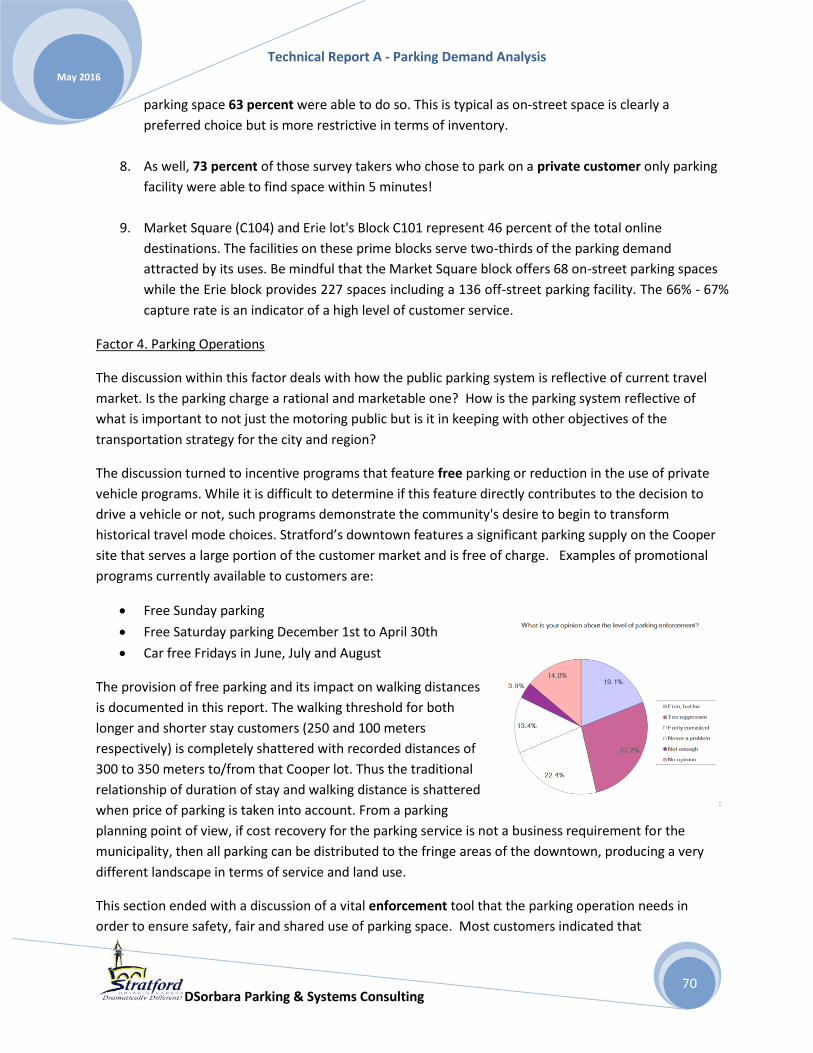
Technical Report A - Parking Demand Analysis
DSorbara Parking & Systems Consulting
May 2016
70
parking space 63 percent were able to do so. This is typical as on-street space is clearly a
preferred choice but is more restrictive in terms of inventory.
8. As well, 73 percent of those survey takers who chose to park on a private customer only parking
facility were able to find space within 5 minutes!
9. Market Square (C104) and Erie lot's Block C101 represent 46 percent of the total online
destinations. The facilities on these prime blocks serve two-thirds of the parking demand
attracted by its uses. Be mindful that the Market Square block offers 68 on-street parking spaces
while the Erie block provides 227 spaces including a 136 off-street parking facility. The 66% - 67%
capture rate is an indicator of a high level of customer service.
Factor 4. Parking Operations
The discussion within this factor deals with how the public parking system is reflective of current travel
market. Is the parking charge a rational and marketable one? How is the parking system reflective of
what is important to not just the motoring public but is it in keeping with other objectives of the
transportation strategy for the city and region?
The discussion turned to incentive programs that feature free parking or reduction in the use of private
vehicle programs. While it is difficult to determine if this feature directly contributes to the decision to
drive a vehicle or not, such programs demonstrate the community's desire to begin to transform
historical travel mode choices. Stratford’s downtown features a significant parking supply on the Cooper
site that serves a large portion of the customer market and is free of charge. Examples of promotional
programs currently available to customers are:
Free Sunday parking
Free Saturday parking December 1st to April 30th
Car free Fridays in June, July and August
The provision of free parking and its impact on walking distances
is documented in this report. The walking threshold for both
longer and shorter stay customers (250 and 100 meters
respectively) is completely shattered with recorded distances of
300 to 350 meters to/from that Cooper lot. Thus the traditional
relationship of duration of stay and walking distance is shattered
when price of parking is taken into account. From a parking
planning point of view, if cost recovery for the parking service is not a business requirement for the
municipality, then all parking can be distributed to the fringe areas of the downtown, producing a very
different landscape in terms of service and land use.
This section ended with a discussion of a vital enforcement tool that the parking operation needs in
order to ensure safety, fair and shared use of parking space. Most customers indicated that
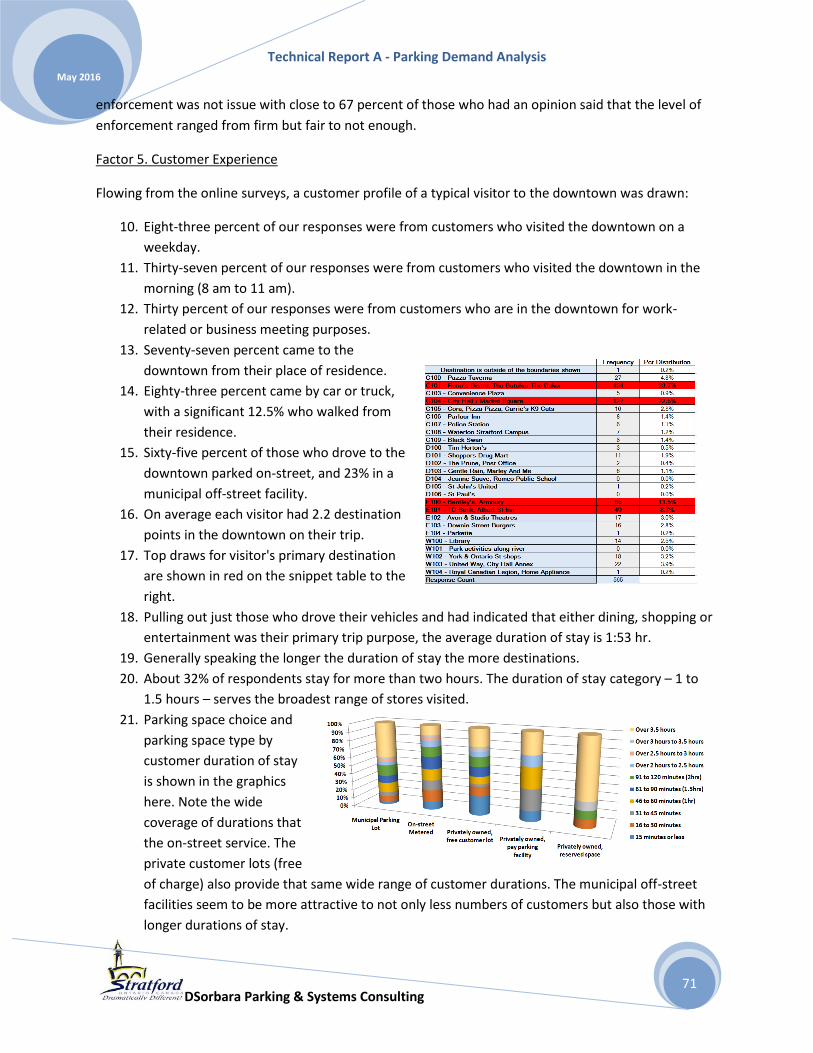
Technical Report A - Parking Demand Analysis
DSorbara Parking & Systems Consulting
May 2016
71
enforcement was not issue with close to 67 percent of those who had an opinion said that the level of
enforcement ranged from firm but fair to not enough.
Factor 5. Customer Experience
Flowing from the online surveys, a customer profile of a typical visitor to the downtown was drawn:
10. Eight-three percent of our responses were from customers who visited the downtown on a
weekday.
11. Thirty-seven percent of our responses were from customers who visited the downtown in the
morning (8 am to 11 am).
12. Thirty percent of our responses were from customers who are in the downtown for work-
related or business meeting purposes.
13. Seventy-seven percent came to the
downtown from their place of residence.
14. Eighty-three percent came by car or truck,
with a significant 12.5% who walked from
their residence.
15. Sixty-five percent of those who drove to the
downtown parked on-street, and 23% in a
municipal off-street facility.
16. On average each visitor had 2.2 destination
points in the downtown on their trip.
17. Top draws for visitor's primary destination
are shown in red on the snippet table to the
right.
18. Pulling out just those who drove their vehicles and had indicated that either dining, shopping or
entertainment was their primary trip purpose, the average duration of stay is 1:53 hr.
19. Generally speaking the longer the duration of stay the more destinations.
20. About 32% of respondents stay for more than two hours. The duration of stay category – 1 to
1.5 hours – serves the broadest range of stores visited.
21. Parking space choice and
parking space type by
customer duration of stay
is shown in the graphics
here. Note the wide
coverage of durations that
the on-street service. The
private customer lots (free
of charge) also provide that same wide range of customer durations. The municipal off-street
facilities seem to be more attractive to not only less numbers of customers but also those with
longer durations of stay.

Technical Report A - Parking Demand Analysis
DSorbara Parking & Systems Consulting
May 2016
72
22. Looking at the parking type choice from another perspective. The on-street parking space here
in the downtown has a very wide customer stay market range. The off-street space is continuing
to attract customers with slightly longer durations of stay, but in most of the other durations of
stay categories on-street space provides a very high level of service.
Evaluation of Current Parking Demand and Supply
Flowing out of the detailed discussion of parking demand, we presented a five step procedure to best
determine current level of parking demand and its distribution over the downtown. The salient findings
of this analysis are:
Step 1: Calculate Peak Hour Parking Demand
With some understanding of the physical environment and its impact on parking demand both now and
in the future the next factor we discussed was the quantity of trips attracted by the physical
environment. The deliverable is a set of
peak hour parking ratios showing peak
number of parking spaces attracted by each
land use type (number of spaces for every
100 square meters of land use type).
The computed peak hour quantity took into
account the following inputs:
o Individual peak attraction of parking demand by land use type
o Temporal variation of that parking demand over the course of the day; taking into account that
certain land uses peak at different times of the day
o Day of the week variation of that parking demand for different land uses;
o Seasonal variation in that parking demand (theatre, summer tourism, etc)
o Multiple destinations and their impact on the number of peak spaces that may be required
when one parking space serves a number of different destinations;
o Market synergy or walk-in market: where certain land uses in the downtown draw customers
from those who already work in the downtown and thus do not impact the peak parking
demand
o The outcome of this piece was a set of peak hour parking ratios (number of spaces for every 100
square meters of specific land use). The application of these ratios to the quantity and type of
land use generated an estimate of longer stay (work trips) and shorter stay parking demand.
The resulting quantity of trips generated by these computed peak hour ratios is calibrated against the
observed number of parking space occupancy (over the course of four day long field surveys). Applying
the peak hour rates to the land use quantities generated an overall employee parking demand for about
750 stalls in the downtown and approximately 1000 stalls for visitor (short stay) parking demand. The
peak hour of the day parking demand so calibrated generates a total parking demand range of 1640 to
1840 stalls with a mid-range target of 1740 parking spaces in the downtown.
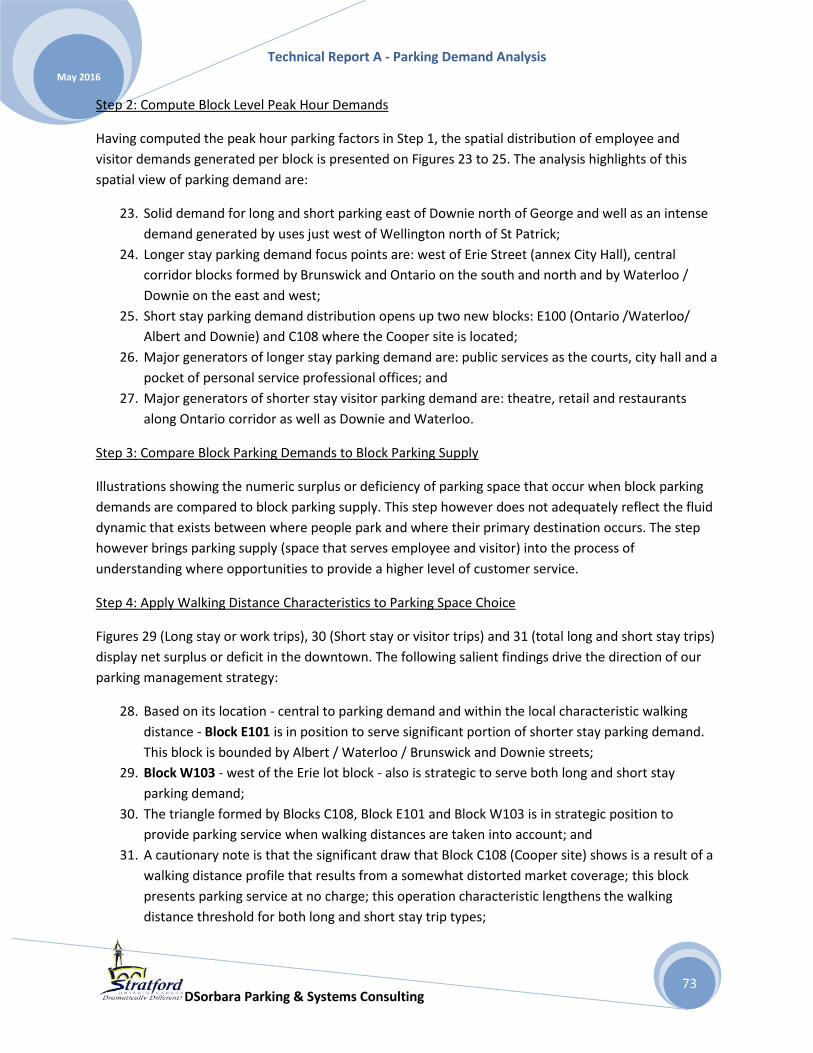
Technical Report A - Parking Demand Analysis
DSorbara Parking & Systems Consulting
May 2016
73
Step 2: Compute Block Level Peak Hour Demands
Having computed the peak hour parking factors in Step 1, the spatial distribution of employee and
visitor demands generated per block is presented on Figures 23 to 25. The analysis highlights of this
spatial view of parking demand are:
23. Solid demand for long and short parking east of Downie north of George and well as an intense
demand generated by uses just west of Wellington north of St Patrick;
24. Longer stay parking demand focus points are: west of Erie Street (annex City Hall), central
corridor blocks formed by Brunswick and Ontario on the south and north and by Waterloo /
Downie on the east and west;
25. Short stay parking demand distribution opens up two new blocks: E100 (Ontario /Waterloo/
Albert and Downie) and C108 where the Cooper site is located;
26. Major generators of longer stay parking demand are: public services as the courts, city hall and a
pocket of personal service professional offices; and
27. Major generators of shorter stay visitor parking demand are: theatre, retail and restaurants
along Ontario corridor as well as Downie and Waterloo.
Step 3: Compare Block Parking Demands to Block Parking Supply
Illustrations showing the numeric surplus or deficiency of parking space that occur when block parking
demands are compared to block parking supply. This step however does not adequately reflect the fluid
dynamic that exists between where people park and where their primary destination occurs. The step
however brings parking supply (space that serves employee and visitor) into the process of
understanding where opportunities to provide a higher level of customer service.
Step 4: Apply Walking Distance Characteristics to Parking Space Choice
Figures 29 (Long stay or work trips), 30 (Short stay or visitor trips) and 31 (total long and short stay trips)
display net surplus or deficit in the downtown. The following salient findings drive the direction of our
parking management strategy:
28. Based on its location - central to parking demand and within the local characteristic walking
distance - Block E101 is in position to serve significant portion of shorter stay parking demand.
This block is bounded by Albert / Waterloo / Brunswick and Downie streets;
29. Block W103 - west of the Erie lot block - also is strategic to serve both long and short stay
parking demand;
30. The triangle formed by Blocks C108, Block E101 and Block W103 is in strategic position to
provide parking service when walking distances are taken into account; and
31. A cautionary note is that the significant draw that Block C108 (Cooper site) shows is a result of a
walking distance profile that results from a somewhat distorted market coverage; this block
presents parking service at no charge; this operation characteristic lengthens the walking
distance threshold for both long and short stay trip types;

Technical Report A - Parking Demand Analysis
DSorbara Parking & Systems Consulting
May 2016
74
Step 5: Compare Distributed Parking Demand to Parking Supply
The key outcomes of this step are:
32. It is understood that corridor E generates a significant portion of the downtown’s long and short
stay parking demands. Corridor E is home to one of the busiest off-street parking facility on
Albert Street.
33. While the demand to supply comparison shows an extraordinary deficit in both long and short
stay parking space deficit, the opportunity for expansion of parking inventory within the corridor
is limited.
34. The parking supply within this corridor is currently at capacity in its response to this demand.
Technical Report B will elaborate but important at this point is that the supply is optimally used
by customers. There does not appear to be abuse in terms of customers parking beyond the
three hour time limits that would mean other customers cannot share the limited parking space.
35. We need to look at how the parking supply in reality is responding to the demand. Our field
surveys of parking space use will provide insights into how well the parking inventory is
performing.
36. The most common way of expressing the balance between parking demand and supply is to
quote the occupancy or peak utilization of its supply (75 percent occupancy at 14:00 hrs for
example). In practical terms however, this particular metric is not very helpful because it
contradicts what we have been saying throughout steps 1 to 5: the walking distance to and from
primary destination and parking space provides a broader spatial perspective on the balance of
supply and its demand.
37. The outcome of step five (5) serves to provide the study with a spatial focus of where
opportunity theoretically emerges. It does not point to specific properties within the downtown
where supply can be changed in order to more effectively respond to its market.
38. The balance of parking demand and supply is beyond the numerical differences between them.
The state of balance – surplus or deficit – can and does point to potential operational
opportunities. For example, note that the longer stay parking demand customer is consistently
in an imbalance. Overall that customer market is in deficit position. The free parking operation
at Cooper’s site however demonstrates how the parking management strategy can manipulate
the parking space choice decision by selling its service free of user charges. This operational
characteristic serves to manipulate customers' acceptance of longer walking distance by off-
setting its cost to the customer.
39. Building on the walking distance and the impact of operational characteristics, the outcome of
steps 1 to 5 point to the need to measure how stable the parking space inventory is over the
short and longer term planning horizon.
Market Potential Opportunities Resulting from Changes
The state of balance between parking demand and supply is sensitive to the stability of the underlying
conditions that determine demand and supply. Over time there will be changes to the physical
environment that will impact the nature and quantity of trips to the downtown, and there will likely be
Technical Report A - Parking Demand Analysis
DSorbara Parking & Systems Consulting
May 2016
75
changes to the physical environment in terms of properties that currently supply parking space that may
not continue to do so. In addition that balance is affected by changes in operations that can impact the
level of customer service and then in turn impact customer demand for space. And finally the balance
can and will be impacted by the effects of technology on the demand for and delivery of parking service.
Changes to the physical environment included these known sites:
Over the course of the project to formulate a parking strategy for the downtown the re-
development of the Market Square has been raised. While the scope of the parking strategy is
broader in terms of operations and short and long term remedies to the public parking services,
this particular development concept is spatially at the heart of the downtown but as evidenced
by the parking activity data collection program it is a critical parking customer service area.
Two options were presented for review:
o Option 1: retains 32 spaces on the Market Square block thus displacing 36 spaces.
o Option 2: retains 48 spaces and loses 20 spaces.
Potential re-development of the Cooper site and the University of Waterloo campus. At the
time of writing this report some designs were presented but nothing firm has been
recommended. The re-development of the structure on this site impacts a historical physical
structure. The contemplated re-build program on this site would restore and re-purpose the
historic building. In addition to it commercial/residential potential the site currently plays a vital
role in the supply of over 400 surface municipal parking spaces. The University's expansion
plans were not available but have been the subject of discussion. The potential is always there
to consolidate parking space requirements for both the Cooper site and the University's
expansion.
Effect of losing Erie St Municipal Lot or Cooper site's free parking lot. The report tested walking
distance, demand and market appeal of these key parking facilities if their supply were to be
reduced or lost. The report provided the spatial distribution of current trips to either of these
lots to other blocks. The magnitude of a change in the infrastructure's current capacity was
determined to be significant especially given that both of these lots represent a significant
portion of public parking inventory. The report provided the insight that Erie and Cooper sites
are the best physical geometry to accommodate a longer-term parkade solution if and when the
demand reaches that critical capacity.
Possible adoption of technological changes may result in the following effects on longer-term parking
demand and supply:
Technological changes have and will have an impact on mobility means, on the quantity and ultimately
the need for parking. This parking strategy needs to acknowledge that changes in the way we move
around town will impact the urban landscape. The selected technologies are:
- Driverless vehicles;
- Shared economy or "dial-up" service;

Technical Report A - Parking Demand Analysis
DSorbara Parking & Systems Consulting
May 2016
76
- Continuation of internet based shopping for and purchase of services and products from the
comforts of your home or office; and
- Technology that finds a vacant parking space.
The introduction of technology specific to mobility may effect parking demand and supply as follows:
Combining the driverless vehicle with the "shared economy" technology, the on-demand service
will not require a vehicle to rest in a parking space. Circulating around the block looking for a
vacant parking space is not necessary as a driverless vehicle need only to pick up or drop off its
passengers. Remember that a vehicle spends 96 percent of its time parked;
Infrastructure changes are required so that assisted driving works - from clear network sensors,
availability of charging stations to broadband wireless network that allows for communication
between vehicles and that infrastructure;
Most analysts believe that this technology will provide a safer and more efficient mobility
service to us. It will also promise a cleaner environment as it is based on non-fossil fuel
technology;
Auto industry is well into the development of vehicles that can operate as such. Stratford is a
test site for driver-assisted technology;
Dialing up a transportation service will become more economical when compared to the
outright purchase of your own vehicle; and,
The driver technology will likely not reduce road congestion, however it will reduce traffic that
circulates the downtown looking for parking spaces (estimated to be of the order of 35 to 45
percent of the total volume).
Quantifying the singular or cumulative impact of these technology changes would be very difficult.
However the impact of most of what we discussed here is that there would be a downward pressure on
parking demand in the longer-term planning horizon.
The introduction of the parking space guidance technology (where we indicate where vacant parking
space is available) would contribute to the optimization of existing parking space use which supports a
tenant of a contemporary transportation strategy.


