Date of first issue: Project No.:12 May 2000 59000043Approved by: Organisational unit:
Christian L. S. RafnHead of Section
Environmental Advisory Services
Client: Client ref.:RN590
Summary:
This report represents a subtask of a DNV study on ship decommissioning (Decommissioning ofShips – Environmental Standards). The project has published the following reports;
The study (Decommissioning of Ships – Environmental Standards) include a phase emphasising onthe potentials of introducing a “Best Practice Approach” (BAP) for ship demolition facilities. The aimof this task is to identify procedures or methods providing for improvements associated toenvironmental performance and occupational safety/ human health in relation to the demolitionprocess.
In order to establish a knowledge baseline for identifying recommendations in identifying a BAP, anon-site assessment was required. Det Norske Veritas DNV initiated a dialogue with relevantBangladesh authorities as well as Norwegian governmental representation in Bangladesh. Thisresulted in a formalised co-operation with the University of Chittagong (UOC). The surveyundertaken in Chittagong, Bangladesh was a joint effort activity and has provided a base for furtherco-operation between DNV and UOC.
This report summarises the activities carried out in Chittagong. Furthermore make use of findings andconclusions made in the process of identifying a methodological approach for improving conditionsassociated to safety, health and the environment in the ship breaking industry.
Safety, Health, Environment (SHE)Work carried out by:Aage Bjørn Andersen, Erik Bjørnbom, TerjeSverud
No distribution without permission from theClient or responsible organisational unit
Work verified by:Egil Dragsund Limited distribution within
Det Norske Veritas
Date of this revision: Rev. No.: Number of pages:12. May 2000 01 52 Unrestricted distribution
DET NORSKE VERITAS
Report No: 2000-3158, rev. 01
TECHNICAL REPORT
Page iReference to part of this report which may lead to misinterpretation is not permissible.
29 August 2000
Table of Content Page
1 INTRODUCTION.................................................................................................... 21.1 General 21.1.1 Decommissioning of Ships – Environmental Standards, Objective item 3 21.2 Bangladesh - Chittagong 31.2.1 Environmental concern and ship scrapping 31.3 The Best Practice Approach (BPA) 4
2 CURRENT PRACTICES AND SHE-RELATED IMPACTS ................................... 62.1 General 62.2 Particulars of the vicinity of Chittagong 62.3 On-site assessment, Chittagong 62.3.1 Work schedule and sampling planning 72.3.2 Sampling 82.3.2.1 Sediment samples 92.3.2.2 Sea water sample 92.3.2.3 Water sample 102.3.2.4 Sludge samples 102.3.2.5 Asbestos sampling 102.3.2.6 Soil samples 102.3.2.7 Paint sample 112.3.2.8 Electrical cable sample 112.3.2.9 Air samples 112.4 Interviews 122.4.1 General 122.5 Summary of interviews 122.6 Scrap Processing – Organisation and procedures 162.6.1 Background and administration 162.6.2 Ship breaking capacity 162.6.3 The scrapping process 162.6.4 General description of the scrapping process 172.7 Visited scrap processing and refining facilities 192.7.1 Cold rolling mill 192.7.2 Steel plate re-manufacturing 192.7.3 Chain and steel processing (trading) 202.7.4 Lubricating oil re-manufacturing 202.7.5 Asbestos re-processing 202.7.6 Trade facilities 20
3 ANALYSIS AND RESULTS................................................................................. 223.1 Sediment samples 223.1.1 Particulate size distribution & total organic carbon - analytical results 23
DET NORSKE VERITAS
Report No: 2000-3158, rev. 01
TECHNICAL REPORT
Page iiReference to part of this report which may lead to misinterpretation is not permissible.
29 August 2000
3.1.1.1 Comments to the analytical results 233.1.2 Metals - analytical results 243.1.2.1 Comments to the analytical results 243.1.3 Polyaromatic hydrocarbons - analytical results 253.1.3.1 Comments to the results 263.1.4 PCB, organic screening and TBT - analytical results 263.2 Sea water sample 263.2.1 Analytical results 263.2.2 Comments to the results 273.3 Water sample from stream 273.3.1 Analytical results 273.3.2 Comments to the analytical results 283.4 Residue samples 283.4.1 Analytical results 283.4.2 Comments to the analytical results 293.5 Possible asbestos samples 293.5.1 Analytical results 293.5.2 Comments to the results 293.6 Soil samples 303.6.1 Analytical results 303.6.2 Comments to the results 313.6.2.1 Heavy metals 313.6.2.2 PCB 313.6.2.3 Organotin 323.7 Paint sample 323.7.1 Analytical results 323.7.2 Comments to the results 333.7.2.1 Heavy metals 333.7.2.2 PCB 333.7.2.3 Organotin 333.8 Electrical cable sample 333.8.1 Analytical results 333.8.2 Comments to the results 333.9 Air samples 343.9.1 Analytical results 343.9.2 Comments to the results 353.9.2.1 Asbestos 363.9.2.2 Heavy metals 363.9.2.3 Organic compounds 373.10 Direct environmental impacts of ship scrapping 38
4 DEVELOPMENT OF SHIP BREAKING PRACTICES......................................... 424.1 The Best Practice Approach 424.2 The ship breaking process 43
DET NORSKE VERITAS
Report No: 2000-3158, rev. 01
TECHNICAL REPORT
Page iiiReference to part of this report which may lead to misinterpretation is not permissible.
29 August 2000
4.2.1 Decommissioning and demolition 434.2.2 Material extracted for re-use 454.2.2.1 Waste and extraction debris 454.3 Safety, Health and the Environment (SHE) 454.3.1 Environmental and Safety Manual for Ship breaking facilities (ESMaS). 464.3.1.1 Company policy 474.3.1.2 Occupational Safety and Health 474.3.1.3 Environmental Management 474.3.1.4 Contingency Preparedness and Disaster Management 484.3.1.5 Inventory of Best Practices 484.3.2 Using the BPA to develop the ESMaS 48
Appendix A MapsAppendix B Schedule for trip to BangladeshAppendix C Overview of sampling pointsAppendix D Photographic documentationAppendix E Overview of samples analysedAppendix F Report from laboratory
DET NORSKE VERITAS
Report No: 2000-3158, rev. 01
TECHNICAL REPORT
Page 1Reference to part of this report which may lead to misinterpretation is not permissible.
29 August 2000
Preamble
This work is largely based upon the findings and results following the undertaking of an On-Site Assessment carried out at the ship-breaking facilities of Chittagong, Bangladesh. In the
process of both planning and undertaking this activity, DNV was dependent on local co-operation.
DNV would like to thank the Institute of Marine Sciences, University of Chittagong (UOC) fortheir efforts and assistance in the planning and execution of the on-site activities. The workwas undertaken in close co-operation with university staff. Dr. Yousuf Sharif Ahmad Khan,Mr. Sayedur Rahman Chowdhury, Mr. S.M.A Jabber, Mr. Pranab Das and Mr. Md. MusaMiah provided essential support to the work. Their engagement and commitment has been
highly appreciated.
The established and formalised co-operation between the two institutions has provensuccessful and the results are an encouragement to future collaboration.
The Norwegian governmental representation at the Royal Norwegian Embassy in Dhaka hasalso provided excellent assistance and support to our team. We would like to use this
opportunity to express our gratitude.
DET NORSKE VERITAS
Report No: 2000-3158, rev. 01
TECHNICAL REPORT
Page 2Reference to part of this report which may lead to misinterpretation is not permissible.
29 August 2000
1 INTRODUCTION
1.1 GeneralThe material composition of a vessels structure, components and systems will reflect the erafrom when it was built. Likewise, cargo-remains, system agents and onboard spares andconsumables will reflect its type and pattern of trade. At the end of the operational life, the vesselstill represents a resource, as a considerable proportion of its lightweight is suited for reuse orrecycling. However, the extraction processes required, produce debris and wastes that in it selfrepresent a threat to the environment and consequently to human health. Further, the methodsadopted in the demolition and extraction process are suffering from serious deficiencies withregard to general safety aspects.
In order to ensure the safety of workers and the environment, the extraction and demolitionprocesses requires managerial routines covering the aspect of Safety, Health and theEnvironment (SHE). Knowledge on the nature, scale and the environmental impacts of ship-scrapping as it is performed today, will be important inputs when defining such routines. Onemajor challenge is that of identifying, quantifying and locating all onboard substances ofconcern. Proper documentation on on-board substances will ease and improve the planning ofoperations necessary for the processes associated to extraction, sorting, handling refining andreuse/ recycling.
Ship breaking on the sub-Indian continent has developed into an activity of considerable volumesupplying raw material to the steel-industry for both re-rolling and re-melting. The breakingprocesses also supply second hand material and equipment for re-use both locally but also forexport.
Steel scrap from ship breaking provide as an alternative to the consume of non-renewable oreresources allowing the manufacture of steel to be undertaken significantly more energy efficient.In this perspective, ship breaking can be claimed to be a sound sustainable industrial activity.
However, the extraction of steel-scrap and materials and components for re-use, providechallenges associated to methods adopted ensuring that these are equally sustainable. Previouswork carried out by DNV has revealed an unsatisfactory level of SHE-related standards in theship-breaking industry both regarding facilities and operations.
This report addresses the objective item 3 of the project; Decommissioning of Ships –Environmental Standards (ref .:/37/). The scope is based on recommendations made in a formerstudy undertaken by DNV, (ref.: /1/).
1.1.1 Decommissioning of Ships – Environmental Standards, Objective item 3A set of recommendations for the establishment of guidelines for the ship-breaking processbased on a Best Practice Approach should be identified. These should be developed mirroringthe realities and possibilities of ship breaking of today reflecting upon present location andexisting infrastructure. Successful implementation is of utmost importance when providingrecommendations. The following aspects should be included;• General safety (work procedure and protective measures).
DET NORSKE VERITAS
Report No: 2000-3158, rev. 01
TECHNICAL REPORT
Page 3Reference to part of this report which may lead to misinterpretation is not permissible.
29 August 2000
• General waste management.• Hazardous waste management including in particular procedures associated to extraction,
removal, treatment and disposal.• Contingency plans and procedures.• Monitoring of health and the environment.The ambition of these recommendations should be to establish a base-frame representing a firststep in the process of identifying acceptable standards and norms for the industry. The“continuos improvement” approach adopted by widely recognised safety and environmentalmanagement standards might provide as an appropriate mechanism or tool in order to move theprocedures to higher levels and to ensure further development. The feasibility of such approachshould be assessed including identifying potential implementation barriers, trainingrequirements, investment requirements, etc.
A SHE-focused base-frame in the format of a “Best Practice Approach” (BPA) will require inputon current practices and aspects related to all the processes involved. This will enable prioritisingof areas for improvements associated to environmental performance and occupational safety/human health in relation to the demolition process and to provide recommendations. Actual on-site knowledge is vital in this context.
1.2 Bangladesh - ChittagongBangladesh is situated at the apex of the Bay of Bengal surrounded almost completely by Indiaexcept from a region in the south-east, which boarders to Myanmar (formerly Burma). The landarea of Bangladesh is approximately 148,393 km2 and its coastline stretches some 710 km. Withits 124 million inhabitants (1997 estimate), this is one of the most densely populated areas of theworld (with more than 800 people per km2). Bangladesh consist nearly entirely of a delta with aconsiderable number of waterways making it appear as a sheet of mosaic from the air. TheBangladsh part of the Ganges-Brahmaputra-Meghna river system carries an estimated sedimentload of more than 1060 million tons annually to the Bay of Bengal, which ranks first in sedimentflux to the oceans on a global scale (ref.: /24/). Because of heavy rainfall during the monsoonseason, which lasts from -July to October, the sediment flux is not distributed evenly through theyear. It has been reported that 70-80% of the annual rainfall on the Ganga Plain occurs duringJuly to September (ref.: /31/).
An overview of Bangladesh and the location of Chittagong is shown in Figure 1 in Appendix A.
Bangladesh is a poor country with low life duration expectancy, estimated to almost coincide formale/female at 59,5 years (1997 estimate).
Like most other developing countries, Bangladesh experiences growth in population as well as inindustrial development activities, both factors representing an increase in potentialenvironmental burden. The major pollutants are municipal and industrial waste, agro-chemicalresidues and discharge from ships and boats (international/ coastal). An increasing concern is thepollution originating from the growing ship breaking industry.
1.2.1 Environmental concern and ship scrappingThe inland network of waterways acts as drainage for water from upstream countries (India,Nepal, Bhutan and China), and bring pollutants in, adding to the input produced by Bangladeshitself. Because of its large population and numerous waterways, the amount of pollutants
DET NORSKE VERITAS
Report No: 2000-3158, rev. 01
TECHNICAL REPORT
Page 4Reference to part of this report which may lead to misinterpretation is not permissible.
29 August 2000
reaching the coast is considerable. This mechanism adds to the pollution sources located at thecoast itself.
The scrapping of ships is taking place at several sites along the coast of Bangladesh. The area ofFauzdarhat, a 16-km beach situated approximately 20-km south-west of Chittagong, isundoubtedly the most important. Parallel ship-breaking activities taking place here, represent thesecond largest facility in the world with respect to the numbers of vessels being scrapped. In size(no. of vessels scrapped per annum), only Alang/Mumbai (India) represents a larger capacity.However, these facilities are recognised by attending to smaller tonnage than that of Chittagong.Chittagong is the largest facility for large vessels, scrapping some 52% of all vessels above200.000 dwt (1997-1998). The reason being the large tidal difference providing an intertidalzone particularly suitable for beaching large vessels.
Ship-breaking was initiated in this area in 1969 and has now grown into a considerable industryoccupying a large number of people, not only in the breaking process itself, but also inassociation to the processes of refining and material re-use. It is believed that more than 100,000individuals earn for their livelihood from the scrapping activities of Chittagong.
The extent of the ship breaking area of Chittagong (Fauzdarhat) is shown in Appendix A (maps).In Appendix D, representative activities ongoing in the area is presented by photography.
The increasing number of large tankers reaching “phase-out” age is expected to increase shipbreaking and associated activities in the Chittagong area. This adds to the challenges alreadyfacing Bangladesh with respect to the environment, to human health and to safety issues.
1.3 The Best Practice Approach (BPA)The increasing concerns related to the process of ship demolition are focussing on:
• Environmental standards.• Occupational safety and health.• Contingency preparedness and disaster management.
These subjects represent the essence of the established SHE approach. The BPA must reflectupon all these three elements, as it will provide for the development of operational proceduresinfluencing Safety, Health as well as the Environment.
The BPA can perform as an element in a comprehensive management tool package. Such a tool,an Environmental Safety Manual (ESM) may make provisions as follows.:
• Management tool for ship breaking facilities.• Third party performance verification base.• Tool for development and continuous improvement.• Basis for benchmarking with other facilities.
The ESM can be developed in compliance to available standards or norms (ISO 14001).
A SHE-management system may be developed using the ESM-approach comprising of anEnvironmental Management Plan, an Occupational Safety and Health Plan, as well as aContingency Preparedness and Disaster Management Plan. An overlaying inventory of bestpractices will be governing for all these tools.
Existing DNV tools can be adopted in order to establish the structure and content of a SHE-baseline (SHE-description) (International Safety Rating System, ISRS/ International
DET NORSKE VERITAS
Report No: 2000-3158, rev. 01
TECHNICAL REPORT
Page 5Reference to part of this report which may lead to misinterpretation is not permissible.
29 August 2000
Environmental Rating System, IERS/ PROSPER). This will not refer to any specific level ofperformance but merely establish a base for the application of a system allowing the facility tomonitor and control its performance.
An Inventory of Best Practices (IBP) may include guidelines, procedures, standards andrequirements and can be identified independent upon any management system. However, theinventory should address items such as present materials and associated hazards, operationalrequirements and managerial routines, requirements associated to facilities, training and relatedmatters.
Different related tools, for example the Environmental Guidelines for Ship-Breaking Industries(EGSI) developed by the Central Pollution Control Board, Delhi, India, identifies proceduresaiming at providing for the protection of the workforce as well as the environment. Such toolsare sometimes based on national legislations not only on issues directly linked to the actual ship-breaking operation, but also with reference to siting of ship-breaking facilities, to requiredconsent from appropriate authorities and to required authorisation. An international approachshould be generic and only refer to national requirements.
Based upon the BPA, an inventory complying guidelines, procedures, standards andrequirements referring to actual operations (IBP) is addressed. The inventory will have a mutualsections for practices related to the identification and handling of materials, items and hazardscovering all involved areas (SHE).
The inventory represents minimum requirements for a ship-breaking facility. These will involvethe facilities themselves (not limited to where the vessel is beached) and also operationalprocedures adopted. Emphasis has been made on environmental safety and on human health.Adopted standards refer to national legislations or regulations where applicable.
DET NORSKE VERITAS
Report No: 2000-3158, rev. 01
TECHNICAL REPORT
Page 6Reference to part of this report which may lead to misinterpretation is not permissible.
29 August 2000
2 CURRENT PRACTICES AND SHE-RELATED IMPACTS
2.1 GeneralAn insight in actual practices adopted in the various phases of the demolition and re-useprocedures can be provided by literature. However, it becomes evident that the informationavailable, largely based upon statistics, unverifiable assumptions and 3rd. party impressions, arenot adequate in this context. In order to assess potentials for improvements, it was concluded thatexisting references did not make the necessary provisions and further, that on-hands experiencegained by on-site investigations was unavoidable.
2.2 Particulars of the vicinity of ChittagongMangroves
The area where the ship scrapping industry is located in Chittagong, used to be covered by amangrove forest, which have declined since the start of the scrapping in 1969. The mangrovesmay be seen on Figure 11 in Appendix D. A study of the mangroves was not an item of thisstudy and thus the mangroves will not be further discussed in this report. However it should beemphasised that the mangroves have many important qualities such as prevention of sedimenttransport and purifying of the water.
The ship scrapping industry is not the only one responsible for the pollution problem in thecoastal waters of Bangladesh. Dr. Khan et. al. undertook an extensive study in 1993 where thedifferent types of coastal pollution were investigated (ref.: /32/). The report concluded that “Thetime may come when it (pollution) will go beyond our control. So, for the interest of the nationwe should take immediate care of our marine health to prevent pollution”. The authors alsosuggested the following points when considering prevention of pollution of the coastal waters ofBangladesh.1. Receiving facilities for oil and oily substances should be developed in the Chittagong and
Mongala ports.2. A coastal guard system to be introduced to detect disposal of waste products and oil spills.3. The industrial effluents must be treated economically in such a way that it should not foul the
receiving environment and does not cause inconvenience to the nearby inhabitants.4. Sewage treatment plant should be installed in Chittagong and Khulna cities immediately.5. Suitable monitoring systems should be established and bioassy test of fish and water sample
may provide valuable information in combating future hazards and taking preventivemeasure.
6. If any aquatic resource faces death because of pollution, the enterpreneurs should bepenalised.
Most of these relatively comprehensive recommendations, may also be considered for the shipscrapping industry in general.
2.3 On-site assessment, ChittagongThe discussions concerning the location of an on-site activity included many aspects both oftechnical, scientific and practical character. The final decision of Chittagong, Bangladesh was
DET NORSKE VERITAS
Report No: 2000-3158, rev. 01
TECHNICAL REPORT
Page 7Reference to part of this report which may lead to misinterpretation is not permissible.
29 August 2000
reached based upon an overall consideration. However, the spirit of co-operation and expertisesharing of UOC and local authorities, was important in the decision process.
The assumption made that conditions surrounding activities connected directly or indirectly toship scrapping in this area are representative for the activity of the Sub-Indian continent ingeneral might very well be questioned. However, it rests upon the fact that the challengesassociated to the task of dismantling are met under similar terms;• Vessels are beached by own power.• Dismantling is undertaken directly on the beach.• Automation or use of “powered” tools is minimised leading to a high level of labour
intensivity.• No regulations are implemented.The diversity between ship scrapping represented by the major actors (India Bangladesh andPakistan) are associated to the type of tonnage received rather than methods adopted. Thisdifference may mirror the nature of sites available or national policies. Sites in Bangladesh aredue to large tidal differences, particularly suited for larger vessels.
The preparations for the activity included many discussions with the mentioned institutions inorder to establish practical and technical constraints and possibilities. Prior to initiating the actualsite work, work-schedules where prepared identifying the tasks to be undertaken. The planningincluded equipment checkout and procedures associated to obtaining necessary importpermissions for the planned sample import (for analysis) from appropriate authorities.
2.3.1 Work schedule and sampling planningThe on-site assessment in Chittagong was divided in three main tasks:• Sampling offshore and onshore.• Interviews with relevant personnel.• Visits to scrap processing and refining facilities.A separate task, that of visual inspection, was integrated in all work undertaken at all locationsvisited. When feasible, this was documented by filming and photography. However, the DNVteam was restricted in some areas and not allowed to film freely. This applied in particular to thebeach-areas.
During the execution of the assessment, a number of meetings were arranged with personnelfrom the UOC, from local environmental authorities and from DNV. These discussions and theclose fieldwork co-operation have clearly built relations. An overview of the activities carriedout in Chittagong is given in Appendix B.
The DNV team was to a large extent operating freely without restrictions during the assessment.However, some restrictions applied at the beach areas. Further, the team was not permitted onboard vessels being scrapped. The restrictions where claimed by the sites themselves andgrounded on reasons of safety.
DET NORSKE VERITAS
Report No: 2000-3158, rev. 01
TECHNICAL REPORT
Page 8Reference to part of this report which may lead to misinterpretation is not permissible.
29 August 2000
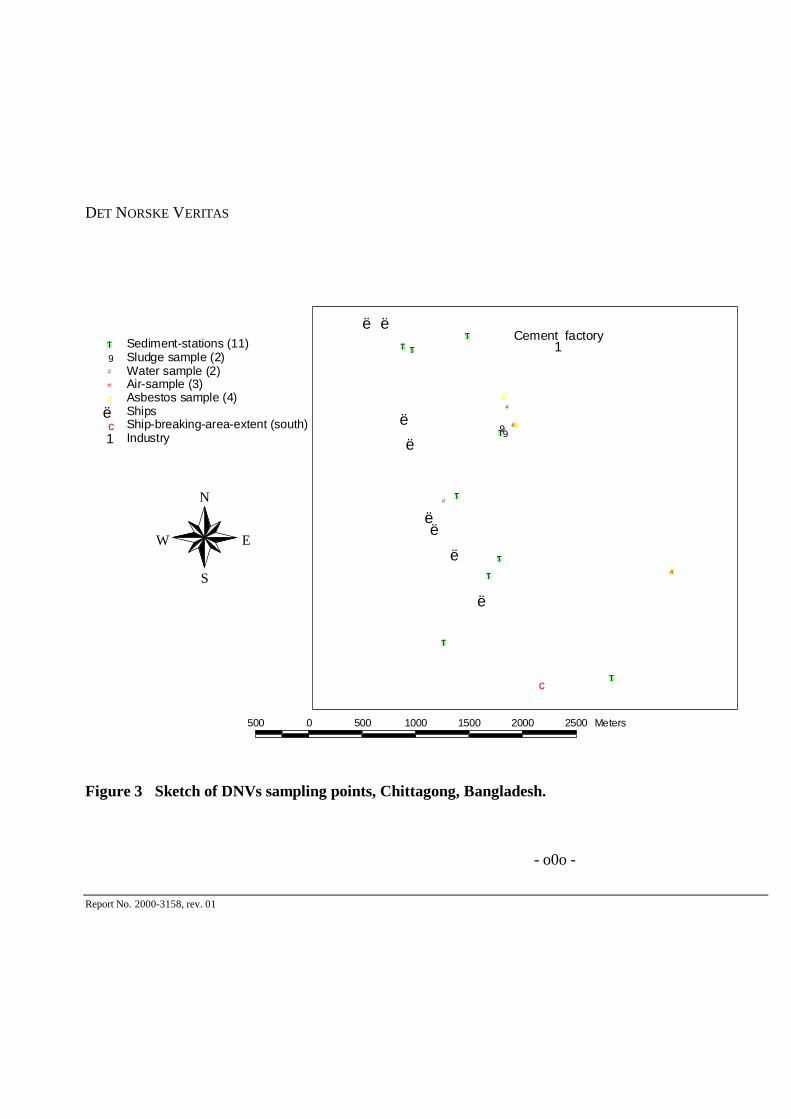
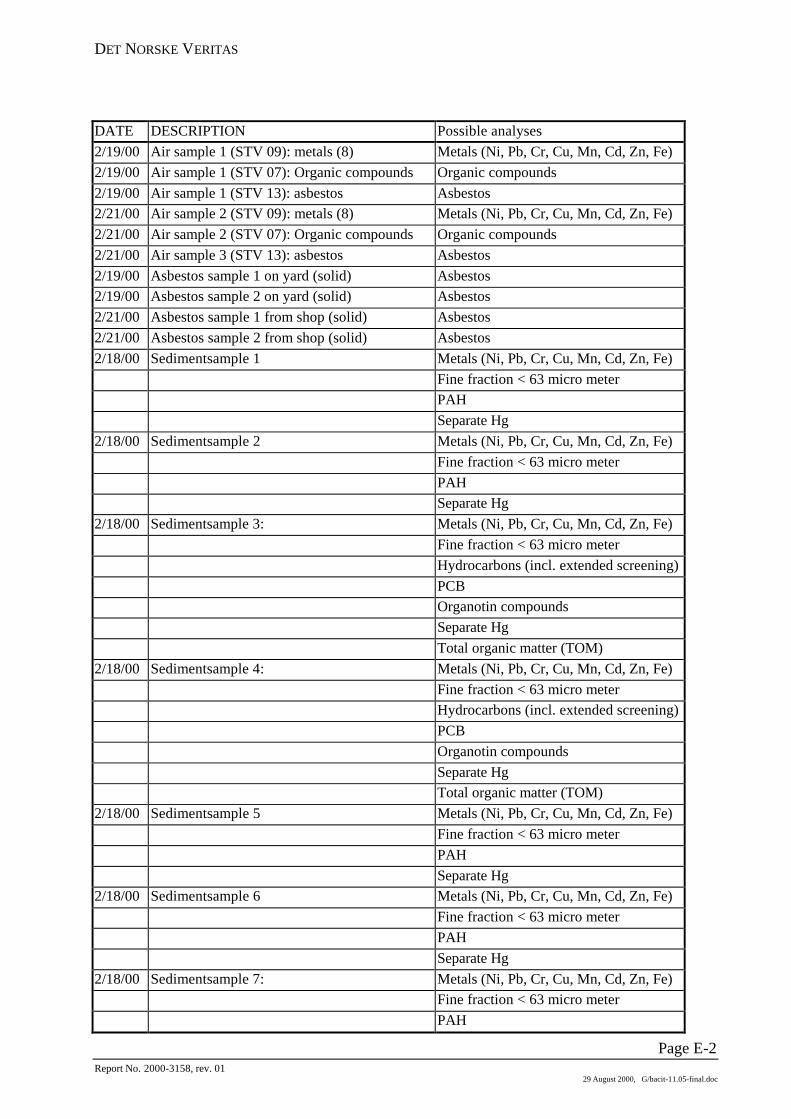
2.3.2 SamplingThe sampling programme was identified based upon previous work and conclusions (ref.: /1/)and covered; Air, Onshore (land) and Offshore (intertidal zone). Figure 2.3.2 gives an overviewof the ship scrapping area from the sub tidal zone to the reprocessing industry onshore. Figure 3in Appendix C provides an overview of sample-points. All sample-points were logged by the useof GPS. Appendix E gives a listing of sample analysis undertaken and Appendix D introduces aselection of photographic documentation from the fieldwork.
Figure 2.3.2 Overview of the scrapping area of Chittagong.
The sampling activities at the ship breaking area provided an opportunity to study the materialdistribution and subsequent refining activities from dismantling in the intertidal zone andsequential cutting onshore to carrying onto lorries for further distribution. These processes areassessed and discussed in detail in Chapter 2.6.1.
It should be noted that due to limitations regarding our ability to sequentially plan the samplingprogramme, the conditions under which sampling had to be undertaken, was not always ideal.Examples of this may be illustrated by air sampling undertaken during unfavourable windconditions, by sediment sampling (intertidal zone) on incoming tide, etc. In chapter 3, the resultsare discussed including references to the conditions under which sampling was undertaken.
Subtidal Zone
Intertidal Zone
Scrapping Yards (beach)
Road from Chittagong toDhaka
Steel Mill and relatedretirement/reprocessingindustry
Fishing Area
DET NORSKE VERITAS
Report No: 2000-3158, rev. 01
TECHNICAL REPORT
Page 9Reference to part of this report which may lead to misinterpretation is not permissible.
29 August 2000
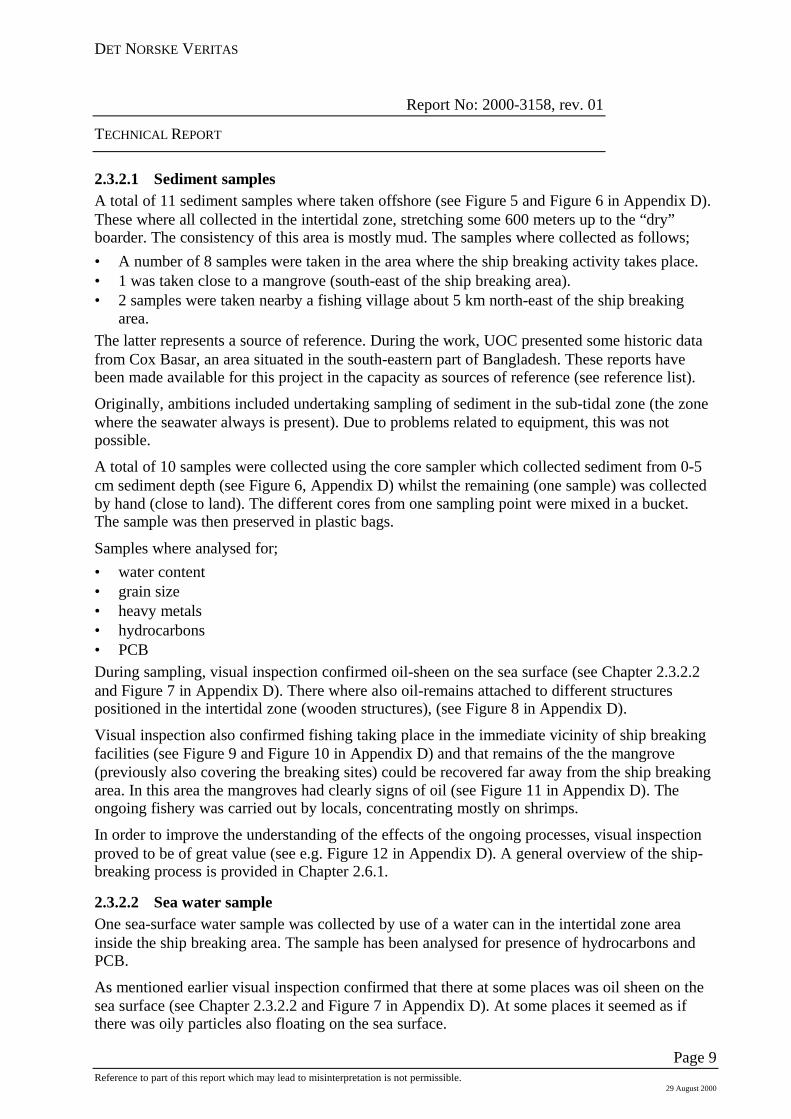
2.3.2.1 Sediment samplesA total of 11 sediment samples where taken offshore (see Figure 5 and Figure 6 in Appendix D).These where all collected in the intertidal zone, stretching some 600 meters up to the “dry”boarder. The consistency of this area is mostly mud. The samples where collected as follows;• A number of 8 samples were taken in the area where the ship breaking activity takes place.• 1 was taken close to a mangrove (south-east of the ship breaking area).• 2 samples were taken nearby a fishing village about 5 km north-east of the ship breaking
area.The latter represents a source of reference. During the work, UOC presented some historic datafrom Cox Basar, an area situated in the south-eastern part of Bangladesh. These reports havebeen made available for this project in the capacity as sources of reference (see reference list).
Originally, ambitions included undertaking sampling of sediment in the sub-tidal zone (the zonewhere the seawater always is present). Due to problems related to equipment, this was notpossible.
A total of 10 samples were collected using the core sampler which collected sediment from 0-5cm sediment depth (see Figure 6, Appendix D) whilst the remaining (one sample) was collectedby hand (close to land). The different cores from one sampling point were mixed in a bucket.The sample was then preserved in plastic bags.
Samples where analysed for;• water content• grain size• heavy metals• hydrocarbons• PCBDuring sampling, visual inspection confirmed oil-sheen on the sea surface (see Chapter 2.3.2.2and Figure 7 in Appendix D). There where also oil-remains attached to different structurespositioned in the intertidal zone (wooden structures), (see Figure 8 in Appendix D).
Visual inspection also confirmed fishing taking place in the immediate vicinity of ship breakingfacilities (see Figure 9 and Figure 10 in Appendix D) and that remains of the the mangrove(previously also covering the breaking sites) could be recovered far away from the ship breakingarea. In this area the mangroves had clearly signs of oil (see Figure 11 in Appendix D). Theongoing fishery was carried out by locals, concentrating mostly on shrimps.
In order to improve the understanding of the effects of the ongoing processes, visual inspectionproved to be of great value (see e.g. Figure 12 in Appendix D). A general overview of the ship-breaking process is provided in Chapter 2.6.1.
2.3.2.2 Sea water sampleOne sea-surface water sample was collected by use of a water can in the intertidal zone areainside the ship breaking area. The sample has been analysed for presence of hydrocarbons andPCB.
As mentioned earlier visual inspection confirmed that there at some places was oil sheen on thesea surface (see Chapter 2.3.2.2 and Figure 7 in Appendix D). At some places it seemed as ifthere was oily particles also floating on the sea surface.
DET NORSKE VERITAS
Report No: 2000-3158, rev. 01
TECHNICAL REPORT
Page 10Reference to part of this report which may lead to misinterpretation is not permissible.
29 August 2000
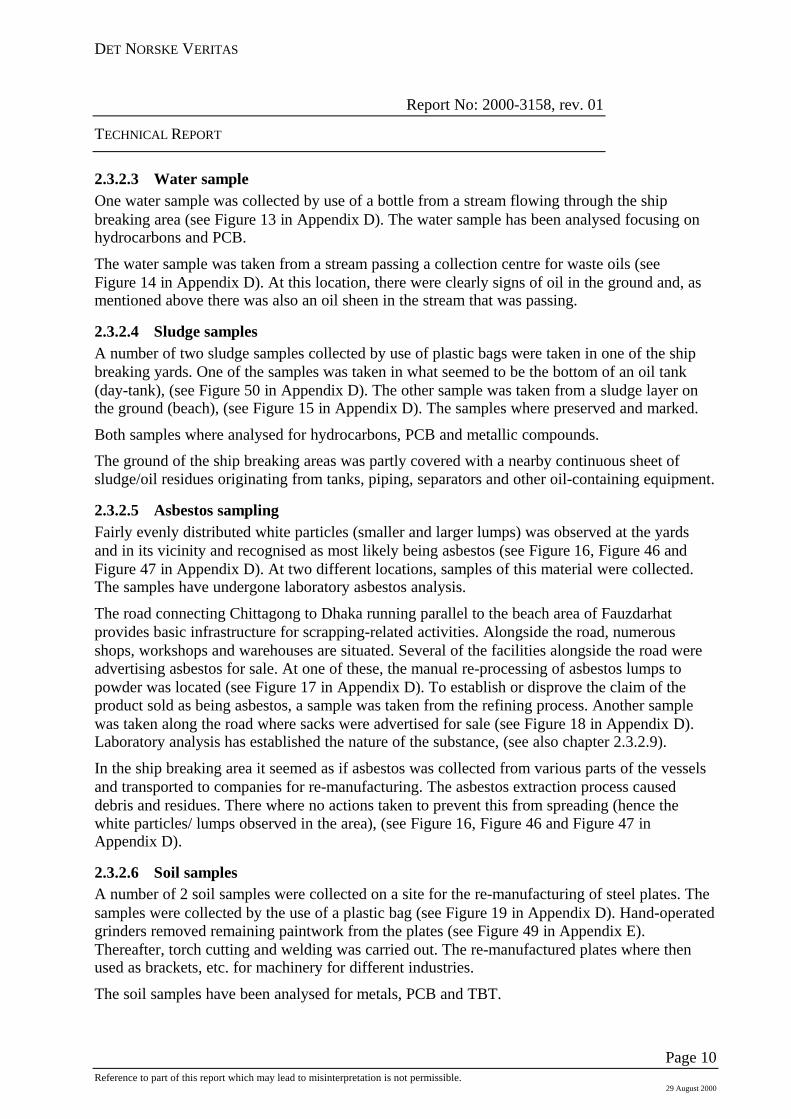
2.3.2.3 Water sampleOne water sample was collected by use of a bottle from a stream flowing through the shipbreaking area (see Figure 13 in Appendix D). The water sample has been analysed focusing onhydrocarbons and PCB.
The water sample was taken from a stream passing a collection centre for waste oils (seeFigure 14 in Appendix D). At this location, there were clearly signs of oil in the ground and, asmentioned above there was also an oil sheen in the stream that was passing.
2.3.2.4 Sludge samplesA number of two sludge samples collected by use of plastic bags were taken in one of the shipbreaking yards. One of the samples was taken in what seemed to be the bottom of an oil tank(day-tank), (see Figure 50 in Appendix D). The other sample was taken from a sludge layer onthe ground (beach), (see Figure 15 in Appendix D). The samples where preserved and marked.
Both samples where analysed for hydrocarbons, PCB and metallic compounds.
The ground of the ship breaking areas was partly covered with a nearby continuous sheet ofsludge/oil residues originating from tanks, piping, separators and other oil-containing equipment.
2.3.2.5 Asbestos samplingFairly evenly distributed white particles (smaller and larger lumps) was observed at the yardsand in its vicinity and recognised as most likely being asbestos (see Figure 16, Figure 46 andFigure 47 in Appendix D). At two different locations, samples of this material were collected.The samples have undergone laboratory asbestos analysis.
The road connecting Chittagong to Dhaka running parallel to the beach area of Fauzdarhatprovides basic infrastructure for scrapping-related activities. Alongside the road, numerousshops, workshops and warehouses are situated. Several of the facilities alongside the road wereadvertising asbestos for sale. At one of these, the manual re-processing of asbestos lumps topowder was located (see Figure 17 in Appendix D). To establish or disprove the claim of theproduct sold as being asbestos, a sample was taken from the refining process. Another samplewas taken along the road where sacks were advertised for sale (see Figure 18 in Appendix D).Laboratory analysis has established the nature of the substance, (see also chapter 2.3.2.9).
In the ship breaking area it seemed as if asbestos was collected from various parts of the vesselsand transported to companies for re-manufacturing. The asbestos extraction process causeddebris and residues. There where no actions taken to prevent this from spreading (hence thewhite particles/ lumps observed in the area), (see Figure 16, Figure 46 and Figure 47 inAppendix D).
2.3.2.6 Soil samplesA number of 2 soil samples were collected on a site for the re-manufacturing of steel plates. Thesamples were collected by the use of a plastic bag (see Figure 19 in Appendix D). Hand-operatedgrinders removed remaining paintwork from the plates (see Figure 49 in Appendix E).Thereafter, torch cutting and welding was carried out. The re-manufactured plates where thenused as brackets, etc. for machinery for different industries.
The soil samples have been analysed for metals, PCB and TBT.
DET NORSKE VERITAS
Report No: 2000-3158, rev. 01
TECHNICAL REPORT
Page 11Reference to part of this report which may lead to misinterpretation is not permissible.
29 August 2000
All activity on this site took place directly on the ground, thus all residues from the refiningprocesses were deposited directly on the ground.
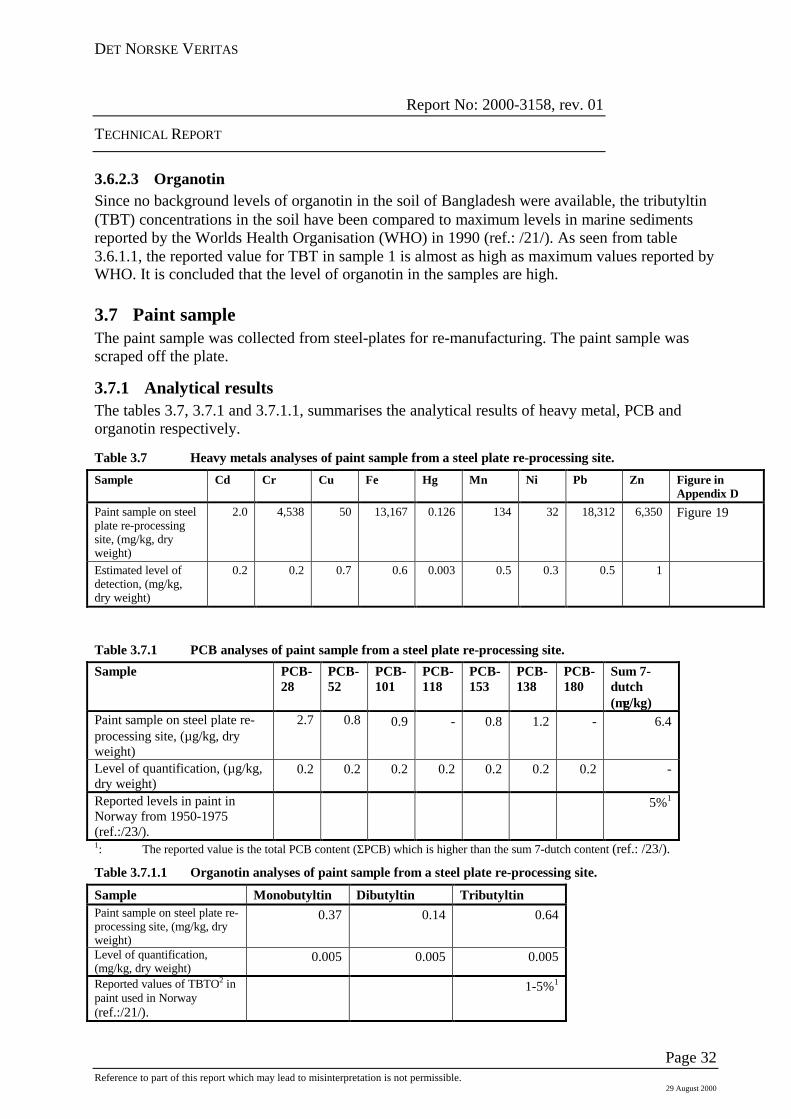
2.3.2.7 Paint sampleOne paint sample was stripped off steel plating at the steel plate re-manufacturing plant, see item2.2.2.6 and Figure 20 in Appendix D.
The paint sample was analysed for metals, PCB and TBT.
2.3.2.8 Electrical cable sampleOne sample of insulation material surrounding electrical cabling was collected. This has beenanalysed for PCB.
Electrical cables were offered for sale in many of the shops along the roadside, (see Figure 21 inAppendix D). The traders informed that all damaged cabling was sorted and the insulationburned off in open fires at the breaking sites (see Figure 48 in Appendix D), whilst the remainingwas sorted and sold. Burning of PVC-cables on ordinary fires may give discharge of e.g. dioxinsand dust to the air. This will give both local and non-local effects.
2.3.2.9 Air samplesIn the ship breaking area, three different air samples were taken:• Asbestos.• Heavy metals.• Organic compounds.Two different pumps supplied a stream of air through two different filters for asbestos and heavymetals. These where situated in the immediate vicinity of the welding and cutting stations (seeFigure 22 in Appendix D). At the same location, a pump connected to a cartridge filled with amedium to capture organic compounds was also installed. The air sampling procedure wasongoing for four hours.
The first two hours the wind direction was toward the pumps and thus it is expected that thefilters/cartridge would detect possible polluted air. During the two latter hours the wind declined(landbreeze) and it is expected that the filters/cartridge recived less polluted air through the inlet.
Respective filters/cartridge was analysed for asbestos, heavy metals and organic compounds.
Air samples were also collected at the steel plate re-manufacturing facility (se chapter 2.3.2.6). Awelder was equipped with air sampling equipment similar to that described above and samplingfor organic compounds (see Figure 23 in Appendix D) was undertaken. Another workeroccupied with the operation of an automatic torch-cutting unit was equipped with the same typeof sampling equipment but modified for heavy metal sampling. The sampling interval wasapproximately 3 hours.
The samples were analysed for heavy metals and organic compounds.
At the location described in chapter 2.3.2.5 (alongside the road to Dhaka), air samples wascollected, simulating respiration and potential of asbestos uptake by the workers occupied in theasbestos re-manufacturing processes. At this site, workers where occupied in crushing thesubstances (traded further as asbestos), by the use of wooden clubs. The sampling procedure isillustrated in Figure 24 Appendix D. The sampling sequence lasted for some two hours.
DET NORSKE VERITAS
Report No: 2000-3158, rev. 01
TECHNICAL REPORT
Page 12Reference to part of this report which may lead to misinterpretation is not permissible.
29 August 2000
The respective filters/cartridges have been analysed for asbestos.
The general extraction activities in the actual ship breaking area, those of welding, torch cutting,dismantling, wincing, and plate-carrying, generated smoke and dust possibly containingasbestos, heavy metals, etc., resulting in poor air quality. Similar conditions where observed atsome of the refinement plants.
At the asbestos-refinement plant, material residues covered the entire area, (see Figure 25 inAppendix D). The manual crushing generated visible clouds of dust. A warehouse where both“raw” and refined asbestos was kept was identified. This facility was located close to the heavilytrafficated road and close to housing facilities.
2.4 Interviews2.4.1 GeneralIn gathering information related to the processes of the ship scrapping and related activities, anumber of individuals at different levels were interviewed. These interviews are documented inChapter 2.5. Some of the interviews were documented by use of digital video camera whilstothers by written notes.
These interviews where specific and to some degree circumstantial. However, attempts wasmade to followed a certain pattern. This is illustyrated by the bullets below:
• Name and age.• Present type of work.• Experience duration and job variation (within ship scrapping).• Salary.• General view on own job situation.• Accidents; type(s), number, injuries/ casualties, compensation.• Health problems caused by ship scrapping.• Environmental problems caused by ship scrapping.
2.5 Summary of interviewsThe table below (table 2.5) is a listing of interviews undertaken and provides a condensedsummary of statements and information that was given. The essence of the information isextracted in the light of making provisions in a Best Practice Approach (BPA) context.
DET NORSKE VERITAS
Report No: 2000-3158, rev. 01
TECHNICAL REPORT
Page 13Reference to part of this report which may lead to misinterpretation is not permissible.
29 August 2000
Table 2.5 Overview of information gathered during the interviews of the different people.
Mr. Khan has worked in the environmental area fore several years and hashad several visits to the ship-breaking area. Thus he was familiar with theactivities and had great knowledge and acted as a “door opener” to the shipbreaking facilities. He provided us with the following information:• Normal age of an employee in the ship breaking yards is 15-35 years.• Average age is about 25 years.• Normally the workers are seeking other kind of jobs outside the ship
breaking area, but often this area is the only place where jobs areavailable.
• About 50-100 employees are killed each year in different kinds ofaccidents e.g. explosions and falling objects.
• There are about 50 different ship breaking yards in the area ofChittagong.
• Each yard is buying the vessels themselves and there is normally no co-operation between the different yards.
• One yard may have 2-3 vessels at the same time. Normally only one isscrapped at the time.
• Ships may also spend some time at anchor outside the coast before theyare brought to the actual scrapping site.
• The owner of the yards hire work leaders, which in turn hire a numberof workers that work for and get paid directly by the leaders.
Employment inship-breakinghave a low“status”. Most ofthe individualsoccupied areilliterate and donot have otherjob-alternatives.A large numberare from areasoutsideChittagong.Work isundertaken withhand-toolswithout any typeof protective gear.
S.M.AJabber.ResearchFellow.(UOC),(ref.: /10/)
Mr. S.M.A Jabber is student at the University of Chittagong and also aresearch fellow in the Environmental company Entermet. He provided uswith the following information:• The ship scrapping in Chittagong started in 1965.• The vessels are run ashore on high speed at high tide with minimal
ballast into the intertidal zone. The vessels flat bottom allows them tolie stable on the silt/sand/clay bottom.
• The vessels are then cut by use of torch-cutter and all kinds ofequipment is floated onshore by use of air filled barrels or transportedby small boats e.g. lifeboats (see Figure 26 and Figure 27 in AppendixD).
• Large sections are pulled ashore on high tide by the use of winches (seeFigure 28 in Appendix D).
• The plates are then cut to certain sizes and are then hand carried fromthe shore to lorries that are transporting the plates to different kind ofindustries (see Figure 29 in Appendix D).
• About 30 workers are needed to carry the largest plates and accidentsare happening (especially during the rain season, when the ground isvery slippery).
• All other kind of equipment is taken to different kinds of shops and remanufacturing companies (see Figure 30 in Appendix D).
• Oil and other pollution from ships that is deposited in the intertidal zoneis taken away by the tidal water. The tidal water difference is about 6meters.
• It takes in average 5 months to scrap a vessel. However this of coursedepends upon the size and type of ship in addition to the demand forscrapping products.
• The fishing activity has declined in the scrapping area during the lastdecades.
Prior to beingbeached, thevessels are oftenquayed in theharbour ofChittagong wherevaluablecomponents aredismantled(communicationequipment,navigational aids,generalelectronics).Fishing isundertaken in thedirect vicinity ofthe ship breaking.The fish is offeredfor sale in themarkets ofChittagong.
DET NORSKE VERITAS
Report No: 2000-3158, rev. 01
TECHNICAL REPORT
Page 14Reference to part of this report which may lead to misinterpretation is not permissible.
Md. Shamsul Alam is owner of the company M/S. Universal Trader’s whichis dealing with all kinds of iron goods retail and whole seller. He providedus with the following information:• His company is mostly trading with anchor chains from vessels.• Small chains are often reused and sold to ships in operation.• Large chains are cut and sold to re-rolling mills (see Figure 31 in
Appendix D).• The following prices for different types of metal are typical:
• The owners often own more than one “shop”, so that they can followthe product from the ships to the consumer. Mr. Alam had interests inshops dealing with chain and steel plates, in a re-rolling plant and ashop that sells iron bars to the consumers.
• A lot of effort (manpower, time) is put into the sorting process ofdifferent metals and qualities, in order to maximise the profit when thedifferent scrapping materials and items are resold. (This is possible,since the labour is very cheap.)
Md. Yousuf is managing director in FUCHS-GHL Lubricants in Chittagong.He had earlier a company that regenerated waste oil from ships, cars etc.This company is now a joint venture with the company FUCHS (ofGermany). He provided us with the following information:• Waste oil and lubricating oil from the vessels is normally collected in
the ships and regenerated by this company (see Figure 32 in AppendixD).
• The raw material and final products are checked in the company’s ownlaboratory (see Figure 33 in Appendix D).
• The rebuilding of the plant that were going on, used almost only partsfrom the ship scrapping industry (pipes, steel plates, valves, separatorsetc.).
• The workers inside the plant were encouraged to use safety equipment,but because of the temperature and humidity, they were reluctant to useit.
Collected by theship breaker whoat that point is theowner of thevessel.
Some safetyequipment wasobserved whilevisiting thefacility.
Interviewwith foremanfor workersthat were re-processingasbestos,(ref.: /13/).
The foreman is in charge of 5-6 workers occupied with re-processingasbestos (see Figure 17, Figure 24 and Figure 25 in Appendix D). Heprovided us with the following information:• Earlier there was no market for used asbestos and the asbestos was
thrown into the sea.• Now re-processed asbestos is mainly sold to industries in Dhaka where
it is used in the production of new asbestos used to coat boilers. E.g. thecotton mill industry is using this asbestos.
• Before the price for asbestos was about 2 taka/kg. Today the price is 14-15 taka/kg.
• His company is regenerating 2-4 tons of asbestos each year.• No one of the workers that are crushing asbestos is normally using
masks and other protective equipment.• No one of the workers is feeling sick.• There are about 100.000-200.000 persons working directly or indirectly
with the ship breaking industry.
100 taka ˜ 2US$(February 2000)
DET NORSKE VERITAS
Report No: 2000-3158, rev. 01
TECHNICAL REPORT
Page 16Reference to part of this report which may lead to misinterpretation is not permissible.
29 August 2000
2.6 Scrap Processing – Organisation and procedures2.6.1 Background and administrationThe ship breaking industry at Fauzdarhat in Chittagong was initiated in 1969. The nature of thissite offered many advantages making it particularly suited for ship breaking:
• A long uniform intertidal zone.• A tidal difference of 6 meters.• Protection by the Bay of Bengal.• Stable weather conditions.• Low labour costs.• Some existing infrastructure (connected to the capital (Dhaka) by road and railway).
The seashore including adjacent areas are state owned. The ship breaking yards themselves arehowever privately owned and thus the area they occupy is leased from the government. The set-up or establishment of such a site is subjected to an application procedure. Governmentalplanning and administration concerning this is handled by the Mercantile Marine Department.
Details regarding permissions concerning establishments on the actual seashore areadministrated by local authorities (Chittagong Port Authority) whilst those concerning theadjacent inland areas are dealt with by Bangladesh Inland Water Transport Authority (BIWTA).Environmental matters associated with the ship breaking yards are under the jurisdiction of theDepartment of Environmental Pollution Control (ref.: /5/).
Import of vessels to Bangladesh for breaking is subjected to a governmental authorisationprocedure. In essence, an import license is required. The Department of Industries issues these.
2.6.2 Ship breaking capacityIn the year of 1983 there were 32 companies involved in the scrapping industry in Chittagong.Typically, a number of 40 vessels could be in different stages of the process at then same time.Today there are approximately 50 established ship-breaking yards on this beach-area (ref.: /5/).During DNVs assessment, a number of 26 vessels beached and under demolition were counted inthe area. The “run-through” time from when a vessel arrive to when its final structure is removedvary according to size and demand. However, it was suggested that the demolition process for aVLCC can be undertaken in 5-6 months.
It is expected that ship-scrapping activities along the beaches of the Chittagong coastline willincrease during the next few years. The reason being that the area is well suited for beachinglarge vessels (such as large crude carriers (VLCC’s) and bulk carriers) and that the demand forsuch facilities are increasing. The expected peak in number of scrapping candidates areincreasing following the initiatives of IMO aiming at phasing out old tonnage and the buildingboom of the 70’s (ref.: /1/). The discussions following the “Erica-incident” on the use of ageingtonnage might even accelerate this. It should be noted however, that the market demand (i.e. oilfreight) also will be among driving factors.
2.6.3 The scrapping processThe various activities involved follows a sequential pattern as illustrated in figure 2.6.3.
DNV was informed that approximately 50,000 people are engaged directly in the ship scrappingindustry at the actual yards (ref.: /9/). However including the indirect employment created by re-
DET NORSKE VERITAS
Report No: 2000-3158, rev. 01
TECHNICAL REPORT
Page 17Reference to part of this report which may lead to misinterpretation is not permissible.
29 August 2000
fabrication, recycling and re-sales, it was claimed that the total number of jobs dependent uponthe scrapping activities lies somewhere in the region between 100,000 and 200,000. Thus themajority of people working with ship scrapping are not working in the ship scrapping yards, butare engaged with activities mainly connected to the latter stages in the reprocessing of materials/components.
Figure 2.6.3 Overview of scrapping process.
2.6.4 General description of the scrapping processThe 26 vessels identified during the DNV on-site assessment represented different stages of thescrapping process. Exact details of these vessels has not been obtained, neither was permission togo onboard granted. However, it is established that both categories of large vessels, tankers andbulk carriers, were represented.
The scrapping process is undertaken individually and seems to follow a certain pattern. In figure2.6.4, a listing of the various processes from arrival of the vessel in Bangladesh’ water to finaldestination of different compounds/materials is illustrated.
In the intertidal zone:• Dismounting of equipment• Cutting in large pieces
On the beach:• Sorting of components• Further cutting in suitable pieces for
further transport
Refinement processes/ end-use:• Re-use as is of different
Page 18Reference to part of this report which may lead to misinterpretation is not permissible.
29 August 2000
Figure 2.6.4 Overview description of the organisation of the scrapping process.
Offshore – quayside (Chittagong harbour)• Some sources claimed residues of cargo and oil were collected and tanks washed. However, the existence of
any waste reception facilities could not be established or documented.• Valuable components are dismounted and sold to second hand market (e.g. small motors and pumps, navigation
equipment, life saving equipment, furniture, electrical cabling, see Figure 21and Figure 30 in Appendix D).
Intertidal zone• The vessel is beached by own propulsion power at high tide. On low tide the vessels are lying stable on their
flat bottom (see Figure 34 in Appendix D).• The stern aft of the propeller is dismounted. The stern is divided into two parts along the centreline of the
vessel. The two parts are dropped down into the sea and winched to the shore at high tide. The propeller is thenremoved (see Figure 35 in Appendix D).
• Hull (side) plating is removed beneath normal waterline by the use of torch cutting equipment in order to gainaccess to engine room and adjacent areas. Equipment is then disassembled and taken ashore (e.g. pipelines,boilers, separators and pumps). Larger components, engines/generators, are broken down and sent for re-melting (see Figure 12 and Figure 36 in Appendix D).
• The items are dumped or lowered down through the hull openings. The items are then floated by use of airfilled oil barrels or by boats on high tide (see Figure 27 in Appendix D) ashore.
• The straight steel plates along the centre section is then dismounted (and sold for refurnishment). Outer hullplates are removed first followed by bulkhead structure. The outside plates are retained at the bottom in order toavoid water intrusion. The plates are dumped in the mud and then winched to shore, (see Figure 12 andFigure 36 in Appendix D).
• The bow is cut free from the rest of the hull and winched to the shore.• When the bow is removed, whole section of the ship is cut loose and winched ashore.
Onshore – in the scrapping yard• The bow, steel plates and sections are cut into smaller pieces suitable for further transportation by lorry. Torch
cutting, winches, manual pulling and crowbars are in use (see Figure 26 in Appendix D).• Different pieces/materials are carried by from 1 to up to 30 people from the beach to temporary storage sites
(see Figure 29 in Appendix D).• At these temporary sites, materials are sorted in different piles. The materials are unified into the same
“standard” sizes, cut if necessary, and stored in separate piles for plates with different thickness, pipes ofdifferent diameters, etc. (see Figure 37 in Appendix D).
• In order to achieve the highest prices, all equipment components are disassembled e.g. valves, flanges andgaskets are disassembled from the pipelines.
• All materials that have been temporarily stored are then manually lifted onto lorries carrying the material to thenext stage in the process.
Onshore – final destination• From the scrap yard the different materials are transported to local processing industry e.g. steel mills, steel
plate re-manufacturing, asbestos re-manufacturing, lubricating oil regenerating etc. (see Figure 17, Figure 31,Figure 32 and Figure 40 in Appendix D).
• Materials/components that could be reused is sent to the second hand market.• Many of the refinement/re-sale plants/shops are situated alongside or close to the road from Chittagong to
Dhaka (see Figure 30 in Appendix D).• Different types of materials are often reprocessed and sold in certain “recycling areas/streets”, e.g. steel plates
are reprocessed in one area/street, while toilets are sold in another area/streets and so on.
DET NORSKE VERITAS
Report No: 2000-3158, rev. 01
TECHNICAL REPORT
Page 19Reference to part of this report which may lead to misinterpretation is not permissible.
29 August 2000
2.7 Visited scrap processing and refining facilitiesIn order to assess material utilisation and processes involved in the material flow originatingfrom the actual ship demolition procedures, some scrap processing and refining facilities werevisited.
2.7.1 Cold rolling millThere are several steel mills including re-rolling mills in the vicinity of the scrapping site (within2 to 10 km). Local sources informed that approximately 400 such facilities were established inthe region.
Plating from the vessel is sorted and some is re-used rather than reprocessed in the mills. Rawmaterial to the steel mills does not only include that of plating.
The DNV team visited a cold rolling mill processing steel plating into reinforcement steel bars.Steel plating was firstly cut into manageable rectangular sheets and then cut alongside in strips ofa width of approximately 10 – 15 cm by use of a hydraulic cutting scissors (see Figure 38 inAppendix D). These where then pre-heated in a gas-fired oven to 1,100 – 1,200 °C (seeFigure 39 in Appendix D) prior to being fed into the rolling unit. All handling of the steel unitsare undertaken manually. The plates are not cleaned (paintwork/oil residues) prior to heating.The rolling unit can be fitted with different moulds allowing steelbars of different surface-patterns and diameter to be produced (see Figure 40 in Appendix D). The steel bars were thentemporarily stored until the temperature dropped to that of the surrounding. The rods where bentinto boundless and loaded onto lorries for transportation to markets/customers (see Figure 41 inAppendix D).
Most of the equipment that was in use at the plant was products from items arriving from theship demolition process. The hydraulic cutting scissors were modified workshop equipment,while the moulds were made out of propeller shafts from ships.
The facility was well planned and laid out. The work procedures seemed well organised. Theactivities took place in a shed with roof but no walls. Precautions preventing residues fromentering the ground (oil from machines, PCB, TBT and heavy metals from plates) was absent.The workers did not use any protective equipment. The potential for personal injuries seemedhigh.
2.7.2 Steel plate re-manufacturingAt this facility, the paint on the steel plates where removed by use of grinders (see Figure 49 inAppendix D). Torch cutting and welding was carried out in order to achieve correct plate sizes.Re-manufactured plates are used for different applications, e.g. in structure suspendingapplications, as brackets and similar for different types of industries.
The facility seemed well organised and efficiently managed. However all activities were carriedout in the open air directly on the ground with the potential of causing pollution (to soil) of PCB,TBT and heavy metals (from plates). Due to the welding and cutting activity there is also thepossibility of local pollution of the air first and most affecting the workers engaged. The workersdid not carry any protective equipment of any sort. Again, the potential of injuries seemed high.
(This facility was included in the sampling schedule, see chapter 2.3.2.7/ 2.2.2.9).
DET NORSKE VERITAS
Report No: 2000-3158, rev. 01
TECHNICAL REPORT
Page 20Reference to part of this report which may lead to misinterpretation is not permissible.
29 August 2000
2.7.3 Chain and steel processing (trading)This facility specialised in higher quality raw steel. Steel plates and different steel equipmentfrom the vessels were cut, prepared and sorted before being sold for production of new steelproducts. Chain steel is of a higher quality than steel from plating and is therefore processedseparately, giving a higher return (price). Shafts are of very high quality and highly sought after.Chains up to 3 inches were resold (as chain) if in good condition. The larger dimensions anddamaged chain are cut into manageable pieces and sold for re-melting/re-rolling (see Figure 31in Appendix D).
The working procedures seemed well organised but precautions both regarding the protection ofworkers engaged as well as the environment was totally absent. All activities took place in theopen directly on the ground.
2.7.4 Lubricating oil re-manufacturingThis facility produces lubricants from recaptured lube-oil remains arriving from the scrappingcandidates. The products are sold on the open market as regenerated lubrication oil. Theprocessing plant was at the time under upgrading being rebuilt. The existing process facility wasbuilt up by equipment arriving from the scrapping activities (see Figure 32 and Figure 33 inAppendix D).
The facility was very well managed and the renewed part seemed to confirm more or less towestern standards. The older part however, lacked facilities for drainage/leakage collection. Theworkers engaged were not wearing any protective equipment.
It should be noted that this facility was recently partly bought up by the German oil productmanufacturer Fuchs.
2.7.5 Asbestos re-processingThis facility consisted of sheds used for material storage whilst the actual re-processing went onin the open directly on the ground. Asbestos residues in the form of casted lumps provided asraw material in a process involving manually crushing to a powder-alike substance. This productwas then sold as asbestos. The tools used were that of wooden hand-clubs.
The end product was bagged and sent to Dhaka for the production of new asbestos components(boiler insulation).
This site appeared disorganised with a mix-up of asbestos in clogs, flakes and sheets all around.From inspections carried out, it is evident that the site was heavily contaminated by asbestos.This includes both air and ground.
The workers where sitting in the asbestos residues breathing visually contaminated air (dustclouds) without any form of protection. The DNV-team provided protective asbestos mask forthe workers (see Figure 17, Figure 24 and Figure 25 in Appendix D).
2.7.6 Trade facilitiesAlong the road from Chittagong to Dhaka, several shops where located offering almost anythingone expect to be found onboard a vessel (see Figure 30 in Appendix D). Examples are:
- Small motors, pumps and machines (e.g. lathe).- Navigation equipment (e.g. sextants).
DET NORSKE VERITAS
Report No: 2000-3158, rev. 01
TECHNICAL REPORT
Page 21Reference to part of this report which may lead to misinterpretation is not permissible.
29 August 2000
- Life saving equipment (e.g. life buoys, lifeboats, life west), (see Figure 42 in AppendixD).
- Personal protective equipment (e.g. helmet, boots, gloves, overalls)- Chemicals and paint (see Figure 43 in Appendix D).- Different steel parts (e.g. anchor, chains, ventilation parts, pipes).- Toilet and sanitary equipment (e.g. toilets, sink, and bathtubs), (see Figure 44 in
Appendix D).- Furniture (e.g. sofa, chairs, tables, beds).- Electrical cabling (undamaged cables are reused while damaged cables are burned) and
batteries (see Figure 21 in Appendix D).- Insulation material (e.g. asbestos and mineral wool).
The area seemed to be organised in sections; in one area reprocessed steel components ofdifferent types were offered by different traders, whilst in the next area some other reprocessedproduct types could be found.
Most components were stored directly on the ground or in small shops/warehouses.
DET NORSKE VERITAS
Report No: 2000-3158, rev. 01
TECHNICAL REPORT
Page 22Reference to part of this report which may lead to misinterpretation is not permissible.
29 August 2000
3 ANALYSIS AND RESULTSAll samples taken were transported to Norway and analysed at SINTEF Applied Chemistry,Oslo. An analysis-schedule was developed based upon previous work (ref.: /1/), observationsduring the on-site assessment and discussions with the laboratory.
An overview of the analysis undertaken is provided in Appendix E, while the results from thelaboratory analysis are presented in Appendix F. In the following sub-chapters the differentresults are presented and discussed.
3.1 Sediment samplesThe exact location of the sediment samples (11) collected in the intertidal zone outside the coastof Chittagong (North of the Karnafully river mouth) is provided in Figure 3.1 (station layout).The red flags indicate the northern and southern limits of the ship scrapping area (based on siteobservation by DNV). For an overview map for Bangladesh and Chittagong see Figure 1 andFigure 2 in Appendix D.
Due to the large tidal difference, there is a strong tidal current in addition to coastal current goingalong the shore. These two currents provide a “washing” action providing a “dilution” effect.The load of heavy metals, hydrocarbons and other spillage from the scrapping sites and othersources along the coast are spread (diluted) over a large area. A lesser dynamic scenario wouldgive expectations to significant background pollutant levels. Another factor influencing thesediment characteristics in all of the Bay of Bengal is the large amount of sediment that is carriedto the sea with the Ganges-Brahmaptura-Meghna (GMB) river system. Milliman et al. reportedin 1995 that the GBM river system offers the passage of an estimated sediment load of more than1,060 million tons annually to the Bay of Bengal, which ranks first in sediment flux to the oceanson a global scale. Islam et. al. (1999) reported that of the total suspended sediment load (i.e.1,037 million tonnes) transported by these rivers, only 525 million tonnes (c. 51% of the totalload) are delivered to the coastal area of Bangladesh and the remaining 512 million tonnes aredeposited within the lower basin, offsetting the Subsidence /31/. This sediment load is not spreadevenly over the year, because of the large amount of water that passes through the area duringthe Monsoon period. The enormous amount of sediment in the water and strong tidal currentresults in a very dynamic system of sedimentation and re-suspension in the intertidal zone. Thismake investigation of sediment chemistry very complicated. The international standards forsediment quality may therefore not be an optimal.
DET NORSKE VERITAS
Report No: 2000-3158, rev. 01
TECHNICAL REPORT
Page 23Reference to part of this report which may lead to misinterpretation is not permissible.
29 August 2000
Figure 3.1 Station layout, map showing the location of the sediment sampling. The land sea boarder isadded to the map manually, and is therefore inaccurate, while the actual stations aremapped from GPS co-ordinates.
3.1.1 Particulate size distribution & total organic carbon - analytical resultsThe particulate size distribution analysis conducted by SINTEF show that the silt and claycontent dominated in all the sediment samples, ranging from 67.4% to 99.6% (dry weight). Instation 1, 2, 3, 6 and 11, the <63µm fraction added up to more than 90%, while it in station 4, 5,9 and 10 added up to more than 80% (same fraction). The TOM (total organic matter) contentwas low in all the investigated samples (3, 4, 8 and 10), ranging from 3.8% on station 8 to 5.3%on station 3. Station 4 and 10 had intermediate values of 4.2 and 4.4% respectively.
3.1.1.1 Comments to the analytical resultsThe results show that the sediment samples are dominated by particles smaller than <63µm andcontain little TOM (total organic matter). The characteristic smaller grain size, i.e. having largersurface to mass ratios, suggests that they are susceptible to large chemical adsorptive reactionsand could serve as a potential trap for contaminants. The TOM values suggest that the organiccontent in the samples is moderate. The level of organic content indicates that the origin of thesediment is from “weathered mineral” rocks and not biologically produced. This correspondswell with earlier investigation of the sediment in the Bay of Bengal, which have shown that the
DET NORSKE VERITAS
Report No: 2000-3158, rev. 01
TECHNICAL REPORT
Page 24Reference to part of this report which may lead to misinterpretation is not permissible.
29 August 2000
sediment is dominated by sediment carried to the sea by the Ganges-Brahmaptura-Meghna(GMB) river system, containing large amounts of sediment having its origin from the Himalayanmountains (ref.: /25/).
3.1.2 Metals - analytical resultsThe results from the metal analysis are given in table 3.1.2 along with some results from earlierinvestigations in Bangladesh.
Table 3.1.2 Metal concentrations in sediment from the coast of Chittagong. DNV results and resultsfrom earlier investigations.
1: est lod : estimated level of detection for SINTEF analysis.2: The limits are values taken from various sources that have been used in earlier investigations in the Bay of Bengal
(ref.: /26/, /27/, /28/). These represent the level at which effects can occur.3: Investigation from the Karnafully river mouth and south along the coast in 1994. Station layout are given in Figure .4: Investigation from the North East Coast of the Bay of Bengal in 1996.
3.1.2.1 Comments to the analytical resultsThe analytical methodologies offer two approaches regarding metals in sediment;• Total metal concentration analysis (use of very strong acids like aqua regina or hydrofluoric
acid)• The biologically available metal concentration (use of weaker acids like nitric acid)Both methods are influenced by the metal concentration in minerals in the sediment and canproduce diverse results. The analysis undertaken is that of the latter bullet above (nitric acid wasused). The reference results (1994/ 1996) are from analysis following the metal concentrationapproach (aqua regina was used).
In comparison with international standards and norms, the results does not provide alarminglyhigh values. There is however an elevated concentration of metals (Cu, Fe, Ni and Zn)
DET NORSKE VERITAS
Report No: 2000-3158, rev. 01
TECHNICAL REPORT
Page 25Reference to part of this report which may lead to misinterpretation is not permissible.
29 August 2000
assumingly from ship structures of general characteristics and from paintwork. The results fromthese samples corresponds well with those presented in the 1994 reference (Talukder et. al.,1994). The reference area of the 1994 work is shown in Figure 3.1.2.1. The area extends fromthe Karnafully river-mouth and south along the coast (the present investigation were to the northof the Karnafully river-mouth). The work carried out by Dr. Khan in 1996 on the north-east coastof the Bay of Bengal found metal levels that were lower than the results presented by this work.Even though the metal levels in the sediment were lower, they found that shellfish accumulatedsome metals to concentrations that are higher than international standards and may be a healthhazard for consumers. A study carried out in the area (Fauzdarhat-Kumira) in 1992-1993included a quantitative investigation of trace metals in water and Scylla serrata (edible crab).This concluded that the concentration of some of the metals investigated (Zn and Cu)occasionally exceeded international limits for human exposure (ref.: /5/).
Even though the sediment in the ship breaking area is dominated by fine particles that metalshave a high affinity for, and that there are known sources of metal contamination in the area, theconcentrations found does not represent a particularly high level compared to internationalstandards. The reason for this is probably due to;• The strong tidal current and the current along the coast acts as an dilutor both by introducing
a large number and particles and by particles being suspended in the water for a long time.(Particles are transported out of the area/ large masses of water being transported by thecurrent will dilute the introduced metals).
• The complicated sedimentation/re-suspension system in the intertidal zone in the Bay ofBengal. The tidal currents will “wash” the sediment in the intertidal zone according to thetidal cycle resulting in the spreading of the metals over a large area.
Figure 3.1.2.1 Stations investigated by Talukder in 1994. The area investigated by DNV in 2000 is justoutside the northern part of the Chittagong coast on the map.
3.1.3 Polyaromatic hydrocarbons - analytical resultsA number of 7 out of 11 sediment samples were analysed for polyaromatic hydrocarbons (PAH).The PAH (EPA-16) are given in table 3.1.3, while more detailed analysis and level of detectioncan be found in Appendix F.
DET NORSKE VERITAS
Report No: 2000-3158, rev. 01
TECHNICAL REPORT
Page 26Reference to part of this report which may lead to misinterpretation is not permissible.
29 August 2000
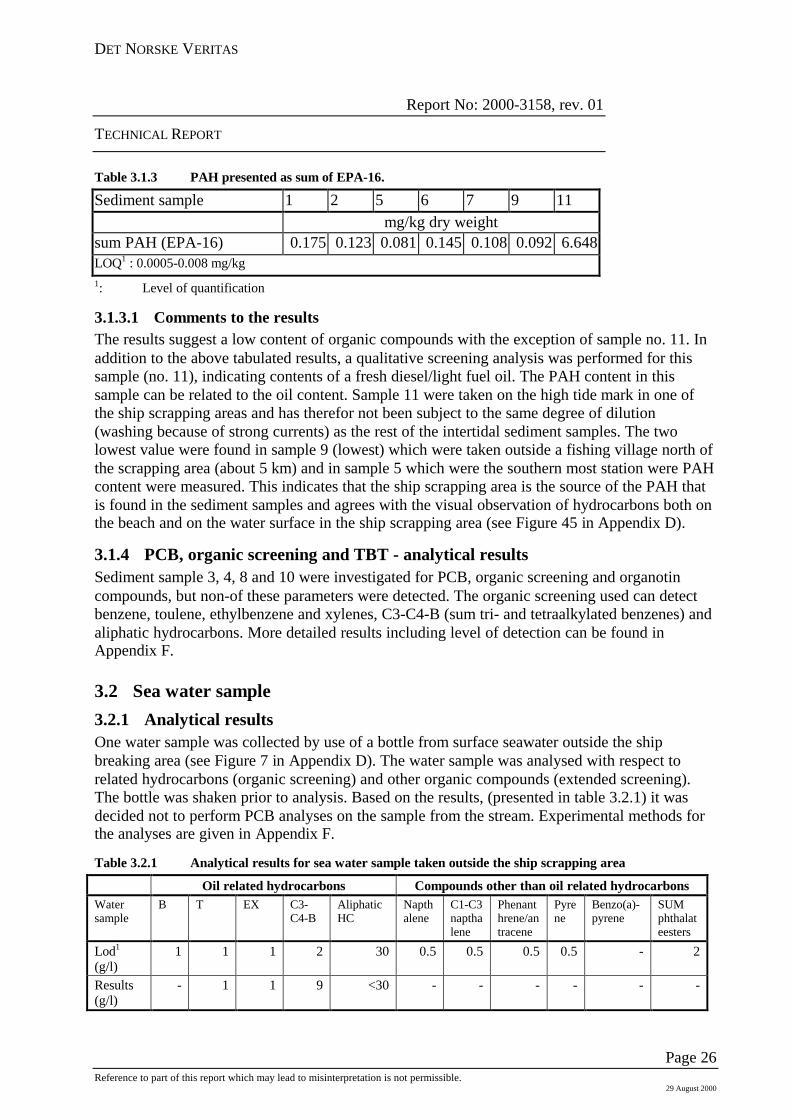
Table 3.1.3 PAH presented as sum of EPA-16.
Sediment sample 1 2 5 6 7 9 11mg/kg dry weight
sum PAH (EPA-16) 0.175 0.123 0.081 0.145 0.108 0.092 6.648LOQ1 : 0.0005-0.008 mg/kg1: Level of quantification
3.1.3.1 Comments to the resultsThe results suggest a low content of organic compounds with the exception of sample no. 11. Inaddition to the above tabulated results, a qualitative screening analysis was performed for thissample (no. 11), indicating contents of a fresh diesel/light fuel oil. The PAH content in thissample can be related to the oil content. Sample 11 were taken on the high tide mark in one ofthe ship scrapping areas and has therefor not been subject to the same degree of dilution(washing because of strong currents) as the rest of the intertidal sediment samples. The twolowest value were found in sample 9 (lowest) which were taken outside a fishing village north ofthe scrapping area (about 5 km) and in sample 5 which were the southern most station were PAHcontent were measured. This indicates that the ship scrapping area is the source of the PAH thatis found in the sediment samples and agrees with the visual observation of hydrocarbons both onthe beach and on the water surface in the ship scrapping area (see Figure 45 in Appendix D).
3.1.4 PCB, organic screening and TBT - analytical resultsSediment sample 3, 4, 8 and 10 were investigated for PCB, organic screening and organotincompounds, but non-of these parameters were detected. The organic screening used can detectbenzene, toulene, ethylbenzene and xylenes, C3-C4-B (sum tri- and tetraalkylated benzenes) andaliphatic hydrocarbons. More detailed results including level of detection can be found inAppendix F.
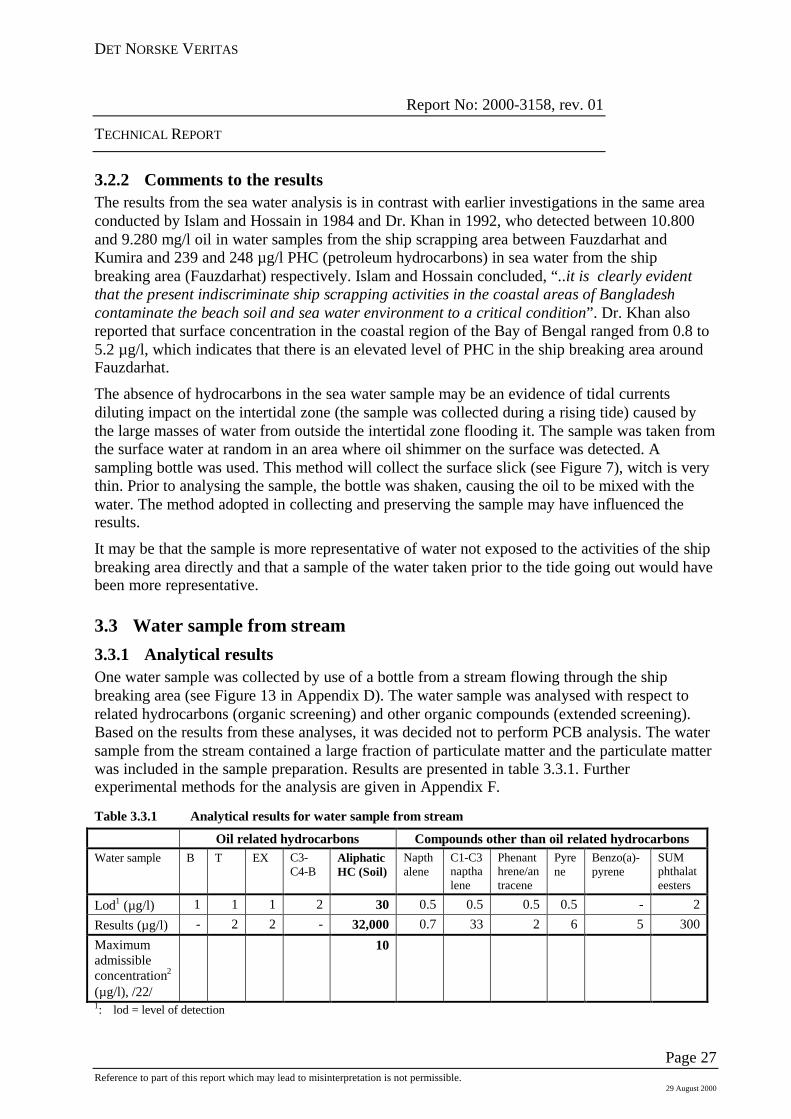
3.2 Sea water sample3.2.1 Analytical resultsOne water sample was collected by use of a bottle from surface seawater outside the shipbreaking area (see Figure 7 in Appendix D). The water sample was analysed with respect torelated hydrocarbons (organic screening) and other organic compounds (extended screening).The bottle was shaken prior to analysis. Based on the results, (presented in table 3.2.1) it wasdecided not to perform PCB analyses on the sample from the stream. Experimental methods forthe analyses are given in Appendix F.
Table 3.2.1 Analytical results for sea water sample taken outside the ship scrapping area
Oil related hydrocarbons Compounds other than oil related hydrocarbonsWatersample
B T EX C3-C4-B
AliphaticHC
Napthalene
C1-C3napthalene
Phenanthrene/antracene
Pyrene
Benzo(a)-pyrene
SUMphthalateesters
Lod1
(g/l)1 1 1 2 30 0.5 0.5 0.5 0.5 - 2
Results(g/l)
- 1 1 9 <30 - - - - - -
DET NORSKE VERITAS
Report No: 2000-3158, rev. 01
TECHNICAL REPORT
Page 27Reference to part of this report which may lead to misinterpretation is not permissible.
29 August 2000
3.2.2 Comments to the resultsThe results from the sea water analysis is in contrast with earlier investigations in the same areaconducted by Islam and Hossain in 1984 and Dr. Khan in 1992, who detected between 10.800and 9.280 mg/l oil in water samples from the ship scrapping area between Fauzdarhat andKumira and 239 and 248 µg/l PHC (petroleum hydrocarbons) in sea water from the shipbreaking area (Fauzdarhat) respectively. Islam and Hossain concluded, “..it is clearly evidentthat the present indiscriminate ship scrapping activities in the coastal areas of Bangladeshcontaminate the beach soil and sea water environment to a critical condition”. Dr. Khan alsoreported that surface concentration in the coastal region of the Bay of Bengal ranged from 0.8 to5.2 µg/l, which indicates that there is an elevated level of PHC in the ship breaking area aroundFauzdarhat.
The absence of hydrocarbons in the sea water sample may be an evidence of tidal currentsdiluting impact on the intertidal zone (the sample was collected during a rising tide) caused bythe large masses of water from outside the intertidal zone flooding it. The sample was taken fromthe surface water at random in an area where oil shimmer on the surface was detected. Asampling bottle was used. This method will collect the surface slick (see Figure 7), witch is verythin. Prior to analysing the sample, the bottle was shaken, causing the oil to be mixed with thewater. The method adopted in collecting and preserving the sample may have influenced theresults.
It may be that the sample is more representative of water not exposed to the activities of the shipbreaking area directly and that a sample of the water taken prior to the tide going out would havebeen more representative.
3.3 Water sample from stream3.3.1 Analytical resultsOne water sample was collected by use of a bottle from a stream flowing through the shipbreaking area (see Figure 13 in Appendix D). The water sample was analysed with respect torelated hydrocarbons (organic screening) and other organic compounds (extended screening).Based on the results from these analyses, it was decided not to perform PCB analysis. The watersample from the stream contained a large fraction of particulate matter and the particulate matterwas included in the sample preparation. Results are presented in table 3.3.1. Furtherexperimental methods for the analysis are given in Appendix F.
Table 3.3.1 Analytical results for water sample from stream
Oil related hydrocarbons Compounds other than oil related hydrocarbonsWater sample B T EX C3-
Page 28Reference to part of this report which may lead to misinterpretation is not permissible.
29 August 2000
2: Maximum admissible concentration of dissolved or emulsified hydrocarbons (after extraction by petroleum ether), Mineraloils
3.3.2 Comments to the analytical resultsAn oil distillate having carbon number distribution from C14 to C32, with a peak around n-C18
was observed in this sample. The oil distillate was somewhat heavier than the diesel/light fuel oilthe laboratory use as a reference and further, the distillate was fresh (not degraded). The total oilconcentration was high for a water sample, reflecting that most of the oil is sorbed to theparticulate matter.
The water quality is compared to the maximum permissible concentration of dissolved oremulsified hydrocarbons (Mineral oils) in drinking water used in the European Community(EU). This may be a basis for comparison since this defines “clean” water. As can be seen fromtable 3.3.1 the results from the analyses are far above the requirement to drinking water in EU.
3.4 Residue samples3.4.1 Analytical resultsTwo residue samples were analysed. One sample was taken from an oil tank being dismantled onthe beach and one from a pile of sludge that was lying directly on the beach.
The actual oil content in the residue samples have not been determined as the oil contentexceeded 20 % of total weight in both samples. However an organic screening was carried out inorder to decide upon type of oil in the samples. The result of this screening is presented in table3.4.1.
Table 3.4.1 Results of organic screening of residue samples.
Sample id. ResultsOil sludge sample The sample consisted of aliphatic hydrocarbons up to C32. Suggested source fresh
(not degraded) diesel/light fuel oil. The analytical results indicate low levels ofother non-oil related organic compounds.
Sample from bottom of oiltank (on yard)
The sample consisted of aliphatic hydrocarbons up to >C32, with a peak at C24.Suggested source heavy oil type (lubricating oil?). The analytical results indicatelow levels of other non-oil related organic compounds.
The samples were also analysed for heavy metals and the results of these analyses are given intable 3.4.1.1
Page 29Reference to part of this report which may lead to misinterpretation is not permissible.
29 August 2000
1: est lod = estimated level of detection2: The highest value may be the result from contamination from pipelines.
3.4.2 Comments to the analytical resultsAs can be seen from table 3.4.1 the organic screening of the samples showed that the samplescontained different fractions of hydrocarbons, whilst the results indicate low levels of other, non-oil related organic compounds. Based on this it was decided not to carry out any PCB-analysesof the samples.
As can be seen from table 3.4.1, it is confirmed that the heavy metals contents in the residuesamples are higher than what is normally present in any crude oil. The exceptions are mercuryand nickel which both are in the “normal” range compared to global crude oil qualities.
A number of hydrocarbon sources were observed in the ship breaking area during theassessment. These will “leak” to the intertidal zone during the rainy periods. The effect will bethat of a “cleansing” in the dry area of the site whilst the intertidal zone will receive the “waste-water”. The large tidal difference will dilute the contaminants of the intertidal zone. However,the background contamination levels will steadily increase. From the results presented here, itfollows that the contamination also will include that of heavy metals.
3.5 Possible asbestos samples3.5.1 Analytical resultsFour different samples of what was suspected to be asbestos were collected during theassessment. The results of the analyses are presented in 3.5.1.
Table 3.5.1 Results of asbestos analyses.
Asbestos positive(Yes/No)
Asbestos type Comments
Asbestos sample 1 on yard Yes Amositt Ash-colouredAsbestos sample 2 on yard Yes Amositt Ash-colouredAsbestos sample 1 from shop Yes Amositt Ash-colouredAsbestos sample 2 from shop Yes Amositt Ash-coloured
3.5.2 Comments to the resultsAsbestos may be divided into two groups i.e. serpentine and amphibole. Amositt asbestos is anash-coloured or brown type of asbestos that belongs to the amphibole group and is extracted inSouth Africa. As can be seen from table 3.5.1, all four samples were confirmed asbestos of theamositt type.
Asbestos sample 1 and 2 on yard were taken from small and larger lumps found randomly on theground (see Figure 16, Figure 46 and Figure 47 and in Appendix D). There where no proceduresnor actions implemented regarding asbestos storage and handling. The spreading of asbestosinduced by wind was observed by the eye.
Sample 1 was taken from a sack stored along the roadside. This was re-processed asbestos(grainy/powder alike consistence).
DET NORSKE VERITAS
Report No: 2000-3158, rev. 01
TECHNICAL REPORT
Page 30Reference to part of this report which may lead to misinterpretation is not permissible.
29 August 2000
Sample 2 was collected from a heap at a location where asbestos was re-processed. At this siteasbestos was found randomly in different shapes stored prior to re-processing.
3.6 Soil samplesBoth soil samples were collected at a location undertaking steel plates re-manufacturing. Paintwas removed (by grinding) and cutting/welding was performed.
3.6.1 Analytical resultsTable 3.6 summarises the heavy metal analyses, Table 3.6.1 summarises the PCB-analyses andTable 3.6.1.1 summarises the organotin analyses of soil from a steel plate re-processing site.
Table 3.6 Heavy metals analyses of soil from a steel plate re-processing site.
Sample Cd Cr Cu Fe Hg Mn Ni Pb Zn Figure inAppendix D
Sample 1 on steelplate re-processingsite, (mg/kg, dryweight)2
Sample 2 on steelplate re-processingsite, (mg/kg, dryweight)2
0.8 507 573 28,082 0.076 2,321 114 4,232 2,929
Estimated level ofdetection, (mg/kg,dry weight)
0.2 0.2 0.7 0.6 0.003 0.5 0.3 0.5 1
Local naturalbackground valuesfrom Kanpur-Unnaoarea of India3
0.1 114 51 52,000 0.05-0.21 1363 63 144 114
1: No number available for the region. Number represents background values from Norway.2: Analysed with nitric acid (HNO3). The reported numbers therefore represents “biological available” metal
concentrations.3: Analysed with hydrofluoric acid (HF). The reported numbers therefore represents total metal concentrations.
Table 3.6.1 PCB analyses of soil from a steel plate re-processing site.
Sample PCB-28
PCB-52
PCB-101
PCB-118
PCB-153
PCB-138
PCB-180
Sum 7-dutch(mg/kg)
Sample 1 on steel plate re-processing site, (µg/kg, dry weight)
12 194 310 199 268 353 108 1.444
Sample 2 on steel plate re-processing site, (µg/kg, dry weight)
3.4 12 19 22 45 57 42 0.2
Level of quantification, (µg/kg, dryweight)
0.2 0.2 0.2 0.2 0.2 0.2 0.2 -
Background values from Norway1,/20/
- - - - - - - 0.003-0.03
1: No background value is available for the region. However PCB is not a natural existing substance and thereforebackground values from Norway is referred to /20/.
DET NORSKE VERITAS
Report No: 2000-3158, rev. 01
TECHNICAL REPORT
Page 31Reference to part of this report which may lead to misinterpretation is not permissible.
29 August 2000
Table 3.6.1.1 Organotin analyses of soil from a steel plate re-processing site.
Sample Monobutyltin(MBT)
Dibutyltin(DBT)
Tributyltin(TBT)
Dryweight
Sample 1 on steel plate re-processing site, (mg/kg, dryweight)
1.9 2.4 25 99
Sample 2 on steel plate re-processing site, (mg/kg, dryweight)
0.72 1.38 17 99
Level of quantification,(mg/kg, dry weight)
0.005 0.005 0.005
Maximum levels in marinesediments reported by WHOin 1990.
- - 26.3
3.6.2 Comments to the results3.6.2.1 Heavy metalsThe results have been compared to the natural background values from the Kanpur-Unnao area,south of Himalaya and the Ganges River in India (ref.: /19/). It should be noted that theanalytical method used implies the use of hydrofluoric acid (HF). This means that the reportednumbers represents total metal concentrations in the soil. The analyses reported on here, refer tothe use of nitric acid (HNO3) and hence it is the biological available metal concentrations that isreported. Comparable levels will therefor have somewhat lower numbers than those reported forthe background reference.
As can be seen from table 3.6, the heavy metal concentrations in the earth samples taken byDNV are, except for iron (Fe), all far above the background levels. Especially for copper (Cu),lead (Pb) and sink (Zn), the values are high. The high concentrations are as expected, reflectingheavy metals typically found in paint products. Investigations carried out on offshoreinstallations in Norway has reported sink-, copper- and lead- content of 98%, 35% and 0.4 %respectively in different paint types (ref.: /29/, /30/). Steel alloys typically used in shipbuildingwill also include compounds of these metals.
For mercury (Hg), there was no “local” background figures available and the sample values arecompared to background values from Norway. As can be seen from the table, the sample valuesfor Hg are within the Norwegian background values or slightly above.
3.6.2.2 PCBSince no background levels of PCB in the soil of Bangladesh were available, the PCBconcentrations in the soil have been compared to background levels of PCB in soil in Norway.Since PCB is no natural occurring substance, this comparison should be reasonable. Asillustrated in table 3.6.1, the PCB concentration in the analysed soil is 7-48 times above themaximum background levels in Norway. The high concentrations are as expected since the steelplates from vessels earlier were painted with PCB containing paint. In Norway the PCB contentin certain types of paint (wet) was reported to be about 5 % in the years from about 1950-1975(ref.: /23/).
DET NORSKE VERITAS
Report No: 2000-3158, rev. 01
TECHNICAL REPORT
Page 32Reference to part of this report which may lead to misinterpretation is not permissible.
29 August 2000
3.6.2.3 OrganotinSince no background levels of organotin in the soil of Bangladesh were available, the tributyltin(TBT) concentrations in the soil have been compared to maximum levels in marine sedimentsreported by the Worlds Health Organisation (WHO) in 1990 (ref.: /21/). As seen from table3.6.1.1, the reported value for TBT in sample 1 is almost as high as maximum values reported byWHO. It is concluded that the level of organotin in the samples are high.
3.7 Paint sampleThe paint sample was collected from steel-plates for re-manufacturing. The paint sample wasscraped off the plate.
3.7.1 Analytical resultsThe tables 3.7, 3.7.1 and 3.7.1.1, summarises the analytical results of heavy metal, PCB andorganotin respectively.
Table 3.7 Heavy metals analyses of paint sample from a steel plate re-processing site.
Sample Cd Cr Cu Fe Hg Mn Ni Pb Zn Figure inAppendix D
Paint sample on steelplate re-processingsite, (mg/kg, dryweight)
Reported values of TBTO2 inpaint used in Norway(ref.:/21/).
1-5%1
DET NORSKE VERITAS
Report No: 2000-3158, rev. 01
TECHNICAL REPORT
Page 33Reference to part of this report which may lead to misinterpretation is not permissible.
29 August 2000
1: This is a general reported value in reference (ref.: /21/). In other sources values of 15 % TBTO is reported (ref.: /29/).2: TBTO is tributyltin oxide.
3.7.2 Comments to the results3.7.2.1 Heavy metalsAs can be seen from table 3.7, there are relatively large levels of zinc, lead and chrome in theanalysed paint, which is as expected. As mentioned in chapter 3.6.2.1 the content of heavymetals vary in paint, (ref.: /29/, /30/).
3.7.2.2 PCBAs can be seen from table 3.7.1, a sum 7-dutch concentration in the analysed paint of 6.4 µg/kgis reported. This number is low compared to the reported values of PCB in certain paint types inNorway from 1950-1975 where a value of 5% PCB in wet paint was representative. Therelatively low concentration may indicate that vessels originally were coated with paintcontaining PCB, but during its lifetime, sandblasting and re-painting (using PCB-free products)has reduced the net amount present. Thus only small amounts of the original paint may havecross-contaminated the newer paint. The reports from the laboratory cannot conclude if the PCBoriginates from the paint itself or if it originates from an external source causing cross-contamination (e.g. PCB-containing oil).
3.7.2.3 OrganotinTable 3.7.1.1 illustrate a tributyltin concentration of 0.64 mg/kg dry weight. This is much lowerthan reported values of original content of TBT in paint (antifouling paints). This may imply thatthe paint is old and that the TBT therefore has been released to the sea. Another explanation maybe that the actual sample is not representative. The sample may have been collected from a platenot exposed to fouling and therefor not treated by anti-fouling paint products. The detected TBTmay origin from contamination from other plates (through stockpiling).
3.8 Electrical cable sample3.8.1 Analytical resultsThe PCB analyses from the insulation of an electric cable are provided in table 3.8.1, presentedas individual congeners (according to 7- dutch). The piece was randomly collected from a sitewhere cable insulation was burnt (see Figure 48 in Appendix D).
Table 3.8.1 Results of analyses of PCB in a cable.
3.8.2 Comments to the resultsFollowing the laboratory analysis, it is found that the PCB congener pattern resembled that of anAroclor 1260 commercial PCB mixture. The sum of the 7-duch found in the cable, 0.13 mg/kg,
DET NORSKE VERITAS
Report No: 2000-3158, rev. 01
TECHNICAL REPORT
Page 34Reference to part of this report which may lead to misinterpretation is not permissible.
29 August 2000
is relatively low compared to findings in e.g. mastic used between concrete elements. Thenormal range in such mastic is 15-64,000 mg/kg (ref.: /14/, /15/). This project has not been ableto identify any references establishing the presence of PCB in cable insulation.The sample extract was analysed with the MS (Mass Spectrometry) detector run in two differentmodes, partly in a specific mode (SIM) to detect PCB congeners only, partly in a full scan(screening) mode to detect the possible presence of other organic compounds in the sample.The laboratory screening analysis suggests that the cable may be contaminated by an oil productwith boiling point range in the region of 300 – 450 oC. A possible source may be that oflubricating oil. It is not however established from where the PCB-concentration origin. The PCBcontent makes up approximately 1% of the oil content. The findings are difficult to interpret, asthere was no visual surface content of oil on the cable. The laboratory therefore states that theycannot conclude whether the oil has been part of the cable composition or is a result of anexternal source, having contaminated the cable. If the source is external, the oil may havedissolved into the cable matrix, explaining why no surface oil was observed.
If it is assumed that the PCB originates from the cable itself, the concentration of PCB is asmentioned earlier, low. However it is a finding that should be investigated further both becauseof the large volume of insulation on cables and because of the possible contamination as a resultof the burning of the insulation. The PCB together with the PVC in the cables may result indioxin pollution. If the insulation on the cables is not combusted sufficiently in a controlled andmonitored manner, the PCB may also still be present in the residues from the burning, whichagain may be spread into the ground.
3.9 Air samples3.9.1 Analytical resultsAs described in chapter 2.3.2.9, air samples were taken with regard to analyses on asbestos,heavy metals and organic compounds. The corresponding results of the analyses are given in thetables 3.9, 3.9.1 and 3.9.1.1.
Table 3.9 Asbestos analyses (air samples).
Sample Results(asbestos fibres/ml air)
Figure in Appendix D
Sample 1 on yard <0.01 Figure 22Sample 2 on asbestosre-processing place
<0.01 Figure 17, Figure 24
Administrative norm(ref.: /17/).
0.1
DET NORSKE VERITAS
Report No: 2000-3158, rev. 01
TECHNICAL REPORT
Page 35Reference to part of this report which may lead to misinterpretation is not permissible.
29 August 2000
Table 3.9.1 Heavy metal analyses (air samples).
Sample Cd Cr Cu Fe Hg2 Mn Ni Pb Zn Figure inAppendix D
3.9.2 Comments to the resultsFor all air samples, the analytical results are compared with Norwegian norms for workingenvironment atmosphere (ref.: /17/). This norm is made for the evaluation of workingenvironment standard on Norwegian work sites where the air is polluted with chemicalsubstances and is based on technical, economical and medical assessments. The values in thisnorm are on the same level as for many of the member countries within the European Union (e.g.Denmark, Sweden and the Netherlands), (ref.: /18/).
DET NORSKE VERITAS
Report No: 2000-3158, rev. 01
TECHNICAL REPORT
Page 36Reference to part of this report which may lead to misinterpretation is not permissible.
29 August 2000
3.9.2.1 AsbestosAs can be seen from table 3.9, there is less than 0.01 asbestos fibres/ml air in both samples. Thisis more than 10 times less than the administrative norm for working environment in Norway.
Air sample 1
Air sample 1 (asbestos) was taken on a ship-breaking yard at the beach. The result implies thatthere is not asbestos in the air at the place where the sample was taken. However the asbestossample number 2 on yard (see chapter 3.5), which was asbestos positive, was taken about 10meters away from the air sampling point. The wind direction from the solid sample on groundwas not towards the air sampling point during the air-sampling period and this may explain thatthe air sampler did not detect any asbestos.
As earlier mentioned (see chapter 2.3.2.9) it should also be noted that the first two hours thewind direction was toward the pumps and thus it is expected that the filters/cartridge woulddetect possible polluted air during this period. However during the two latest hours it waslandbreeze and it is expected that the filters/cartridge reviewed less polluted air through the inlet.
Air sample 2
Air sample 2 (asbestos) was taken by installing the sampling equipment on a worker that wascrushing what was further traded as asbestos. The analytical results show that the sample wasasbestos negative. This implies that the substance the worker was crushing during the period ofair sampling was not asbestos, but a substance of similarity. However it should be noted thatasbestos sample 2 from shop was taken from the heap between the workers that wereundertaking the crushing process and that this sample proved asbestos positive (see chapter 3.5).This may imply that what had been crushed prior (e.g. the day before) to the air sampling wasasbestos (now lying in the heap) and that the workers was exposed to asbestos.
There was no wind during the sampling period.
3.9.2.2 Heavy metalsAir sample 1
From table 3.9.1, it can be seen that only the level of nickel (Ni) is above the administrativenorm levels (sample 1). The table also provides an accumulated sum of the effect that thedifferent heavy metals are having. This sum shall not exceed the figure 1 in order to meet thenorms (ref.: /17/). The value exceeds this limit with a factor of 19 (sample 1). The air quality isnot in compliance with these norms.
For wind influence see description under air sample 1 in chapter 3.9.2.1.
Air sample 2
For sample 2, non-of the heavy metal components exceeds the norm values. As can be seen fromthe table, none of the sums of effects are above norm values. It is concluded that the workingconditions in relation to air quality were within the reference norms at the point (location) wherethe sample was taken at the time it was taken.
As discussed previously (chapter 2.3.2.9), very little wind movement at the time of samplingmay avoid the filters to “inhale” the pollutants.
DET NORSKE VERITAS
Report No: 2000-3158, rev. 01
TECHNICAL REPORT
Page 37Reference to part of this report which may lead to misinterpretation is not permissible.
29 August 2000
3.9.2.3 Organic compoundsAir sample 1
Laboratory analysis concludes that the sample contain aliphatic hydrocarbons up to C20 at lowlevels. A suggested source is diesel/light fuel oil. Napthalene was found at a level ofapproximately 0.005 mg/m3. No organic compounds other than oil related hydrocarbons werefound in the sample.
For sample 1, non-of the organic compounds are exceeding the norm values. As can be seenfrom table 3.9.1.1, the sum of the effects is neither exceeding the norm values. It is thereforconcluded that working conditions with regard to organic compounds was satisfactory during thesampling period for the sampling location.
For wind influence see description under air sample 1 in chapter 3.9.2.1.
Air sample 2
From laboratory results it is evident that the sample contain aliphatic and aromatic hydrocarbonsat low levels. Suggested source is white spirit. Napthalene was found at a level of approximately0.005 mg/m3. No organic compounds other than oil related hydrocarbons were found in thesample.
Neither sample 2 contains organic compound components exceeding norm values. Again, this isalso true for the sum value and it is concluded that at the working conditions with regard toorganic compounds was satisfactory during the sampling period at the relevant location.
As for heavy metal sample 2 it should be noted that there was a little wind with no specialdirection during the sampling period and it was therefore expected that the filters got littlepolluted air through the inlet.
DET NORSKE VERITAS
Report No: 2000-3158
TECHNICAL REPORT
Reference to part of this report which may lead to misinterpretation is not permissible.
3.10 Direct environmental impacts of ship scrappingIn the following (table 3.10) a listing of results from the sampling analysis is provided. An attempt in coupling these to generalimpressions from the site assessment in order to arrive at recommendations that can provide as input in a Best Practice Approach(BPA) has been made.Table 3.10 Sample analysis summary.
Sample analysis Conclusions Recommendations and input to the Best Practice Approach (BPA)
Sediments Analysed samples does not have concentrationsthat are alarming. However, this is probablycaused by tidal water characteristics. Amonitoring programme of sediment samplingshould have been made.
Reference studies from the same area showsignificant levels of various pollutants (ref.:/33/).
The nature of the activities undertaken in the beach area reflecting also presentmethods adopted, provide a continuous supply of pollutants to the intertidal area. Tounderstand the consequences of this, systematic monitoring is necessary. An initialmonitoring programme should be established (chemical and biological samples) forboth the intertidal- and subtidal zone (including also a reference area). Suchprogramme should be repeated in intervals with frequencies synchronised with thegeneral activity level in the area as well as to any actions taken.
Metal concentrations in commercial products from the area (fish, crustaceous animalsetc.) should be monitored continuously.
The effect of the tidal water and the monsoon on the spreading of discharges from theship scrapping and other industry along the coast of Chittagong should be studied.
Sea water Analysed samples have not revealed alarminglyhigh concentrations in the seawater. However,this is most likely due to the sampling sequenceand its unfortunate synchronisation versus thetidal frequency (sample on incoming tide), secomment, item 2.3.2.
Previous work (ref.: /2/, /3/, /4/, /5/, /6/, /7/, /8/)do provide documentation revealing high levelsof toxic compounds in the area.
Monitoring programme of the sea-water should be incurred including in addition to areference area also the intertidal- and subtidal zones. The programme should bedesigned and implemented in that suggested for sediment monitoring.
A monitoring program of the mangrove forest and the influence of the water qualityon the mangrove could also be carried out in this connection.
DET NORSKE VERITAS
Report No: 2000-3158
TECHNICAL REPORT
Reference to part of this report which may lead to misinterpretation is not permissible.
Water samples The DNV analysed samples do show highconcentrations of oil water samples from thebreaking area.
Insufficient facilities for disposal/storage lead to piles of barrels left randomly exposedto the general activity of the beach resulting in damages and consequently leakages.Further, insufficient emptying or cleaning of systems and/or tanks result in directcontamination on the ground.
Waste oils require waste oil facilities. This may incorporate the ability to remove oilfrom ship structures (pumping ability) and to store (tank). Further, recovered oils inbarrels require a storage space secured from the general activity in such a way that thebarrels will remain intact. However, in order to secure against any leakage into theground and to water, such a storage area requires to have a tight surface. An oilstorage area can consist of a concrete surface built on a tight membrane secured byfencing. A collection system for spillage should be incorporated.
A multiple number of such simple storage areas should be established in the shipscrapping area.
For removing oil remains from structures, mobile pumping units including storagetanks (or barrels) may be provided.
A proper collection system should also be made for other subjects that should betreated as hazardous waste, e.g. asbestos, PCB-containing capacitors etc.
Note that in Chittagong, the vessels quay prior to being beached. Valuables includingelectronic equipment (including navigational aids and similar) are removed. This is anopportunity to remove waste substances also. A quay facility is more likely to offerrequired services including waste handling and reception.
Some of these waste products will provide as raw material in a re-use application.
Residue sample Sludge samples analysed contained significantlevels of hydrocarbons and heavy metals.
Oily sludge from the vessels should be collected onboard and taken ashore. Thesludge should thereafter be sent to recycling industries (oil-refinement, cementfactories) that may use the sludge in their production.
(See comment above for water samples).
DET NORSKE VERITAS
Report No: 2000-3158
TECHNICAL REPORT
Reference to part of this report which may lead to misinterpretation is not permissible.
Asbestos The analyses undertaken have verified that thesamples collected in actual fact are that ofasbestos.
According to western regulations, asbestos wasnot handled satisfactory. Asbestos was detectedand present mostly everywhere in the shipbreaking yards and on the places where asbestosis re-processed. There were no precautions oraction at any level enforced in order to controlthis substance. In fact it was manually crushedand recycled.
Even though the use of asbestos is not prohibited in many countries on the sub Indiancontinent, asbestos is nevertheless extremely hazardous. Asbestos causes a range ofhealth implications (ref.: /1/) and should therefor be handled with upmost care.
Asbestos should be disassembled from the vessels in such a way that minimisation ofasbestos dust production is achieved. The asbestos should then be disposed in such away that it can not enter into air. All workers engaged with asbestos should wearspecial protective equipment (asbestos masks, gloves, overalls etc.). Education withregard to the health effects of asbestos should be provided.
It should be proposed to implement a ban on the use of this substance in thosecountries that still allow for such.
(Asbestos waste reception can be integrated in a general waste handling managementsystem as discussed above, see water sample).
Soil Soil analyses have established significant levelsof contaminants such as heavy metals, PCB andTBT.
Sites undertaking steel component work (ship breaking area as well as re-processingareas) require upgrading in order to avoid soil contamination. These activities shouldbe carried out in dedicated areas on appropriate surfaces similar to those suggested forwaste oil storage. Residues from the cutting, paint removal etc. should be collectedand disposed.
Even though no soil samples were collected in the scrap yards, the soil is most likelycontaminated with heavy metals, PCB, oil and asbestos similar to that found outsidethe scrapping area.
A soil survey programme should be carried out in order to monitor effects of thecontaminants (ship breaking area as well as re-manufacturing area.).
Paint Paint analysis show a small content of PCB andTBT.
Action as above (soil) is recommended. Note that the samples taken are from one steelplate and therefore not representative for all paint products in use onboard vessels. Inparticular the level of TBT seems low. It is reasonable that TBT-level in the soil at thebreaking site is high.
DET NORSKE VERITAS
Report No: 2000-3158
TECHNICAL REPORT
Reference to part of this report which may lead to misinterpretation is not permissible.
Electrical cable A random piece of cabling was collected andanalysis revealed the content of PCB. It isdifficult to decide if the PCB originates from thecable itself or from other sources that may havecross-contaminated the cable.
A more general investigation on cables and the possibility of PCB in these should becarried out. Contacts with producers and analyses of a selected number of old cablesshould be done.
Note that cabling unfit for the second-hand market is burned in order to extract themetal. The combustion process of PCB and PVC emits dioxins. Any such combustionprocess should be carefully undertaken in a controlled manner (incinerator).
Air The analysed air-samples do show a content ofheavy metals and organic compounds, while forasbestos there is not detected any in the airsample. The relative small content of heavymetals and organic compounds may beexplained with the wind conditions during thesampling. For asbestos the negative result maybe explained by the fact that the crushedsubstance the day of air sampling was notasbestos.
See bullet points mentioned under chapter regarding asbestos and soil.
DET NORSKE VERITAS
Report No: 2000-3158, rev. 01
TECHNICAL REPORT
Page 42Reference to part of this report which may lead to misinterpretation is not permissible.
29 August 2000, G/bacit-11.05-final.doc
4 DEVELOPMENT OF SHIP BREAKING PRACTICES
4.1 The Best Practice ApproachAssuming the scrapping activities of Chittagong, Bangladesh are representative of thatundertaken elsewhere on the Sub-Indian continent, it can be claimed that current scrappingpractices of large tonnage is undertaken with a high level of utilisation. In addition to materialextraction for re-manufacturing (mainly metals), re-use of components accounts for aconsiderable share of the total outcome. This level would most likely not be achievable in otheralternative locations (markets) mainly due to legislations. These may be illustrated by:• Requirements related to certification for products sold to a market (CE-requirements).• Requirements associated to materials/ systems/components and their content (including
requirements to verification/ statements, etc.).• Limitations on the usage of some substances (i.e. asbestos is banned in a number of
countries).• Reluctance to accept 2nd. hand equipment.The extensive re-use and re-processing of equipment and materials represent an environmentalgain in the context of sustainability and should be encouraged. However, the lack oforganisational procedure and processing tools generate a number of unwanted occurrences.Some are listed below.• High number of casualties.• Acute and long term contamination of water, sediment, soil and air.• Health implications.Improvements in the ship breaking industries should not be initiated blindly without reflectingthe ability to actually implement and take efficiently use of proposed actions. Most ship breakingnations are developing countries with limited resources in many areas; infrastructure,regulations, education etc. Some initiatives (ref.: /33/) have been proposed but sadly failed in theimplementation phase.
The requirements of upgrading in the ship breaking industry is being realised not only byGovernments and NGO’s but also by the international community (ref.: /34/) (IMO/ UNEP) aswell as the industry itself (ICS, ref.: /35/) representing two important initiatives. The issue ofrecycling of ships is now an item on IMO’s agenda and work is initiated through theestablishment of a Correspondence Group to be lead by Bangladesh. The essence of Terms ofReference for the group is listed in table 4.1. The group will provide a report to be presented forthe MEPC 46 (scheduled for July year 2001). The reluctance of IMO to speed up the activities inthis area has already been questioned by other organisations and institutions.
The loss of the tanker M/V Erica outside the coast of France on December 12. 1999 has initiateda discussion on operational life limitations for tankers. The phase out mechanisms ininternational regulations is about to come into full force as the building boom of the mid 1970’sare reaching maximum operational age (discussed in detail in ref.: /1/). These are arguments usedwhen focusing on the need for more urgent measures in the recycling industry.
DET NORSKE VERITAS
Report No: 2000-3158, rev. 01
TECHNICAL REPORT
Page 43Reference to part of this report which may lead to misinterpretation is not permissible.
29 August 2000, G/bacit-11.05-final.doc
Table 4.1 Extraction of Terms of Reference, IMO Correspondence group on Recycling of Ships
Gather information on current practices concerning therecycling of ships.
Identify relevant information from documents alreadysubmitted to MEPC and discussions taken place (in thecommittee).
Identify safety and environmental risks associated withcurrent practices.
Collect information on procedures introduced bygovernments and industry to reduce risks(environmental/ safety) associated to the recyclingprocess.
Collate information to be received from the secretariatsof ILO, the Basel Convention, the London Conventionand industry on their activities and preceivedresponsibilities associated with the recycling of ships.
Gather views on areas where IMO may usefullycontribute to the reduction of safety and environmentalrisks associated with the recycling of ships, and in doingso, identify the originators of these views.
The Basel Convention as well as the EU are initiating activities that may accelerate the moreformal frames related to ship breaking.
The industry itself seems to move from indifference to acceptance on questions related to actionsrequired. Organisations such as the ICS, BIMCO, INTERTANKO, INTERCARGO, OCIMF andICFTU are all expressing support to the international initiatives. Furthermore, theseorganisations have also highlighted the alternative of self-regulations. Hence, despite the lackinglikeliness of IMO being able to provide recommendations or legislations on ship recycling withinthe next few years, a demand for guidelines and recommendations for both shipowners and shipbreakers will arise nevertheless.
Following past work and conclusions from the assessment discussed in chapter 3, it is concludedthe subjects of safety, health and the environment have at present no presence in the context ofship breaking. Any attempt in implementing initiatives to improve this situation must mirror this.The BPA can offer co-ordinated initiatives to be introduced step-by step.
4.2 The ship breaking processThe figures 2.5.3 and 2.5.4 represent the ship breaking process as it was witnessed at the site ofChittagong. Even though elements like the nature of the location, infrastructure, nationalrequirements and local particulars may influence the process, the stepwise procedures ofdemolition and extraction, cutting, remanufacturing and resale are common regardless. Hence,the process as illustrated in these figures may be considered generic.
4.2.1 Decommissioning and demolitionIn figure 4.2.1, the process from site area arrival through to material extraction and sorting-preparations for re-sale to the re-manufacturing markets is illustrated based upon figures 2.5.3/2.5.4.
The process and the actions involved are systemised in three main categories; arrival at site,intertidal zone and the breaking area. The actual re-manufacturing and resale to end-userapplications are not included here.
The role of the concept outlined in the DNV Report 2000-3160 requiring onboard precautionaryactions to be undertaken (GUIDEC, DNV Report 2000- 3156) and onboard material/substance
DET NORSKE VERITAS
Report No: 2000-3158, rev. 01
TECHNICAL REPORT
Page 44Reference to part of this report which may lead to misinterpretation is not permissible.
29 August 2000, G/bacit-11.05-final.doc
verification (ENVER, DNV Report 2000-3157) resulting in a ship Inventory Dossier –Environment (SIDE) is indicated with references to the three categories (DNV). The nature ofthe procedures involved (PRO) make provisions for identifying consequences in relation toundesired impacts associated to safety, health and the environment (SHE).
Hazardous substances located,Identified and quantified.
Ship-Breaking norm or standard(MARVEL).
P
R
O
Preparations undertaken incl.removing of valuables carriedout alongside quay.
Vessel beached, dismantlinginitiated by removing largestructures/systems/componentsand transporting these to thebreaking area (dry area).
Larger components and structurecut into manageable units.Systems are dismantled. Sortingand temporary storage requireinternal transport carried out by“lifting-teams”.
X ARRIVAL AT SITE INTERTIDAL ZONE BREAKING AREA
S
H
E
Opportunity to removeenvironmental hazardouswaste and to secure systems(gasfree tanks, etc.).
Torch cutting, lifting, wincingmanual extraction imposespotentials for personal injuries.Debris/chemical wastes/emissions from the processescape to air/ sea. Causeshuman exposure and affect thelocal communities (fisheries).
Torch cutting, lifting, use ofmanual tools ongoing in severalplaces within a small area carrythe potential of personal injuries.Human exposure to chemicals andemissions endanger health.Pollutive remains travel freelyand is a threat to the environmentin general.
B
P
A
Require reception facilities/pumps/storage capability/training and general safetyand precaution equipment.
Require dismantling planningincluding waste handling andsafety protection initiatives(input from ENVER/SIDE).
Require procedure planningincluding waste handling andsafety protection initiatives.Waste management must includethe subject of disposal.
DNV* GUIDEC/ ENVER and SIDE are proposed verifying mechanisms aimed at the ship owner in orderto undertake precautionary actions and to document onboard substances (DNV report no.: 2000-3160).
MARVEL Proposed rating concept of ship recycling facilities based upon the compliance ofrecommendations of Best Practice Guidelines (to be developed).
PRO Summary of actions undertaken in the process.
X The ship through the steps of decommissioning, demolition and re-use
BPA Input to a Best Practice Approach.
Figure 4.2.1 Decommissioning, and material preparations for reprocessing.
The identified challenges to safety, health and the environment (SHE) can be detailed withreferences to sub-activities and make provisions for requirements to a best practice approach.The table attempt to illustrate this process though not at a detailed level. In order to enable
DET NORSKE VERITAS
Report No: 2000-3158, rev. 01
TECHNICAL REPORT
Page 45Reference to part of this report which may lead to misinterpretation is not permissible.
29 August 2000, G/bacit-11.05-final.doc
implementation of improvements, a coarse approach may be appropriate. When such bestpractice improvements are implemented (at a coarse level), individual operations can be isolated,assessed and insufficiencies detected. This methodology can adapt to the experience return andcontinuous improvement processes widely used in industries in general.
The BPA approach outlined above provides a generic route that can be adopted for any particularship breaking process. The approach can be expanded to include the next step in the process,namely the actual recycling phase.
4.2.2 Material extracted for re-useFollowing the material preparation and sorting process at the ship breaking facility, distributionis required. The material stream from the breaker can be categorised:
1. Sale to end-user (shops for further sale) with no or minor re-manufacturingrequirements (components, sanitary equipment, etc.).
2. Sale of steel and metal for reprocessing (steel plate cleaning and re-manufacturing/ steel mills).
3. Sale of non-ferrous materials for reprocessing.
4. Debris and waste for treatment or disposal (item 4.2.2.1).
In a similar manner as the breaking process, a flowchart can be provided for each of the groupsabove identifying control requirements (verification), details of actual processes involved and theimpacts these may have on safety, health and the environment in order to establish precautionaryactions to be taken.
4.2.2.1 Waste and extraction debrisItem 4 assume that the BPA-procedure at the breaking facility has identified and established awaste management system. Debris and wastes will have been sorted so that further treatment ordisposal can be undertaken safely. An incentment to achieve this may be the introduction ofpayment to the breaker for volume of waste delivered (to waste reception facilities).
A definition of waste may also be introduced (adopting existing international norms orstandards) for removing undesired materials or substances from the market. Such approachwould enable asbestos to be removed from the recycling process.
Based on the broadly accepted “the polluter pays” principle, it may be suggested that thefinancing of the “waste return concept” as briefly presented here, is a contribution arriving fromthe sale of the particular vessel. This “fee” could be based on the material inventory dossier (assuggested above and as outlined in DNV report 2000-3160).
4.3 Safety, Health and the Environment (SHE)Based upon the BPA, an inventory complying guidelines, procedures, standards andrequirements referring to actual operations covering both the ship breaking process as well as thefollowing phase of re-use or recycling can be identified. The inventory will include a mutualsection for practices related to the identification and handling of materials, items and hazardscovering all involved areas (SHE) representing minimum requirements for the ship breakingfacility and the associated recycling processes. It should also address incidents and requirements
DET NORSKE VERITAS
Report No: 2000-3158, rev. 01
TECHNICAL REPORT
Page 46Reference to part of this report which may lead to misinterpretation is not permissible.
29 August 2000, G/bacit-11.05-final.doc
associated to such (contingency preparedness). At a developed stage this inventory will in effectprovide as an Environmental and Safety Manual for Ship breaking facilities (ESMaS).
Such requirements may cover the facilities themselves as well as operational procedures. Listedbelow are some examples:
1. Facility Layout Work task separation (requirements to work surfaces and drainage);Material separation (waste separation facilities).
2. Operational procedures Use of machinery and tools (procedures when using winches/ cranes,touch cutters, etc. (clearance zone, protective gear ); Handling ofhazardous substances (procedures for personal protection, storage andtransport)
Adopted standards must reflect and comply to national legislations or regulations whereapplicable.
The ESMaS is a managerial tool for the operation containing references to all relevant norms,standards, regulations etc. and provide for implementation, maintenance and continuosimprovements. Based on an identified environmental performance policy to be adopted (by thebreaking facility), the manual will rest on identified environmental performance criteria.Through defined procedures, conformity (or non-conformity) with the identified policy can bemonitored and verified.
4.3.1 Environmental and Safety Manual for Ship breaking facilities (ESMaS).Introducing a managerial SHE-tool in order to systemise the decommissioning, demolition andrecycling processes should focus on;• Implementation ((initial) ambitions to change must reflect realities).• Stepwise improvement ability (experience feedback and continuous improvement).• Should be developed reflecting recommendations of relevant international certification
regimes (ISO 14001 - compliance, etc.).The manual must address all aspects of the SHE-concept in all activity categories (at arrival,intertidal zone, breaking area + re-use/ recycling facilities).
The content and structure of ESMaS is illustrated in figure 4.3.1.
ESMaSSafety/ Health Environment SHE-Contingency and preparedness
Occupational Safety and HealthPlan
Environmental Management Plan Contingency Preparedness and DisasterManagement Plan
Inventory of best practices
Figure 4.3.1 Content and structure of ESMaS.
DET NORSKE VERITAS
Report No: 2000-3158, rev. 01
TECHNICAL REPORT
Page 47Reference to part of this report which may lead to misinterpretation is not permissible.
29 August 2000, G/bacit-11.05-final.doc
4.3.1.1 Company policyThe objective of the ESMaS is based upon individual identified ambitions reflecting any relevantnational/local regulations, recommendations or guidelines. These ambitions represent thecompany policy. ESMaS is simply a tool allowing company policies to be met.
The company policy should account for the nature of its activity including the scale and potentialSHE-related impacts of the processes involved in the different activity categories of shipbreaking. The company policy must be regarded as a commitment including continualimprovement and compliance with any relevant legislations and regulations. The overall policyshould have references to SHE.
Essential in this context is the requirement of training. The company policy should identifyspecific targets in relation to training both at a general level in order to provide awareness butalso specifically addressing SHE.
4.3.1.2 Occupational Safety and HealthThe Occupational safety and Health Plan is developed based on the company safety and healthpolicy and may consist of sections as indicated below:1. Accommodation and facilities; including general requirements covering sanitary as well as
living conditions.2. Working conditions; covering inperations associated to demolition and extraction allowing
safety requirements to be identified.3. Health; including the provision of general healthcare as well as monitoring of workers health.The plan will provide objectives and targets to be met.
Examples may be:• Unified breaks implemented in a scheduled working day.• All vessels arriving for demolition are cleaned and secured, i.e. all tanks are cleaned and
cleared (gas-free) for hot work.• All vessels arriving required to carry an inventory dossier (SIDE).• All workers are required to use basic protection equipment inside the breaking facility
(helmet, boiler-suit, protective boots, and gloves).• All hot work is undertaken by trained personnel equipped with additional protection
equipment (welding goggles, masks, etc.).• De-mounting of structures identified containing hazardous substances (i.e. SIDE) are handled
by dedicated individuals appropriately trained and equipped (i.e. asbestos to be handled usingapproved masks, suits, gloves, boots, goggles, etc).
• Health programme including periodical checks (i.e. annual check) and monitoringprogrammes of exposed workers, etc.
The Occupational Safety and Health Management Plan will make provisions ensuring that suchobjectives and targets are met.
4.3.1.3 Environmental ManagementAn Environmental Management Plan is developed with basis in the company environmentalpolicy. This provides a framework identifying environmental objectives and targets.
Examples may be:
DET NORSKE VERITAS
Report No: 2000-3158, rev. 01
TECHNICAL REPORT
Page 48Reference to part of this report which may lead to misinterpretation is not permissible.
29 August 2000, G/bacit-11.05-final.doc
• All vessels arriving the facility for breaking has undergone cleaning (including tanks, cargoareas, etc).
• All auxiliary systems (those not needed for actual beaching) have been closed down andcleaned (oil, etc. removed).
• All materials categorised as hazardous (ref.: /36/) are treated and disposed off separately.• No combustion to take place unless by the use of (approved) incinerator.The Environmental Management Plan will make provisions ensuring that such objectives andtargets are achieved.
4.3.1.4 Contingency Preparedness and Disaster ManagementThe Contingency Preparedness and Disaster management Plan should identify objectives andtargets with the aim of minimising consequences of any incidents. Based on an evaluation of theoperations and procedures involved, emergency scenarios should be developed. These willprovide input to the plan and allow specific requirements in addition to procedures andguidelines to be identified (facilities, equipment and training). The development of aContingency Preparedness and Disaster Management Plan may identify general requirements tothe operation and may thereby provide inputs to both 4.3.1.2 and 4.3.1.3.
4.3.1.5 Inventory of Best PracticesAn Inventory of Best Practices including guidelines, procedures, standards and requirementscomplying to the respective plans listed previously should be available independent upon theplans. This will provide as a quick reference and ease implementation and training. Followingfindings revealed in chapter 3 and conclusions drawn in previous work (ref.: /1/), it is believedthat even though a generic set of such best practices can be established, these would not beparticularly helpful. This firstly because this may act as an obstacle in the continuousimprovement process and secondly, the particulars from one facility to another may not becompatible.
A tailored Inventory of Best Practices based on present capabilities but including a “continuallyimprovement structure” allowing the adoption of improved practices may also include aninventory of materials that is handled, how it is extracted, how hazards are approached, etc.
4.3.2 Using the BPA to develop the ESMaSThis chapter (chapter 4) has identified a stepwise process taking simple precautionary actionsand applying these systematically to isolated activities. The methodology is partly co-ordinatedwith other works undertaken parallel to this.
The initial requirement when adopting the BPA is to limit the activities that should be involvedand to categorise these systematically. Current procedures and practices can then be identifiedand reviewed and improvements proposed. At this stage, the initiative may be said to representan “initial ESMaS.” However, this initial step is thought vital in order to enable theimplementation of the improvement process. Implementing Best Practices at this stage representthe base for the ESMaS process.
The methodology outlined may require some detailing and adjustments. However, its mainfeatures are believed to be sufficient in order to undertake pilot-cases.
DET NORSKE VERITAS
Report No: 2000-3158, rev. 01
TECHNICAL REPORT
Page 49Reference to part of this report which may lead to misinterpretation is not permissible.
29 August 2000, G/bacit-11.05-final.doc
5 REFERENCES/1/ Norwegian Ministry of the Environment/Norwegian Shipowners Association.
Decommissioning of Ships. Environmental Protection and Ship Demolition Practices.DNV report No. 99-3065. Revision No. 03.
/2/ Khan, A. 1994. Study on oil pollution caused by ocean going vessel’s in Chittagongport and abandoned vessel’s in ship breaking area (Fauzdarhat) with reference toMARPOL 73/78. M. Sc, dissertation (unpublished). Institute of Marine Sciences,Universety of Chittagong, Bangladesh.
/3/ Khan Y. S. A., Talukder A. B. M. A. 1993. Pollution in coastal waters of Bangladesh.The Journal of Noami Vol. 10 No. 1 p 1-11.
/4/ Ahmed R. 1998. Bio-accumulation and seasonal variation of some trace metals inwater, sediment and fish (Lisa subvirdis) of the Bankkhali river estuary, Cox´s Bazar.M. Sc, dissertation (unpublished). Institute of Marine Sciences, University ofChittagong, Bangladesh.
/5/ Rahman H. (1994) Quantitative estimation of some trace metals in water and Scyllaserrata (forskal) inhabiting in the ship-breaking area (Fauzdarhat-Kumira), Chittagong.M. Sc, dissertation (unpublished). Institute of Marine Sciences, University ofChittagong, Bangladesh.
/6/ Talukder A. B. M. A., Khan Y. S. A., Banu S. A., Tarafder S. A. and Alam S. M. M.(1998). Trace metals in the sediment from the coast of Chittagong, Bangladesh. MarineNature 6, pp. 7-14.
/7/ Islam K. L. and Hossain M. M. (1986). Effect of ship scrapping activities on the soiland sea environment in the coastal area of Chittagong, Bangladesh. Marine PollutionBulletin, Vol. 17. No. 10. Pp. 462-463.
/8/ Khan Y. S.A. and Hossain S. M. G. A. (1996) Accumulation and seasonal variation oftrace metals in water, sediment and commercially important fishes and shellfishes ofthe north-east coast of the Bay of Bengal. M. Sc. Thesis, Institute of Marine Sciences,University of Chittagong, Chittagong, Bangladesh.
/9/ Mr. Shajahan Khan. Senior Chemist, Department of Environment, Chittagong. Personalcommunication, 19.02.2000.
/10/ S.M.A Jabber. Research Fellow. University of Chittagong. Personal communicationthrough the on site assessment period.
/13/ Anonymous. Interview with foreman for workers that were re-processing asbestos.Personal communication, 21.02.2000.
/14/ ØkoBygg. Identification, sampling and analyses of mastic in buildings with regard to
DET NORSKE VERITAS
Report No: 2000-3158, rev. 01
TECHNICAL REPORT
Page 50Reference to part of this report which may lead to misinterpretation is not permissible.
29 August 2000, G/bacit-11.05-final.doc
PCB. Reporting of project carried out in 1998 and follow-up project carried out in1999. Projects carried out by DNV.
/15/ Naturvårdsverket. PCB in mastic-large or little problem? Report 4697.
/16/ James Speight. Chemistry and Technology of Petroleum. 1991, Rev. 02.
/17/ Labour Inspection of Norway. Guidance to the Working Environment Act.Administrative norms to pollution in working environment atmosphere 1996. Orderingnumber 361.
/18/ The Directorate for Labour Inspection of Norway. Personal Communication, Eva Haug,05.04.2000.
/19/ A.A. Ansari et al. Status of anthropogenically induced metal pollution in the Kanpur-Unnao industrial region of Ganga Plain, India. Environmental Geology 38 (1) June1999.
/20/ The Norwegian Pollution Control Authority (SFT). Guideline 99:01A. Guideline onrisk assessment of contaminated sites.
/21/ The Norwegian Pollution Control Authority (SFT). Material flow analysis on organotincompounds. SFT report no. 94:07.
/22/ European Community. Environment Legislation. Volume 7. Water. Luxembourg 1992.
/23/ The Norwegian Pollution Control Authority (SFT). PCB in building materials. SFTreport no. 98:09.
/24/ Milliman JD, Rutkowski C, and Meybeck M (1995) River discharge to the sea: a globalriver index (GLORI). Texel: NIOZ, 125 pp.
/25/ Datta D. K., Subramanian V. (1998). Distribution and fractionation of heavy metals inthe surface sediments of the Ganges-Brahmaputra- Meghna river system in the Bengalbasin. Environmental Geology 36 (1–2).
/26/ IAEA (International Atomic Energy Agency), Reference sheet SD-M-2/TM. Traceelements in marine sediments, Vienna, Austria.
/27/ GESAMP (IMO/FAO/UNESCO/WMO/IAEAUN/UNEP), 1982. The health of theOceans. Rep. Stad., GESAMP (15), 108. and UNEP Res. Seas, Rep. Stud., 16: 108p.
/28/ Salomons, W. and Forster, V. 1984. Metals in the Hydrocycle. Berlin, Springer, 394p.
/29/ Elf Petroleum Norge AS. Material Inventory Dossier. Frigg Flare Platform. DNVReport No. 96-3286. Rev no. 01.DNV 24.05.1996.
/30/ Elf Petroleum Norge AS. Material Inventory Dossier. North-East Frigg Field ControlStation. DNV Report No. 96-3308. Rev no. 02. DNV 23.05.1996.
/31/ Chowdhury MI. Safiullah S, 1982. Carbon transport in the Ganges and the
DET NORSKE VERITAS
Report No: 2000-3158, rev. 01
TECHNICAL REPORT
Page 51Reference to part of this report which may lead to misinterpretation is not permissible.
29 August 2000, G/bacit-11.05-final.doc
Brahmaputra: preliminary results. Mittel Geiol Palaontol Inst. Universety of Hamburg52:457-468.
/32/ Khan Y. S. A. and Talukder A. B. M. A. 1993. Pollution in Coastal Waters ofBangladesh. The Journal of Noami, Vol. 10 No. 1, p. 1-11.
/33/ The Environmental Guidelines for Ship-Breaking Industries (EGSI), Central PollutionControl Board, Dehli, India.
Figure 1 Bangladesh and the location of Chittagong.
Figure 2 Location of the shipbreaking area Fauzdarhat noth west of Chittagong.
- o0o -
DET NORSKE VERITAS
Page B-1Report No. 2000-3158, rev. 01
29 August 2000, G/bacit-11.05-final.doc
APPENDIXB
SCHEDULE FOR TRIP TO BANGLADESH
DET NORSKE VERITAS
Page B-2Report No. 2000-3158, rev. 01
29 August 2000, G/bacit-11.05-final.doc
Date Schedule12.02.00 • Departure from Norway13.02.00 • Arrival in Dhaka
• Meeting with Norwegian Embassy in Dhaka• Arrival in Chittagong
14.02.00 • Planning meeting with Dr. Khan• Short boat-trip outside the ship-breaking area
15.02.00 • Strike, discussions with Dr. Khan and his team16.02.00 • Strike, discussions with Dr. Khan and his team17.02.00 • Strike, discussions with Dr. Khan and his team18.02.00 • Boat-trip to get an overview of the ship breaking area
• Sampling of sediment samples• Seawater sampling
19.02.00 • Site assessment (on-shore) in two ship-breaking yards• Air sampling (asbestos, heavy metals and organic compounds)• Sediment samples on yard• Sludge sampling• Asbestos sampling• Water sampling• Meeting with Mr. Shajahan Khan. Senior Chemist, Department of Environment,
Chittagong20.02 • Assessments of different small scale processing industries
• Visit to cold-mill where reinforcement steel was produced from steel plates from thevessels
21.02 • Air samples (asbestos, heavy metals and organic compounds) from workers at scrapprocessing industries and possible asbestos re-processing unit
• Visit to Grease-house Ltd (lubricating oil producing industry)22.02 • Departure from Chittagong
• Debriefing at Norwegian Embassy in Dhaka• Departure form Dhaka