43
Brüel B K & Kjær NO.1 1997 TECHNICAL REVIEW OrthoShear Accelerometer Design QC Test for Knock Sensors Torsional Operational Deflection Shapes

Brüel B K7/6-'89& Kjær
NO.1 1997
HEADQUARTERS: DK-2850 Nærum · DenmarkTelephone: +45 45 80 05 00 · Fax: +45 45 8014 05Internet: http://www.bk.dk · e-mail: [email protected]
BV
0050
–11
ISSN
000
7–
2621
Brüel B K7/6-'89& Kjær
TECHNICAL REVIEWOrthoShear Accelerometer DesignQC Test for Knock SensorsTorsional Operational Deflection Shapes

TechnicalReviewNo. 1 – 1997

Contents
A New Design Principle for Triaxial Piezoelectric Accelerometers .......... 1by Knud Styhr Hansen
A Simple QC Test for Knock Sensors ....................................................... 12S. Gade, S. Møllebjerg Matzen, H. Herlufsen,
Torsional Operational Deflection Shapes (TODS) Measurements ......... 24Svend Gade, Kevin Gatzwiller, Henrik Herlufsen
Copyright © 1997, Brüel & Kjær Sound & Vibration Measurement A/S
All rights reserved. No part of this publication may be reproduced or distributed in any form, or by any means, without prior written permission of the publishers. For details, contact: Brüel & Kjær Sound & Vibration Measurement A/S, DK-2850 Nærum, Denmark.Editor: Harry K. Zaveri Photographer: Peder DalmoLayout: Judith Sarup Printed by Highlight Tryk

A New Design Principle for Triaxial Piezoelectric Accelerometers
by Knud Styhr Hansen
AbstractThe most common way of producing a triaxial piezoelectric accelerometer is tomount three single axial units with their axes perpendicular to each other ina common housing. If the units are shear accelerometers, each unit will mostlikely contain one piezoelectric ring or two or three piezoelectric plates and acorresponding number of seismic masses.
A new design is described in which the many piezoelectric elements and seis-mic masses are replaced by one piezoelectric ring and one seismic mass toform a triaxial shear accelerometer. Apart from the obvious advantage in pro-duction cost, it also gives a much more compact construction which enableslower weight for same sensitivity.
RésuméCet article décrit comment le principe de construction traditionnel d’un accélé-romètre triaxial (une masse sismique et un anneau piézoélectrique pour cha-que axe) peut être remplacé par une conception n’utilisant qu’une massesismique et un anneau pour les trois axes. En réglant le gain des préamplifica-teurs, la sensibilité des axes x, y et z peut être connue avec une incertitude de±5%. Cet article rappelle les modalités du passage d’une conceptionmonoaxiale à une conception biaxiale, puis triaxiale. Cette construction breve-tée est désignée par le nom “Orthoshear” (protégé par copyright).
ZusammenfassungDieser Artikel beschreibt, wie sich die traditionelle Konstruktionsweise vonTriaxialaufnehmern (eine seismische Masse und ein piezoelektrischer Ringpro Achse) durch eine neue Bauart ersetzen läßt, die mit nur einer Masse undeinem piezoelektrischen Ring für sämtliche drei Achsen auskommt. Durch Ju-stieren der Verstärkung in den drei Vorverstärkern läßt sich für alle drei Ach-
1
sen (x, y und z) eine Querempfindlichkeit von weniger als 5% erreichen. DerArtikel beschreibt, wie das Prinzip von der uniaxialen über die biaxiale zurtriaxialen Bauart erweitert wurde. Die Bauart wurde unter dem urheber-rechtlich geschützten Namen “OrthoShear” patentiert.
Basic Principle
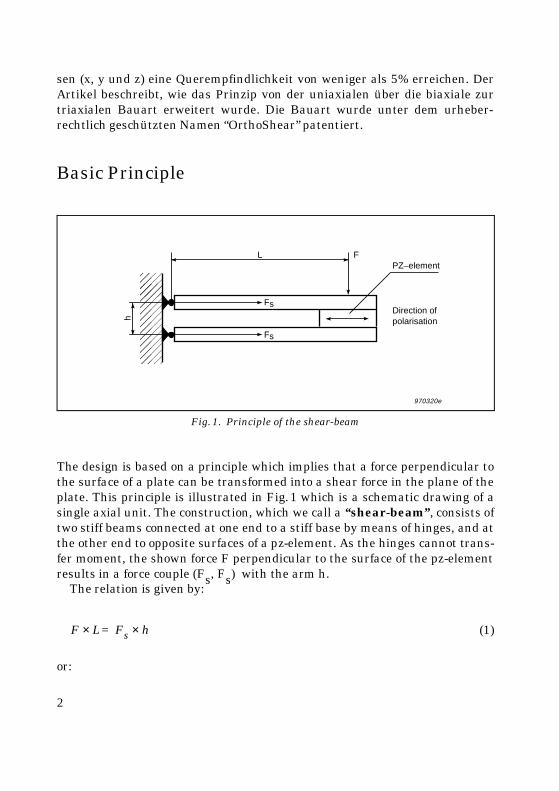
The design is based on a principle which implies that a force perpendicular tothe surface of a plate can be transformed into a shear force in the plane of theplate. This principle is illustrated in Fig.1 which is a schematic drawing of asingle axial unit. The construction, which we call a “shear-beam”, consists oftwo stiff beams connected at one end to a stiff base by means of hinges, and atthe other end to opposite surfaces of a pz-element. As the hinges cannot trans-fer moment, the shown force F perpendicular to the surface of the pz-elementresults in a force couple (Fs, Fs) with the arm h.
The relation is given by:
(1)
or:
Fig. 1. Principle of the shear-beam
970320e
����
h
L FPZ–element
Direction ofpolarisation
Fs
Fs
F L× Fs h×=
2

(2)
As can be seen, the force F perpendicular to the pz-element has been trans-formed to a shear force in the plane of the pz-element. At the same time it hasbeen amplified by the factor L / h.
If the shear-beam in Fig.1 was an accelerometer, the force F would be theinertial force from accelerating the total mass of beams and pz-element and Lwould be the distance from the hinges to the point of gravity of the said totalmass.
The charge sensitivity of such an accelerometer would be:
(3)
where d15
is the piezoelectric constant for shear mode excitation and M is thetotal mass of beams and pz-element.
The expression is valid under the assumption that the hinges are ideal. Inpractice this is difficult to achieve. However, it is sufficient that each arm aloneis much more easily tilted than the combination of the two arms and the pz-ele-ment, and this is not difficult to achieve.
Single Axial Application of PrincipleFig.2 shows a proposal for a single axial accelerometer after the shear-beamprinciple. Here some extra mass has been added to increase the sensitivity. Ascan be seen, the construction is made symmetrical to avoid exciting the cross-axis resonance. At the same time it removes the roll sensitivity. As the two pz-elements are electrically connected in parallel the charge sensitivity will betwice the value mentioned above. The hinges are here realised by weakeningthe arms by notches close to the base. This is sufficiently close to ideal hinges.
In Fig.3a and 3b another example of a single axial accelerometer is shown.Here a seismic mass has been placed between the “arms” and sandwichedbetween two pz-elements.
In Fig.3a the accelerometer is excited in the X-direction as indicated by thehorizontal arrow. In this case the construction can be looked upon as a shear-
Fs F L
h----×=
Qa---- d15 M× L
h---- ;× C
ms 2–--------------=
3

beam design, and the charges on the pz-elements will have a polarity as indi-cated by the plus and minus signs.
In Fig.3b the accelerometer is excited in the Z-direction as indicated by thevertical arrow. In this case the construction is a well-known shear design, andthe charges on the pz -elements will have a polarity as indicated by the plusand minus signs.
The charge sensitivity in the two cases will be:
Shear-beam design: (4)
“Normal” shear design: (5)
In the case of the shear-beam design it should be noted that M is the totalmass of the seismic mass, the two pz-elements, and the arms, whereas in the
Fig. 2. Sketch of single axial shear-beam accelerometer
����
��
����������
970321e
M
PZ PZ
M
M
M ���� ����
Qxa
------- d15= M Lh----××
C
ms 2–--------------;
Qza
------- d15 M C
ms 2–--------------;×=
4

case of the “normal” shear design M is the mass of the seismic mass and half ofthe pz-elements only.
Biaxial Accelerometer From the signs of the charges in Figs.3a and 3b it can be seen that it must bepossible to make a biaxial accelerometer by proper connection of the pz-ele-ments to two amplifiers as shown in Fig.4.
As seen, the right-hand side of the right-hand pz-element is connected to acharge amplifier, the output of which represents the X-channel. The centralmass is connected to a voltage amplifier, the output of which represents the Z-channel. The left-hand side of the left pz-element is connected to ground.
It is worth noting that, although the central mass in both cases is part of thesignal path, no cross-axis sensitivity will result. When vibrated in the Z-direc-tion the voltage generated in the two pz-elements will – seen from the chargeamplifier – cancel each other. Therefore, no signal will be generated in the X-
Fig. 3. Polarity of charges on pz-elements for different directions of excitation
970322e
��
��������
���
+– +–
X
a
��
��������
��
+– –+
Z
b
5

channel. Similarly when vibrated in the X-direction, the signals generated inthe pz-elements will – seen from the voltage amplifier – cancel each other andno signal is generated in the Z-channel. Thus, the two channels are completelyseparated.
It is important that the X-signal is connected to a “virtual zero” input(charge amplifier), and the Z-signal is connected to a high input impedance(voltage amplifier). It is, of course, also important that the two pz-elementshave exactly the same sensitivity and capacity.
Triaxial accelerometerIn Fig.5 an example is shown where this principle has been used to design atriaxial accelerometer. The design in Fig.4 has been extended with two extraarms to form the third axis (the Y-axis) perpendicular to both the X- and the Z-axis. The sketch also shows a clamping ring which clamps the arms, the pz-elements and the mass together.
Fig. 4. Sketch of accelerometer with sensitivity in two directions
970323e���
���
���
����������������
Z
Z
X
X
6
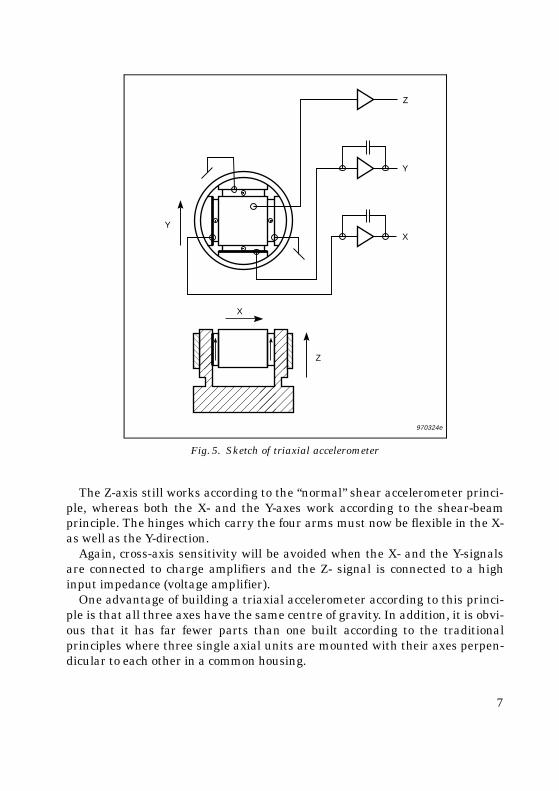
The Z-axis still works according to the “normal” shear accelerometer princi-ple, whereas both the X- and the Y-axes work according to the shear-beamprinciple. The hinges which carry the four arms must now be flexible in the X-as well as the Y-direction.
Again, cross-axis sensitivity will be avoided when the X- and the Y-signalsare connected to charge amplifiers and the Z- signal is connected to a highinput impedance (voltage amplifier).
One advantage of building a triaxial accelerometer according to this princi-ple is that all three axes have the same centre of gravity. In addition, it is obvi-ous that it has far fewer parts than one built according to the traditionalprinciples where three single axial units are mounted with their axes perpen-dicular to each other in a common housing.
Fig. 5. Sketch of triaxial accelerometer
970324e
Z
Y
Y
Z
X
X
������
7
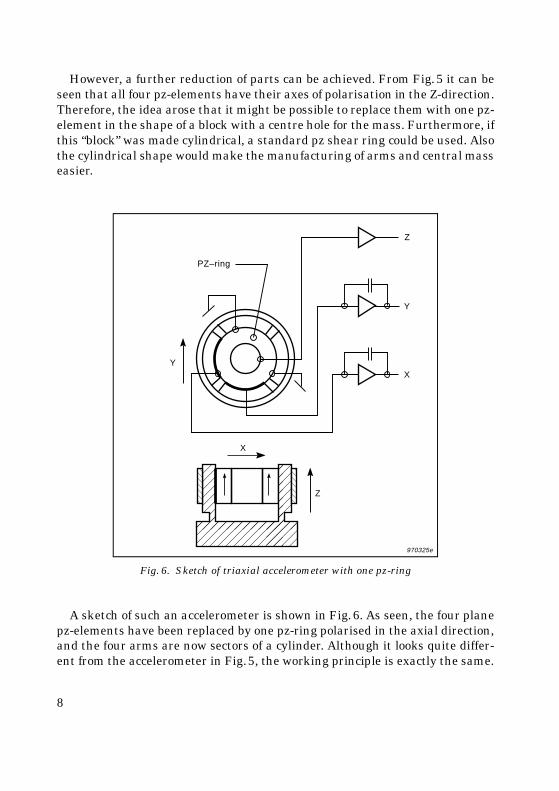
However, a further reduction of parts can be achieved. From Fig.5 it can beseen that all four pz-elements have their axes of polarisation in the Z-direction.Therefore, the idea arose that it might be possible to replace them with one pz-element in the shape of a block with a centre hole for the mass. Furthermore, ifthis “block” was made cylindrical, a standard pz shear ring could be used. Alsothe cylindrical shape would make the manufacturing of arms and central masseasier.
A sketch of such an accelerometer is shown in Fig.6. As seen, the four planepz-elements have been replaced by one pz-ring polarised in the axial direction,and the four arms are now sectors of a cylinder. Although it looks quite differ-ent from the accelerometer in Fig.5, the working principle is exactly the same.
Fig. 6. Sketch of triaxial accelerometer with one pz-ring
Z
Y
Y
PZ–ring
X
Z
X
����
��
970325e
8
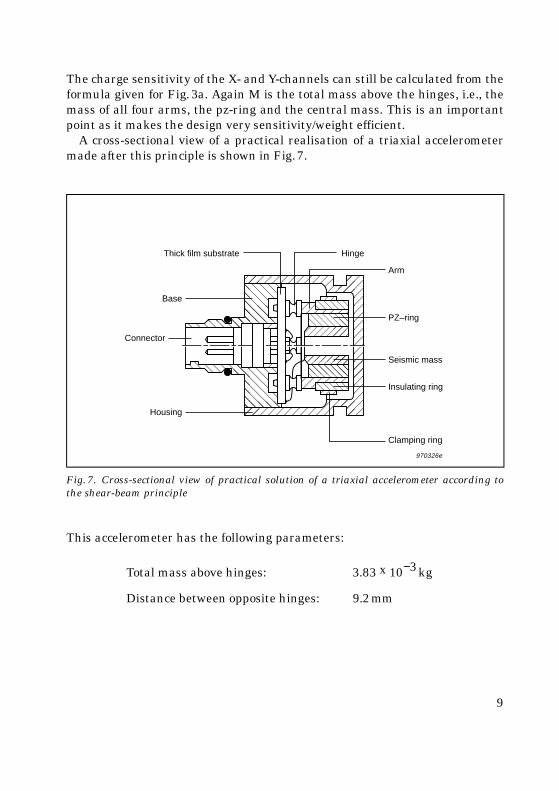
The charge sensitivity of the X- and Y-channels can still be calculated from theformula given for Fig.3a. Again M is the total mass above the hinges, i.e., themass of all four arms, the pz-ring and the central mass. This is an importantpoint as it makes the design very sensitivity/weight efficient.
A cross-sectional view of a practical realisation of a triaxial accelerometermade after this principle is shown in Fig.7.
This accelerometer has the following parameters:
Fig. 7. Cross-sectional view of practical solution of a triaxial accelerometer according tothe shear-beam principle
Total mass above hinges: 3.83 x 10⁻³kg
Distance between opposite hinges: 9.2mm
����������
���
� �� ����
� �� ����
��������
��
970326e
HingeThick film substrate
Base
Housing
Connector
Arm
PZ–ring
Seismic mass
Insulating ring
Clamping ring
9

From these parameters the charge sensitivity in the X- and the Y-directionscan be calculated:
(6)
which is in perfect agreement with the measured specification shown below.
Achieved SpecificationsThe shown accelerometer has the following specifications:
Sensitivity:measured directly at pz-ring:X and Y: 0.7 pC/ms−2
Z: 1.3 mV/ms−2
measured at output of amplifiers:X and Y: 10mV/ms−2
Z 10mV/ms−2
Mounted resonance frequency:X and Y: 9kHzZ: 12kHz
Cross-axis sensitivity: <5%
Dimensions: 17× 17 × 14.5mmWeight: 15 gram
Orthogonal distance between plane of hinges and centre of gravity of mass:
4.2mm
Piezoelectric constant d15
( PZ 23 ): 400pC/N
Qxa
-------Qya
------- d15 M Lh----×× 400 3.83× 10
3–× 4.29.2--------× 0.669 pC/ms
2–= = = =
10

Concluding remarksIt has been proved that it is possible to design a triaxial piezoelectric shearaccelerometer using a single pz-ring. The design has relatively few parts andis very compact. It also has the advantage that the three axes have a commoncentre of gravity. It has a high sensitivity/mass ratio because the total mass ofthe sensor element including arms, clamping ring, etc., constitute the activemass.
11

A Simple QC Test for Knock Sensors
S. Gade, S. Møllebjerg Matzen, H. Herlufsen,
AbstractA simple set-up for quick and purely electrical QC testing of knock sensors isdescribed in this paper. The main goal is to measure the “impedance” fre-quency response function of the sensors. The advantages of the test proce-dure described in this paper are as follows: Simple “pseudo” one channelmeasurement, from the operator’s point of view. Electrical testing, i.e. no needfor shakers, power amplifiers, elaborate fixtures etc.. Pulse excitation, thusvery fast — in the order of 100ms for one measurement test. No averagingneeded. Standard frequency response function display is used, whereby nocomplex postprocessing is required. The only requirement is a small junctionbox with the necessary transformer and some electronics. The power supplyfor the junction box is fed from the analyzer. The testing method can beextended to other types of transducers such as accelerometers.
RésuméCet article décrit une installation simple pour un test de contrôle qualité rapideet purement électrique de capteurs d’accélération pour les moteurs à combus-tion. Le but principal est de mesurer la réponse en fréquence “impédance” descapteurs. Les avantages de la procédure décrite sont les suivants : une simplemesure “pseudo” monovoie (du point de vue de l’opérateur) ; Test électrique,c’est-à-dire sans excitateurs, amplificateurs de puissance, dispositifs comple-xes, etc.; Excitation impulsionnelle très rapide (de l’ordre de 100ms parmesure d’essai) ; Pas de moyennage requis ; Affichage standard de la fonctionde réponse en fréquence ( pas de post-traitement compliqué requis). Le seul élé-ment nécessaire est une petite boîte de jonction avec transformateur et circuitsélectroniques. La boîte de jonction est alimentée par l’analyseur. Cetteméthode de test peut être élargie à d’autres types de capteurs, notamment lesaccéléromètres.
12

ZusammenfassungDieser Artikel beschreibt eine einfache Anordnung zur schnellen und reinelektrischen Qualitätsprüfung von Klopfsensoren. Das Hauptziel bestehtdarin, den “Impedanz”-Frequenzgang der Sensoren zu messen. Die beschrie-bene Prüfmethode besitzt folgende Vorteile: Einfache “Pseudo”-Einkanalmes-sung aus der Sicht des Bedieners. Elektrische Prüfung, d.h., keine Shaker,Leistungsverstärker, komplizierte Halterungen etc., erforderlich. Durch Ver-wendung von Pulsanregung sehr schnell – in der Größenordnung von 100msfür einen Meßtest. Keine Mittelung erforderlich. Es wird die Standard-Fre-quenzgangdarstellung verwendet, d.h. keine komplexe Nachverarbeitung er-forderlich. Benötigt wird lediglich ein kleiner Anschlußkasten mit demnotwendigen Transformator und etwas Elektronik. Der Anschlußkasten wirdvom Analysator versorgt. Die Prüfmethode läßt sich auf andere Sensoren wieBeschleunigungsaufnehmer erweitern.
IntroductionA knock sensor is an acceleration transducer for ignition systems, whichincorporate knock control. A knock sensor uses a piezoelectric element tomeasure the inertial forces exerted upon a seismic mass. The typical fre-quency range and vibration amplitude are from 5 kHz to 15 kHz and approxi-mately 100 m/s2 respectively.
Internal-combustion engines are damaged by combustion knock, so knockcontrol serves to prevent knocking under all operating conditions. The knocksensor is installed in a location, which is selected for its optimum knock-detec-tion properties.
There are resonant and non-resonant types of knock-sensors. A resonantsensor has a high frequency selectivity and gives a high output in the case ofknocking. In general, there is a first mode frequency between 5 kHz and10kHz and a second mode frequency above 10kHz. Which mode is exciteddepends upon the engine type. This type of sensor has an excellent signal tonoise ratio for engine speeds from 1000 RPM to 5000 RPM.
A non-resonant type has a flat frequency characteristic. Therefore this is ageneral purpose sensor, which is often mounted on to the cylinder block.Ref . [1].
Knock sensors are inexpensive transducers and widely used in the automo-tive industry. Therefore there is a need for a simple and inexpensive methodfor QC production-testing of these transducers.
13
The piezoelectric charge-mode knock-sensor behaves like a single degree offreedom spring-mass system. The spring is the piezoceramic crystal and themass is the seismic mass mounted on the crystal. The mounted resonance ofthe sensor is the resonance of this internal spring-mass system only, that is,the resonance when the transducer base is firmly mounted to a mass muchlarger than the seismic mass. Due to the simplicity of this structure, themounted resonance frequency signature provides an indication of the integrityof the structure. If the mounted resonance frequency signature is “normal”,then the sensor is intact and it is reasonable to infer that the charge sensivityin picoCoulomb per g or per m/s2, at all frequencies is within specifications.Thus the intention of this method is not to carry out an absolute gain calibra-tion of the sensors, but to perform a quick check. In this paper it is also demon-strated that testing the unmounted resonance frequency is sufficient due tothe relatively heavy base of the specific knock sensors tested in these measure-ments.
In the following a procedure for a simple test method is presented. Themethod relies on a derived reciprocity principle, i.e. instead of a mechanicalinput causing an electrical output we apply an electrical input causing amechanical response, which we on the other hand do not measure directly butrather measure the derived electrical response due to this mechanicalresponse. Thus the method is useful as mentioned earlier for QC productiontesting of knock-sensors.
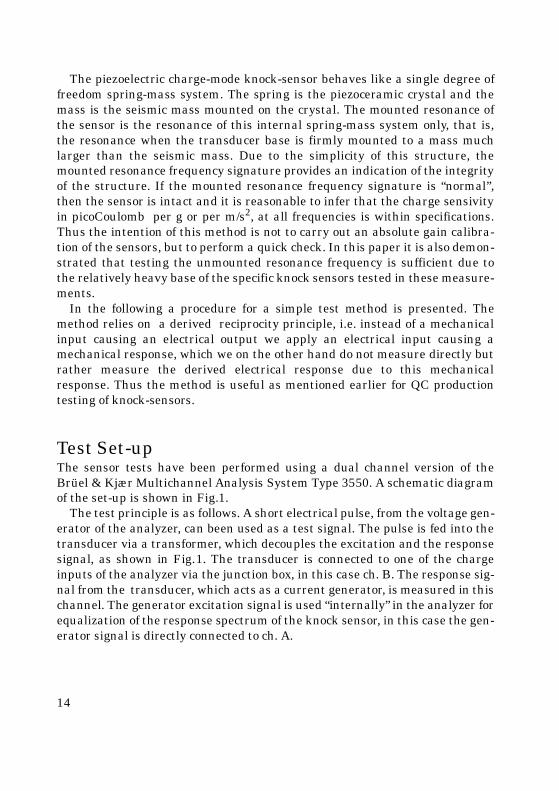
Test Set-upThe sensor tests have been performed using a dual channel version of theBrüel & Kjær Multichannel Analysis System Type 3550. A schematic diagramof the set-up is shown in Fig.1.
The test principle is as follows. A short electrical pulse, from the voltage gen-erator of the analyzer, can been used as a test signal. The pulse is fed into thetransducer via a transformer, which decouples the excitation and the responsesignal, as shown in Fig.1. The transducer is connected to one of the chargeinputs of the analyzer via the junction box, in this case ch. B. The response sig-nal from the transducer, which acts as a current generator, is measured in thischannel. The generator excitation signal is used “internally” in the analyzer forequalization of the response spectrum of the knock sensor, in this case the gen-erator signal is directly connected to ch. A.
14

The frequency response is calculated as the ratio between the measuredspectrum of the transducer response and the generator signal, Ref.[4]. Thiseliminates any undesirable influence from the shape of the input spectrum.
Since the test signal is a short pulse, it is recommended to use a short tran-sient weighting function, which is long enough to inlude the full pulse includ-ing any ringing due to antialiasing filtering as well as the ringing of theresponse signal due to the resonances of the test object itself. Thus the lengthof the weighting function may be longer in the response channel than in theexcitation channel. Some leading and trailing tapering (not shown) have beenapplied in order to minimize leakage errors due to truncation. These transientweighting functions will improve the signal to noise ratio in the analysis com-pared to the use of rectangular (i.e. no) weighting. In this case the S/Nimprovements are 12dB and 6dB for channel A and channel B respectively.Ref. [3].
Since the property of primary interest is the resonance frequency for thesensor under test, 22.4Hz highpass filters have been chosen in the inputamplifier. The Brüel&Kjær Multichannel Analysis System Type 3550 meas-urement set-up parameters are shown below.
Fig. 1. Schematic diagram of test set-up
Junction boxand
Transformer
Multichannel Analysis System3550
Ch. A Ch. B Gen.KnockSensor
970102e
15
All other settings are default values.
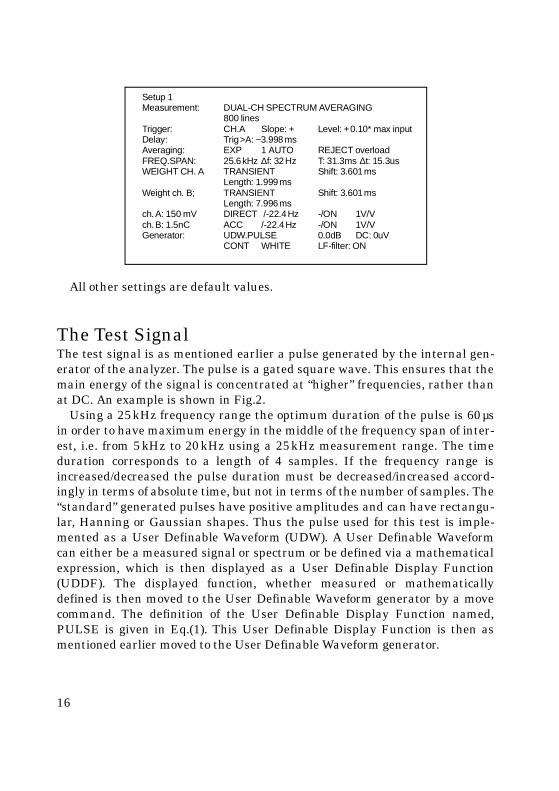
The Test SignalThe test signal is as mentioned earlier a pulse generated by the internal gen-erator of the analyzer. The pulse is a gated square wave. This ensures that themain energy of the signal is concentrated at “higher” frequencies, rather thanat DC. An example is shown in Fig.2.
Using a 25kHz frequency range the optimum duration of the pulse is 60µsin order to have maximum energy in the middle of the frequency span of inter-est, i.e. from 5kHz to 20kHz using a 25kHz measurement range. The timeduration corresponds to a length of 4 samples. If the frequency range isincreased/decreased the pulse duration must be decreased/increased accord-ingly in terms of absolute time, but not in terms of the number of samples. The“standard” generated pulses have positive amplitudes and can have rectangu-lar, Hanning or Gaussian shapes. Thus the pulse used for this test is imple-mented as a User Definable Waveform (UDW). A User Definable Waveformcan either be a measured signal or spectrum or be defined via a mathematicalexpression, which is then displayed as a User Definable Display Function(UDDF). The displayed function, whether measured or mathematicallydefined is then moved to the User Definable Waveform generator by a movecommand. The definition of the User Definable Display Function named,PULSE is given in Eq.(1). This User Definable Display Function is then asmentioned earlier moved to the User Definable Waveform generator.
Setup 1Measurement: DUAL-CH SPECTRUM AVERAGING
800 linesTrigger: CH.A Slope: + Level: +0.10* max inputDelay: Trig>A: −3.998msAveraging: EXP 1 AUTO REJECT overloadFREQ.SPAN: 25.6kHz ∆f: 32Hz T: 31.3ms ∆t: 15.3usWEIGHT CH. A TRANSIENT Shift: 3.601ms
Length: 1.999msWeight ch. B; TRANSIENT Shift: 3.601ms
Length: 7.996msch.A: 150 mV DIRECT /-22.4Hz -/ON 1V/Vch.B: 1.5nC ACC /-22.4Hz -/ON 1V/VGenerator: UDW.PULSE 0.0dB DC: 0uV
CONT WHITE LF-filter: ON
16
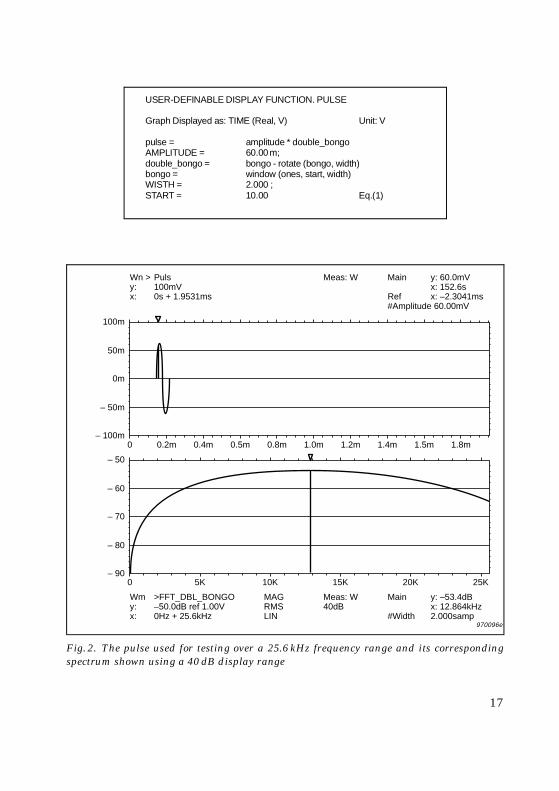
Fig. 2. The pulse used for testing over a 25.6 kHz frequency range and its correspondingspectrum shown using a 40 dB display range
USER-DEFINABLE DISPLAY FUNCTION. PULSE
Graph Displayed as: TIME (Real, V) Unit: V
pulse = amplitude * double_bongoAMPLITUDE = 60.00m;double_bongo = bongo - rotate (bongo, width)bongo = window (ones, start, width)WISTH = 2.000 ;START = 10.00 Eq.(1)
970096e
100m
Wn >y:x:
Puls100mV0s + 1.9531ms
Main Ref #Amplitude 60.00mV
Meas: W
50m
0m
– 50m
– 100m
– 50
– 60
– 70
– 80
– 90
0
0 5K 10K 15K 20K 25K
0.2m 0.4m 0.5m 0.8m 1.0m 1.2m 1.4m 1.5m 1.8m
y: 60.0mVx: 152.6sx: –2.3041ms
Wmy:x:
>FFT_DBL_BONGO–50.0dB ref 1.00V0Hz + 25.6kHz
Main #Width
Meas: W40dB
MAGRMSLIN
y: –53.4dBx: 12.864kHz2.000samp
17

The generator also includes a wide range of “standard” signals, such as ran-dom, burst random, pseudo-random, periodic random, single or dual fixed orswept sines and pulses of various shapes and lengths.
A pulse (called bongo) of two samples (width) with 1V positive amplitude(ones) is located in start element 10 (and 11). By use of the rotate command asecond pulse with negative amplitude is created, but shifted (rotated) by thewidth of two samples. Thus, this combined pulse is optimized for use in anybaseband frequency range. The amplitude factor of 0.06 relative to 1V (seeFig.2, upper) is used in order to avoid overload and distortion in the chosentransformer. Amplitude, Width and Start parameters are User Definable Vari-ables (UDVar) for ease of alteration and these parameters are located in thecursor set-ups as shown in Fig.2.
Test Results for some Knock SensorsA typical test result from a resonant type knock sensor is shown in Fig.3. Thetwo results are from a 102.4kHz range and a 12.8kHz range, respectively.
Due to low excitation signal level at low frequencies for this particular testsignal, measurements or rather the numerical calculations at frequenciesbelow 500Hz are unreliable and have been blanked out. The blank limit is aselectable parameter in the analyzer. If low frequencies rather than the reso-nance frequency is of primary interest, a different test signal, for example, arectangular pulse, which is a standard generator waveform, should have beenused, but as stated earlier the typical range of interest is from 5kHz to 20kHz.
In order to develop a realistic test method the transducer must normally bemounted on a heavy seismic mass. In this case a 4kg block of steel has beenused. This is due to the well-known fact that the unmounted resonance fre-quency is higher than the mounted resonance frequency. Ref. [2]. Fig.4 showsthis difference. The first resonance is hardly changed basically due to the factthat the sensor under test has a relatively heavy base, while the second reso-nance, in case of unmounted, is increased in frequency by 1.2%, the level isincreased by 4.1dB and the relative damping is decreased by a factor of 2 from0.65% to 0.35% of critical damping. Thus for testing the frequency location ofthe first resonance, unmounted transducers can be used, which will increasetesting speed.
A typical example of a test on a non-resonant knock transducer is shown inFig.5.
For the non-resonant type it can be seen that there are no distinct reso-nances in the mounted case. Actually the non-resonant sensor is best suited for
18
unmounted QC testing since this case shows a clean and pronounced reso-nance.
Verification of the Test Procedure using a Standard AccelerometerThe described test has also been applied to a “well-known” object, namely,Brüel&Kjær Charge Accelerometer Type 4382. The results are in full agree-ment with a traditional dual channel (mechanical input/electrical output)shaker test, except for the fact that the absolute sensitivity (pC/m/s2) is notmeasured. Note that the method can only be used on a transducer that exhib-
Fig. 3. Test of a resonant Knock sensor using different frequency ranges
970097e
–150
Wny:x:
Freq Resp H1–157.0dB 20dB0Hz + 102.4kHz#Avg: 592
Main x_yMax:
KN_1_100
–155
–170
– 175
– 150
– 160
– 170
– 180
– 190
0
0 2K 4K 6K 8K 10K 12K
10k 20k 30k 40k 50k 60k 70k 80k 90k 100k
y: –158.1dBx: 22.656kHz
22.656kHz
MAG
LIN
Wny:x:
Freq Resp H1–150.0dB 40dB0Hz + 12.8kHz#Avg: 568
Main x_yMax:
KN_1_12 y: –152.8dBx: 5.424kHz
5.424kHz
MAG
LIN
19
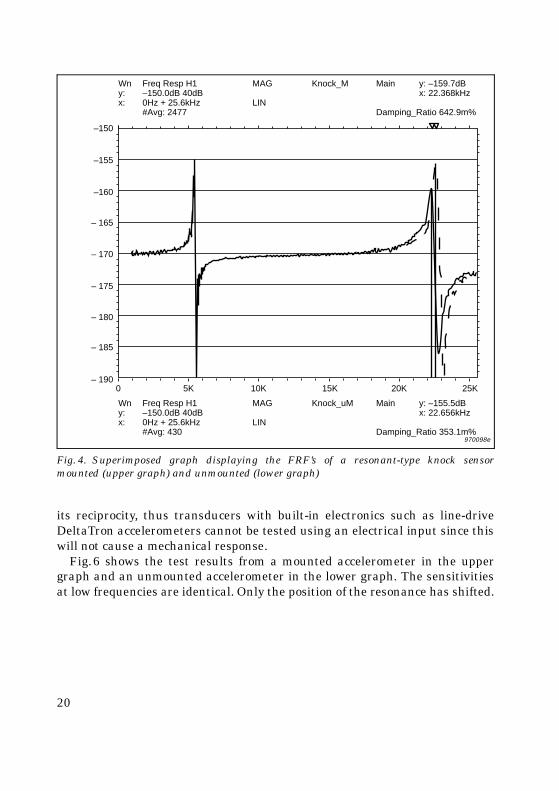
its reciprocity, thus transducers with built-in electronics such as line-driveDeltaTron accelerometers cannot be tested using an electrical input since thiswill not cause a mechanical response.
Fig.6 shows the test results from a mounted accelerometer in the uppergraph and an unmounted accelerometer in the lower graph. The sensitivitiesat low frequencies are identical. Only the position of the resonance has shifted.
Fig. 4. Superimposed graph displaying the FRF’s of a resonant-type knock sensormounted (upper graph) and unmounted (lower graph)
–150
Wny:x:
Freq Resp H1–150.0dB 40dB0Hz + 25.6kHz#Avg: 2477
Main Damping_Ratio 642.9m%
Knock_M
–155
–160
– 165
– 170
– 175
– 180
– 185
– 1900 5K 10K 15K 20K 25K
y: –159.7dBx: 22.368kHz
MAG
LIN
Wny:x:
Freq Resp H1–150.0dB 40dB0Hz + 25.6kHz#Avg: 430
Main Damping_Ratio 353.1m%
Knock_uM y: –155.5dBx: 22.656kHz
MAG
LIN
970098e
20
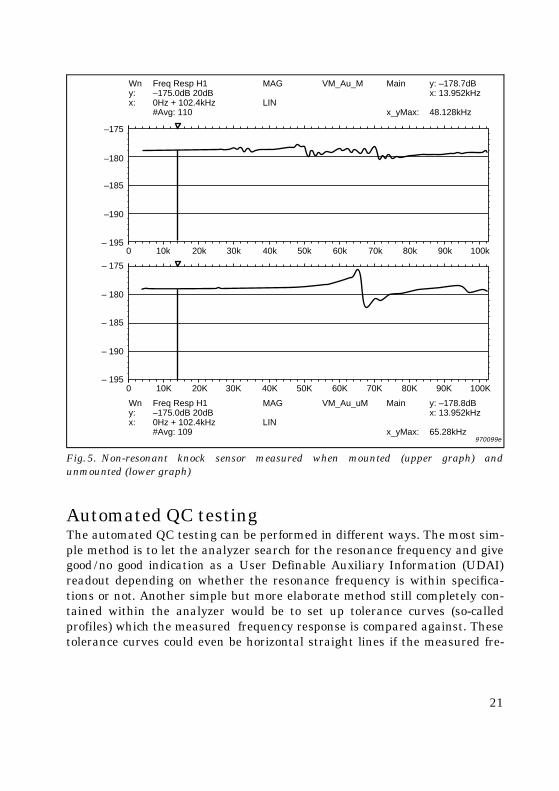
Automated QC testingThe automated QC testing can be performed in different ways. The most sim-ple method is to let the analyzer search for the resonance frequency and givegood/no good indication as a User Definable Auxiliary Information (UDAI)readout depending on whether the resonance frequency is within specifica-tions or not. Another simple but more elaborate method still completely con-tained within the analyzer would be to set up tolerance curves (so-calledprofiles) which the measured frequency response is compared against. Thesetolerance curves could even be horizontal straight lines if the measured fre-
Fig. 5. Non-resonant knock sensor measured when mounted (upper graph) andunmounted (lower graph)
970099e
–175
Wny:x:
Freq Resp H1–175.0dB 20dB0Hz + 102.4kHz#Avg: 110
Main x_yMax:
VM_Au_M
–185
–180
–190
– 195
– 175
– 180
– 185
– 190
– 195
0
0 10K 20K 50K40K30K 70K60K 80K 90K 100K
10k 20k 30k 40k 50k 60k 70k 80k 90k 100k
y: –178.7dBx: 13.952kHz
48.128kHz
MAG
LIN
Wny:x:
Freq Resp H1–175.0dB 20dB0Hz + 102.4kHz#Avg: 109
Main x_yMax:
VM_Au_uM y: –178.8dBx: 13.952kHz
65.28kHz
MAG
LIN
21

quency response is equalized by the frequency response of a “good” referenceknock sensor.
Many more advanced methods using signal classification by the use of, forexample, Neural Networks are well described in literature and the discussionof signal classification is outside the scope of this paper.
ConclusionThe results show that it is possible to use the proposed method for the testingof mounted, as well as unmounted resonant types of knock sensors. An
Fig. 6. Brüel & Kjær Accelerometer Type 4382 tests, mounted (upper) and unmounted(lower)
970100e
–170
Wny:x:
Freq Resp H1–170.0dB 20dB0Hz + 25.6kHz#Avg: 219
Main x_yMax:
VM_Au_M
–180
–175
–185
– 190
– 170
– 175
– 180
– 185
– 190
0
0 5K 10K 25K20K15K 35K30K 40K 45K 50K
5k 10k 15k 20k 25k
y: –174.8dBx: 23.392kHz
23.392kHz
MAG
LIN
Wny:x:
Freq Resp H1–170.0dB 20dB0Hz + 51.2kHz#Avg: 391
Main x_yMax:
4382_uM y: –174.4dBx: 38.464kHz
38.464kHz
MAG
LIN
22

unmounted test procedure might reduce the testing time considerably, sinceno mounting of the sensor is required. The technique may also be used fornon-resonant types since these types show a clear resonance, whenunmounted.
The advantages of this test procedure compared to traditional vibration exci-tation methods are as follows:1) Simple “pseudo” one channel measurement, from the operator´s point of
view.2) Electrical testing, i.e. no need for shaker, power amplifier, elaborate fixture,
etc.3) Pulse testing, thus very fast – in the order of 100ms for one measurement. 4) No averaging is needed (although some averaging has been applied in the
examples).5) No influence of ringing of antialiasing filters (due to the fact that dual chan-
nel calculations are performed).6) No (generator) impedance load of the knock transducer.7) Standard frequency response function display is used. Therefore no com-
plex (computer) postprocessing is needed.8) No need for switching networks, for the signal generator or the analyzer
inputs.The only requirement is a small junction box with the necessary transformer
and some electronics. The power supply for the junction box used is supplied bythe analyzer.
The principle described in this paper is similar to the patented “Accelerome-ter Mounted Resonance Test” found in the Brüel & Kjær Measuring AmplifierType 2525.
References[1] “Automotive Handbook”, (3rd Ed.), BOSCH, ISBN 1-65091-372-X
[2] “Piezoelectric Accelerometers and Vibration Preamplifiers”,Brüel&Kjær Handbook, BB 0694
[3] Gade, Herlufsen: “Windows to FFT Analysis”, (Brüel&Kjær TechnicalReview Nos. 3 & 4, 1987.)
[4] Herlufsen: “Dual Channel FFT Analysis”, (Brüel&Kjær TechnicalReview Nos.1 & 2, 1984.)
23
Torsional Operational Deflection Shapes (TODS) Measurements
Svend Gade, Kevin Gatzwiller, Henrik Herlufsen
AbstractThis article describes the concept and basic technique of measuring torsionaloperational deflection shapes using a laser-based torsional vibration meter, adual-channel FFT analyzer and operational deflection shapes software run-ning on a PC.
Torsional Operational Deflection Shapes (TODS) is defined similar to ODS(Operational Deflection Shapes), with the exception that TODS designatesthe operational deflection shapes of structures vibrating in a rotational, orangular, degree of freedom. Thus the TODS measurements can be applied torotating shafts and the results of such a measurement are shown. In somecases it may be of great benefit to apply order tracking and/or synchronoustime domain averaging techniques in order to avoid smearing and reducenoise problems.
RésuméCet article décrit le principe et la technique de base pour les mesures des modesde déformation angulaire en fonctionnement (déformations par torsion) à l’aided’un mesureur de vibrations angulaires par effet laser, d’un analyseur FFTbicanal et d’un logiciel PC de calcul de déformées en fonctionnement.
Une déformée angulaire en fonctionnement (Torsional Operational DeflectionShapes = TODS) se définit similairement à une déformée en fonctionnement(Operational Deflection Shapes = ODS), à ceci près que TODS désigne la défor-mation de structures vibrant selon un degré de liberté rotationnel, ou angu-laire. Ce type de mesures peut donc être appliqué aux arbres en rotation. Lesrésultats de telles mesures sont montrés ici. Dans certains cas, il peut êtreavantageux de mettre en œuvre une analyse d’ordre et/ou une technique demoyennage synchrone pour éviter un étalement des composantes et les problè-mes dus au bruit.
24
ZusammenfassungDieser Artikel beschreibt das Konzept und die Grundtechnik für die Messungvon Dreh-Betriebsschwingformen mit einem Drehschwingungsmesser auf La-serbasis, einem Zweikanal-FFT-Analysator und Betriebsschwingform-Soft-ware auf einem PC.
Dreh-Betriebsschwingformen (Torsional Operational Deflection Shapes,TODS) sind analog den Betriebsschwingformen (Operational DeflectionShapes, ODS) definiert, mit dem einzigen Unterschied, daß TODS die Be-triebsschwingformen von Strukturen beschreiben, die mit einem Rotations-Freiheitsgrad schwingen. TODS-Messungen lassen sich daher auf rotierendeWellen anwenden. Die Ergebnisse einer solchen Messung werden vorgestellt.In manchen Fällen kann es sehr vorteilhaft sein, Ordnungsanalyse und/odersynchrone Zeitsignalmittelungstechniken anzuwenden, um “Verschmieren”und Störsignalprobleme zu vermeiden.
IntroductionOperational Deflection Shapes (ODS), designates the periodic motion patternof a vibrating structure at a specific frequency and under a particular station-ary, operating condition. An ODS is an observation, or visualization, of a par-ticular dynamic behaviour. ODS of a vibrating structure can provide veryuseful information to aid in the understanding of the dynamic behaviour of amachine, a component or an entire structure, in particular when searching asolution to a dynamic problem [1].
Torsional Operational Deflection Shapes (TODS) are defined similar toODS, with the exception that TODS designates the operational deflectionshapes of structures vibrating in a rotational, or angular, degree of freedom.Determining the ODS, or TODS, of a structure requires the measurement andanalysis of the response signals from the vibrating structure.
Measuring Angular or Rotational VibrationMeasurement of angular vibration, particularly in the field, has heretoforeposed several practical problems. Conventional angular vibration transducersystems have required the insertion of sensors such as strain gauge sensormodules, gear tooth wheels or optical encoders requiring the “disecting” ofshafts unless located at a shaft end, or have been restricted to accessible por-
25

tions of the shaft system. Signal conditioning and phase demodulationprocessing add to the problems by limiting the frequency range and dynamicrange of the measurement. Furthermore, calibration is usually difficult to per-form [2].
The Brüel&Kjær’s Torsional Vibration Meter Type 2523, provides a fast andeasy means of measuring angular vibrations anywhere on a visible part of arotating shaft, fulfilling one of the most important demands for measuring tor-sional operational deflection shapes, namely the ability to move the angularvibration transducer to a set of measurement positions.
The Torsional Vibration Meter Type 2523 is based on a patented dual laserbeam principle where two laser beams are radiated from a laser transducerand pointed towards the shaft, rotating with at least 30RPM (optionally downto 5RPM).
The amount of measured Doppler shift in the two laser beams is propor-tional to the rotational speed, which is measured directly in RPM.
Any angular vibrations in the shaft, superimposed onto the steady rota-tional speed of the shaft, will be detected as well, causing the signal on thedetector to be frequency modulated at the same frequency as the frequency ofthe measured angular vibration.
The Torsional Vibration Meter requires retro-reflective tape to be attachedaround the shaft [3].
Measuring Torsional Operational Deflection ShapesExpanding a normal, i.e. a one-plane angular vibration measurement with aTODS measurement can be extremely useful in many applications.
The most important benefit of a TODS measurement is that it provides ananimated picture of the torsional deformation at critical frequencies (typicallya harmonic component close to a torsional natural frequency) under operatingconditions.
A visualization of the torsional deformation shape provides a better under-standing of the vibrational problem and consequently, this can help in creatingthe basis for a better solution to the problem.
26
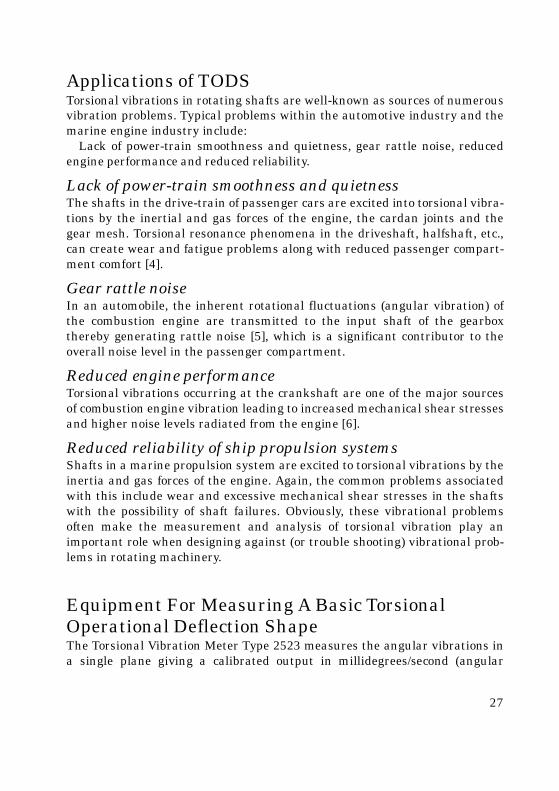
Applications of TODSTorsional vibrations in rotating shafts are well-known as sources of numerousvibration problems. Typical problems within the automotive industry and themarine engine industry include:
Lack of power-train smoothness and quietness, gear rattle noise, reducedengine performance and reduced reliability.
Lack of power-train smoothness and quietnessThe shafts in the drive-train of passenger cars are excited into torsional vibra-tions by the inertial and gas forces of the engine, the cardan joints and thegear mesh. Torsional resonance phenomena in the driveshaft, halfshaft, etc.,can create wear and fatigue problems along with reduced passenger compart-ment comfort [4].
Gear rattle noiseIn an automobile, the inherent rotational fluctuations (angular vibration) ofthe combustion engine are transmitted to the input shaft of the gearboxthereby generating rattle noise [5], which is a significant contributor to theoverall noise level in the passenger compartment.
Reduced engine performanceTorsional vibrations occurring at the crankshaft are one of the major sourcesof combustion engine vibration leading to increased mechanical shear stressesand higher noise levels radiated from the engine [6].
Reduced reliability of ship propulsion systemsShafts in a marine propulsion system are excited to torsional vibrations by theinertia and gas forces of the engine. Again, the common problems associatedwith this include wear and excessive mechanical shear stresses in the shaftswith the possibility of shaft failures. Obviously, these vibrational problemsoften make the measurement and analysis of torsional vibration play animportant role when designing against (or trouble shooting) vibrational prob-lems in rotating machinery.
Equipment For Measuring A Basic Torsional Operational Deflection ShapeThe Torsional Vibration Meter Type 2523 measures the angular vibrations ina single plane giving a calibrated output in millidegrees/second (angular
27

velocity) or in millidegrees (angular displacement). Thus, when measuring theTorsional Operational Deflection Shape, subsequent measurements must beperformed at different planes along the shaft where the phase of the torsionalvibration between the different planes must be determined as well. ABrüel&Kjær Tacho Probe MM0024 is used as a reference transducer toobtain this phase information. Fig.1 shows the set-up.
The Torsional Operational Deflection Shape measurement is therefore per-formed by fixing and aiming the tacho probe at an arbitrary point on the shaftand moving the Torsional Vibration Meter Type 2523 along the shaft, measur-ing at different positions. At each point, the Torsional Vibration Meter Type2523 will provide the torsional vibration amplitude (in millidegrees or degrees/second depending upon the mode of operation). Channel B of the MultichannelAnalysis System Type 3550 is connected to the AC output of the TorsionalVibration Meter Type 2523 and Channel A is connected to the Tacho ProbeMM0024.
Fig. 1. TODS set-up with instruments
930169e
IEEEInterface
Multi ChannelAnalysis System
3550
IBM XT/ATor PS/2
Graphics Plotter2319 (optional)
Printer (optional)
WT 9380Disk
Tacho ProbeMM 0024
Torsional Vibration Meter2523
28

At the frequency of interest, i.e. the torsional natural frequency beingexcited, the Complex Spectrum (i.e. phase assigned autospectrum) of the Mul-tichannel Analysis System Type 3550 will provide the vibration amplitude aswell as phase information. However, no manual data interpretation isrequired: the Personal Computer, running the WT9380 Operational DeflectionShapes Software, is used for complete analyzer control, transfer of transmissi-bility data, data processing and deflection shape presentation (animation).
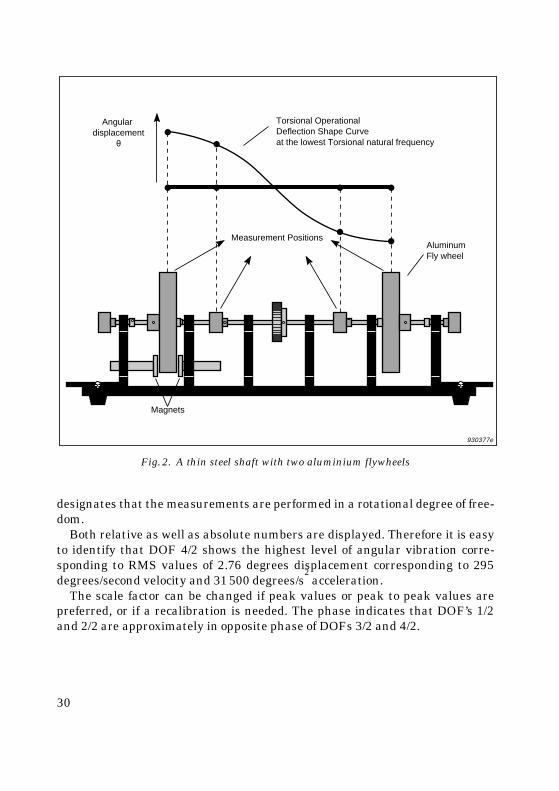
Measurement SetupA Torsional Operational Deflection Shapes measurement was performed on athin steel shaft with two aluminium flywheels, rigidly mounted at the ends ofthe shaft. The shaft, symmetrically built and supported by six roller bearings,is made to rotate, at variable speed, by means of an electric motor. Thismechanical system possesses a number of natural frequencies (in the transla-tional as well as in the rotational degrees of freedom), of which the first tor-sional natural frequency is excited by two permanent magnets mounted intwo of the bearing housings and two other magnets are positioned at equaldistance, on one of the aluminium flywheels.
During rotation of the shaft the speed of rotation was fine-tuned to coincideexactly with the first torsional natural frequency, thereby creating a (station-ary) torsional resonance situation. The torsional operational deflection shapewas as shown in Fig.2, i.e. the two ends of the shaft have the same torsionalvibration amplitude, but a phase difference of approximately 180°. The nodalpoint is found to be in the middle of the shaft due to the symmetrical design.Four measurement positions were defined as indicated in Fig.2.
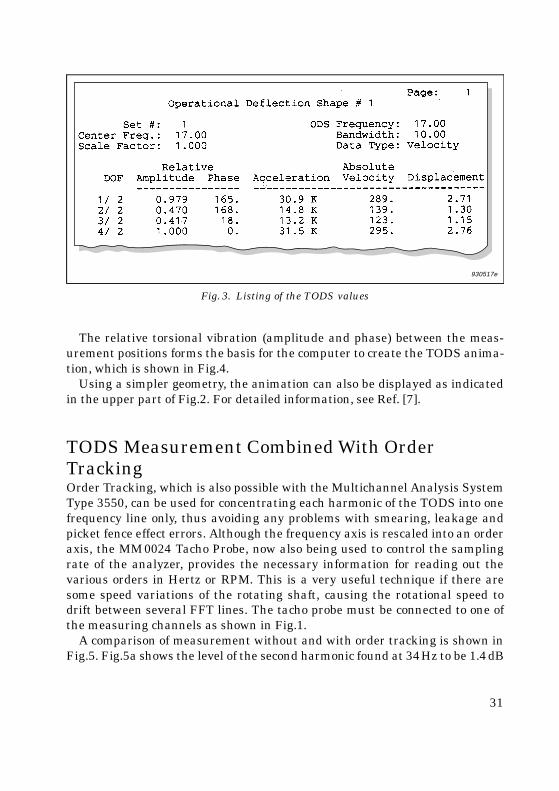
Measurement ResultsThe result of the direct TODS measurement, i.e. the absolute angular vibra-tion measured at the four measurement positions and the relative torsionalvibration between the four measurement positions, are shown in Fig.3 as aprint-out from the WT9380 ODS-software. The TODS frequency is identifiedto be 17.0Hz within a “curvefit” bandwidth of 10Hz and a resolution of 0.5Hz.The data type is velocity, since the output of the Torsional Vibration Meter isproportional to the angular velocity.
The DOF (Degree of Freedom) column specifies the four measurement posi-tions. Due to the fact that cylindrical coordinates have been used the suffix 2
29
designates that the measurements are performed in a rotational degree of free-dom.
Both relative as well as absolute numbers are displayed. Therefore it is easyto identify that DOF 4/2 shows the highest level of angular vibration corre-sponding to RMS values of 2.76 degrees displacement corresponding to 295degrees/second velocity and 31500 degrees/s
2 acceleration.
The scale factor can be changed if peak values or peak to peak values arepreferred, or if a recalibration is needed. The phase indicates that DOF’s 1/2and 2/2 are approximately in opposite phase of DOFs 3/2 and 4/2.
Fig. 2. A thin steel shaft with two aluminium flywheels
930377e
Angular displacement
θ
AluminumFly wheel
Measurement Positions
Torsional OperationalDeflection Shape Curveat the lowest Torsional natural frequency
Magnets
30
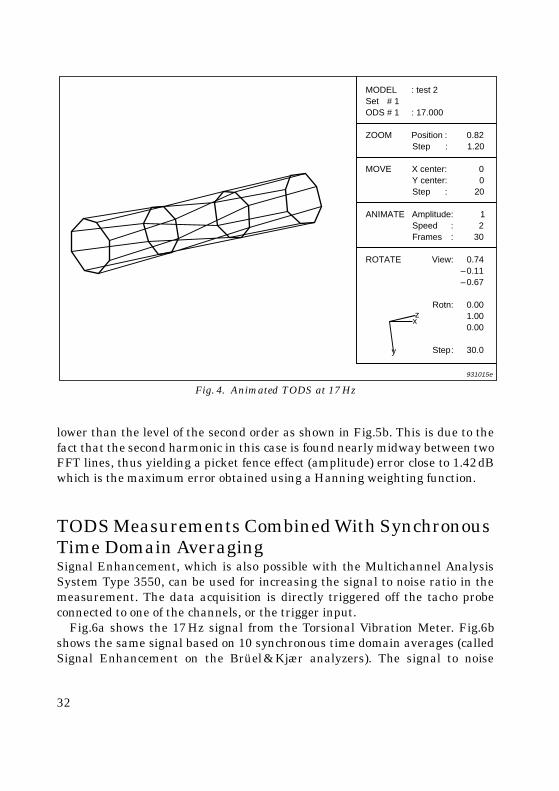
The relative torsional vibration (amplitude and phase) between the meas-urement positions forms the basis for the computer to create the TODS anima-tion, which is shown in Fig.4.
Using a simpler geometry, the animation can also be displayed as indicatedin the upper part of Fig.2. For detailed information, see Ref. [7].
TODS Measurement Combined With Order TrackingOrder Tracking, which is also possible with the Multichannel Analysis SystemType 3550, can be used for concentrating each harmonic of the TODS into onefrequency line only, thus avoiding any problems with smearing, leakage andpicket fence effect errors. Although the frequency axis is rescaled into an orderaxis, the MM0024 Tacho Probe, now also being used to control the samplingrate of the analyzer, provides the necessary information for reading out thevarious orders in Hertz or RPM. This is a very useful technique if there aresome speed variations of the rotating shaft, causing the rotational speed todrift between several FFT lines. The tacho probe must be connected to one ofthe measuring channels as shown in Fig.1.
A comparison of measurement without and with order tracking is shown inFig.5. Fig.5a shows the level of the second harmonic found at 34Hz to be 1.4dB
Fig. 3. Listing of the TODS values
930517e
31
lower than the level of the second order as shown in Fig.5b. This is due to thefact that the second harmonic in this case is found nearly midway between twoFFT lines, thus yielding a picket fence effect (amplitude) error close to 1.42dBwhich is the maximum error obtained using a Hanning weighting function.
TODS Measurements Combined With Synchronous Time Domain AveragingSignal Enhancement, which is also possible with the Multichannel AnalysisSystem Type 3550, can be used for increasing the signal to noise ratio in themeasurement. The data acquisition is directly triggered off the tacho probeconnected to one of the channels, or the trigger input.
Fig.6a shows the 17Hz signal from the Torsional Vibration Meter. Fig.6bshows the same signal based on 10 synchronous time domain averages (calledSignal Enhancement on the Brüel&Kjær analyzers). The signal to noise
Fig. 4. Animated TODS at 17 Hz
931015e
MODEL : test 2Set # 1ODS # 1 : 17.000
ZOOM Position : 0.82
MOVE X center: 0
ANIMATE Amplitude: 1
ROTATE View: 0.74
Rotn: 0.00
Step : 30.0
1.000.00
–0.11–0.67
Step : 1.20
Y center: 0Step : 20
Speed : 2Frames : 30
zx
y
32

Fig. 5. a) TODS measurement using spectrum averaging b) TODS measurement using spectrum averaging combined with order tracking
Fig. 6. a) Instantaneous time signal b) Enhanced time signal based on 10 averages
941443e
941444e
33
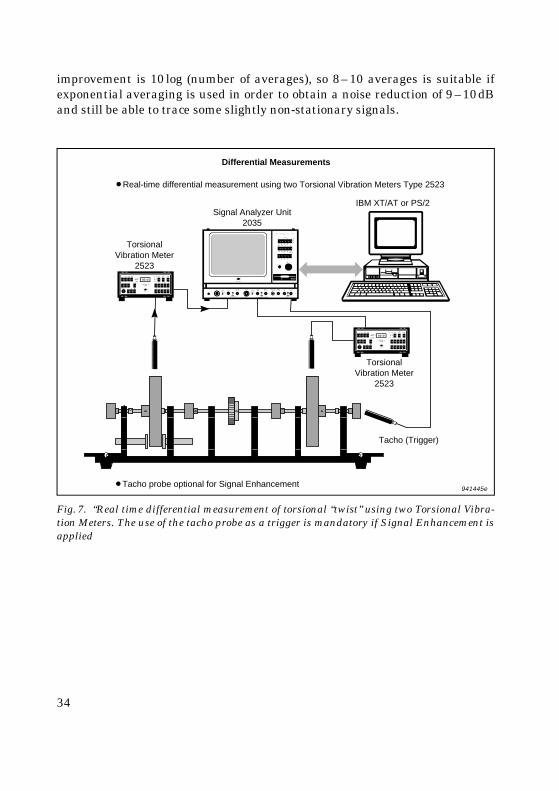
improvement is 10 log (number of averages), so 8–10 averages is suitable ifexponential averaging is used in order to obtain a noise reduction of 9–10dBand still be able to trace some slightly non-stationary signals.
Fig. 7. “Real time differential measurement of torsional “twist” using two Torsional Vibra-tion Meters. The use of the tacho probe as a trigger is mandatory if Signal Enhancement isapplied
941445e
Differential Measurements
Real-time differential measurement using two Torsional Vibration Meters Type 2523
IBM XT/AT or PS/2
TorsionalVibration Meter
2523
Signal Analyzer Unit2035
Tacho (Trigger)
Tacho probe optional for Signal Enhancement
TorsionalVibration Meter
2523
34
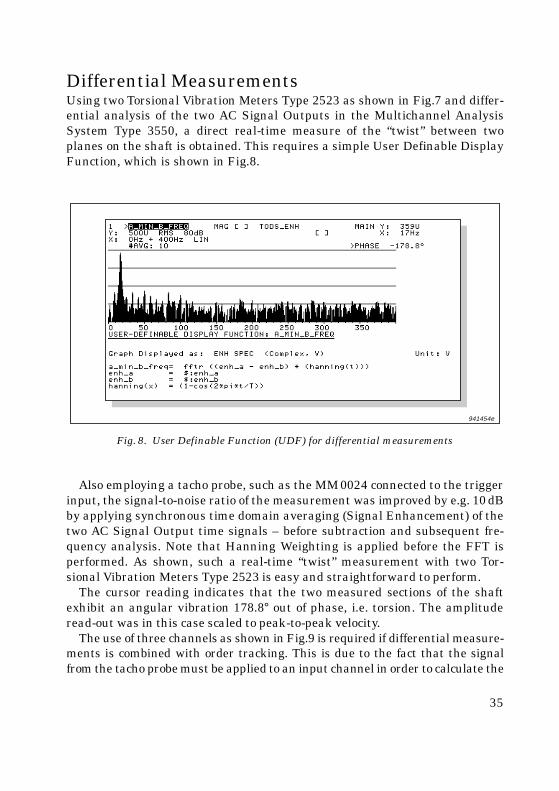
Differential MeasurementsUsing two Torsional Vibration Meters Type 2523 as shown in Fig.7 and differ-ential analysis of the two AC Signal Outputs in the Multichannel AnalysisSystem Type 3550, a direct real-time measure of the “twist” between twoplanes on the shaft is obtained. This requires a simple User Definable DisplayFunction, which is shown in Fig.8.
Also employing a tacho probe, such as the MM0024 connected to the triggerinput, the signal-to-noise ratio of the measurement was improved by e.g. 10dBby applying synchronous time domain averaging (Signal Enhancement) of thetwo AC Signal Output time signals – before subtraction and subsequent fre-quency analysis. Note that Hanning Weighting is applied before the FFT isperformed. As shown, such a real-time “twist” measurement with two Tor-sional Vibration Meters Type 2523 is easy and straightforward to perform.
The cursor reading indicates that the two measured sections of the shaftexhibit an angular vibration 178.8° out of phase, i.e. torsion. The amplituderead-out was in this case scaled to peak-to-peak velocity.
The use of three channels as shown in Fig.9 is required if differential measure-ments is combined with order tracking. This is due to the fact that the signalfrom the tacho probe must be applied to an input channel in order to calculate the
Fig. 8. User Definable Function (UDF) for differential measurements
941454e
35
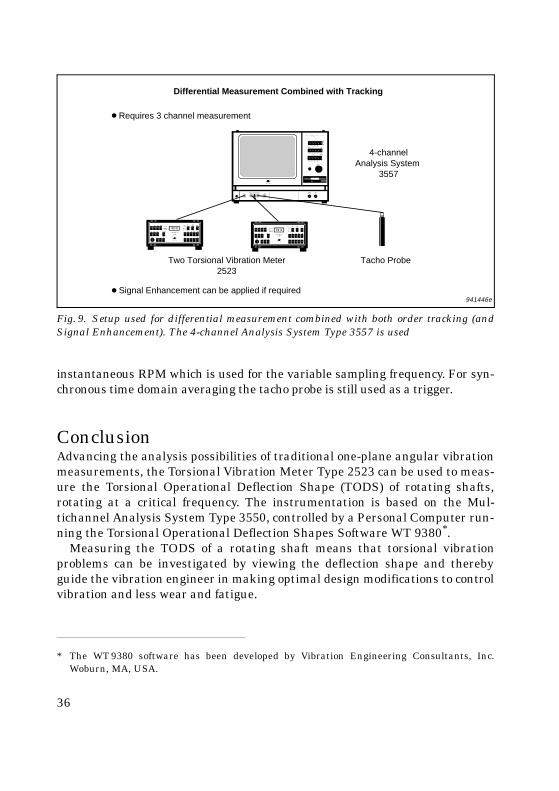
instantaneous RPM which is used for the variable sampling frequency. For syn-chronous time domain averaging the tacho probe is still used as a trigger.
ConclusionAdvancing the analysis possibilities of traditional one-plane angular vibrationmeasurements, the Torsional Vibration Meter Type 2523 can be used to meas-ure the Torsional Operational Deflection Shape (TODS) of rotating shafts,rotating at a critical frequency. The instrumentation is based on the Mul-tichannel Analysis System Type 3550, controlled by a Personal Computer run-ning the Torsional Operational Deflection Shapes Software WT 9380*.
Measuring the TODS of a rotating shaft means that torsional vibrationproblems can be investigated by viewing the deflection shape and therebyguide the vibration engineer in making optimal design modifications to controlvibration and less wear and fatigue.
Fig. 9. Setup used for differential measurement combined with both order tracking (andSignal Enhancement). The 4-channel Analysis System Type 3557 is used
* The WT 9380 software has been developed by Vibration Engineering Consultants, Inc.Woburn, MA, USA.
941446e
Input4Input 3 Input 2Input 14-channel Input Module Type 3023
Brüel
B K7/6-'89
& Kjær
Differential Measurement Combined with Tracking
Requires 3 channel measurement
Signal Enhancement can be applied if required
4-channelAnalysis System
3557
Two Torsional Vibration Meter2523
Tacho Probe
36
References[1] Døssing Ole, Brüel&Kjær: “Structural Stroboscopy, – Measurement of
Operational Deflection Shapes”, Brüel&Kjær Application NoteBO 0212
[2] Licht R. Torben, Brüel&Kjær: “A New Laser Based Method for Tor-sional Vibration Measurement”. Copies available from Brüel&Kjær
[3] Brüel&Kjær “The Torsional Vibration Meter Type 2523”. Product DataSheet (BP 0958)
[4] Schwibinger P., Hendrick D., Wu W. and Imanishi Y., Freudenberg-NOK.: “Noise and Vibration Control Measures in the Powertrain of Pas-senger Cars”. Proceedings of the 1991 SAE Noise & Vibration Confer-ence, P-244/911053
[5] Umeyama M., Kobayashi K., Hounoki S. and Otake T., Toyota MotorCorporation, Japan: “The basic consideration of the two-mass flywheelwith the torsional damper”. Proceedings of the Institution of MechanicalEngineers (IMechE 1990-10) c420/020
[6] Honda Y. and Saito T, Waseda University, Department of MechanicalEngineering, Wakabayashi K. and Kodama T., Kokushikan University,Department of Mechanical Engineering, Iwamoto S., Saitama Univer-sity, Department of Mechanical Engineering: “A Simulation Method forCrankshaft Torsional Vibration by Considering Dynamic Characteris-tics of Rubber Dampers”
[7] Gatzwiller Kevin, Brüel&Kjær “Measuring Torsional OperationalDeflection Shapes of Rotating Shafts”. Brüel&Kjær Application Note(BO0402)
37

Previously issued numbers ofBrüel & Kjær Technical Review2– 1996 Non-stationary Signal Analysis using Wavelet Transform, Short-time
Fourier Transform and Wigner-Ville Distribution1– 1996 Calibration Uncertainties & Distortion of Microphones.
Wide Band Intensity Probe. Accelerometer Mounted Resonance Test2– 1995 Order Tracking Analysis1– 1995 Use of Spatial Transformation of Sound Fields (STSF) Techniques in the
Automative Industry2– 1994 The use of Impulse Response Function for Modal Parameter Estimation
Complex Modulus and Damping Measurements using Resonant and Non-resonant Methods (Damping Part II)
1– 1994 Digital Filter Techniques vs. FFT Techniques for Damping Measurements (Damping Part I)
2– 1990 Optical Filters and their Use with the Type 1302 & Type 1306 Photoacoustic Gas Monitors
1– 1990 The Brüel&Kjær Photoacoustic Transducer System and its Physical Properties
2– 1989 STSF — Practical instrumentation and applicationDigital Filter Analysis: Real-time and Non Real-time Performance
1– 1989 STSF — A Unique Technique for scan based Near-Field Acoustic Holography without restrictions on coherence
2– 1988 Quantifying Draught Risk1– 1988 Using Experimental Modal Analysis to Simulate Structural Dynamic
ModificationsUse of Operational Deflection Shapes for Noise Control of Discrete Tones
4– 1987 Windows to FFT Analysis (Part II)Acoustic Calibrator for Intensity Measurement Systems
3– 1987 Windows to FFT Analysis (Part I)2– 1987 Recent Developments in Accelerometer Design
Trends in Accelerometer Calibration1– 1987 Vibration Monitoring of Machines4– 1986 Field Measurements of Sound Insulation with a Battery-Operated
Intensity AnalyzerPressure Microphones for Intensity Measurements with Significantly Improved Phase PropertiesMeasurement of Acoustical Distance between Intensity Probe MicrophonesWind and Turbulence Noise of Turbulence Screen, Nose Cone and Sound Intensity Probe with Wind Screen
3– 1986 A Method of Determining the Modal Frequencies of Structures with Coupled Modes
(Continued on cover page 3)

Previously issued numbers ofBrüel & Kjær Technical Review(Continued from cover page 2)
Improvement to Monoreference Modal Data by Adding an Oblique Degree of Freedom for the Reference
2 –1986 Quality in Spectral Match of Photometric TransducersGuide to Lighting of Urban Areas
1 –1986 Environmental Noise Measurements4 –1985 Validity of Intensity Measurements in Partially Diffuse Sound Field
Influence of Tripods and Microphone Clips on the Frequency Response of Microphones
3 –1985 The Modulation Transfer Function in Room AcousticsRASTI: A Tool for Evaluating Auditoria
2 –1985 Heat StressA New Thermal Anemometer Probe for Indoor Air Velocity Measurements
1 –1985 Local Thermal Discomfort4 –1984 Methods for the Calculation of Contrast
Proper Use of Weighting Functions for Impact TestingComputer Data Acquisition from Brüel&Kjær Digital Frequency Analyzers 2131/2134 Using their Memory as a Buffer
3 –1984 The Hilbert TransformMicrophone System for Extremely Low Sound LevelsAveraging Times of Level Recorder 2317
2 –1984 Dual Channel FFT Analysis (Part II)1 –1984 Dual Channel FFT Analysis (Part I)
Special technical literatureBrüel &Kjær publishes a variety of technical literature which can be obtained from your local Brüel&Kjær representative.The following literature is presently available:
❍ Modal Analysis of Large Structures– Multiple Exciter Systems (English)❍ Acoustic Noise Measurements (English), 5th. Edition❍ Noise Control (English, French)❍ Frequency Analysis (English), 3rd. Edition❍ Catalogues (several languages)❍ Product Data Sheets (English, German, French, Russian)
Furthermore, back copies of the Technical Review can be supplied as shown in the list above. Older issues may be obtained provided they are still in stock.

Brüel B K7/6-'89& Kjær
NO.1 1997
HEADQUARTERS: DK-2850 Nærum · DenmarkTelephone: +45 45 80 05 00 · Fax: +45 45 8014 05Internet: http://www.bk.dk · e-mail: [email protected]
BV
0050
–11
ISSN
000
7–
2621
Brüel B K7/6-'89& Kjær
TECHNICAL REVIEWOrthoShear Accelerometer DesignQC Test for Knock SensorsTorsional Operational Deflection Shapes


