Technical Review of Stocks CIO Wealth Management Research –– 26 January 2016 Peter Lee, Chief Technical Analyst [email protected]+1-212-713-8888, ext.01 Broader list This report provides technical analysis on stocks that, we believe, are of a wide interest. This list is not a template for the construction of your personal portfolio. You should discuss investment decisions with your Financial Advisor. For more information about this report, see Description and Methodology in the Appendix. We would like to thank Venkat Badri, an employee of Cognizant Group, for his assistance in preparing this research report. Cognizant staff provides research support services to UBS. ab This report has been prepared by UBS Financial Services Inc. (UBS FS). Analyst certification and required disclosures begin on page 42. UBS does and seeks to do business with companies covered in its research reports. As a result, investors should be aware that the firm may have a conflict of interest that could affect the objectivity of this report. Investors should consider this report as only a single factor in making their investment decision.
This report provides technical analysis on stocks that, we believe, are of a wide interest. This list is not a template for the construction of your personal portfolio. You should discuss investment decisions with your Financial Advisor. For more information about this report, see Description and Methodology in the Appendix. We would like to thank Venkat Badri, an employee of Cognizant Group, for his assistance in preparing this research report. Cognizant staff provides research support services to UBS.
ab
This report has been prepared by UBS Financial Services Inc. (UBS FS). Analyst certification and required disclosuresbegin on page 42. UBS does and seeks to do business with companies covered in its research reports. As a result,investors should be aware that the firm may have a conflict of interest that could affect the objectivity of this report.Investors should consider this report as only a single factor in making their investment decision.
Table of Contents Ticker Name Page Ticker Name Page AMGN AMGEN INC 4 JNJ JOHNSON & JOHNSON 21 AMZN AMAZON.COM INC 4 KMB KIMBERLY-CLARK CORP 22 APA APACHE 5 KO COCA-COLA CO 22 AXP AMERICAN EXPRESS CO 5 LB L BRANDS INC 23 AZN ASTRAZENECA PLC 6 MCD MCDONALD'S CORP 23 BEN FRANKLIN RESOURCES INC 6 MHFI MCGRAW HILL FINANCIAL 24 BMY BRISTOL-MYERS SQUIBB CO 7 MMM 3M CO 24 BP BP PLC 7 MO ALTRIA GROUP INC 25 BRK.B BERKSHIRE HATHAWAY - CLASS B 8 MRK MERCK & CO 25 C CITIGROUP INC 8 NEE NEXTERA ENERGY INC 26 CAT CATERPILLAR INC 9 NSRGY NESTLE SA/AG 26 CELG CELGENE CORP 9 NVS NOVARTIS AG 27 COP CONOCOPHILLIPS 10 ORCL ORACLE CORP 27 COST COSTCOWHOLESALE CORP 10 OXY OCCIDENTAL PETROLEUM CORP 28 CPB CAMPBELL SOUP CO 11 PEP PEPSICO INC 28 CSX CSX CORP 11 PFE PFIZER INC 29 CTL CENTURYLINK INC 12 PG PROCTER & GAMBLE CO 29 CVX CHEVRON CORP 12 PM PHILIP MORRIS INTERNATIONAL 30 D DOMINION RESOURCES INC 13 RDSA ROYAL DUTCH SHELL PLC 30 DD DU PONT (EI) DE NOMOURS 13 SBUX STARBUCKS 31 DE DEERE AND CO 14 STJ ST JUDE MEDICAL INC 31 DEO DIAGEO PLC 14 T AT&T INC 32 DIS THE WALT DISNEY COMPANY 15 TEVA TEVA PHARMACEUTICALS 32 DOW DOW CHEMICAL 15 TGT TARGET CORP 33 DUK DUKE ENERGY CORP 16 TOT TOTAL SA 33 F FORD MOTOR CO 16 TRV TRAVELERS 34 FB FACEBOOK INC 17 UPS UNITED PARCEL SERVICE 34 GILD GILEAD SCIENCES INC 17 USB U.S. BANCORP 35 GIS GENERAL MILLS INC 18 V VISA INC-CLASS A 35 GSK GLAXOSMITHKLINE PLC 18 VOD VODAFONE GROUP PLC 36 HAL HALLIBURTON 19 VZ VERIZON COMMUNICATIONS INC 36 HD HOME DEPOT INC 19 WBA WALGREENS CO 37 HON HONEYWELL INTERNATIONAL INC 20 WFC WELLS FARGO 37 IBM INTL BUSINESS MACHINES CORP 20 WMT WAL-MART STORES INC 38 ITW ILLINOIS TOOL WORKS INC 21 XOM EXXON MOBIL CORP 38
Technical Review of Stocks
UBS CIO WM Research 26 January 2016 2
Changes since last report Additions
Name Ticker
Technical Rating Changes
Name Ticker Old New
Berkshire Hathaway - Class B BRKB Bullish Neutral
Citigroup Inc. C Bullish Neutral
Halliburton Co. HAL Neutral Bearish
Target Corp. TGT Bullish Neutral
United Parcel Service UPS Neutral Bearish
US Bancorp USB Bullish Neutral
BANK OF AMERICA CORP (BAC) will be reviewed in the next edition of Technical Review of Stocks. The last update on these stocks was published on 23 December 2015. Going forward, our previously published ratings for all these stocks should not be relied upon.
Technical Review of Stocks
UBS CIO WM Research 26 January 2016 3
Amgen Inc. (AMGN)
2011 2012 2013 2014 2015 20164040
6060
8080
100100
120120
140140
160160
180180
Price 10-Week Moving Average 30-Week Moving Average
Source: FactSet, UBS as of 25 January 2016 Support levels Resistance levels
Rationale: We maintain a cautiously optimistic technical view on AMGN as the stock still retains its primary uptrend. However, a broadening wedge warns of a maturing rally. The selling in Sep '15 may have found key support near 130.09 or just above its Oct '14 low (127.67), 38.2% retracement (130.20) from its 2011-2015 rally and the bottom of 2013 uptrend channel. A successful test here can trigger a technical rally to the low-170s. In the near-term, key initial resistance is at the 1/4/16 gap down at 159.22-162.05/165.23. Key support is 127.67-130.09 or Oct '14/Sep '15 lows.
Amazon.com Inc. (AMZN)
2011 2012 2013 2014 2015 2016
200200
300300
400400
500500
600600
700700
Price 10-Week Moving Average 30-Week Moving Average
Source: FactSet, UBS as of 25 January 2016 Support levels Resistance levels
Rationale: The longer-term bullish trend starting from 2001 lows, breakout of multi-year accumulation pattern above low-100s in 2010 and superior relative performance of the stock versus S&P 500 Index supports our technical Bullishrating. Despite gains of nearly 143% over the past year the 21.43% correction from its Dec '15 all-time high appears to a normal correction as this stock retains a bullish underlying trend. Although the Jan '16 gap at 658-676 may offer key initial resistance on rallies the ability to maintain the mid-500s can lead to the resumption of the primary uptrend.
Technical Review of Stocks
UBS CIO WM Research 26 January 2016 4
Apache Corp (APA)
2011 2012 2013 2014 2015 2016
4040
6060
8080
100100
120120
140140
Price 10-Week Moving Average 30-Week Moving Average
Source: FactSet, UBS as of 25 January 2016 Support levels Resistance levels
First Second Third First Second Third
31-32 26-28 20-21 36-37/40-42 46-47 50-51.5/56.31
Technical rating Neutral
Sector Energy
Last Sale Price $37.43
Rationale: After declining 65.77% from Jul '14 high (104.57) a positive outside week on 10/2/15 along with Jul/Aug '15 downtrend breakout hinted of a potential bottom. After successfully testing key support near 35.79 or the bottom of its 2006 downtrend channel (not shown) a near-term oversold rally developed that quickly faded near key resistance in the low-to-mid 50s (23.6% retracement (52.02) from its Jul '14 to Oct '15 decline and the Jul '15 breakdown). The 10% decline in the New Year has now violated mid-30s and now suggests a major test of the May '03 breakout (32).
American Express (AXP)
2011 2012 2013 2014 2015 2016
4040
5050
6060
7070
8080
9090
Price 10-Week Moving Average 30-Week Moving Average
Source: FactSet, UBS as of 25 January 2016 Support levels Resistance levels
First Second Third First Second Third
53-54 41-43 36-37 59-61/63-65 68-69/72.5 80-82
Technical rating Neutral
Sector Financials
Last Sale Price $55.02
Rationale: Violation of the mid-80s earlier in 2015 paints a weak intermediate term trend outlook and hence a defen-sive Neutral stance. A secondary breakdown below the high-70s during Summer 2015 further reaffirms a medium-term head/shoulders top. A breakdown below the bottom of a falling wedge, Jun/Aug/Oct '13 and Aug/Oct '15 lows at 70-71.5 warns of a decline to 61-63 (38.2% retracement from 2009-2014 rally and 2012 highs). A gap down on 1/4/16 and violation of key supports along the high-50s to low-60s (bottom of the 2010/2011 uptrend) now suggests 53-54.
Technical Review of Stocks
UBS CIO WM Research 26 January 2016 5
AstraZeneca PLC ADS (AZN)
2011 2012 2013 2014 2015 2016
2020
2525
3030
3535
4040
Price 10-Week Moving Average 30-Week Moving Average
Source: FactSet, UBS as of 25 January 2016 Support levels Resistance levels
Rationale: AZN has completed a 4-year technical base breakout on a surge above 26-27 in late-2013. This breakout ignited a major rally that achieved several of our technical targets including 38-38.50 based on late-2013 breakout above 26.77. The May '14 rally to the low-40s also met longer term resistance associated with the extension of the 1998/2006 trend line (not shown). Since the May 2014 peak a well-defined downtrend channel has developed be-tween the low-30s (key support) and the mid-30s (key resistance). Initial supply is 32.5-33.1 or the Jan '16 gap down.
Franklin Resources Inc. (BEN)
2011 2012 2013 2014 2015 2016
3030
3535
4040
4545
5050
5555
6060
Price 10-Week Moving Average 30-Week Moving Average
Source: FactSet, UBS as of 25 January 2016 Support levels Resistance levels
Rationale: We maintain a cautious Neutral stance on BEN. The Dec '14 negative outside month pattern coupled with a move below low-50s or the bottom of the 2012 uptrend channel warned of an intermediate term weakness in the stock. This diversified financials name has now declined 45.9% from its Dec '14 high (58.91) as multiple key supports have been broken. A series of lower-highs and lower-lows suggest a return to the 2010-2011 lows at 28-30. Key initial resistance is at 37-40 or 10-week/30-week ma. A large trading range is likely between high-20s and high-30s.
Technical Review of Stocks
UBS CIO WM Research 26 January 2016 6
Bristol-Myers Squibb Co (BMY)
2011 2012 2013 2014 2015 2016
3030
4040
5050
6060
7070
Price 10-Week Moving Average 30-Week Moving Average
Source: FactSet, UBS as of 25 January 2016 Support levels Resistance levels
Rationale: A 343% rally from the 2008 bottom (16) has led to an overbought condition. The 7/24/15 negative outside week and a subsequent Jul '15 negative outside month triggered a sharp setback of 26.5% back towards the bottom of its 2011/2013 uptrends along the low-to-mid 50s. A successful test of support prevented a deeper correction and has ignited another rally. Having said that, a negative outside week on 12/18/15 followed by the Jan '16 gap down led to a sharp pull back of the stock price. Key initial support is 59-61 and then 56.32-57.5 or the Sep/Oct '15 lows.
BP PLC ADS (BP)
2011 2012 2013 2014 2015 2016
3030
3535
4040
4545
5050
5555
Price 10-Week Moving Average 30-Week Moving Average
Source: FactSet, UBS as of 25 January 2016 Support levels Resistance levels
Rationale: This Energy name has fallen 48.48% from its May '14 highs (53.48). In the process BP has violated its 2010/11 uptrend channel (44-45) in Sep '14 confirming a top. Although an oversold condition and a positive outside week (10/2/15) has developed, failure to clear above key resistance along 37.5-38.5 or the 61.8% retracement from its Apr-Sep '15 decline and Jul '14 downtrend led to another round of selling. Initial support now lies at 26.75-27 or the Jun '10 low and bottom of 2014 channel. Initial supply is at 31.5-33.5 (10-wk/30-wk ma) and then 35.5-37.5.
Technical Review of Stocks
UBS CIO WM Research 26 January 2016 7
Berkshire Hathaway Inc. – Class B stock (BRK.B)
2011 2012 2013 2014 2015 20166060
7070
8080
9090
100100
110110
120120
130130
140140
150150
Price 10-Week Moving Average 30-Week Moving Average
Source: FactSet, UBS as of 25 January 2016 Support levels Resistance levels
Price 10-Week Moving Average 30-Week Moving Average
Source: FactSet, UBS as of 25 January 2016 Support levels Resistance levels
First Second Third First Second Third
38.5-40 33.5-34 25-27 47-48 53-55 59-61
Technical rating Neutral
Sector Financials
Last Sale Price $39.55
Rationale: Many of the S&P 500 Financial names have quickly succumbed to strong selling soon after the FED FOMC rate hike. We are concerned about the recent breakdown of the bottom of a well-defined 3-year trading range trend between the mid-40s and the high-50s. Last July's breakout above 59-61 may have been a false breakout and/or a bull trap as this financial name has quickly reversed direction falling below its breakout and the bottom of its trading range in the mid-40s. We downgrade to a Neutral outlook as many of the financial names including C have deteriorated.
Rationale. We recommend downgrading intermediate term technical trend in this Financial name to Neutral as a viola-tion of the 2013 uptrend at 141-144 and a subsequent weekly death cross signal warn of a maturing trend. BRKB is headed towards another key test of support along 122.72-125.5 or the Aug/Oct '14 lows. Although the longer-term trend is still favourable and relative strength against SPX is positive a convincing violation of 122.72-125.5 would con-firm a top and warn of a deeper setback towards 116-119 and below this to 108-110. Key initial supply is 135-140.
Technical Review of Stocks
UBS CIO WM Research 26 January 2016 8
Caterpillar Inc. (CAT)
2011 2012 2013 2014 2015 20166060
7070
8080
9090
100100
110110
120120
Price 10-Week Moving Average 30-Week Moving Average
Source: FactSet, UBS as of 25 January 2016 Support levels Resistance levels
First Second Third First Second Third
56-58 49-51 44-45 63-65 69-71 76-77.5/80-81
Technical rating Bearish
Sector Industrials
Last Sale Price $57.91
Rationale: The violation of the pivotal 2010/11 uptrend (89-91) as well as key neckline support (79) confirmed a top. The 45.4% decline from Jul '14 high has created a new downtrend channel between the low-50s and the low-70s. A deeply oversold condition coupled with a daily island reversal on 10/5/15 led to a short-term oversold rally to mid-70s before resuming its downtrend. Although oversold rallies are possible to mid-to-high 60s, a negative outside week pat-tern on 12/04/15 and two gap downs during Jan '16 warn of the continuation of the 2014 downtrend channel.
Celgene Corp. (CELG)
2011 2012 2013 2014 2015 2016
2020
4040
6060
8080
100100
120120
140140
Price 10-Week Moving Average 30-Week Moving Average
Source: FactSet, UBS as of 25 January 2016 Support levels Resistance levels
First Second Third First Second Third
99-101 92.98 83-87 110-112 120-123 127-129/140.7
Technical rating Bullish
Sector HealthCare
Last Sale Price $106.70
Rationale: We retain a technical Bullish stance on this Biotechnology name as long as it maintains above its 2012 pri-mary uptrend (low-100s). The recent Jul-Aug '15 decline (-34%) warns of a waning bull trend as a head/shoulders top is developing. Mixed technical signals are also developing as the relative strength (vs SPX) has been good over the past year but a weekly death cross sell signal as well as a gap down on 1/4/16 warns of further volatility. Initial support re-sides along its 2012 uptrend at 99-101 and then 92.98 (Aug '15 lows). Key initial resistance is 110-112 and 120-123.
Technical Review of Stocks
UBS CIO WM Research 26 January 2016 9
ConocoPhillips (COP)
2011 2012 2013 2014 2015 2016
4040
5050
6060
7070
8080
9090
Price 10-Week Moving Average 30-Week Moving Average
Source: FactSet, UBS as of 25 January 2016 Support levels Resistance levels
First Second Third First Second Third
32-33 29-30 26.01 40-41 45-46/50-51 53.5-56.5
Technical rating Bearish
Sector Energy
Last Sale Price $34.20
Rationale: The S&P 500 Energy sector suffered a major sell-off of -49% from its 2014 high (739). COP also declined 62.44% from its Jul '14 high 739. A 2-year head and shoulder top breakdown below at 59-61 led to a sharp decline towards next support at 41.10 (8/24/15) or its 76.4% retracement (40.43) from its 2009-14 rally. Failure to find sup-port here can lead to retest of its 2009 bottom (26), over time. Nonetheless, a deeply oversold condition and ability to find support near the bottom of its 2-year downtrend channel (32) may trigger a technical rally to the low-to-mid 40s.
Costco Wholesale Corp. (COST)
2011 2012 2013 2014 2015 2016
6060
8080
100100
120120
140140
160160
180180
Price 10-Week Moving Average 30-Week Moving Average
Source: FactSet, UBS as of 25 January 2016 Support levels Resistance levels
First Second Third First Second Third
145 135-140 120-125 154-158 164/169.73 174-176
Technical rating Bullish
Sector Cons. Staples
Last Sale Price $150.78
Rationale: This Hypermarkets & Super centers name retains its leadership role as it progresses higher over the past 6-plus years as evident by a well-defined rising uptrend channel between the high-130s and the low-160s. A surge above 159-160 would confirm a breakout rendering an upside target closer to the mid-180s, over time. However, the 12/11/15 neg-ative outside week pattern and the recent broad market setback may temporarily delay the rally resulting in a retest of key support near the summer 2015 lows and the bottom of its uptrend channel at 135-140. Key resistance is at 154-158.
Technical Review of Stocks
UBS CIO WM Research 26 January 2016 10
Campbell Soup Co. (CPB)
2011 2012 2013 2014 2015 2016
3030
3535
4040
4545
5050
5555
Price 10-Week Moving Average 30-Week Moving Average
Source: FactSet, UBS as of 25 January 2016 Support levels Resistance levels
First Second Third First Second Third
50-51/7-48 44-45 41-42/38-39 55.08-57 59-60 62.88
Technical rating Bullish
Sector Cons. Staples
Last Sale Price $54.61
Rationale: An ascending triangle breakout during 2013 (above the high-30s) and a subsequent breakout above two and half year accumulation pattern above high-40s in mid-2015 substantiate our Bullish technical outlook on this Food Beverage and Tobacco name. However, a moderately overbought condition has led to a near-term correction back to its prior breakout. Nonetheless, we remain optimistic on the stock based on its 11/20/15 positive outside week, gap up on 11/24/15 and the Nov '15 positive outside month pattern. Initial support lies at 50-51/47-48 (Nov '15/Jan '16 lows).
CSX Corp. (CSX)
2011 2012 2013 2014 2015 2016
2020
2525
3030
3535
4040
Price 10-Week Moving Average 30-Week Moving Average
Source: FactSet, UBS as of 25 January 2016 Support levels Resistance levels
Rationale: A sharp rally from 2013 to early 2014 faltered near its all-time high of 37.99 on Nov '2014. As the broad market (SPX) set new highs in May '15 a lower-low pattern soon developed on CSX at 37.67. This negative divergence, a weekly death cross sell signal in May '15 and violation of the bottom of its 2013 uptrend channel (33) confirm an intermediate-term top. The recent market weakness led to a violation of the extension of the 2011 ascending triangle breakout at 24.47 (Aug '15 low). Next support is 22-22.5 and then 20-18.88. Key initial resistance is mid-to-high 20s.
Technical Review of Stocks
UBS CIO WM Research 26 January 2016 11
CenturyLink Inc. (CTL)
2011 2012 2013 2014 2015 2016
2525
3030
3535
4040
4545
Price 10-Week Moving Average 30-Week Moving Average
Source: FactSet, UBS as of 25 January 2016 Support levels Resistance levels
Rationale: CTL has violated the bottom of its 5-year downtrend channel along the mid-20s. A weekly death cross sell signal CTL earlier in 2015 has transitioned this stock into an even steeper decline as evident by the 52% decline from its 2014 highs. Although an extremely oversold condition is developing the recent breakdown below key support in the mid-20s warn of further downside to 20.45 to the 2008 low before a firmer bottom is confirmed. Key initial resistance is at 25-27 or the 10-wk and the 30-wk moving averages. A breakout here would help to stabilize the recent selling.
Chevron Corp (CVX)
2011 2012 2013 2014 2015 2016
7070
8080
9090
100100
110110
120120
130130
Source: FactSet, UBS as of 25 January 2016 Support levels Resistance levels
First Second Third First Second Third
75 69.58/66.83 60-61 95-97 100-102 109-112
Technical rating Neutral
Sector Energy
Last Sale Price $80.89
Rationale: Violation of the bottom of its 2011 uptrend channel at 116-117 followed by a negative outside week (5/1/15) and violation of the Dec '14/Jan-Mar '15 lows at 98-100 have triggered a 48.5% decline (from its 134.10 Jul '14 highs) to Aug '15 low of 69.58. An extremely oversold condition coupled with a successful test of major support at 70.55 (61.8% retracement from 2003-2014 rally) triggered a technical rally to 98.64 by Nov '15 or near the 38.2% retracement from Jul '14-Aug '15 decline and the Jul '15 downtrend. A trading range is possible between 70-75 and 95-100.
Technical Review of Stocks
UBS CIO WM Research 26 January 2016 12
Dominion Resources Inc. (D)
2011 2012 2013 2014 2015 20164040
4545
5050
5555
6060
6565
7070
7575
8080
Price 10-Week Moving Average 30-Week Moving Average
Source: FactSet, UBS as of 25 January 2016 Support levels Resistance levels
First Second Third First Second Third
64.54 60-62 54-56 74-76.5 80-81 86-87
Technical rating Neutral
Sector Utilities
Last Sale Price $69.56
Rationale: Although the longer-term trend still remains up, failure to surpass key resistance at 80-81 or the top of the 2009/2011 uptrend channels warns of an intermediate-term top. In addition, a head/shoulders top has developed over the past 2 years. Key neckline support is in the mid-60s. Breeching support solidifies a top and renders downsides to the low-60s and then to the mid-50s. The recent market weakness may have triggered a flight to safety as classic de-fensives names like D outperformed SPX. I2/18/16 and 1/22/16 positive outside week patterns bodes well for a rally.
E.I. DuPont de Nemours & Co. (DD)
2011 2012 2013 2014 2015 2016
3535
4040
4545
5050
5555
6060
6565
7070
7575
Price 10-Week Moving Average 30-Week Moving Average
Source: FactSet, UBS as of 25 January 2016 Support levels Resistance levels
Rationale: The impending merger between the two Chemical industry giants DuPont and Dow Chemical has impacted the share price performance of both of the stocks in the recent weeks. Earlier, the sharp 38.5% decline to 47.11(Oct '15) have subsided near its crucial 2010 uptrend (47-49). The ability to find support here coupled with a deeply over-sold condition and 10/02/15 positive outside week pattern has triggered a sharp rally. However, the Dec '15 negative outside month and the Jan '16 gap down hints of the onset of a trading range between the low-50s and the mid-60s.
Technical Review of Stocks
UBS CIO WM Research 26 January 2016 13
Deere and Co (DE)
2011 2012 2013 2014 2015 2016
6060
6565
7070
7575
8080
8585
9090
9595
100100
Price 10-Week Moving Average 30-Week Moving Average
Source: FactSet, UBS as of 25 January 2016 Support levels Resistance levels
First Second Third First Second Third
70-71 69.51/60-62 53-54 80-82 86.39-90.37 97-98
Technical rating Neutral
Sector Industrials
Last Sale Price $71.88
Rationale: We keep a technical Neutral stance on Deere as the two technical breakdowns below 2011/12 uptrend at 87/82 warn of a major top. The selling escalated into Oct '15 as the stock fell to 71.85 before generating a gap up short-term reversal on 10/5/15. A deeply oversold condition led to a short-term technical rally towards the 38.2% re-tracement (81.93) from the Jul to Oct '15 sell-off and the prior trend line breakdowns. Failure to breakout here coupled with 12/11/15 negative outside week suggests a range bound trading environment between low-70s and low-80s.
Diageo PLC ADS (DEO)
2011 2012 2013 2014 2015 2016
7070
8080
9090
100100
110110
120120
130130
Price 10-Week Moving Average 30-Week Moving Average
Source: FactSet, UBS as of 25 January 2016 Support levels Resistance levels
First Second Third First Second Third
100-101 98.50 93.12/87.5 109-112 118-122 127-130
Technical rating Neutral
Sector Cons. Staples
Last Sale Price $104
Rationale: Although the long-term trend remains favorable, DEO has underperformed SPX over the past three years as evident by a well-defined downtrend channel. The Aug-Oct '15 correction violated the bottom of its 2013 downtrend channel but managed to maintain medium term support along the 38.2% retracement (98.5) from its 2009-2013 rally. Despite the relief rally from Aug '15 low (100.59), the broader market weakness coupled with the inability of the stock breakout suggests the continuation of its 2013 downtrend channel between 100 +/- 2 and 120 +/- 2.
Technical Review of Stocks
UBS CIO WM Research 26 January 2016 14
The Walt Disney Co (DIS)
2011 2012 2013 2014 2015 20162020
4040
6060
8080
100100
120120
Price 10-Week Moving Average 30-Week Moving Average
Source: FactSet, UBS as of 25 January 2016 Support levels Resistance levels
First Second Third First Second Third
90 86 78.54 103-105 107-109 120.65-122.08
Technical rating Bullish
Sector Cons. Disc.
Last Sale Price $95.29
Rationale: The broad market correction during Jul-Aug '15 led to a sharp pullback towards the bottom of its 2011 uptrend near 90-91 triggering a technical rally into year-end rally. However, failure to clear the top of its 5-year channel at 120-122 quickly led to another correction that has now broken the bottom of its uptrend channel. However, it has managed to maintain above its Aug '15 low (90) preventing a deeper setback. An oversold condition coupled with a gap up on 1/22/16 hint of a rally to 103-105 or the 1/4/16 gap down and above this to 107-109 or the 10/30-wk ma.
Dow Chemical Co. (DOW)
2011 2012 2013 2014 2015 2016
2020
2525
3030
3535
4040
4545
5050
5555
Price 10-Week Moving Average 30-Week Moving Average
Source: FactSet, UBS CIO WMR as of 25 January 2016 Support levels Resistance levels
First Second Third First Second Third
40-41 35.11 30-32 48-50 53-55 57-59
Technical rating Neutral
Sector Materials
Last Sale Price $42.18
Rationale: The impending merger between the two Chemical industry giants Dow Chemical and DuPont has impacted the share prices of both the stocks. Earlier, the 34.7% correction in Jul-Aug '15 have violated its 2009/2011 uptrend (43.5) and led to a sharp decline to 35.11 (8/24/15) before stabilizing. A positive outside week (10/2/15) and a surge above the low-40s triggered a recovery back to its 2014/2015 highs. However, failure to breakout and the Dec '15 nega-tive outside month and the Jan '16 gap down warn of another test of support at 40-41 and below this to 35.11.
Technical Review of Stocks
UBS CIO WM Research 26 January 2016 15
Duke Energy Corp. (DUK)
2011 2012 2013 2014 2015 2016
5050
5555
6060
6565
7070
7575
8080
8585
9090
Price 10-Week Moving Average 30-Week Moving Average
Source: FactSet, UBS as of 25 January 2016 Support levels Resistance levels
Rationale: The failure of DUK to breakout above the top of its uptrend channel (high-80s) and a subsequent weekly death cross technical sell signal in late-Mar '15 warn of a peak for this Utility name. Recent violation of the mid-70 co-inciding with the Mar/May '15 lows, 2009 uptrend, and the Oct '14 breakout reaffirm a top. In addition, a negative outside month on Aug '15 and a 2-year head/shoulders top warn of further downside risks to the mid-60s. The ability to find support at 64-65.5 may ignite another rally to the left/right shoulders near the mid-70s (75-77.5).
Ford Motor Co (F)
2011 2012 2013 2014 2015 201688
1010
1212
1414
1616
1818
2020
Price 10-Week Moving Average 30-Week Moving Average
Source: FactSet, UBS as of 25 January 2016 Support levels Resistance levels
Rationale: A potentially large technical base has developed over the past 14-years (not shown). However, repeated failures to clear above long-term resistance at 18-19 still suggest F is not ready to breakout and hence our Neutral out-look. The decline to 10.44 during Aug '15 broad market correction and the ensuing failed rally to key resistance at 15.5-16 have now created a well-defined downtrend channel. The continued relative underperformance of F to SPX coupled with the Jan '16 break down now suggest another key of the bottom of the channel and Aug '15 low (10.44).
Technical Review of Stocks
UBS CIO WM Research 26 January 2016 16
Facebook Inc. (FB)
Jul '12 Oct '12 Jan '13 Apr '13 Jul '13 Oct '13 Jan '14 Apr '14 Jul '14 Oct '14 Jan '15 Apr '15 Jul '15 Oct '15 Jan '16
2020
4040
6060
8080
100100
120120
Price 10-Week Moving Average 30-Week Moving Average
Source: FactSet, UBS as of 25 January 2016 Support levels Resistance levels
First Second Third First Second Third
89-90 80-82 70-72 99-100 103-104.5 108-111
Technical rating Bullish
Sector Technology
Last Sale Price $97.01
Rationale: The primary trend (starting from May '12) remains bullish and the prior breakout above low-30s during Jul '13 and a subsequent breakout above 45 during Sep '14 led to an even steeper uptrend channel between low-90s and high-100s. The 27.5% correction from its Jul '15 high (99.3) to its Aug '15 low (72) has set the stage for the next rally. A breakout above the Jul '15 record high (99.3) and above the top of its 2013 uptrend channel (104-105) led to a new all-time high of 110.65 (Nov '15). However, a Jan '16 gap down hints of a consolidation between 89-90 and 108-111.
Gilead Sciences Inc. (GILD)
2011 2012 2013 2014 2015 2016
2020
4040
6060
8080
100100
120120
Price 10-Week Moving Average 30-Week Moving Average
Source: FactSet, UBS as of 25 January 2016 Support levels Resistance levels
Rationale: GILD rallied 94.28% from its Apr '14 low (63.5) recording a record high of 123.37 on Jun '15. An over-bought condition has led a consolidation between the mid-80s or the Dec '14/Aug '15/Jan '16 lows and 117-123 or the Oct '14/Jun '15 highs. Similar to many Biotechnology names a large broadening top as well as a head/shoulders top have developed. Failure to maintain key support at 86-87 confirms neckline breakdown and would force a technical downgrade. Key initial resistance is 100-105 or the Jan '16 gap down, 2015 downtrend and 10-wk/30-wk ma.
Technical Review of Stocks
UBS CIO WM Research 26 January 2016 17
General Mills Inc. (GIS)
2011 2012 2013 2014 2015 2016
3535
4040
4545
5050
5555
6060
Price 10-Week Moving Average 30-Week Moving Average
Source: FactSet, UBS as of 25 January 2016 Support levels Resistance levels
First Second Third First Second Third
53.5-54 51-51.5 47-48/41-41.5 60-61 65-66 69-71
Technical rating Bullish
Sector Cons. Staples
Last Sale Price $54.80
Rationale: The primary trend remains up and higher prices are still possible, over time. However, recent failure to clear above the top of its 2-year uptrend channel (60-61) in Aug '15 coupled with an overbought condition suggests a con-solidation is now likely. Near-term support is 53.5-54 or the 2012 uptrend and the Jun/Jul '15/Jan '16 lows. The bot-tom of the 2013 channel at 51-51.5 offers secondary support. The recent correction has shifted investment interests to the classic defensive such as GIS as its relative strength is approaching a major breakout along its 2009 downtrend.
GlaxoSmithKline PLC ADS (GSK)
2011 2012 2013 2014 2015 20163535
4040
4545
5050
5555
Price 10-Week Moving Average 30-Week Moving Average
Source: FactSet, UBS as of 25 January 2016 Support levels Resistance levels
First Second Third First Second Third
37.24 36/34 32.15 41-42 43.5-45.5 48-50
Technical rating Bearish
Sector HealthCare
Last Sale Price $39.68
Rationale: We maintain a technical Bearish outlook on this HealthCare name based primarily on the breakdown below 53 in Jul '14 and a subsequent breakdown below 47 in Sep '14. A negative outside month on Aug '15 and completion of a 1-year head/shoulders top breakdown (below neckline at 41.25) led to a sharp decline to 37.24 (Sep/Oct '15 low). Repeated attempts to surpass key resistance along the top of its falling wedge formation along the low-40s suggests GSK may be vulnerable for a retest of the bottom of its wedge pattern and its Oct '15 lows near 36-37.24.
Technical Review of Stocks
UBS CIO WM Research 26 January 2016 18
Halliburton (HAL)
2011 2012 2013 2014 2015 2016
3030
4040
5050
6060
7070
Price 10-Week Moving Average 30-Week Moving Average
Source: FactSet, UBS as of 25 January 2016 Support levels Resistance levels
Rationale: The 62.81% decline from Jul '14 high has weakened both the absolute and relative (vs SPX) charts. How-ever, the Oct '15 positive outside month signalled a recovery from deeply oversold levels. Nonetheless, a falling wedge remains intact between 27 and 40. Recent failure to convincing surge above its 30-wk ma, above its Nov '14 down-trend, and a Dec '15 negative outside month has led to a decline to the bottom of its falling wedge near 27. The ability to find support can lead to a technical oversold rally to 35-37.5 (10/30-wk ma) and above this to 40-41 (top of wedge).
Home Depot (HD)
2011 2012 2013 2014 2015 20162020
4040
6060
8080
100100
120120
140140
Price 10-Week Moving Average 30-Week Moving Average
Source: FactSet, UBS as of 25 January 2016 Support levels Resistance levels
Rationale: We retain a technical Bullish outlook on this Home Improvement retailer but recognize the rally over the past 2-years has achieved our technical target of 123 (based on the 2013 breakout above 70). Although higher prices are still possible back to its prior 2015 highs at 130-135 and above this to 143-144 HD may be vulnerable for a correc-tion to initial support at 112-113.59 or Oct '15/Jan '16 lows and below this to 104-107.5 or the 2011 uptrend and 50% retracement from 2011-2015 rally. Key initial resistance is at 130-135 or the 10-wk ma and prior Nov '15 highs.
Technical Review of Stocks
UBS CIO WM Research 26 January 2016 19
Honeywell International Inc. (HON)
2011 2012 2013 2014 2015 2016
4040
5050
6060
7070
8080
9090
100100
110110
Price 10-Week Moving Average 30-Week Moving Average
Source: FactSet, UBS as of 25 January 2016 Support levels Resistance levels
First Second Third First Second Third
89-91.5 87/82-83 74-76 107-110 116-118.5 129-131
Technical rating Neutral
Sector Industrials
Last Sale Price $96.48
Rationale: A 13-year breakout at 63/69 during the late-2012/early-2013 (not shown) renders targets to 102-103 and then to 118.5. HON has achieved the first of the two targets (102-103) during last summer's rally to 107.41 and is now consolidating its gains between the high-80s and the low-100s. The Aug '15 negative outside month warns of a poten-tial head/shoulders top pattern. Key neckline support is at 89-91.5 or the Oct '14 uptrend. Violation here confirms a major technical breakdown and signals a deeper correction. Initial supply is at 107-110 or near its 2015 highs.
International Business Machines Corp (IBM)
2011 2012 2013 2014 2015 2016
130130
140140
150150
160160
170170
180180
190190
200200
210210
220220
Price 10-Week Moving Average 30-Week Moving Average
Source: FactSet, UBS as of 25 January 2016 Support levels Resistance levels
First Second Third First Second Third
116-118 104 97-99.5 132-135 141-145 153/170-179
Technical rating Neutral
Sector Technology
Last Sale Price $122.08
Rationale: The strong selling has again resumed as IBM has now fallen 45% from its 2013 highs (215.90) and has broken below the bottom of a 3-year downtrend channel (138-140) and its 61.8% retracement from 2008 to 2013 rally and the extension of its 2010 pivotal breakout at 122.5-125.5. This suggests a decline to next support at 116 (May '10 lows) and below this to the 76.4% retracement (104). The Nov '08 and Jul '09 lows at 97-99.5 offer additional support. An oversold condition can trigger a technical rally to key initial resistance at 132-135/141-145 (10/30-wk ma).
Rationale: A breakout of multi-year accumulation pattern above 59-60 in late-2012 (not shown) renders upside target to 93.5. ITW has surpassed this target as it traded to a high of 100.14 (Mar '15). A weekly death cross sell signal during Apr '15 led to a consolidation through Aug '15. The ability to find key support near its 2014/2015 lows at 76.25-79.06 prevented a deeper correction. However, this may have created a large head/shoulders top pattern. Key neckline sup-port resides near the mid-to-high 70s and key resistance is 89.5/95 or the left/right shoulders (Jun '14/Dec '15 highs).
Rationale: A large multi-year technical base breakout above the low-to-mid 70s achieved our technical target of the low-110s during Nov ’14 (109.49). Soon after, an overbought condition coupled with a weekly death cross sell signal and a descending triangle breakdown warned of a correction. After declining 24% to 81.79 (Aug '15) a strong tech-nical rally attempted to retest its prior all-time high. However, the Jan '16 gap down now warns of another consolida-tion to initial support at 94-95. Violation here renders downside to the low-90s/mid-80s. Key supply is 100-102.5/105.
Rationale: We retain a technical Bullish view on KMB as the primary uptrend channel (101-106 and 128-130) from 2008 remains intact. However, failure to clear above the top of its channel coupled with a recent 1/8/16 negative out-side week now hint of consolidation over the near-to-medium term. Key initial support is at 116-119 or the Oct '15 breakout as well as the 30-week ma. Secondary support resides along 108 +/- 2 and then 100-102 or the bottom its uptrend channel. A breakout its prior high at 130 renders upside to the mid-130s and then the mid-140s.
Coca Cola Co (KO)
Source: FactSet, UBS as of 25 January 2016
Support levels Resistance levels
First Second Third First Second Third
39-41 35-36 31.50-32/30 45-46 50-51 54-55
Technical rating Neutral
Sector Cons Staples
Last Sale Price $42.16
Rationale: We retain a Neutral outlook as this important consumer staples name remains confined to a well-established 3-plus year trading range between mid-to-high 30s on the downside and mid-40s on the upside. A recent weekly golden cross buy signal is positive. However, a convincing move above 45-46 or Nov '14/Oct-Dec '15 highs and top of the channel confirm a breakout and warrant an upgrade. Key support is at 39-40 or the Aug/Dec '14, Mar/Jun/Jul '15 and Jan '16 lows and the 30-week ma. The mid-30s or the bottom of channel remains major support.
Technical Review of Stocks
UBS CIO WM Research 26 January 2016 22
L Brands Inc. (LB)
Source: FactSet, UBS as of 25 January 2016 Support levels Resistance levels
Rationale: The bullish uptrend channel from the 2008/09 lows, and a multi-year breakout in 2010/11 above the low-30s still merit a medium to long-term technical Bullish outlook. However, a negative outside month on Apr '15 and a subsequent negative outside week on 10/23/15 warn of a consolidation over the near-term. Despite the 21.6% set-back from its Apr '15 highs the ensuing rally from its Aug '15 low of 75.11 not only recouped all of its prior losses but established new record highs of 101.11 in Nov '15. A convincing move above 101.11 signals the next rally.
Rationale: We retain a technical Bullish rating on this Restaurant name. A convincing surge above 105-107 confirms a (gap up) breakout of the top of a well-established 5-year technical base. This major breakout is technically significant as this renders next upside target to 125-126 (near-term), 132-133 (intermediate-term), and then 140 (longer-term term). More recently, a positive outside week on 12/4/15 and 12/18/15 suggest higher prices. Initial support moves up to as high as 104.25-108.38 or the 10/22/15 gap up, the prior major breakout, 30-week ma and the Nov '15 lows.
Rationale: Trading 72.50 during Oct '13 confirmed a major technical breakout rendering upside target to 127-128. A 48% rally from Oct '14 low (73.96) to Mar '15 high (109.13) led to an overbought condition resulting in the Aug/Sep '15 correction to the mid-40s. A positive outside week on 11/06/15 triggered a rally that stalled near 100-101. Two gap downs in Jan '16 at 96.5-98.5 and 93-93.5 (key resistances) warn of another correction to major support at 72.5-75.5 or the Oct '13 breakout, 38.3% retracement from 2009-2015 and 50% retracement from 2013-2015 rally.
Rationale: An inverse head and shoulder pattern breakout dating back to 2004 (not shown) ignited a strong rally that achieved a new all-time high at 170.5 (Mar '15). Soon after, a weekly death cross sell signal (May '15) led to a 21.4% decline to its Aug '15 low of 134. A gap up (10/5/15) and a positive outside week (10/23/15) have led to a rally to-wards key resistance at 160. However, failure to breakout coupled with a potential head/shoulders top as well as 3 gap downs in Dec '16/Jan '16 (low-140s to mid-150s) warn of a major test of neckline support at 131-134.
Rationale: MO appears to be negating its 2009 broadening wedge pattern (shown above). More recently, a breakout above the top of its 1-year trading range at 56-56.5 as well as a weekly golden cross buy signal in the mid-Aug '15 and the negation of the Mar/Aug '15 negative outside months as well as a potential positive outside month (Jan '16) hint of higher price. The recent breakout renders upside targets to the low-60s (near-term), mid-60s (medium term) and then to the low-70s (long-term). Key initial support is 55-56 or the prior breakout as well as the 10-mo and /30-wk ma.
Merck & Co (MRK)
Source: FactSet, UBS as of 25 January 2016
Support levels Resistance levels
First Second Third First Second Third
45.5-47 40-41 36-37 55 +/- 1 60-61.7 63-64/71-72
Technical rating Neutral
Sector Healthcare
Last Sale Price $50.92
Rationale: The breakout of the 2000/2007 downtrend (not shown) above low-40s signals a longer-term recovery. However, the recent 2011 uptrend channel breakdown (mid-50s) weakens the medium-term technical outlook. Nega-tive outside months (Jun/Aug '15) and rolling of key moving averages warn of selling. The 10/16/15 positive outside week pattern helped to stabilize the selling but a negative outside week pattern (12/4/15) and failure at mid-50s sug-gest a test of key support at 45.5-47 or the Aug '15 low, 2009 uptrend and 38.2% retracement of 2009-2015 rally.
Rationale: We retain a Bullish technical outlook on NEE as evident by a breakout of multi-year accumulation pattern above 73.75 or the 2008 highs. However, a 4-year broadening top pattern warns of a maturing trend. The stock sud-denly reversed direction after making a high of 112.64 on Jan '15. Soon after, a gap down during Aug '15 as well as a negative outside month has broken the bottom of its 2011 uptrend channel. However, the Dec '15 positive outside month and the recent 1/8/16 positive outside week suggest a major test of support at 94-96 (Dec '14/Sep '15 lows) .
Rationale: After rallying to all-time highs at 79.93-79.99 (June '14/Apr '15) a triangle pattern has developed between the mid-60s and the high-70s. A breakout above 79-81 still renders upside to the mid-to-high 80, over time. On the downside, recent violation of key support near the low-70s (2009 uptrend) and the Jan '15/Jan '16 lows as well as a Jan '16 gap down warn of a correction to 68.5 or the 23.6% retracement from 2009-2014 rally and below this to the Jun/Sep '13 and the Oct '14 lows (63.38-65.79). Additional support is at 60.97 or the 38.2% retracement.
Rationale: A breakout above a multi-year basing pattern in the mid-60s during early 2013 led to well-defined uptrend channel. After achieving a record high of 106.84 (Jul '15) negative outside weeks on 7/24/15 and 8/21/15, gap downs on Aug/Sep '15 and the violation of 2012 uptrend channel at 98-101 warn of a top/trend reversal and hence our tech-nical Neutral stance. NVS has fallen 26.3% in the past 26 weeks and is now testing next key support at 78-79 (50% and 38.2% retracements from 2012-2015 and 2009-2015 rallies) and below this to 70-72.5 (61.8/50% retracements).
Rationale: Although the longer term trend remains favorable a Neutral defensive stance is recommended on a near-to-intermediate term basis. Recent failure to clear above the top of its 2013 uptrend channel as well as above its Aug '00 record high (46.41) and a negative outside month during Jun '15 led to a test of its prior breakout levels (36.50) and top of 2011 ascending triangle pattern. A gap up on 10/5/15 triggered a technical rally to the low-40s solidifying a head/shoulders top. The Jan '16 gap down warns of a decline to 33-34 and below this to 30. 37-38 is key initial supply.
Rationale: A breakdown from two symmetrical triangles below 90 in Sep/Oct '14 and again below the low-80s during the Nov/Dec '14 coupled with falling WTI Crude prices substantiate our technical Bearish view. A falling wedge pattern has developed over the past 2 years. This pattern hints of a potential medium term bottom. The ability to find support near the bottom of wedge in the high-50s can trigger a technical oversold rally to key initial resistance at 68-70 or the 10-wk/30-wk ma and above this to 74-75 or the top of wedge and 38.2% retracement from 2014-2016 decline.
Rationale: A surge above 79.79 during Apr '13 confirms a multi-year breakout and renders upside targets to as highs as 135-136, longer-term. On a medium term basis, the 31% rally from Feb '14 lows resulted in a record high of 100.7 (Nov '14) prompting an overbought condition and the current consolidation between low-90s and low-100s. Although the Aug '15 negative outside month hints of another technical base, two gap ups during Oct '15 set marginally new highs at 103.44. Nonetheless, a 12/11/15 negative outside week and Jan '16 gap suggests a test of support at 90-92.
Rationale: A 10-year downtrend breakout above 19 +/- 1 during 2011 (not shown) ignited a major recovery. However, the 2009 to present rally stalled near its 61.8% retracement (mid-30s) from the 1999-2009 decline. Although the Jul '15 positive outside month pattern is constructive, a 21.9% decline from its Jul '15 high has created a potential head/shoulders top pattern. Key neckline support is visible at 27.12-28.47. A decisive breakdown confirms a top and warns of a decline to the low-to-mid 20s. Key resistance is at 33 or the Mar '14 high (left shoulder) and the 30-wk ma.
Rationale: A failure to sustain a breakout above the top of its 15-plus year uptrend channel (not shown) in the low-90s and deteriorating relative strength (SPX) signal a correction. A subsequent death cross sell signal during Mar '15 and the Jul '15 negative outside month led to a 31% decline from the Dec '14 highs. However, the stock found sup-port near the bottom of the 2010/11 uptrend channel near key support at 65-67 and is attempting to form a base. AJan '16 gap down suggests a trading range is between 72-74 and 81-83, near-term. Above 83 confirms a recovery.
Technical Review of Stocks
UBS CIO WM Research 26 January 2016 29
Philip Morris International (PM)
Source: FactSet, UBS as of 25 January 2016
Support levels Resistance levels
First Second Third First Second Third
83-85 81-81.5/75-78 70-72 90-92 95-97 100-102
Technical rating Neutral
Sector Cons Staples
Last Sale Price $88.68
Rationale: This Consumer Staples name retains its longer term bullish uptrend dating back to 2008/09. Although the 04/19/15 gap up and the Apr '15 positive outside month are encouraging, the increased volatility during Aug/Sep '15 sends a mixed technical signal. The ability to maintain key support in the mid-70s prevented a deeper correction. More recently, 12/18/15 positive outside week pattern and triangle breakout above the mid-80s can lead to a retest of 96.73 or its (2013) all-time highs. Trading above prior 2013 highs signal the resumption of its primary long-term uptrend.
Rationale: RDSA has also declined in sympathy with its energy peers falling 57.44% from its Jul'14 highs. The recent break below the 2003 and 2009 lows at 37/38 has established new lower-lows (35.5 on Jan '16) or to levels last wit-nessed during 1996. This dramatic downturn has led to this energy name to retrace nearly 61.8% (35.98) of its 1982 to 2008 rally. An extreme oversold condition coupled with gap up (1/22/16) suggests a technical rally to 45-47 (10-wk ma and the 23.6% retracement from 2014 decline) and above this to 50.5-54 (30-wk ma and the 38.2% retracement).
Technical Review of Stocks
UBS CIO WM Research 26 January 2016 30
Starbucks Corp. (SBUX)
Source: FactSet, UBS as of 25 January 2016
Support levels Resistance levels
First Second Third First Second Third
55-57 50-52/45-46 40-42 59-61.5 63-64/70 76-77
Technical rating Bullish
Sector C. Discretionary
Last Sale Price $57.71
Rationale: We retain a Bullish technical outlook on SBUX as long as it maintains above the top of its 2009/2012 up-trend channel (mid-50s) and its 10-mo ma (57). Although SBUX has corrected 14.161% from its Oct '15 highs (64) the ability to maintain above key support in the mid-50s coupled with a positive outside day (1/22/16) can trigger another technical rally to key initial resistance at 59-61.5 or the 1/4/16 gap down, Oct '15 downtrend, Jul/Aug '15 and Jan '16 highs. A breakout signals a retest of its prior all-time high of 64. Below 54.94 suggests downside to low-50s/mid-40s.
Rationale: The Oct '13 10-year breakout above the mid-50s and the Apr '15 breakout above 69 render an upside tar-get to 85. The strong rally to new all-time highs on Jul '15 (80.84) basically achieved its target. Negative outside weeks on 7/24/15, 10/23/15 and 12/4/15 coupled with a weekly death cross sell signal during mid Sep '15 and a complex head and shoulders top pattern warns of a correction to major support in the mid-50s. Violation of 52-55 warns of a deeper correction to mid-to-high 40s. An oversold condition can lead to a rally back to 59-61 and above this to 64-65.
Rationale: We remain optimistic on TEVA based on a longer-term basis due to its breakout of a large symmetrical tri-angle dating back to 2011. A successful move above its previous all-time highs established on March 2010 (above 64.95) extended the rally towards 72.31 (Jul '15). However, the stock soon generated an island reversal the following month (Aug '15) prompting a 25.1% decline to the mid-40s (Oct '15). The ability to maintain above key support in the mid-50s now suggests a consolidation to key initial resistance at 66-67 and above this back to its record high 72.31.
Rationale: We maintain a technical Neutral stance on AT&T as the stock remains confined to a 3-yeardowntrend channel since 2012 (low-30s and mid-30s) as we as a large symmetrical triangle since 2002-2003 (23-24 and 36-37). Multiple moving averages cross overs confirms the continuation of the downtrend. The ability to find support near low-30s during Aug-Sep '15 downturn has produced another rally to key resistance at 35.5-37. Above this supply zone confirms a breakout. However, below 31-32 confirms a breakdown and suggests next downside to mid-to-high 20s.
Technical Review of Stocks
UBS CIO WM Research 26 January 2016 32
Target Corp (TGT)
Source: FactSet, UBS as of 25 January 2016
Support levels Resistance levels
First Second Third First Second Third
68.15 65 58-60 71-7275-76 78.70-80.17 85.81/91-92
Technical rating Neutral
Sector C. Discretionary
Last Sale Price $68.92
Rationale: A major technical breakout in late-2014 above its prior 2007/2013 all-time highs at 70.67-73.5 ignited a sharp rally to new record highs at 85.81 (Jun '15). However, failures to trade to fresh new highs coupled with a weekly death cross sell (Sep '15) as well as a negative outside month (Oct '15) signal a correction. The 22.6% correction from Jun '15 highs may deepen as a negative outside week (1/8/16) and a negative outside month (Jan '16) warn of a po-tential top. We recommend moving to a Neutral outlook as a breakdown below 66.46 can lead to a decline to 61-62.
Rationale: We maintain a defensive technical stance on this Energy name but believe a deeply oversold condition can lead to a sharp but unsustainable oversold rally. Since the 2007-2008 global financial crisis a large head/shoulders top pattern still warns of longer-term technical weakness. The ability to find support near 40 +/- 1 or the 2009/2011/2015 lows may lead to a technical bounce towards 44.5-47 or the 10-wk/30-wk ma and above this to low-to-mid 50s (right shoulders). A break below 39-40 could extend sell-off to 35-37.5 and possibly to 28.5-30 to retest its 2001-2003 lows.
Rationale: A breakout of a multi-year basing pattern above 57 (2011) and subsequent breakouts above mid-80s in early 2013 and 100-102 in 2014 substantiate a technical Bullish view. However, the Aug '15 negative outside month as well as a large Jan '16 gap down hint of a consolidation. Initial support is evident along 99-100 or the 2014 uptrend and below this to 95-97 or the 2015 lows. Key initial resistance lies at 110.5-113 (Jan gap down). Closing of the Jan gap down allows for a retest of its all-time high (116.48 - Nov '15). Trading range is now likely between 97 and 113.
Rationale: We recommend downgrading this Air Freight name to Bearish stance as the violation of a large 2-year head/shoulders top pattern, monthly death cross sell signal and breaking of its 2009 uptrend channel in the low-to-mid 90s warn of an intermediate term top. This breakdown renders a downside target to 84-85 or the 38.2% retracement from 2009-2015 rally and the 2006 highs. Below this support triggers a deeper setback to 79-81 and then to 76-77 or the 50% retracement and 2012 breakout. Key challenge is to clear above its prior breakdown in the low-to-mid 90s.
Rationale: This Financial stock has recovered all of its losses from the global financial crisis as evident by the progres-sion of the 5+ years uptrend channel. However, an overbought condition developed during late-2014 and into early-2015. In addition, multiple gap downs during Aug '15 correction warn of a top. A negative outside month (Dec '15), rolling over of weekly ma, 2011 uptrend breakdown and two subsequent gap downs during Jan '16 on 1/4/16 at 41.82-42.65 and on 1/7/16 at 40.78-40.81 confirms a top and we recommend moving to a Neutral technical outlook.
Visa Inc Cl A (V)
Source: FactSet, UBS as of 25 January 2016
Support levels Resistance levels
First Second Third First Second Third
67-69 60-61 54-56 74-76/77.5 80-81 98-100
Technical rating Bullish
Sector Technology
Last Sale Price $71.74
Rationale: The longer-term primary trend starting from 2008-09 lows continues to trend higher and the relative strength trend in relationship to SPX remains positive. However, this trend may be maturing as evident by the failure to clear above key resistance near the low-80s. In addition, 12/11/15 negative outside week and the Jan '16 gap down hints of the start of a consolidation to initial support at 67-69 (Sep '15/Jan '16 lows and 2014/2015 uptrend). A breakdown here suggests downside risks to the low-60s. The 10-wk/30-wk ma at 75.81/74.41 provides key initial resistance on technical rallies.
Rationale: A large ascending triangle pattern (not shown) and a triangle pattern signal a major battle between the bulls and bears. A breakout above 38-39 can lead to major test of resistance coinciding with the 2007/2014 highs (41.58-42.14). A weekly death cross sell signal coupled with Aug '15 negative outside month has triggered a correction that violated the bottom of its triangle at 31-32 confirming a breakdown. Nonetheless, a deeply oversold condition coupled with an island reversal (1/22/16) suggests a technical rally to the low-to-mid 30s before another downturn.
Rationale: A multi-year breakout above 2007 highs (43.01) in late-2012 suggests an upside target to 64-65, longer-term. However, the stock rallied only to 43.31 in 2013 before entering into an extensive consolidation between the low-to-mid 40s and the mid-50s for the past 2-plus years. The Oct '15 positive outside month and the 11/20/15,12/4/15, 12/18/15 and 1/22/16 positive outside weeks now offer technical signs of higher prices. A breakout above 47.23-48.5 can ignite a rally. Failure to maintain thelow-40s may trigger a deeper correction to the mid-to-high 30s.
Technical Review of Stocks
UBS CIO WM Research 26 January 2016 36
Walgreen Co. (WBA)
Source: FactSet, UBS as of 25 January 2016
Support levels Resistance levels
First Second Third First Second Third
76-79 73/66-67 57.75-58.50 83.8-85 95.74-97.3 105
Technical rating Bullish
Sector Cons. Staples
Last Sale Price $78.71
Rationale: A breakout of a multi-year accumulation pattern above 51.60 in 2013 renders a target to 81-82. This target was achieved on Jul/Aug '15 at a high of 97.30. However, a broadening wedge formation over the past three years as well as negative outside weeks (8/7/15, 10/30/15 and 12/11/15), daily gap downs (12/31/15 and 1/4/16) and a weekly death cross sell signal (Oct '15) warn of a maturing trend. Violation of key support at 76-79 or near the Aug/Nov '15 lows, 2012 uptrend and 50% retracement from 2014-2015 rally confirm a breakdown and forces a downgrade.
Wells Fargo & Co (WFC)
Source: FactSet, UBS as of 25 January 2016
Support levels Resistance levels
First Second Third First Second Third
46.44-47.75 44-45 38-40 53-54 56-59 63-64
Technical rating Bullish
Sector Financials
Last Sale Price $47.66
Rationale: A breakout above 44.69 (Sep '08 highs) ignited a rally as evident by a 4-plus years uptrend channel be-tween the mid-50s and the mid-60s led to higher prices. However, the Aug-Sep '15 correction led to a breakdown be-low the bottom of its 2012 uptrend channel. Nonetheless, Oct '15 positive outside month, 12/18/15 positive outside week and a constructive relative strength chart (vs SPX) led to another rally. This rally has stalled again as the Jan '16 gap down and broad market/financial sector weaknesses now warn of a deeper correction to the low-to-mid 40s.
Rationale: A breakout above the low-to-mid 80s in Nov '14 was a bull-trap after it failed to follow through to new all-time highs. A subsequent death cross sell signal, a negative outside month on Oct '15 triggered a sharp decline of nearly 38% to a recent low of 56.30. The ability to find support near the mid-50s coupled with positive outside weeks on 11/06/15, 12/25/15 and 1/8/16 help to stabilize the selling and allow for a technical basing effort. While we note the near-term improvements, WMT still needs to clear the mid-to-high 60s to confirm an intermediate term recovery.
Rationale: We retain a technical Neutral stance on XOM and believe that the recent events in the Energy and com-modities arena are evident of structural trend changes. Violation of 2002 uptrend (low-70s) as well as a head and shoulders top breakdown (below 85) last year warned of downside risks to the mid-60s. The ability to maintain above key support at 66.55 during Aug '15 may have successfully tested the Aug '11 lows and the 76.4% retracement from 2010-2014 rally. This can lead to a technical oversold rally towards formidable resistance along the low to mid-80s.
Technical Review of Stocks
UBS CIO WM Research 26 January 2016 38
Appendix
Description and Methodology This report provides technical analysis on a dynamic list of stocks that, we believe, are of a wide interest. Please note that technical views are highly variable and will change with market conditions. Accordingly, these rat-ings are only valid as of the publication date. Because CIO WMR equity sector analysts and WMR technical analysts employ different analytical methodologies, technical recommendations are, at times, contradictory to fundamental recommendations for the same security. For the latest company ratings by WMR sector analysts, please refer to the most recent equity sector research reports, located in the Equity Section on the Online Services Research website. For more background on the content of this report, please see Technical Analysis Research Primer, 18 February 2010.
Appendix
Term / Abbreviation Description / Definition
% +or- Moving Avg (DMA)
The percentage above or below the moving average (see Moving Average) is used to help measure an overbought or oversold condition and is a component of risk management. It is calculated by taking the difference between the group price and its 30-week moving average (see below), and then dividing by the 30-week moving average times 100.
30-Week Moving Average Also known as the 30-week line or 150-day line), this is one of the most popular and respected moving average indicators (see Moving Average) in technical circles. It is calculated by totaling the latest 30 weekly (usually Friday closing) prices and dividing by 30 to arrive at the average. Each week, the most recent week’s figure is added to the total, and the price level from 30 weeks ago is subtracted – hence the term “moving.” Please note that a breakout above or breakdown below this line does not, in and of itself, constitute a buy or sell signal.
Adjusted Relative Strength (ARS) Number gives a 50% weighting to the 1-month relative strength, 30% to the 3-month, and 20% to the 6-month numbers to arrive at a single weighted number.
Base A chart pattern marking a period of accumulation following a downtrend. The larger the base, the greater the upside potential following its completion. A base can take many forms.
Beta A measure of volatility of a security as it relates to the market as a whole. Beta is often calculated using regression analysis. A beta is basically the tendency of a security’s returns to respond to swings in the market. A beta of 1 indicates that the security’s price will move with the market. A beta of less than 1 means the security will be less volatile than the market. A beta of greater than 1 implies that the security’s price will be more volatile than the market.
Blow off stage to a major rally This is often the last stage of a speculative bubble to a major rally. The blow off phase tends to be steep, but short-lived that often affords little opportunity for investors/traders to exit their positions. As price of a security or an asset advanced to an unsustainable level via a parabolic uptrend this give rise to the bursting of the speculative bubble resulting a quick and dramatic decline as inves-tors/traders try to exit the market/security at the same time.
Breakdown A technical term indicating a downside resolution of a chart pattern. Its significance is determined by the same factors governing a breakout.
Breakout A technical term indicating an upside resolution of a chart pattern. Breakouts can take many forms, and their degree of importance is determined by the significance of the chart pattern which preced-ed it.
Technical Review of Stocks
UBS CIO WM Research 26 January 2016 39
Appendix
Broadening Top Formation The Broadening top is a rare technical formation that resembles an inverted triangle pattern. It is formed by price swings that are increasingly widening and expanding volume. The most common of these broadening top patterns are the three ascending peaks and two descending troughs. The combination of wide price swings and increasing volume often convey an increasingly volatile and emotional market that's basically out of control. This pattern is often associated with market tops rather than market bottoms. The confirmation of the Broadening top occurs when the price violates the second of these two troughs.
Channel
A chart pattern comprised of two parallel trend lines, which form a trading band. Channels take the form of uptrend, downtrend and horizontal.
Death Cross The opposite of a golden cross, this is a crossover on the chart resulting from a security’s shorter-term moving average falling below its longer-term moving average. Technicians often see this as a bearish technical sign indicating the market has turned negative on the security.
Downtrend Line
A trend line connecting successively lower peaks for a stock (or market). Its technical significance is determined by the same factors governing an uptrend line.
Fan reversal pattern The fan formation is a technical pattern that is based on the use of multiple trend lines to denote a major trend reversal. The fan pattern gets its name as it basically resembles a “fan”. It should have a minimum of three trend lines (uptrends or downtrends). The break out/break down of the third downtrend/uptrend often completes the fan pattern and signals the start of a major trend reversal. The starting point of these trend lines should come from a significant peak or a significant trough.
Fibonacci Retracement Level A technical analysis term used to describe potential areas of support (price stops declining) or re-sistance (price stops rising) on the charts. After a strong rally or decline there is a tendency for a security to retrace a certain portion of its prior move (up or down). Fibonacci retracements use hori-zontal lines to indicate areas of support or resistance at the key Fibonacci levels before continuing in the original direction. These levels are computed by taking the two extreme points and then dividing the vertical distance by the key Fibonacci ratios of 23.6%, 38.2%, 50%, 61.8% and 100%.
FSR Forecast Stock Return is defined as expected percentage price appreciation plus gross dividend yield over the next 12 months.
Gap
An open space in a chart created when a stock (or market) opens either higher than its highest level attained during the prior session (referred to as a gap up or an upside chart gap) or lower than its lowest level reached during the prior day (called a gap down or a downside chart gap). Some gaps are caused by events and should be ignored: ex-dividend gaps, new share issues, and expiration of futures contracts.
Golden Cross A crossover on the chart that involves a security’s shorter-term moving average (such as the 50-day moving average) crossing above its longer-term moving average (such as the 150-day or 200-day moving average). Technicians often interpret this crossing of two moving averages as a bullish tech-nical sign that suggests the market has turned in favor of the security.
Head-and-Shoulders Pattern This technical formation is one of the best known of the reversal patterns. There are two types of head-and-shoulders patterns that often appear on the charts – H/S top and H/S bottom. Both of these patterns often denote the process of a reversal either from a bullish or bearish trend. Head-and-shoulders formation often is comprised of a left shoulder, a head, and a right shoulder, and a line drawn across its shoulders defines its neckline. The breaking of the neckline to the upside con-firms a head-and-shoulders bottom breakout, which signals the start of a bullish reversal favoring higher prices. The violation of neckline to the downside validates a head-and-shoulders top, reaf-firming a bearish reversal of lower prices.
Internal Trend Line A single trend line connecting at least several high and low points for a stock (or market) over time.
Linear Regression Band A common statistical technique often used by investors/traders to better forecast values by utilizing the least squares fit method to plot a trend line. A linear regression band consists of upper and lower bands. These bands are calculated by computing the number of standard deviations above or below of the regression line.
Technical Review of Stocks
UBS CIO WM Research 26 January 2016 40
Appendix
Moving Average (m.a.) This is a technical indicator frequently used in technical analysis to show the average value of a security’s price over a set period of time. This tool is designed to smooth out a stock’s (or market’s) shorter-term fluctuations to provide a better picture of an underlying trend. Moving averages gener-ally are used to measure momentum and define areas of possible support and resistance. Moving averages can be helpful as they emphasize the direction of the dominant or prevailing trend and also tend to smooth out price and volume fluctuations, or “noise,” giving the trader or investor a clearer picture of the security in question. Many moving averages exist.
MRA Market Return Assumption is defined as the one-year local market interest rate plus 5% (a proxy for the equity risk premium and not a forecast).
Neckline Support/Resistance This is a trend line that is drawn across the bottoms or tops of the left shoulder, the head and the right shoulder of a potential head-and-shoulders bottom or top pattern. When prices break through this neckline support level and continue falling after forming the right shoulder, it confirms a head-and-shoulders top formation. Conversely, neckline resistance is a trend line drawn across the tops of the left shoulder, the head and the right shoulder. When prices break above this neckline resistance level and keep on rising, it typically completes the head-and-shoulders bottom pattern.
Overbought A technical condition in which the price of a security has risen to such a degree that the price be-comes overvalued or has reached the upper band of its trading range resulting in a potential pull-back in price.
Oversold Opposite of Overbought. A technical condition that occurs when the price of a security has fallen to such a degree that the price becomes undervalued or has reached the lower band of its trading range prompting a potential rally.
Positive/Negative “Outside” Day
When one day’s range (high and low) exceeds the prior day’s range, and the stock (or market) in question closes near its daily peak, this is referred to as a positive “outside” day. A negative “out-side” day would be recorded if the stock (or index) finished near its daily low after having a wider range than the prior session. The same rule can be applied on a weekly and monthly basis as well.
Relative Strength
Relative strength is a performance comparison between a sector, group, or stock and the S&P 500 Index over a specified time frame. Our time frame is often a one-, three-, and six-month basis but does vary according to investment orientation.
RRD Rating/Return Divergence is automatically appended to the rating when stock price movement has caused the prevailing rating to differ from that which would be assigned according to the rating system and will be removed when there is no longer a divergence, either through market movement or analyst intervention.
Support An area where increased buying interest is likely to develop during a decline. These points, which can take several forms (minor, major, etc.), often provide downside protection for an issue in a pri-mary uptrend, but only temporary relief to an issue in a primary uptrend, during which time many support levels are often broken.
Top A chart pattern marking a period of distribution following an uptrend. The larger the top, the great-er the downside potential following its completion. It, too, can take many forms.
Triangle Patterns There are three different types of Triangle patterns – Symmetrical, Descending and Ascending. Symmetrical Triangle is considered to be a continuation pattern that often signals a period of con-solidation in a trend followed by a resumption of the prior trend. It is formed by the convergence of a descending trend and an ascending trend. An Ascending Triangle is a bullish pattern, which is denoted by two trend lines – a flat trend line and an ascending uptrend line. A Descending Triangle is a bearish pattern. It is the opposite of the Ascending Triangle in that there is a flat trend line and a downward sloping downtrend line.
Technical Review of Stocks
UBS CIO WM Research 26 January 2016 41
Appendix
Statement of Risk
Statement of RiskEquities - Stock market returns are difficult to forecast because of fluctuations in the economy, investor psychology,geopolitical conditions and other important variables.
Required Disclosures
Analyst Certification
Each research analyst primarily responsible for the content of this research report, in whole or in part, certifies that withrespect to each security or issuer that the analyst covered in this report: (1) all of the views expressed accurately reflecthis or her personal views about those securities or issuers; and (2) no part of his or her compensation was, is, or will be,directly or indirectly, related to the specific recommendations or views expressed by that research analyst in the researchreport.
CIO Wealth Management Research equity selection systemEquity sector strategists provide three equity selections: Most Preferred (MP), Least Preferred (LP) and Bellwetherdesignation.
Rating definitionsMost Preferred*: The equity sector strategist expects the stock to outperform the relevant benchmark in the next 12months.Least Preferred*: The equity sector strategist expects the stock to underperform the relevant benchmark in the next12 months.Bellwether: Stocks that are of high importance or relevance to the sector and which the equity sector strategist expectsthe stock to perform broadly in line with the sector benchmark in the next 12 months.*A stock cannot be selected as Most Preferred if UBS Investment Research rates it a Sell, while a UBS Investment ResearchBuy rated stock cannot be selected as Least Preferred.
Restricted: Issuing of research on a company by CIO WMR can be restricted due to legal, regulatory, contractual or bestbusiness practice obligations which are normally caused by UBS Investment Bank’s involvement in an investment bankingtransaction in regard to the concerned company.
Technical Research Rating Definitions
Rating Corresponding Rating Category Definition and criteriaBullish Buy Well-defined, reliable uptrend, an increase in the rate of change
(or strong momentum) and confirming technical indicators.Neutral Hold Trading range trend, a flat rate of change and confirming
technical indicators.Bearish Sell Negative or weakened trend, momentum and confirming
technical indicators.N/A Not enough historical data to make an evaluation.
For a complete set of required disclosures relating to the companies that are the subject of this report, please mail arequest to UBS CIO Wealth Management Research Business Management, 1285 Avenue of the Americas, 20th Floor,Avenue of the Americas, New York, NY 10019.
3, 4, 5, 7, 9, 11, Duke Energy 1, 2, 3, 4, 5, 6, 7, 8, E.I. DuPont de Nemours & Co. 1, 3, 4, 5, 7, 9, 11, Exxon Mobil 1, 3,4, 5, 8, 9, Facebook 1, Ford Motor Co 1, 3, Franklin Resources 1, 2, 3, 4, 5, 6, 7, 9, General Mills Inc. 1, 3, 4, 5, 9, GileadSciences Inc. 1, GlaxoSmithKline Plc 1, 3, 8, Halliburton 1, 3, 4, 5, 13, Home Depot Inc. 1, 4, 5, Honeywell InternationalInc. 1, 3, 4, 5, 9, Illinois Tool Works Inc. 1, 13, Intl Business Machines 1, 3, 4, 5, 7, 8, Johnson and Johnson 1, 3, 4, 5, 6, 9,Kimberly-Clark Corp. 1, 4, 5, L Brands 1, McDonald's Corp. 1, 4, 5, 11, McGraw-Hill Cos. 1, 4, 5, Merck and Co Inc 1, 3,4, 5, 7, 9, 11, Nestle SA/AG 3, 4, 5, 8, 11, NextEra Energy Inc. 1, 3, 6, 7, 8, Novartis 1, 2, 3, 6, 8, 11, 13, 14; OccidentalPetroleum 1, 3, 8, Oracle Corp. 1, 4, 5, PepsiCo Inc. 1, 2, 3, 4, 5, 6, 7, 8, 9, Pfizer Inc. 1, 3, 4, 5, 9, Philip Morris Intl Inc.1, 2, 3, 4, 5, 6, Procter & Gamble Co. 1, 2, 4, 5, 6, 8, Royal Dutch Shell Plc 1, 3, St. Jude Medical Inc. 1, Starbucks Corp.1, 3, 7, Target Corp. 1, Teva Pharmaceuticals Ltd. 1, 11, Total SA 1, 2, 3, 13, Travelers 1, 3, 4, 5, 9, U.S. Bancorp 1, 2, 3,4, 5, 6, 9, United Parcel Service Inc. 1, 2, 3, 4, 5, 6, 7, 8, 9, Verizon Communications Inc. 1, 3, 4, 5, 6, 8, Vodafone Group1, 3, 8, 10, Wal-Mart Stores Inc. 1, 4, 5, Walt Disney Co. 1, 3, 4, 5, 11, Wells Fargo 1, 2, 3, 4, 5, 6, 7, 8, 9, 11,
1. UBS Securities LLC makes a market in the securities and/or ADRs of this company.2. UBS AG, its affiliates or subsidiaries has acted as manager/co-manager in the underwriting or placement of securitiesof this company/entity or one of its affiliates within the past 12 months.3. Within the past 12 months, UBS Securities LLC and/or its affiliates have received compensation for products andservices other than investment banking services from this company/entity.4. This company/entity is, or within the past 12 months has been, a client of UBS Financial Services Inc, and non-investment banking securities-related services are being, or have been, provided.5. Within the past 12 months, UBS Financial Services Inc has received compensation for products and services otherthan investment banking services from this company.6. This company/entity is, or within the past 12 months has been, a client of UBS Securities LLC, and investmentbanking services are being, or have been, provided.7. This company/entity is, or within the past 12 months has been, a client of UBS Securities LLC, and non-securitiesservices are being, or have been, provided.8. UBS AG, its affiliates or subsidiaries expect to receive or intend to seek compensation for investment banking servicesfrom this company/entity within the next three months.9. This company/entity is, or within the past 12 months has been, a client of UBS Securities LLC, and non-investmentbanking securities-related services are being, or have been, provided.10. UBS Limited acts as broker to this company.11. The equity analyst covering this company, a member of his or her team, or one of their household members has along common stock position in this company.12. The fixed income analyst covering this company, a member of his or her team, or one of their household membershas a long common stock position in this company.13. UBS AG, its affiliates or subsidiaries beneficially owned 1% or more of a class of this company's common equitysecurities as of last month's end (or the prior month's end if this report is dated less than 10 days after the most recentmonth's end).14. UBS AG is acting as agent in regard to Novartis AG's announced share buyback programme.


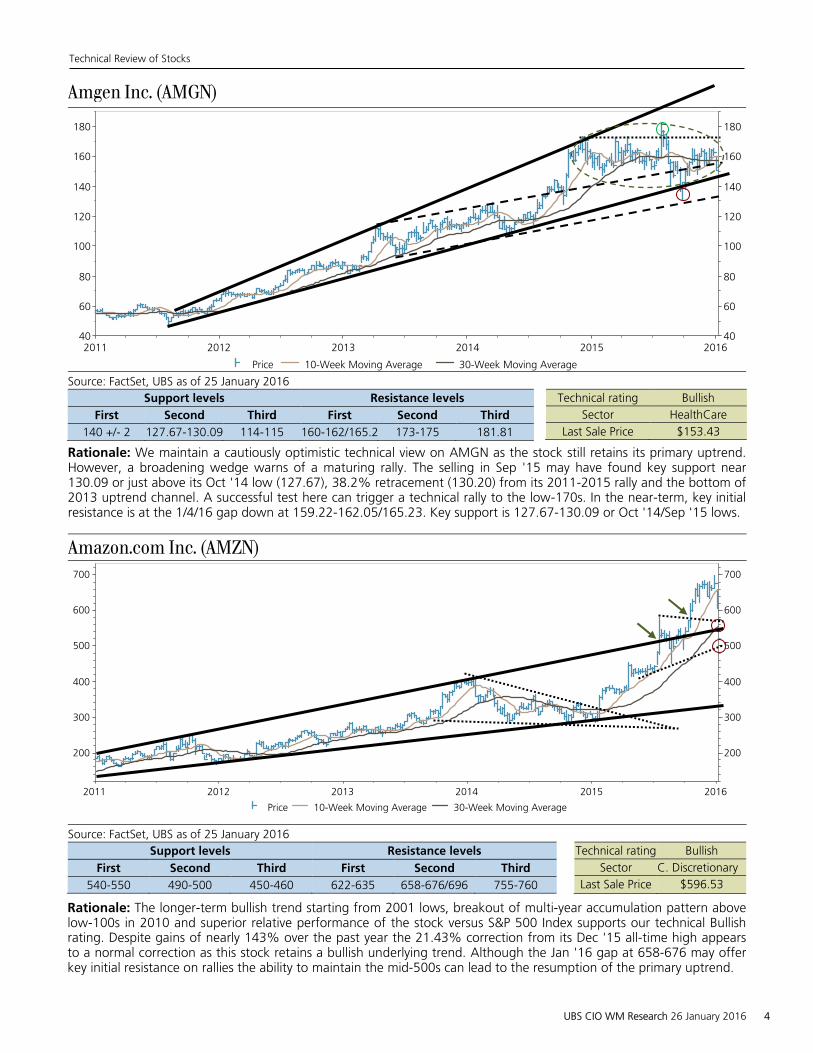

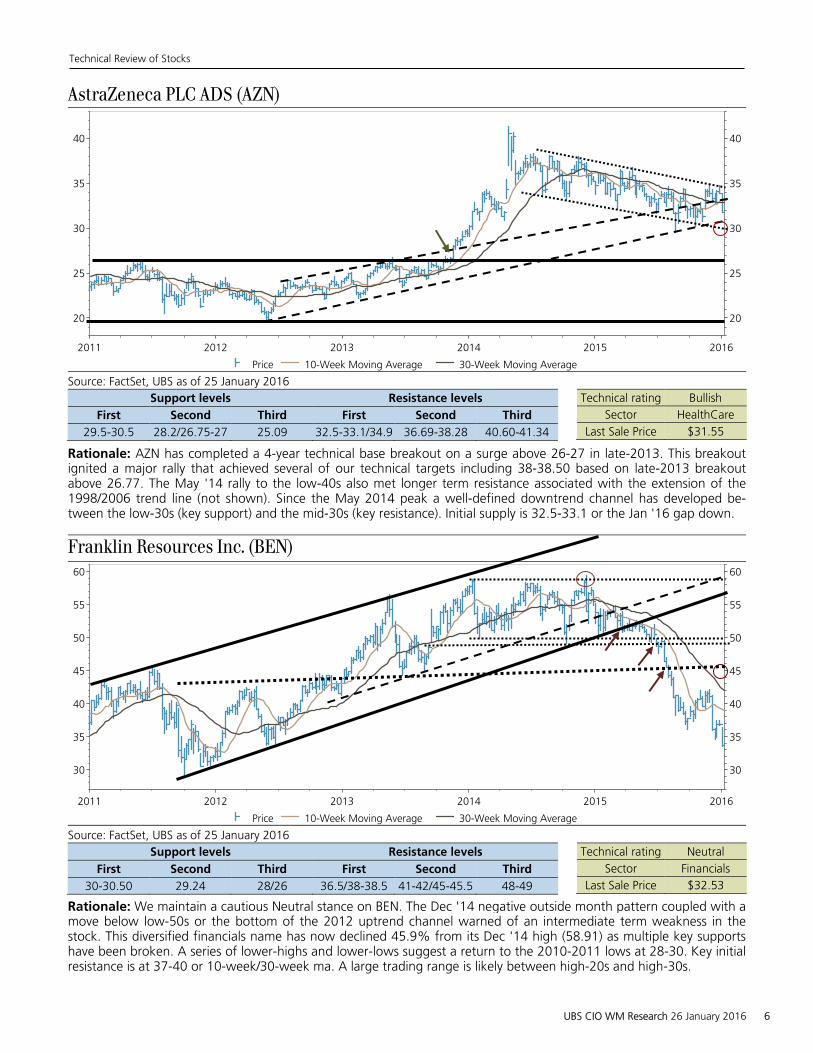
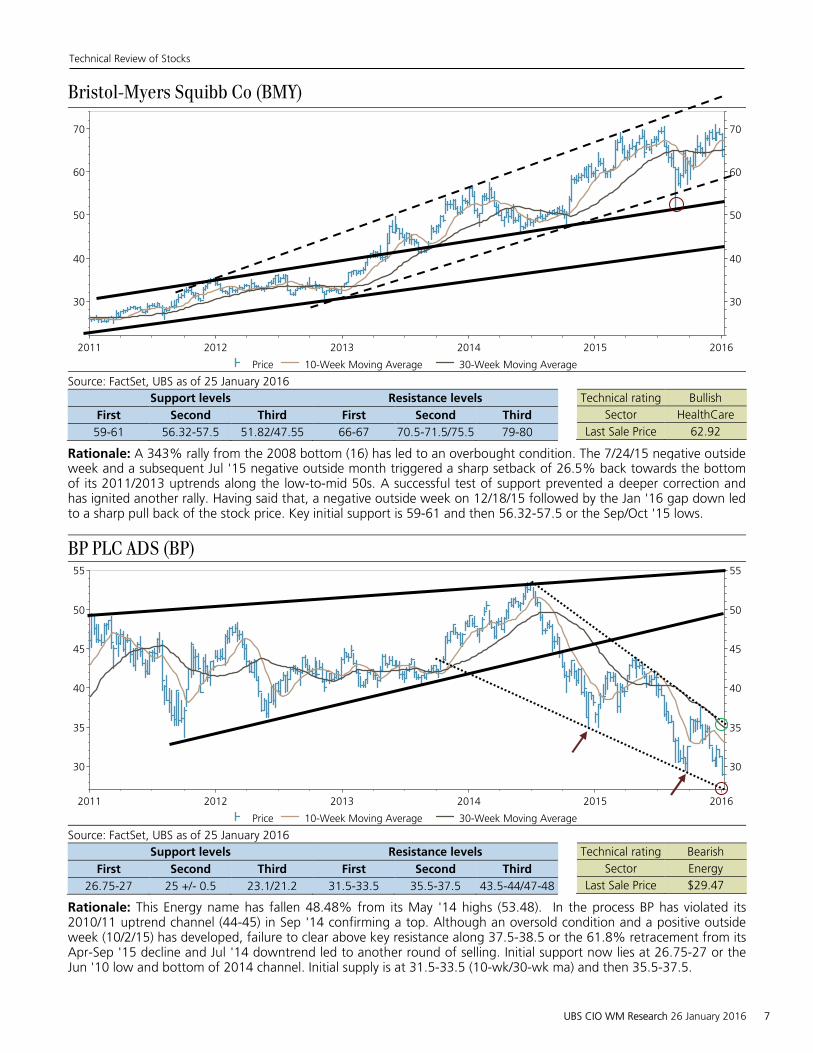
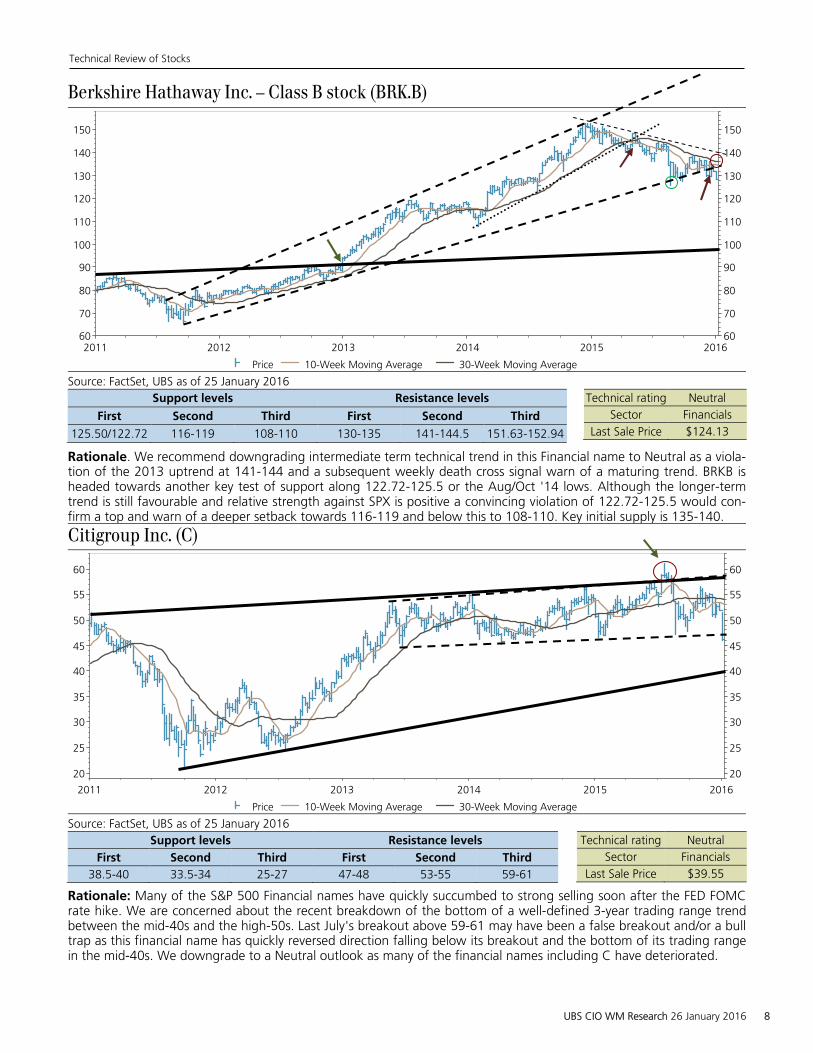

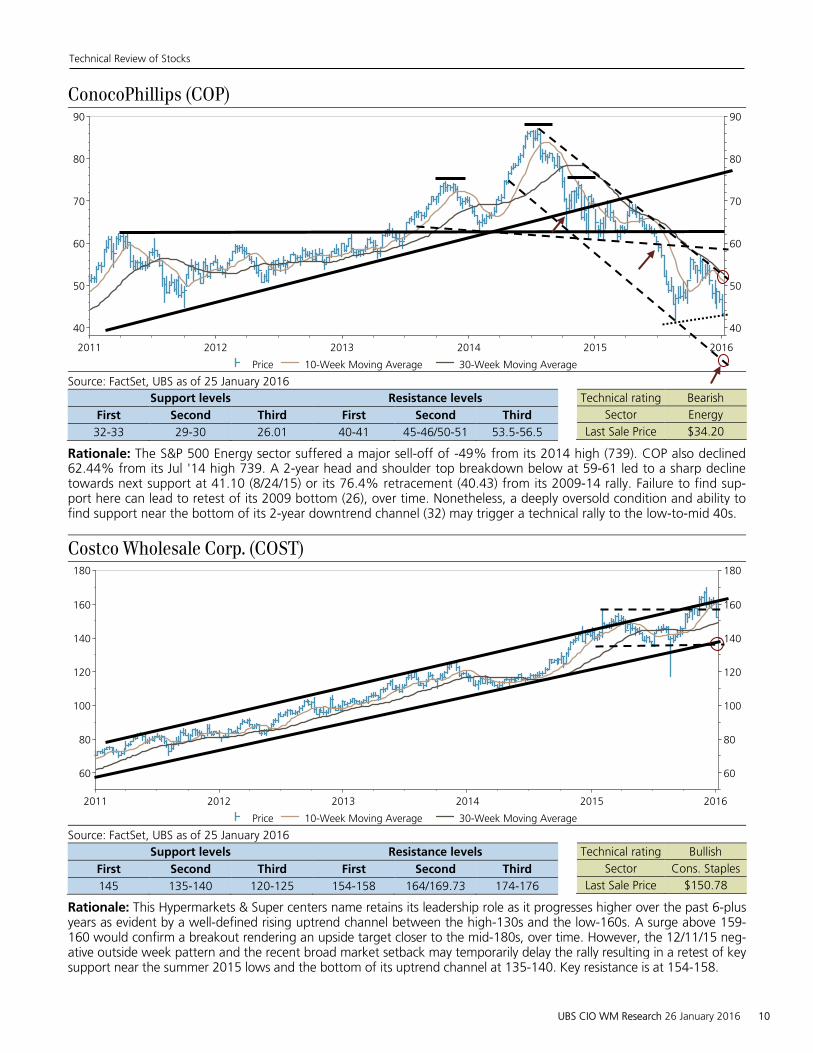
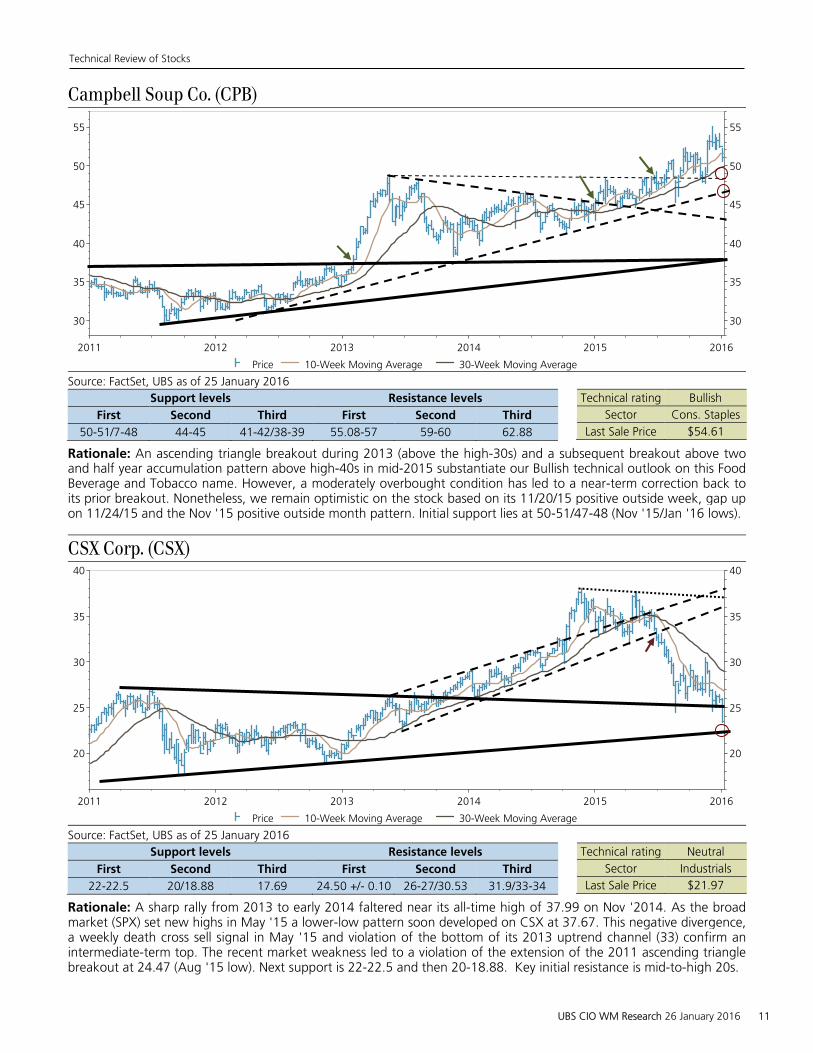


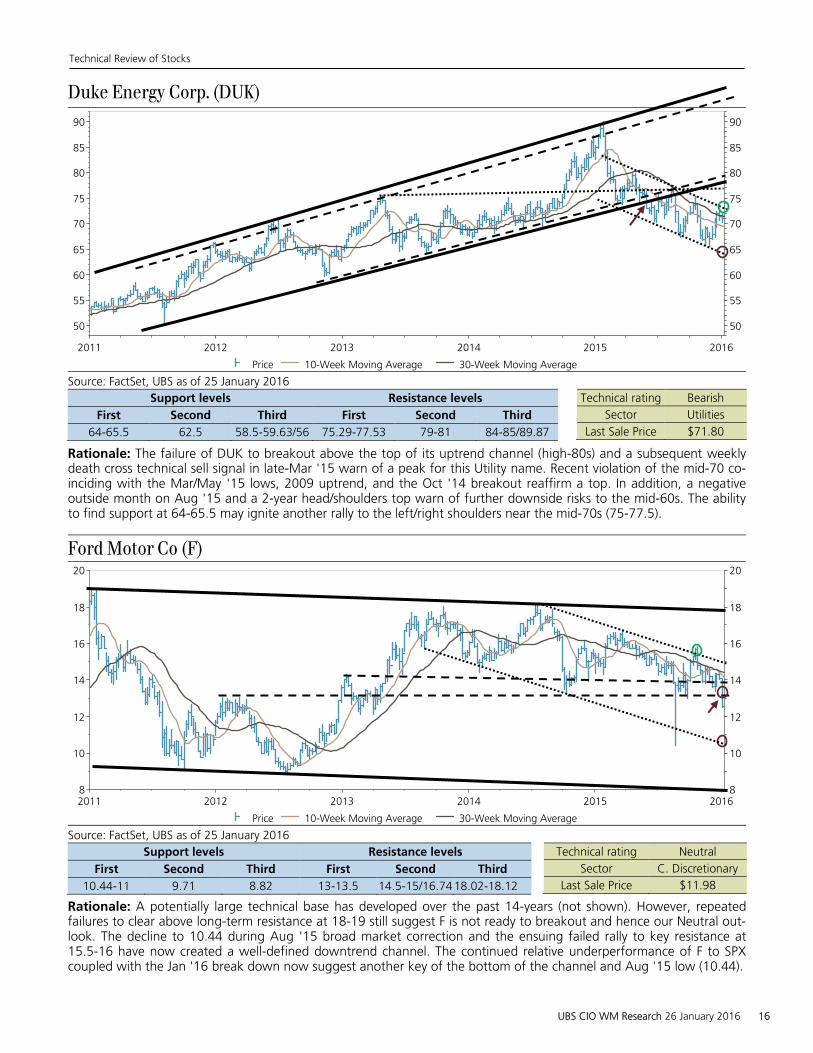
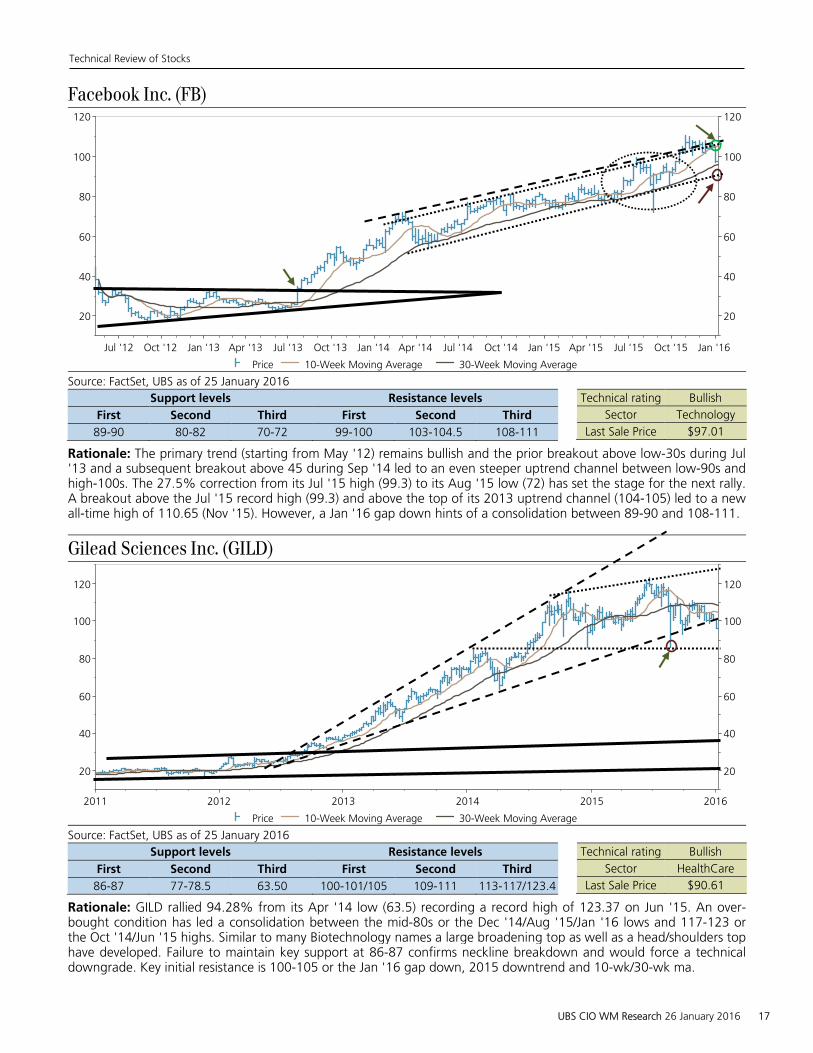

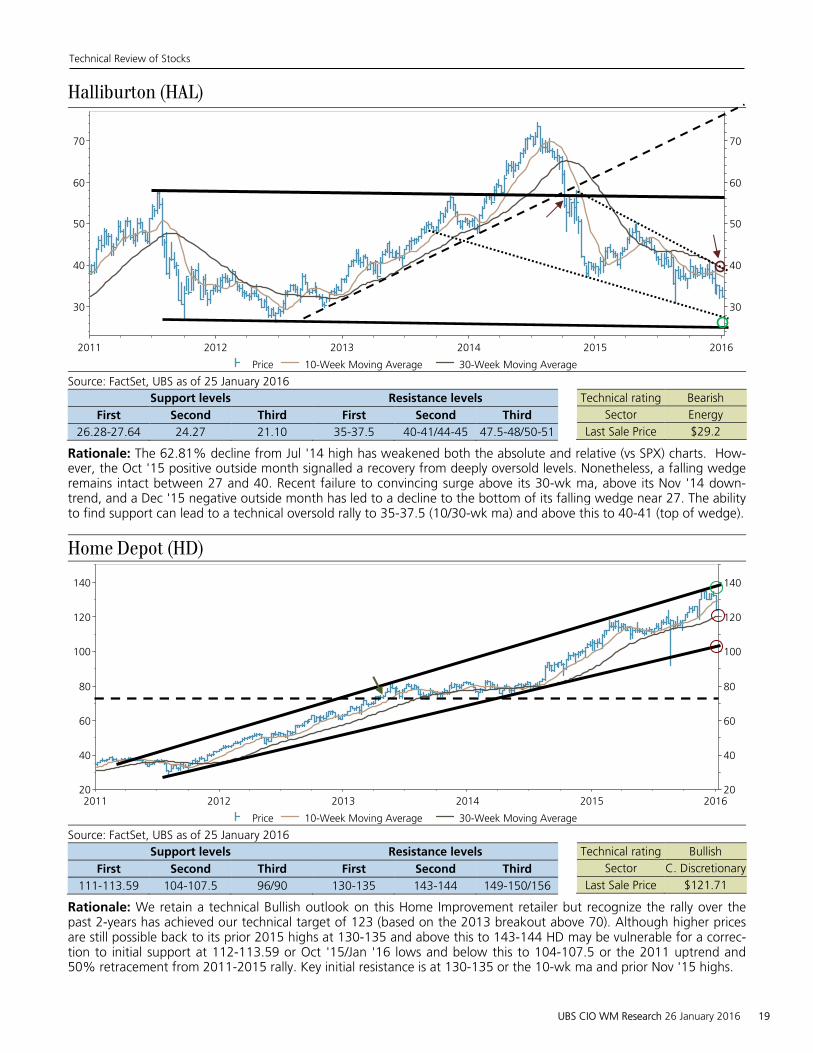

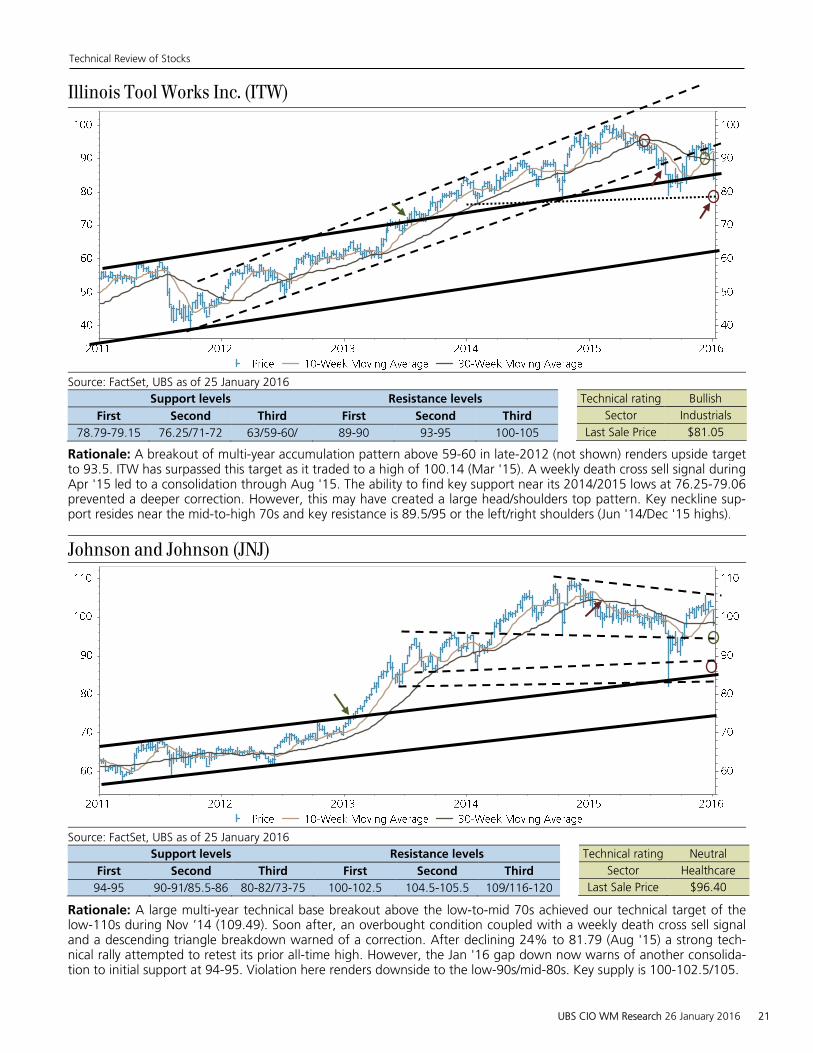
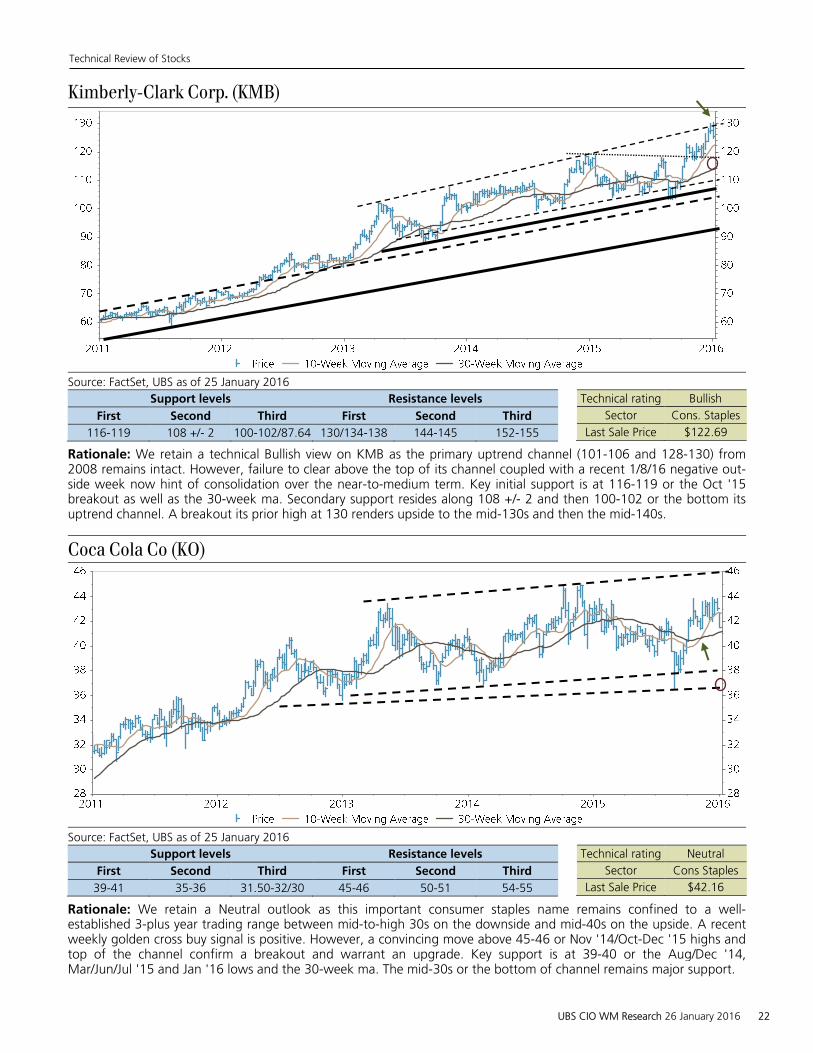

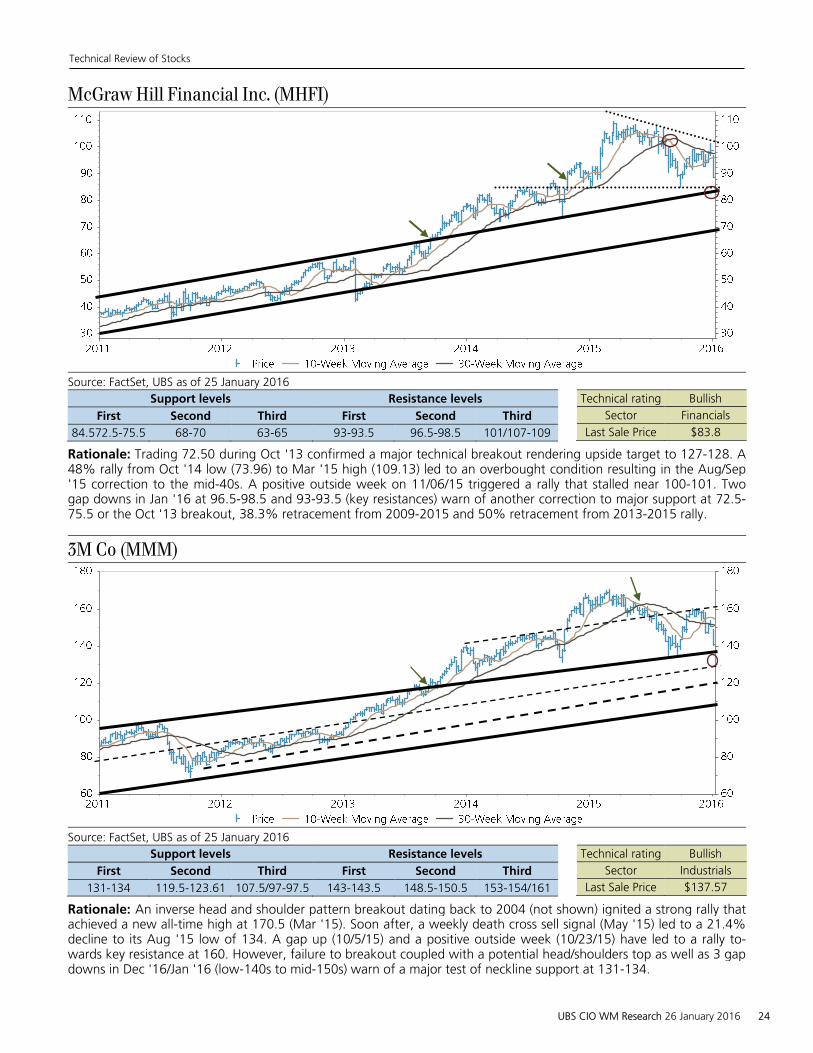
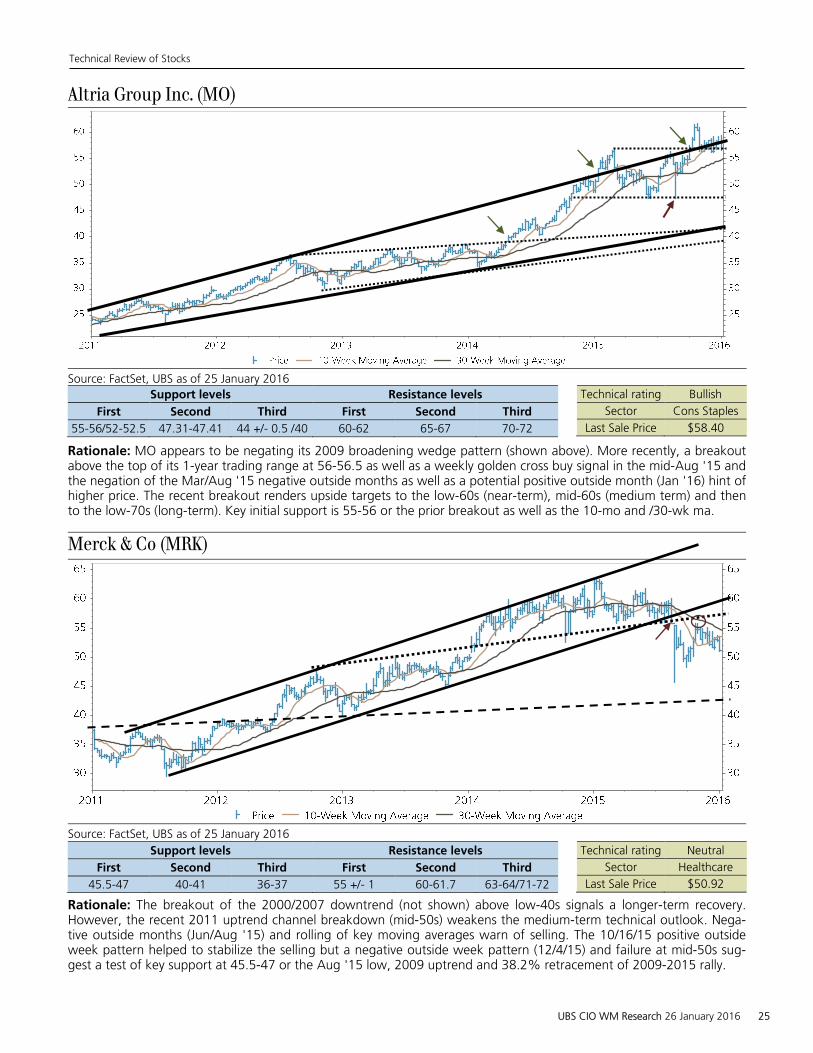


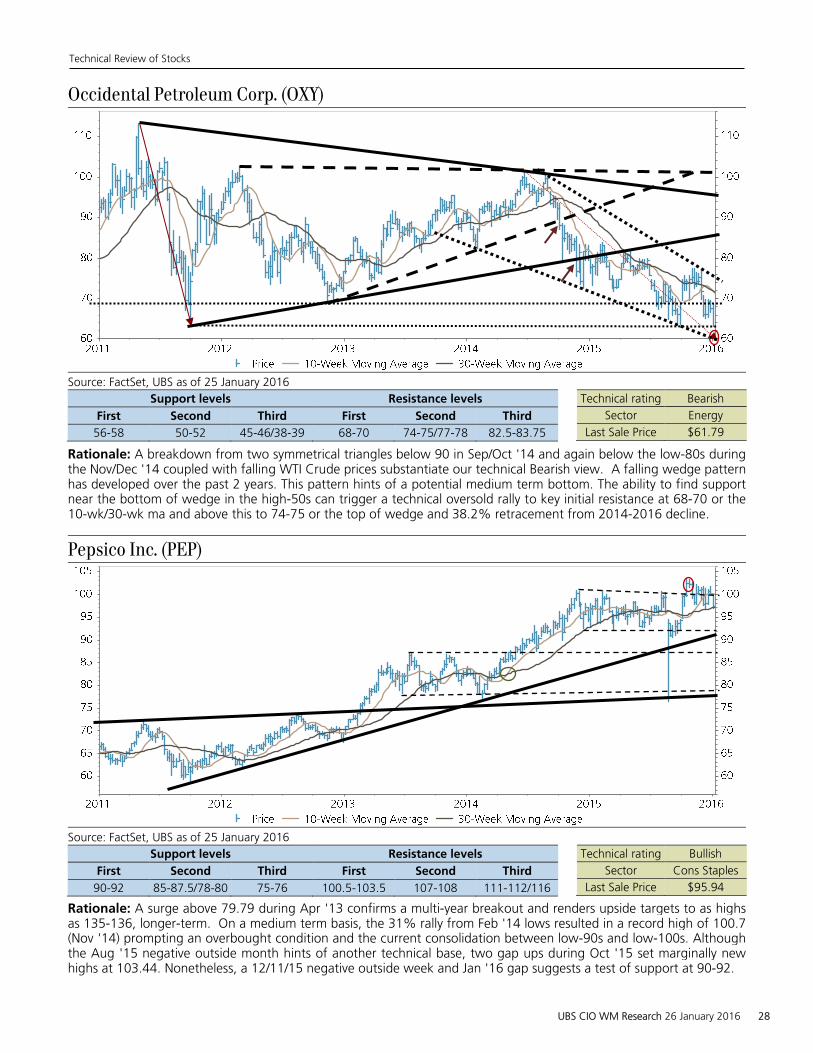
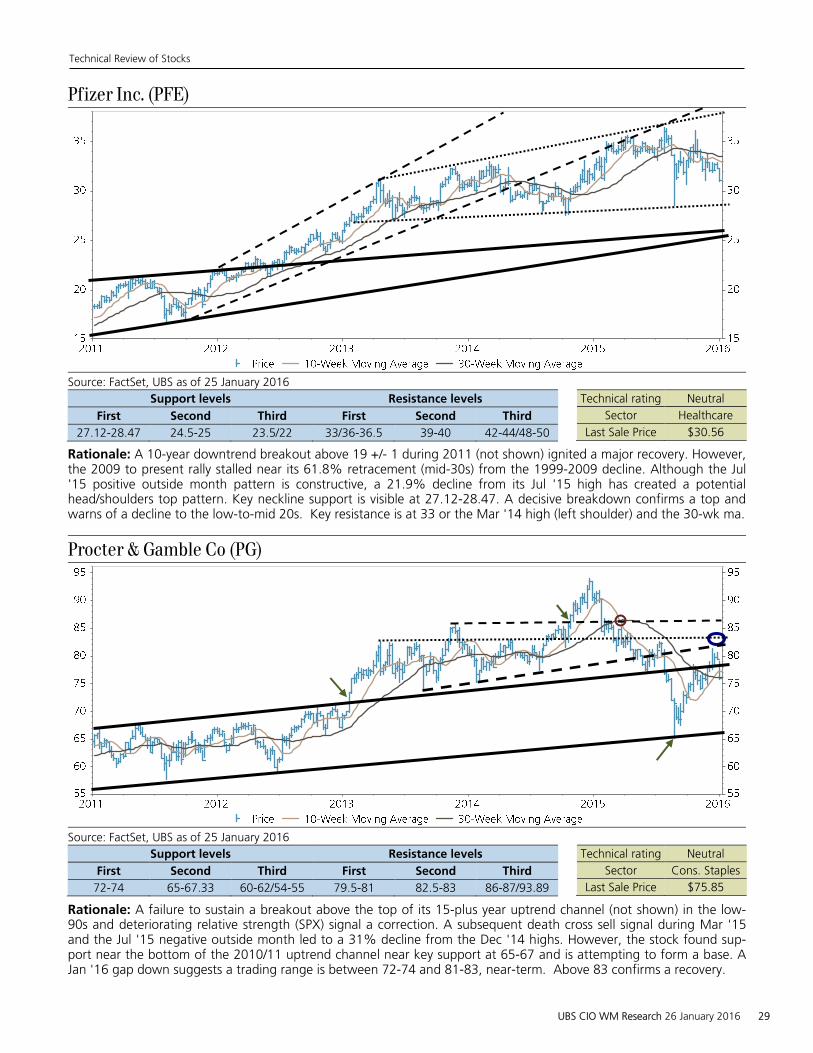
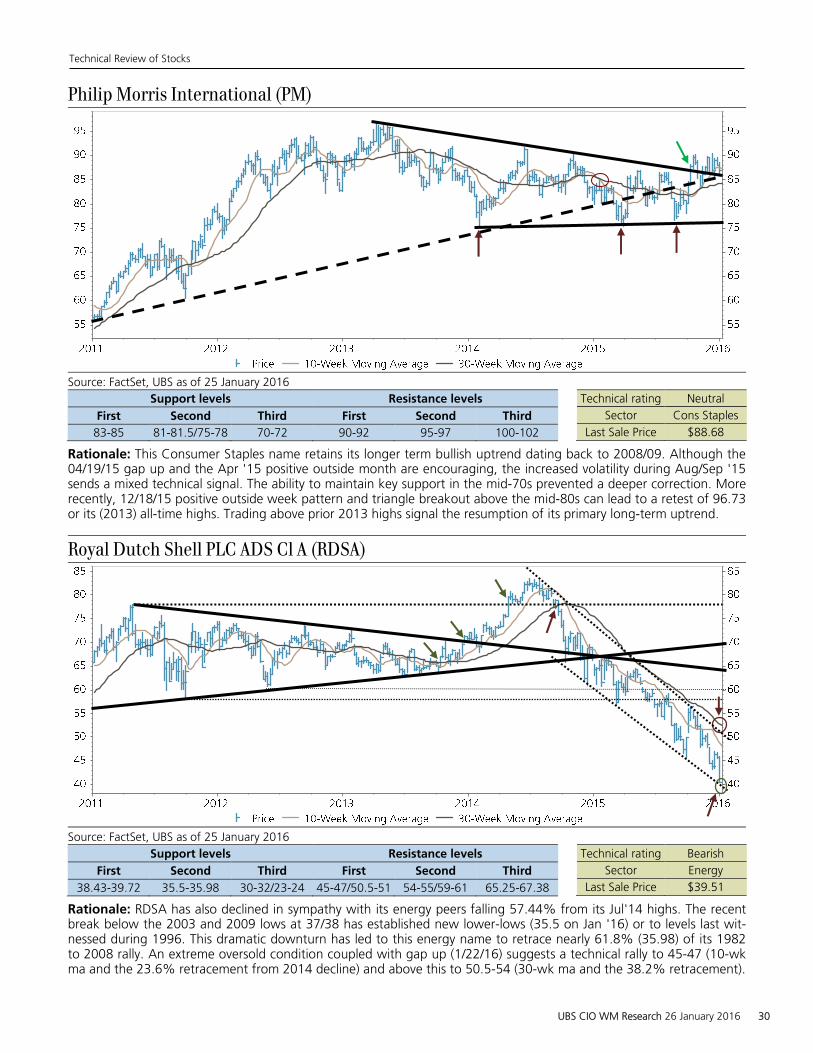
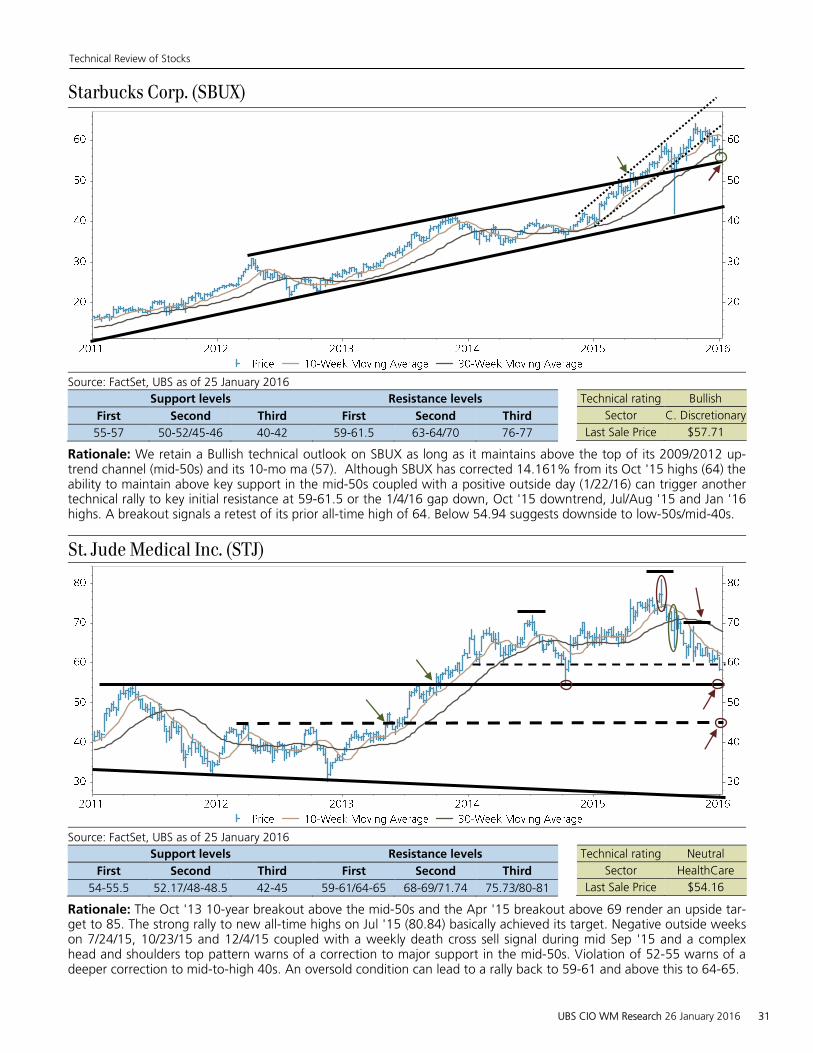

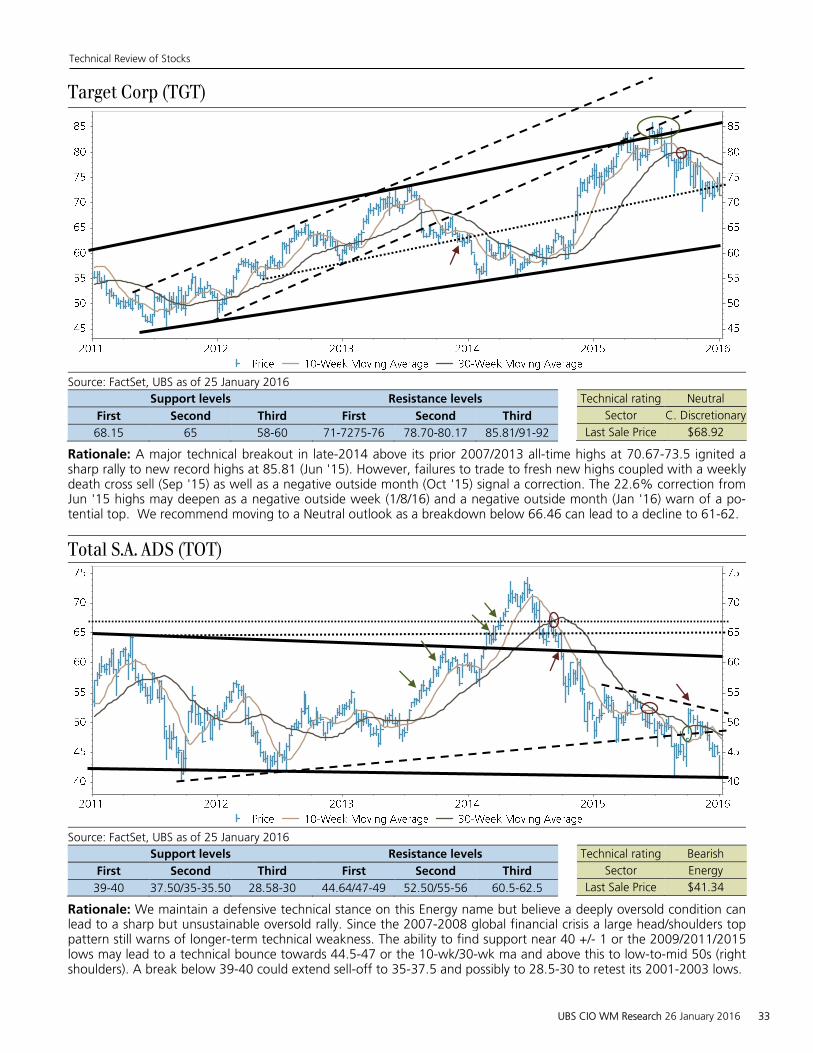

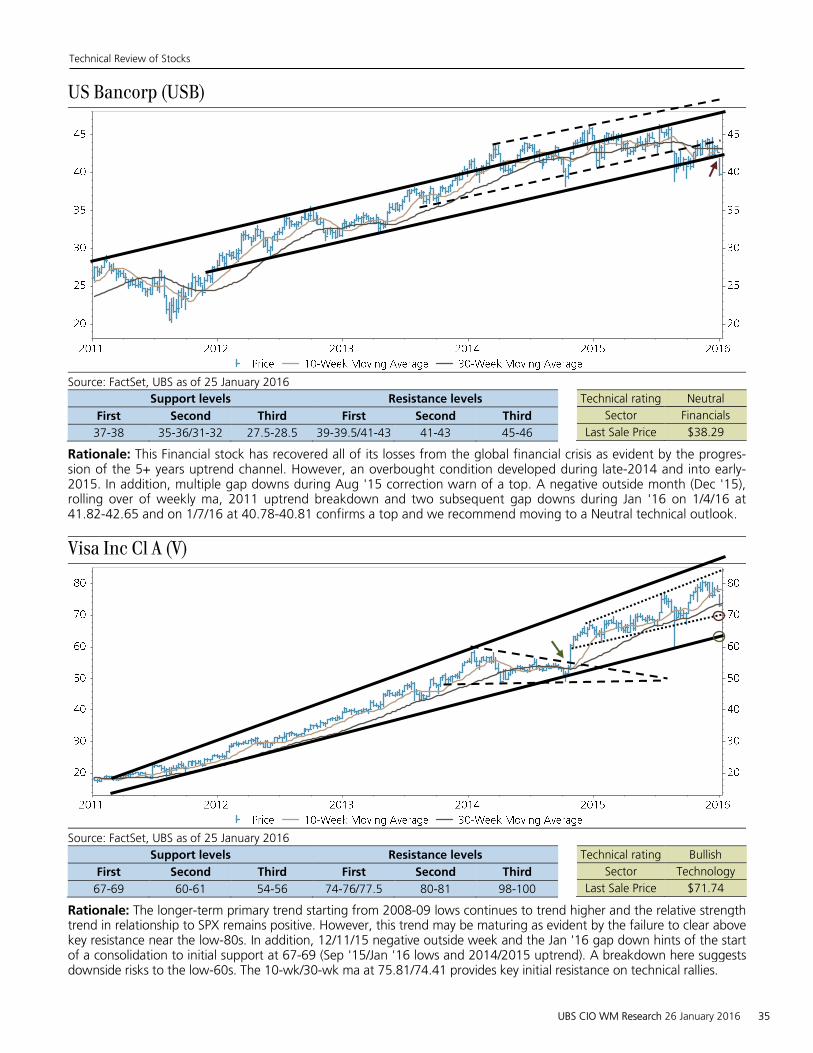

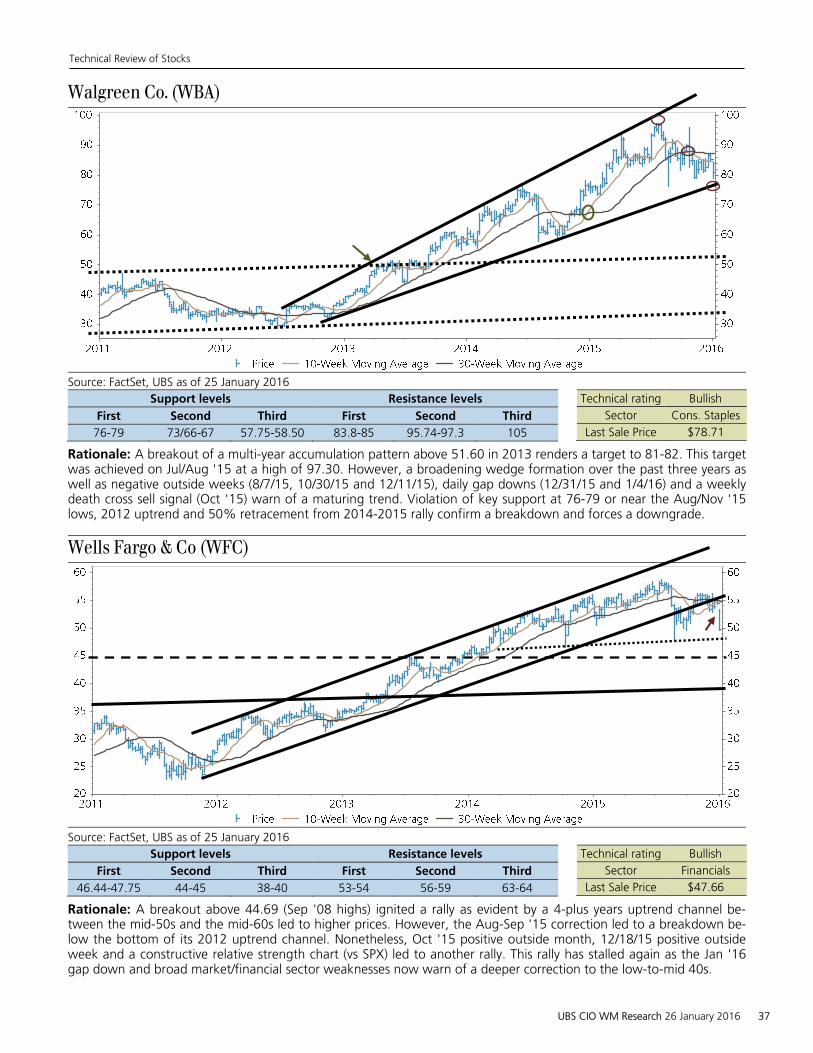


![arXiv:1510.05118v2 [q-fin.ST] 4 Jul 2016 · slb wmb xom exc aig all axp bac bk brk.b c gs jpm ms spg usb wfc abt amgn bax bmy gild jnj lly mdt mrk pfe unh ba cat emr fdx gd ge hon](https://static.documents.pub/doc/80x56/5b79e7ad7f8b9a703b8eaabb/arxiv151005118v2-q-finst-4-jul-2016-slb-wmb-xom-exc-aig-all-axp-bac-bk.jpg)


