150
APPENDIX A: FY2005 Technical Support Document (TSD)

APPENDIX A: FY2005 Technical Support Document (TSD)

Table of Contents
A1 Introduction ............................................................................................ 1-1 A1.1 Overview of Methodology for Energy Consumption and Savings Estimates1-2 A1.2 Calculation Approach for Energy Consumption and Savings Estimates... 1-3 A1.2.1 Device Annual Energy Consumption (AEC) Estimates ............................. 1-3 A1.2.1.1 Power draw by mode, Pm ........................................................................... 1-4 A1.2.1.2 Annual Usage, Tm....................................................................................... 1-4 A1.2.1.3 Product Installed Base, S........................................................................... 1-5 A1.2.2 Cumulative Energy Savings Estimates....................................................... 1-5 A2 Cooking Products – Gas & Electric Ranges (Ovens and Cooktops) and Microwave Ovens....................................................................................................... 2-1 A2.1 Background................................................................................................ 2-1 A2.2 Product Technology Description and Market Presence............................. 2-2 A2.3 Test Procedure Status................................................................................. 2-5 A2.4 Energy Savings Estimates and Calculations .............................................. 2-5 A2.5 Regulatory Actions and Cumulative Burdens............................................ 2-6 A2.6 Issues Impacting Potential Energy Efficiency Standards .......................... 2-6 A3 Direct Heating Equipment, Gas............................................................. 3-1 A3.1 Background................................................................................................ 3-1 A3.2 Product Technology Description and Market Presence............................. 3-2 A3.3 Test Procedure Status................................................................................. 3-4 A3.4 Energy Savings Estimates and Calculations .............................................. 3-4 A3.5 Regulatory Actions and Cumulative Burdens............................................ 3-5 A3.6 Issues Impacting Potential Energy Efficiency Standards .......................... 3-5 A4 Dishwashers (Residential)..................................................................... 4-1 A4.1 Background................................................................................................ 4-1 A4.2 Product Technology Descriptions and Market Presence ........................... 4-1 A4.3 Test Procedure Status................................................................................. 4-2 A4.4 Energy Savings Estimates and Calculations .............................................. 4-3 A4.5 Regulatory Actions and Cumulative Burden ............................................. 4-4 A4.6 Issues Impacting Potential Energy Efficiency Standards .......................... 4-4 A5 Electric Motors, 1-200 HP ...................................................................... 5-1 A5.1 Background................................................................................................ 5-1 A5.2 Product Technology Descriptions and Market Presence ........................... 5-2 A5.2.1 Motor Types ............................................................................................... 5-2 A5.2.2 Motor Design Efficiency Measures............................................................ 5-3 A5.2.3 Regulations and Voluntary Energy Efficiency Programs.......................... 5-3 A5.3 Test Procedure Status................................................................................. 5-6 A5.4 Energy Savings Estimates and Calculations .............................................. 5-7 A5.5 Regulatory Actions and Cumulative Burden ............................................. 5-9 A5.6 Issues Impacting Potential Energy Efficiency Standards .......................... 5-9 A6 Pool Heaters, Gas................................................................................... 6-1 A6.1 Background................................................................................................ 6-1 A6.2 Product Technology Description and Market Presence............................. 6-1 A6.3 Test Procedure Status................................................................................. 6-2 A6.4 Energy Savings Estimates and Calculations .............................................. 6-2 A6.5 Regulatory Actions and Cumulative Burdens............................................ 6-3 A6.6 Issues Impacting Potential Energy Efficiency Standards .......................... 6-3
i

Table of Contents (continued)
A7 Refrigerators and Refrigerator-Freezers, Freezers, and Compact Refrigerators 7-1 A7.1 Background................................................................................................ 7-1 A7.2 Product Technology Description and Market Presence............................. 7-2 A7.3 Test Procedure Status................................................................................. 7-5 A7.4 Energy Savings Estimates and Calculations .............................................. 7-7 A7.5 Regulatory Actions and Cumulative Burden ............................................. 7-8 A7.6 Issues Impacting Potential Energy Efficiency Standards .......................... 7-8 A8 Room Air Conditioners .......................................................................... 8-1 A8.1 Background................................................................................................ 8-1 A8.2 Product Technology Description and Market Presence............................. 8-2 A8.3 Test Procedure Status................................................................................. 8-4 A8.4 Energy Savings Estimates and Calculations .............................................. 8-4 A8.5 Regulatory Actions and Cumulative Burden ............................................. 8-5 A8.6 Issues Impacting Potential Energy Efficiency Standards .......................... 8-5 A9 Battery Chargers / External Power Supplies ....................................... 9-1 A9.1 Background................................................................................................ 9-1 A9.2 Product Technology Description and Market Presence............................. 9-2 A9.3 Test Procedure Status................................................................................. 9-4 A9.4 Pending Energy Legislation....................................................................... 9-4 A9.5 International Test Procedures .................................................................... 9-5 A9.6 Energy Savings Estimates and Calculations .............................................. 9-5 A9.7 Issues Impacting Potential Energy Efficiency Standards .......................... 9-6 A10 Beverage Merchandisers and Beverage Vending Machines............ 10-1 A10.1 Background.............................................................................................. 10-1 A10.2 Test Procedure Status............................................................................... 10-2 A10.2.1 Vending Machines.................................................................................... 10-2 A10.2.2 Beverage Merchandisers ......................................................................... 10-3 A10.3 Energy Savings Estimates and Calculations, and Technology Description and Market Presence........................................................................................................... 10-4 A10.4 Regulatory Action.................................................................................... 10-7 A10.5 Issues Impacting Potential Energy Efficiency Standards ........................ 10-7 A11 Ceiling Fans .......................................................................................... 11-1 A11.1 Background.............................................................................................. 11-1 A11.2 Product Technology Description and Market Presence........................... 11-1 A11.3 Test Procedure Status............................................................................... 11-3 A11.4 Energy Savings Estimates and Calculations ............................................ 11-5 A11.5 Regulatory Actions and Cumulative Burden ........................................... 11-6 A11.6 Issues Impacting Potential Energy Efficiency Standards ........................ 11-6 A12 Commercial Reach-In Refrigerators, Freezers, and Refrigerator-Freezers 12-1 A12.1 Background.............................................................................................. 12-1 A12.2 Test Procedure Status............................................................................... 12-2 A12.3 Energy Savings Estimates and Calculations, and Technology Description and Market Presence........................................................................................................... 12-5 A12.4 Regulatory Action.................................................................................. 12-10 A12.5 Issues Impacting Potential Energy Efficiency Standards ...................... 12-11 A13 Gas Unit Heaters / Gas Duct Furnaces............................................... 13-1
ii

Table of Contents (continued)
A13.1 Background.............................................................................................. 13-1 A13.2 Product Technology Descriptions and Market Information .................... 13-1 A13.2.1 Gas Unit Heaters ..................................................................................... 13-1 A13.2.2 Gas Duct Furnaces .................................................................................. 13-2 A13.3 Test Procedure Status............................................................................... 13-3 A13.4 Energy Savings Estimates and Calculations ............................................ 13-4 A13.5 Regulatory Actions and Cumulative Burden ........................................... 13-5 A13.6 Issues Impacting Potential Energy Efficiency Standards ........................ 13-5 A14 Illuminated Exit Signs .......................................................................... 14-1 A14.1 Background.............................................................................................. 14-1 A14.2 Product Technology Descriptions and Market Presence ......................... 14-1 A14.3 Test Procedure Status............................................................................... 14-2 A14.4 Energy Savings Estimates and Calculations ............................................ 14-3 A14.5 Regulatory Actions and Cumulative Burden ........................................... 14-4 A14.6 Issues Impacting Potential Energy Efficiency Standards ........................ 14-4 A15 Lamps, Incandescent Reflector – ER/BR ........................................... 15-1 A15.1 Background.............................................................................................. 15-1 A15.2 Product Technology Descriptions and Market Presence ......................... 15-1 A15.3 Test Procedure Status............................................................................... 15-2 A15.4 Energy Savings Estimates and Calculations ............................................ 15-3 A15.5 Regulatory Actions and Cumulative Burden ........................................... 15-4 A15.6 Issues Impacting Potential Energy Efficiency Standards ........................ 15-5 A16 Large Unitary Air Conditioners (≥ 240 kBtu/hr) ................................. 16-1 A16.1 Background.............................................................................................. 16-1 A16.2 Product Technology Descriptions and Market Presence ......................... 16-2 A16.3 Test Procedure Status............................................................................... 16-4 A16.4 Energy Savings Estimates and Calculations ............................................ 16-5 A16.5 Regulatory Actions and Cumulative Burden ........................................... 16-5 A16.6 Issues Impacting Potential Energy Efficiency Standards ........................ 16-6 A17 Residential Furnace Fans.................................................................... 17-1 A17.1 Background.............................................................................................. 17-1 A17.2 Product Technology Description and Market Presence........................... 17-1 A17.3 Test Procedure Status............................................................................... 17-3 A17.4 Energy Savings Estimates and Calculations ............................................ 17-3 A17.5 Regulatory Actions and Cumulative Burdens.......................................... 17-4 A17.6 Issues Impacting Potential Energy Efficiency Standards ........................ 17-4 A18 Torchieres ............................................................................................. 18-1 A18.1 Background.............................................................................................. 18-1 A18.2 Product Technology Descriptions and Market Presence ......................... 18-1 A18.3 Test Procedure Status............................................................................... 18-3 A18.4 Energy Savings Estimates and Calculations ............................................ 18-5 A18.5 Regulatory Actions and Cumulative Burden ........................................... 18-6 A18.6 Issues Impacting Potential Energy Efficiency Standards ........................ 18-6 A19 Traffic Signal Modules ......................................................................... 19-1 A19.1 Background.............................................................................................. 19-1 A19.2 Product Technology Descriptions and Market Presence ......................... 19-1 A19.3 Test Procedure Status............................................................................... 19-3
iii

Table of Contents (continued)
A19.4 Energy Savings Estimates and Calculations ............................................ 19-3 A19.5 Regulatory Actions and Cumulative Burden ........................................... 19-4 A19.6 Issues Impacting Potential Energy Efficiency Standards ........................ 19-5
iv

List of Figures
Figure A1-1: The Development of Product Energy Consumption and Savings Estimates .........................................1-2 Figure A1-2: AEC Calculation Methodology (from ADL, 2002)...............................................................................1-4 Figure A1-3: Energy Savings Potential Model for 2010-2035....................................................................................1-7
v

List of Tables
Table A1-1: Products Addressed in Technical Support Document.............................................................................1-1 Table A1-2: Product Priority-Setting Criteria.............................................................................................................1-2 Table A1-3: Market Dynamics not Considered in Annual Energy Consumption and Energy Savings Estimates .......1-3 Table A1-4: Usage Pattern Mode Definitions.............................................................................................................1-5 Table A1-5: Definition of Technology/Standard Levels.............................................................................................1-6 Table A2-1: Cooking Product Background Data ........................................................................................................2-2 Table A2-2: Cooking Product UEC Values ................................................................................................................2-4 Table A2-3: Cooking Product Retail Prices................................................................................................................2-5 Table A2-4: Cooking Product Potential Energy Savings and Economic Impact Estimates ........................................2-6 Table A3-1: Direct Heating Equipment Background Data .........................................................................................3-2 Table A3-2: Direct Heating Equipment Efficiency Levels and UEC Values..............................................................3-3 Table A3-3: Direct Heating Equipment Retail Prices .................................................................................................3-4 Table A3-4: Direct Heating Equipment Potential Energy Savings and Economic Impact Estimates .........................3-5 Table A4-1: Residential Dishwasher Background Data...............................................................................................4-1 Table A4-2: Residential Dishwasher Technology Levels and Energy Factor Values ..................................................4-1 Table A4-3: Residential Dishwasher Current Energy Consumption and Potential Saving Estimates..........................4-3 Table A5-1: Industrial Sector Motors, 1-200HP Background Data .............................................................................5-1 Table A5-2: Commercial Sector Motors, 1-200HP, Subject to EPAct, Background Data...........................................5-1 Table A5-3: Open Drip-Proof (ODP) Motor Full-load Efficiencies at Representative Levels (based on EPACT-1992, CEE-2001, NEMA 2001) ...............................................................................................................................................................5-5 Table A5-4: Totally Enclosed Fan-Cooled (TEFC) Motor Full-load Efficiencies at Representative Levels (based on EPACT-1992, CEE-2001, NEMA-2001) ..................................................................................................................................5-5 Table A5-5: Installed base efficiency estimates for industrial motors, 1998 (OIT-2002) ............................................5-6 Table A5-6: Installed base efficiency estimates for commercial motors, 1999 (ADL-1999).......................................5-6 Table A5-7: AEC Savings from Increasing 1-200HP EPAct Motor Efficiency Levels to NEMA Premium Levels, Industrial Motors..........................................................................................................................................................................5-8 Table A5-8: AEC Savings from Increasing 1-200HP EPAct Motor Efficiency Levels to NEMA Premium Levels, Commercial Motors..........................................................................................................................................................................5-8 Table A5-9: AEC Savings from 2010-2035 from Increasing 1-200HP EPAct Motor Efficiency Levels to NEMA Premium Levels.....................................................................................................................................................................................5-9 Table A5-A1. Annual Energy Consumption, Industrial Motors, Default scenario ....................................................5-13 Table A5-A2. Annual Energy Consumption, Industrial Motors, EPACT scenario....................................................5-13 Table A5-A3. Annual Energy Consumption, Industrial Motors, NEMA Premium scenario .....................................5-13 Table A5-A4 Savings comparison: EPACT vs. NEMA Premium, Industrial Motors................................................5-14 Table A6-1: Pool Heater Background Data ................................................................................................................6-1 Table A6-2: Pool Heater Technology Levels and UEC Values ..................................................................................6-2 Table A6-3: Pool Heater Retail Prices ........................................................................................................................6-2 Table A6-4: Pool Heater Potential Energy Savings and Economic Impact Estimates ................................................6-3 Table A7-1: Standard Refrigerator, Freezer, and Compact Refrigerator Background Data........................................7-2 Table A7-2: Standard-Size Refrigerator-Freezer Technology Levels and UEC Values .............................................7-4 Table A7-3: Freezer Technology Levels and UEC Values .........................................................................................7-4 Table A7-4: Compact Refrigerator Technology Levels and UEC Values ..................................................................7-4 Table A7-5: Standard-Size Refrigerator-Freezer Retail Prices ...................................................................................7-5 Table A7-6 Freezer Retail Prices ................................................................................................................................7-5 Table A7-7: Compact Refrigerator Retail Prices ........................................................................................................7-5 Table A7-8: Refrigerator Potential Energy and Economic Impact Estimates .............................................................7-7 Table A8-1: Room Air Conditioner Background Data ...............................................................................................8-1 Table A8-2: Room Air Conditioner Technology and UEC Values.............................................................................8-3 Table A8-3: Room Air Conditioner Retail Prices .......................................................................................................8-3 Table A8-4: Room Air Conditioner Potential Energy Savings and Economic Impact Estimates ...............................8-5 Table A9-1: Background Data on Battery Chargers and Power Supplies...................................................................9-1 Table A9-2: Battery Charger and Power Supply UECs ..............................................................................................9-3 Table A9-3: Battery Charger and Power Supply Savings Potential Estimate .............................................................9-6 Table A10-1: Installed Base Data for Vending Machines and Beverage Merchandisers..........................................10-1 Table A10-2: Vending Machines and Beverage Merchandisers - Energy Saving Potential Estimates ......................10-4 Table A11-1: Ceiling Fan Background Data.............................................................................................................11-1 Table A11-2: Ceiling Fan Lighting UEC..................................................................................................................11-1 Table A11-3: Ceiling Fan Motor UEC......................................................................................................................11-2 Table A11-4: Ceiling Fan UEC and Energy Savings Potential (Fan Energy Only) ..................................................11-5 Table A11-5: Ceiling Fan UEC and Energy Saving Potential (Lighting Only) ........................................................11-6 Table A12-1: Installed Base Data for Reach-In Freezers and Reach-In Refrigerators..............................................12-2 Table A12-2: Potential Energy Saving Estimates for Reach-In Freezers..................................................................12-5
vi

List of Tables (continued)
Table A12-3: Potential Energy Saving Estimates for Reach-In Refrigerators ..........................................................12-7 Table A12-4: Potential Energy Saving Estimates for Reach-In Refrigerator-Freezers .............................................12-9 Table A12-5: Total Savings Potential for Reach-in Freezers, Reach-in Refrigerators, and Reach-in Refrigerator-Freezers 12-10 Table A13-1: Gas Unit Heater and Duct Furnace Data.............................................................................................13-1 Table A13-2: Gas Unit Heater Efficiency.................................................................................................................13-2 Table A13-3: Gas Duct Furnace Efficiency..............................................................................................................13-3 Table A13-4: Gas Unit Heater UEC and Potential Saving Estimates .......................................................................13-4 Table A13-5: Gas Duct Furnace UEC and Potential Saving Estimates ....................................................................13-4 Table A13-A1: Gas Unit Heaters and Duct Furnaces Annual Shipments (Source: GAMA 2003) ............................13-7 Table A13-A2: Gas Unit Heaters AEC Calculation...................................................................................................13-8 Table A13-A3: Gas Duct Furnaces Load Data ..........................................................................................................13-9 Table A13-A4: Gas Duct Furnace AEC Calculation .................................................................................................13-9 Table A13-A5: Gas Unit Heaters and Duct Furnaces Savings Potential....................................................................13-9 Table A14-1: Exit Signs Background Data...............................................................................................................14-1 Table A14-2: Exit Sign Technology Levels and Wattage Values.............................................................................14-1 Table A14-3: ENERGY STAR® Requirements for Exit Signs......................................................................................14-2 Table A14-4: Exit Sign Installed Base, Wattage, and Usage Data............................................................................14-3 Table A14-5: Exit Sign AEC and Potential Energy Saving Estimates......................................................................14-4 Table A15-1: ER/BR Background Data....................................................................................................................15-1 Table A15-2: ER/BR Technology Levels and Efficacy Values ................................................................................15-2 Table A15-3: ER/BR Efficacy and Usage Data ........................................................................................................15-3 Table A15-4: ER/BR AEC and Potential Energy Saving Estimates .........................................................................15-4 Table A15-5: Incandescent Reflector Lamps............................................................................................................15-4 Table A16-1: Large Unitary ($240kBtu/hour) Background Data for Major Unit Classes.........................................16-1 Table A16-2: Large Unitary Air Conditioner Technology levels and UEC Values...................................................16-2 Table A16-3: Energy Efficiency Levels - Standards and Voluntary Efficiency Programs for Electrically Operated Air-Cooled Air-Conditioners and Heat-Pumps (in Cooling Mode Only) .....................................................................................16-3 Table A16-4: Minimum External Static Pressure for Testing Unitary Products (from ARI 2000) ............................16-4 Table A16-5: Energy Savings Potential Associated with Various Efficiency Improvements ...................................16-5 Table A17-1: Residential Furnace Fan Background Data.........................................................................................17-1 Table A17-2: Residential Furnace Fan Technology Levels and UEC Values...........................................................17-2 Table A17-3: Residential Furnace Fan Retail Prices ................................................................................................17-2 Table A17-4: Residential Furnace Fan Potential Energy Savings and Economic Impact Estimates.........................17-4 Table A18-1: Torchiere Background Data................................................................................................................18-1 Table A18-2: Torchiere Technology Levels and Wattage Values ............................................................................18-2 Table A18-3: ENERGY STAR® Requirements for Indoor Lights............................................................................18-3 Table A18-4: Torchiere Wattage and Usage Data ....................................................................................................18-5 Table A18-5: Torchieres AEC and Potential Energy Saving Estimates....................................................................18-6 Table A19-1: Traffic Signals Background Data........................................................................................................19-1 Table A19-2: Traffic Signal Technology Levels and Wattage Values......................................................................19-2 Table A19-3: Energy-Efficiency Criteria for ENERGY STAR® Qualified Traffic Signal Modules .............................19-2 Table A19-4: Traffic Signals Installed Base, Wattage, and Usage Data....................................................................19-3 Table A19-5: Traffic Signals Sign AEC and Potential Energy Saving Estimates.....................................................19-4 Table A19-6: California Energy Efficiency Standards for Traffic Signal Modules ..................................................19-4
vii

A1 Introduction
The primary goal of this Technical Support Document (TSD) is to explain the derivation of energy consumption and savings estimates for the products listed in Table A1-1. This TSD updates segments of the analysis contained in the FY2003 priority-setting TSD and also includes analysis for products not contained in the FY2003 TSD. In anticipation of the possible passage of new federal energy legislation in 2004, the Department decided to prepare data sheets for products identified in the draft legislation. Should legislation be enacted, these products could be prioritized along with the products already in the Appliance Standards Program (or in the coverage process).
Table A1-1: Products Addressed in Technical Support Document
Existing Products Products in Coverage and/or Pending Legislation
Other, Previously Unevaluated Products
Cooking Products – Gas & Electric Ranges (Ovens and Cooktops) and Microwave Ovens
Battery Chargers / External Power Supplies
Large Unitary Air Conditioners (≥ 240 kBtu/hr)
Direct Heating Equipment, Gas Beverage Merchandisers and Beverage Vending Machines
*Dishwashers (Residential) Ceiling Fans Electric Motors, 1-200 HP Commercial Reach-in Refrigerators,
Freezers, and Refrigerator-Freezers
Pool Heaters, Gas Gas Unit Heaters / Gas Duct Furnaces
Refrigerators and Refrigerator-Freezers, Freezers, and Compact Refrigerators
Illuminated Exit Signs
Room Air Conditioners Lamps, Incandescent Reflector – ER/BR
Residential Furnace Fans Torchieres Traffic Signal Modules * Update to FY2003 Technical Support Document. In addition, this TSD provides product-specific information relating to the priority setting criteria shown in Table A1-2. These criteria are considered in varying degrees in setting the proposed priorities.
1-1

Table A1-2: Product Priority-Setting Criteria
Criteria Energy savings potential Potential economic benefits / burdens Potential environmental or energy security benefits Applicable deadlines for rulemakings Incremental DOE resources required to complete rulemaking process Evidence of market-driven or voluntary efficiency improvements Status of required changes to test procedures Impact of potential regulation on product innovation Fuel neutrality Impact on peak demand for electricity Impact of potential regulation on small businesses Cumulative regulative burden on products, related products manufactured by the same manufacturers
Sections A1.1 and A1.2 provide an explanation of the general methodology used to calculate energy consumption and savings for most products. Sections A2 through A19 provide product-specific information for each product listed in Table A1-1.
A1.1 Overview of Methodology for Energy Consumption and Savings Estimates
The energy consumption and savings estimates presented in Sections A2 through A19 share three common and general steps: data collection, critical evaluation of data, and the development of energy consumption and savings estimates (Figure A1-1).
Data Collection
Critical Evaluation of Data
Development of Energy Consumption and Savings Estimates
The Department accessed the most complete and current information available for each eva y
Figure A1-1: The Development of Product Energy Consumption and Savings Estimates
luated product. If possible, the products’ Annual Energy Consumption (AEC) and Energ
1-2

Savings Potential calculations are based upon data from previous detailed studies. “Bottom-up” ul in reakdown
ergy consumption (e.g., by usage mode) ions. f loped from a
ne urces, and
AEC and energy savings estim everal market dynamics that ould impact future energy consumption or savings (see Table A1-3).
timates
engineering analyses are particularly usefof en
this process, as they provide a detailed b, which improves the energy savings calculatound, the energy estimates were dIn cases where detailed studies could not be
range of sources including: prior building eindustry contacts.
evergy consumption reports, industry data so
In general, the ates do not address sw
Table A1-3: Market Dynamics not Considered in Annual Energy Consumption and Energy Savings Es
Market Dynamic Example Future increases or decreases in device installed Pool Heaters, Gas - The market’s preference for
may lead to a decrease in base solar pool heating devicesthe installed base of gas pool heaters.
Future market penetration of technologies without regulatory actions
Traffic Signal Modules - LED traffic signal modules are displacing incandescent modules in the absence of regulatory actions.
Future evolution of products, including additional product features
Smart Appliances - Refrigerators equipped with flat screen televisions.
A1.2 alculation Approach for Energy Consumption and Savings Estimates
1.2.1 Device Annual Energy Consumption (AEC) Estimates e
he un EC) denotes the energy consumed by an average device over the course of a year. The UEC equals the sum of the products of the power draw in
UEC = UECm = Pm * Tm
An estimate of the stock of the device, S (or installed base), was obtained or developed. The product of the installed base and the device UEC equals the total annual energy consumption, AEC, for a particular product:
AEC = S * UEC
C
AFigure A1-2 illustrates the basic methodology used to develop the annual energy consumption(AEC) estimates for a device or product. Deviations from this methodology are explained in thproduct-specific sections. T it energy (or electricity) consumption (U
each mode, Pm, and the approximate number of hours, Tm, that each device operates in a particular mode, m, in the course of one year:
Σ Σ
1-3

Devices and products can operate in up to four different modes: active, standby, suspended or sleep, and off. For example, as shown in Figure A1-2, there are four UECm, summing to the device UEC. Figure A1-2 illustrates the expanded model for devices that operate in all four modes. This figure can be adapted and applied to products that operate in fewer modes (e.g., active and off only).
UECUEC AECAECMM
Stock
Device Annual Electricity ConsumptionTTactiveactive PPactiveactive
TTsleepsleep PPsleepsleep
TToffoff PPoffoff
Active
Sleep
UsageMode
Annual Usage,by Mode
Power, by Mode
x
x
x=
Device Annual Unit Electricity Consumption,
by Mode
=
=SS
UECUECactiveactive
= UECUECsleepsleep
=xOff UECUECoffoff
Device Unit Electricity
Consumption
TTstandbystandby PPstandbystandbyStandby x = UECUECstandbystandby
For devices powered by electricity, electric energy can be converted to primary energy via the
of er
r studies.
Moreover, whenever possible, the power draw levels reflect actual power draw measurements for osed to the device rated power draw. Rated power draws
he
The device usage pattern refers to the number of hours per week that, on average, a device ope energy consumption model uses up to four typical
Figure A1-2: AEC Calculation Methodology (from ADL, 2002)
factor of 10,958 Btu/kWh (BTS, 2000). The following sub-sections describe the general approach used to develop values for Pm, Tm, andS.
A1.2.1.1 Power draw by mode, Pm
Energy consumption estimates for a given product incorporate power draw data for each mode operation. It is assumed that for a given product in a given mode, there is no variation in powdraw. The power draw by mode, Pm, is based on industry data o
the ‘active’ power draw, as opprepresent the maximum power that the device’s power supply can handle and do not equal tactual power draw. The improper use of rated power draws to estimate energy consumption usually leads to gross over-estimation of energy consumption.
A1.2.1.2 Annual Usage, Tm
rates in a given mode. In general, the
1-4

usa es (see Table A1-4) and different devices may have different combinations of these modes. For example, computer monitors, powered by external power supplies (see Section A9), o in all ning exit just one mode - active. The annual usage, T , in each mode is e lated from the weekly usage.
Table A1-4: Definitions
ge mod
perate four modes, while functio signs (see Section A14) have m xtrapo
Usage Pattern Mode
Mode Type
Description Example
Active Device carrying out intended operation.
onitor displays image. Computer m
Stand-by intended operation. ver.
Device ready to, but not, carrying out Computer monitor displays screen sa
Suspended Device not ready to carry out intended Computer monitor powered down, but or Sleep operation, but on. turned on.
Off Device not turned on but plugged in. Computer monitor off, but plugged in.
Usage data are extracted from studies and/or surveys where researchers have monitored and recorded the usage pattern in a building for a period of time, ranging from days to several weeks.
A1.2.1.3 Product Installed Base, S
The installed base, S, of a device denotes the number of devices in use in commercial buildings, on of these, depending on which segment is
d y
A1.2.2 Cumulative Energy Savings Estimates Using the above methodology, estimates of the AEC for representative technology levels such as “current new,” “typical new,” and the “best available” products are made. AEC estimates may also be made at potential standard levels other than “typical new” and “best available.” Definitions of these technology/standard levels are provided in Table A1-5.
industries, residential buildings etc., or a combinatiunder investigation. When available, the stock estimates come from other studies (e.g., industry market reports). However, many commercial stock estimates come from historical sales data anaverage product lifetimes, simply by summing the sales data from the past y years, whereequals the average product lifetime.
1-5

Table A1-5: Definition of Technology/Standard Levels
AEC Estimates Explanation Example Current Device Based on the product most
representative of the installed base (stock).
Traffic signal modules with incandescent lamps.
Typical new Based on the product most representative of new products.
Traffic signal modules with LED lamps.
Best Available Based on the device that consumes the least amount of energy in the market.
Traffic signal modules with most efficient LED lamps available today.
The analyses in the following sections typically assume that the installed base of each product type in the standard year (e.g., 2010) does not increase from its current level. The cumulative energy savings from the standard year (e.g., 2010) to the terminal year (e.g., 2035) are calculated based on the assumption that the new technology/standard diffuses into the stock linearly over the average lifetime of the device (as illustrated in Figure A1-3). The area under the shaded portion in the graph corresponds to the estimated cumulative energy savings and is given by: Cumulative Energy Savings = (TY – SY + 1)*Annual Energy Savings – 0.5*(T*Annual Energy Savings) Where:
TY = terminal year SY = standard year T = average product lifetime
. For this approximation, the annual energy savings represents the annual energy saved by replacing the entire installed base of the product (assumed to consume energy at the “typical new” level) with product consuming energy at the new technology/standard level.
1-6

2010 20352010 + T
0
50%
100%
Perc
ent S
avin
gs p
er y
ear
Year
Figure A1-3: Energy Savings Potential Model for 2010-2035
Newly completed analysis for FY2005 uses a standard year of 2010 and a terminal year of 2035. Ideally, all data sheets would be consistent with the use of these dates. For data sheets completed in previous years that reference existing reports, the standard and terminal years vary.
1-7

A2.1 Backgr
In 19 pliance Energy Con ation Acestablishing m andards for cooking prNAECA required only that gas cooking pro having upply cord not be equipped with standing pilots. Cooking products include: (1) gas ovens, cooktops, and ranges, (2) e ns, cooktops, and ranges, and icrowave ovens. As established by DOE’s test procedure, the energy efficiency descriptor fo nergy Factor. The Energy Factor is expressed as a percent and is the ratio of the annual useful cooking energy output (i.e., the energy being conveyed to the item being cons l energy consumpti cludes th plus the energy cons such as a clock, ing pilo n system, or self-clean inimum Energy Factor requirements for cooking products, cooking products currently e not labe d for energy consumption. Updated minimum standards for cooking products were proposed in 1994 (DOE 1994). Because NAECA did not establish product classes for cooking products, DOE established the following prod posed standards: (1 tric coocooktops, smooth elements, (3) gas cooktop electric leaning, (5) electric ovens, self-cleaning, (6) gas ovens, non-sel ing, (7) lf-cleaning, and (8) microwave ovens. The individual componen f an elect range, consisting of an oven, cooktop, an icrowave oven, would have been required to m le com posed standards. DOE issue nal Rule hat mini ctric cooking products, inclu ere held out for further cons g products.
hipments, lifetime, and
A2 Cooking Products – Gas & Electric Ranges (Ovens and Cooktops) and Microwave Ovens
ound
87, the National Ap serv t (NAECA) was signed into law inimum energy efficiency st oducts (NAECA 1987).
an electrical sducts
lectric ove (3) mr cooking products is the E
cooked) to its total annual energy e cooking energyumption. The annua on in
umed by other features standir
t, electric ignitioing cycles. Because DOE does not requ e m
ar led or teste
uct classes in its pro ) elecs, (4)
ktops, coil elements, (2) electric ovens, non-self-c
f-clean gas ovens, sets o ric and gas
d occasionally a m eet the applicab in 1998 making the determination t
red for eleponent pro d a Fimum efficiency performance standards are not requiding microwave ovens (DOE 1998). Gas cooking products wideration, primarily to further assess the elimination of standing pilots for all gas cookin
Table A2-1 provides background data on the installed base, annual snational annual energy consumption of cooking products.
2-1

Table A2-1: Cooking Product Background Data
Data type Value1 Source/Comments Gas Cooking Products2
Installed Base, million 45.7 Based on historical shipments and 19 year equipment lifetime
Annual Shipments, million 2.85 (AHAM 2003)
Equipment Lifetime, years 19 (DOE 1997)
AEC, quad 0.37 Based on installed based and stock annual energy use
Electric Cooking Products2
Installed Base, million 64.1 Based on historical shipments and 19 year equipment lifetime
Annual Shipments, million 4.56 (AHAM 2003)
Equipment Lifetime, years 19 (DOE 1996)
AEC, quad 0.18 Based on installed based and stock anenergy use
nual
Microwave Ovens
Installed Base, million 102.8 Based on historical shipments and 30 year equipment lifetime
Annual Shipments, million 13.31 (AHAM 2003)
Equipment Lifetime, years 10 (DOE 1996)
AEC, quad 0.16 Based on installed based and stock annual energy use
1 Installed base, annual shipment, and AEC values are for the year 2002. 2 Represents values for Ranges. Individual Ovens and Cooktops are accounted for by treating one Oven
and one Cooktop as a single Range.
A2.2 Product Technology Description and Market Presence
Coil element electric cooktops typically consist of two six-inch (1250 watt) and two eight-inch(2100 watt) elements. Improving the contact conductance
of the elements and using reflective
urfaces are means in which to improve the efficiency of the coil elements. Neither design was
ght-
n
ts (DOE 1996).
sfound to be cost-effective by DOE (DOE 1998). Smooth element electric cooktops typically consist of two six-inch (1500 watt) and two eiinch (2000 watt) solid disk elements. Other smooth type elements include: halogen lamp, induction, and radiant types. While halogen and induction elements are both more efficient thasolid disk elements, neither were found to be cost-effective by DOE (DOE 1998). Radiant elements are actually less efficient than solid disk elemen
2-2

The efficiency of non-self-cleaning and self-cleaning electric ovens can be improved by usimproved insulation in the cabinet walls, improved door seals, reducing the vent rate and conduction losses, utilizing oven separators, utilizing forced convection, and incorporating the features of a bi-radiant design. Bi-radiant ovens were developed in the late 1970’s and had three features for reducing energy use: highly reflective cavity walls, highly absorptive finish, and lower-temperature heating elements. Although all of the above design features improve efficiency, DOE found that none were cost-effective (DOE 1998). Microwave ovens can be improved through the use of more efficient power supplies, fans, magnetrons, and reflective surfaces. But like conventional electric ovens, DOE found that none of the above design features for microwave ovens were cost-effective (DOE 1998).
ing:
as cooktops typically consist of four open 9000 Btu/hr burners. Efficiency can be improved through th aces, and thermostatic burners. DOE determined that t-effective for consumers (i.e., the designs resulted in increased consumer life-cycle costs) (DOE 1996). With the exception of the bi-radiant design, all design features available to improve the efficiency of electric ovens can also be used t prove the e iency -cleaning and self-cleaning ovens gas ovens. But DOE found none of these design f gas ovens to be cost-effective (i.e., the designs resulted in increased consumer life-cy For gas cooking products, only the removal of standing pilot ignition systems through the use of electric or electronic ignition systems seem to ost-effect Stan stems are only utilized by gas cooktops, ovens, and ranges without electrical cords. Note that because self-cleaning gas ovens and ranges require electricity to operate, all are required by NAECA to use non- s. Because gas cooking products without power cords do not require electricity to operate, the incorporation of an ric or elec c ignition device requires electrical service to be brought to the unit. As a result, costs associated with the installation of elec ed by consumers that do not have electrical outlets already in thei nition system y, if electr tricity is used by the app ction in gas co park ignit
DOE analysis demonstrated that electric and electronic ignition systems are cost-effective for
Ge use of sealed burners, reflective surf
all of the above designs are not cos
o im ffic of non-selfeatures for cle costs) (DOE 1996).
be c ive. ding pilot sy
standing pilot systemelect troni
trical service would be incurrr kitchens. In addition, based on data from the mid-1990’s, electronic or electric ig
s also incur greater maintenance costs than standing pilot systems (DOE 1997). Finallic-based ignition systems are used, a significant amount of elec
liance to operate the hot surface ignition device, thereby partially offsetting the redunsumption realized by eliminating the pilot. Electronic ignition systems utilizing srs consume negligible amounts of electrical energy. e
Athose consumers that do not require the installation of an electrical outlet. For consumers that need to install an electrical outlet, only electronic ignition systems in gas ranges are cost-effective (DOE 1997). But the same DOE analysis demonstrated that, based on historical shipment trends, only 25 percent of consumers in 2010 will still utilize gas cooking products with standing pilot systems. Thus, the national energy savings realized from requiring electric or electronic ignition systems are estimated to be minimal.
2-3

Table A2-2 summarizes the UECs corresponding to various efficiency levels for cooking products. The UEC data in Table A2-2 are based on analyses performed by DOE (DOE 1996; DOE 1997). The gas cooking product UECs in Tabl e verage values taking into account the market share of non clea n n s well as the market shar c n Bas ist arket share data g ranges each are assum pt ercent of the m nt of non-self-cleaning ranges are assumed to use electric or electronic ignition systems (DOE 1997). The electric cooking products UECs taking into account the ma shares of coil-type and smcleaning and self-cleaning ovens. Based on historical ma hare data, coil-type cooktops are assu e 85 percent of the electric coo aof the electric range market is compri of se aning its (DOE 97).
Table A2-2: Cooking Prod C Valu
e A2-2 are wd self-clea
ighted-aing ranges a-self- ning a
e of products with, gas non-self-cle
electric andaning and sel
electronif-cleanin
ignitio devices. ed on hed to ca
orical mure 50 p
arket while 75 perceare weighted-average values
rket ooth-type cooktops and non-self-rket s
med to captur ktop mlf-cle
rket while it is assum un
ed that 73 percent sed 19
uct UE es
Technology Level UEC
(MMBtu/yr) UEC
(kWh/yr) Source Gas Cooking Products1
Baseline 3.2 33 E 19(DO 97)
Electronic or Electric Ign 33 E 19ition 2.8 (DO 97)
Design Option Combinations 2.4 53 (DOE 1996) 2
Electric Cooking Products1
Baseline NA 530 (DOE 1996)
Design Option Combinations3 NA 420 (DOE 1996)
Microwave Ovens
Baseline NA 143 (DOE 1996)
Design Option Combinations4 NA 132 (DOE 1996) 1 Represents the UEC for ranges.
2 Design options include: Gas cooktops – electronic ignition, sealed burners, reflective surfaces, thermostatic burners; Gas ovens –electronic ignition, improved insulation, improved door seals, forced convection, reduced vent rate, reduced conduction losses, oven separator.
3 Design options include: Electric cooktops – improved contact conductance, reflective surfaces, induction element; Electric ovens – improved insulation, improved door seals, forced convection, re bi-radiant design.
4 Design options include: more efficient power supply, fan, magnetron and reflective surfaces.
A2-2.
cts (DOE
duced vent rate, reduced conduction losses, oven separator,
Table A2-3 provides retail price information corresponding to the UECs specified in TableTable A2-3 also includes the installation and annual maintenance costs for gas cooking products. Baseline price data were provided by the 2003 AHAM Fact Book (AHAM 2003). Retail prices are generated for more efficient products from the percentage price increases indicated by theprice versus efficiency relationship in DOE’s 1996 and 1997 analyses on cooking produ1996; DOE 1997).
2-4

Table A2-3: Cooking Product Retail Prices
Technology Level UEC
(MMBtu/yr) UEC
(kWh/yr)
Retail Installation Annual Maintenance Price
($2002)Price1
($2002) Cost1
($2002) Source Gas Cooking Products
Baseline 3.2 $5 NA A33 13 N (AHAM 2003)
Electronic or Electric Ignition 2.8 33 $516 $2 $1 (DOE 1997)
Design Option $69 $2 $1 (DOE 6) Combinations 2.4 53 8 199
Electric Cooking Products
Baseline NA 530 $508 NA NA (AHAM 2003)
Design Option $76 NA NA (D 6) Combinations NA 420 6 OE 199
Microwave Ovens
Baseline NA $14 NA NA (AH 2003) 143 5 AM
Design Option NA 13Combinations $19 NA NA (DOE 6) 2 6 199
1 Installation and maintenance costs are increased costs relative to the baseline and represent the weighted-average cost to consumers taking into account the percentage of consumers that already have electrical outlets (DOE 1997).
The Department adopted a Final Rule of the test procedure for cooking products on October 3,
pecified in Table A2-
umer
Information Administration’s Annual Energy Outlook 2004 (DOE 2004). Consumer national equipment cost increases are derived by taking the per unit change in equipment cost and multiplying it by the annual shipments. Cumulative bill savings and equipment cost increases are
A2.3 Test Procedure Status
1997 (DOE 1997a).
A2.4 Energy Savings Estimates and Calculations
able A2-4 presents the energy savings potential for the efficiency levels sT
2. Also provided in Table A2-4 is the economic benefit or burden to consumers for each efficiency level. Note that none of the efficiency levels with the exception of electric or electronic ignition for gas cooking products result in economic benefits to consumers. Consnational utility bill savings for a given year are derived by taking the national annual energy savings and multiplying it by the corresponding electricity price from the DOE-Energy
2-5

summed over the time period 2010-2035 with the net benefit or burden being the difference between the two values.1
Table A2-4: Cooking Product Potential Energy Savings and Economic Impact Estimates
Technology
UEC (MMBtu/yr)
UEC (kWh/yr)
Energy Saving Potential, 2010-2035
(quads)
Potential Economic Benefits/Burdens;
Cumulative NPV 2010-2035 (billions of $2002)
Gas Cooking Products Baseline 3.2 33 NA NA
Electronic or Electric Ignition 2.8 33 0.44 0.57
Design Option Combinations 2.4 53 0.65 -3.10 Electric Cooking Products Baseline NA 530 NA NA
Design Option Combinations NA 420 1.66 -5.71 Microwave Ovens Baseline NA 143 NA NA
Design Option Combinations NA 132 0.32 -4.66
A2.5 Regulatory Actions and Cumulative Burdens
In the Fiscal Year 2004 Priority-Setting memorandum, cooking products were listed as a low-priority product (DOE 2003). No significant changes have occurred since then.
A2.6 Issues Impacting Potential Energy Efficiency Standards
As noted earlier, historical shipment trends indicate that gas cooking products may eventually phase-out the use of standing pilot ignition systems. Thus, the moderate national energy savings currently estimated may be significantly diminished in the near future. Also with respect to gas ignition systems, the maintenance costs associated with the electronic ignition system assumed for this analysis (based on mid-1990’s data) may no longer be representative of electronic devices currently being used. Because manufacturers have had additional years to improve the reliability of electronic ignition systems since the mid-1990’s, the
1 Economic calculations are performed with a spreadsheet tool which is available on the DOE Building Technologies Program, Appliances and Commercial Equipment Standards web site. http://www.eere.energy.gov/buildings/appliance_standards/docs/fy05_priority_setting_spreadsheets.zip
2-6

maintenance costs associated with these systems may be equivalent to those associated with anding pilot systems. As a result, electronic ignition systems may be more cost-effective as a st
means in which to reduce the energy use of gas cooking appliances than shown by this analysis.
2-7

2-8
ssociation of Home Appliance Manufacturers (AHAM). 2003. “Fact Book 2003.” Chicago, IL.
9
.S. Department of Energy (DOE)-Office of Conservation and Renewable Energy. 1997a.
lectric Cooking Products (Electric Cooktops, Electric Self-Cleaning Ovens, and Microwave
o.pdf
References
A National Appliance Energy Conservation Act (NAECA), 1987, Pub. L. 100-12 U.S. Department of Energy (DOE)-Office of Energy Efficiency and Renewable Energy. 1994.“Energy Conservation Program for Consumer Products; Proposed Rule.” Federal Register 5(43): 10464-10532. U.S. Department of Energy (DOE)-Office of Codes and Standards, 1996. “Draft Report on Potential Impact of Alternative Efficiency Levels for Residential Cooking Products.” Washington, DC. April, 1996. U.S. Department of Energy (DOE)-Office of Codes and Standards, 1997. “Supplemental Analysis for Cooking Products.” Washington, DC. April, 1997. U"Energy Conservation Program for Consumer Products: Test Procedures for Kitchen Ranges, Cooktop, Ovens, and Microwave Ovens." Federal Register 62 (192): 51976-51991. U.S. Department of Energy (DOE)-Office of Energy Efficiency and Renewable Energy. 1998. “Energy Conservation Program for Consumer Products: Energy Conservation Standards for EOvens); Final Rule.” Federal Register 63 (173): 48038-48057. U.S. Department of Energy (DOE)-Building Technologies Program. 2003. “Fiscal Year 2004 Priorities for the Appliance Standards Rulemaking Process.” Available online: http://www.eere.energy.gov/buildings/appliance_standards/pdfs/october_mem U.S. Department of Energy (DOE), Energy Information Administration. 2004. “Annual Energy Outlook 2004 with projections to 2025.” Washington, DC. DOE/EIA-0383(2004). January 2004.

A3.1 Backgroun
In 1987, the National Appliance Energy Conservation Act (NAECA) was signed into law establishing minimum energy efficiency standards for dir 7). Dire mprised of ga ed produoutd the condi space w f ducts. The energy effic ting equi is the A ization Efficiency (AF ly for the gas con ption of the appliance. But because over 90 percent of shipped direct heating equipment ucts cur n adequate m ormance of an overw ajority of equipment. Min standards for direct heating equipment vary based on physical configuration (i.e. wall furnaces, floor furnaces, or room heaters), inputheated air is delivered (i.e., gravity- or fan-ty ). As a r tablished 16 distinct prod Minimu ndards e from 56 to le standards for fAFU During the mid-1990’s, vented hearth products became popular and product sales grew at a rate of 20 d to provide space heat (as
pposed to being purely decorative) and their venting systems are similar to conventional direct heat equipment, existing minimum standards for direct heating equipment also apply to hearth products. Hearth products consist of vented fireplaces, fireplace inserts, stoves, and log sets.
inimum standards for direct heating equipment were proposed in 1994 but the
of
A3 Direct Heating Equipment, Gas
d
ect heating equipment (NAECA 198cts whose flue products are vented ct heating equipment is co s-fir
oors and deliver heated air to iency descriptor for direct hea
tionedpment
ithout the use onnual Fuel Util
UE), which accounts on sum prod
rently only utilize gas, the AFUE is ahelming measure of the overall perf
imum efficiency capacity, and the means in which esult, NAECA espes
uct classes for this equipment. m sta for gravity-type equipment rang 65 percent AFUE whiE.
an type equipment range from 73 to 74 percent
to 35 percent. Because these systems are at least partially useo
Updated mproposed standards were never finalized by DOE (DOE 1994). Table A3-1 provides background data on the installed base, annual shipments, lifetime, and national annual energy consumptiondirect heating equipment. Separate data sets for conventional products (wall furnaces, floor furnaces, and room heaters) and hearth products are provided in Table A3-1.
3-1

Table A3-1: Direct Heating Equipment Background Data
Data type Value1 Source/Comments Conventional Equipment
Installed Base, million (2002) 3.4 Based on historical shipments and 15 year equipment lifetime
Annual Shipments, million (2002) 0.208 (Appliance 2003)
Equipment Lifetime, years 15 (DOE 1993)
AEC, quad (2002) 0.11 energy use Based on installed based and stock annual
Hearth Products
Installed Base, million (2002) 5.4 Based on historical shipments and 30 year equipment lifetime
Annual Shipments, million (2002) 0.897 (Hearth Products Association 2004)
Equipment Lifetime, years 30 (GRI 1997)
AEC, quad (2002) 0.07 Based on installed based and stock annual energy use
1 Installed base, annual shipment, and AEC values are for the year 2002.
A3.2 Product Technology Description and Market Presence
Conventional direct heating equipment has two common characteristics: (1) heat is conveyed without ducts and (2) flue products (i.e., products of combustion) are vented outside. In conventional systems, combustion products pass through the inside of a heat exchanger. Air passes over the outside of the heat exchanger either through natural convection, as used by gravity-type units, or forced convection through the use of air-circulation fans, as used by fan-ype units. t
(2Flue products are typically either vented: (1) up though the roof utilizing B-vents or
) through-the-wall utilizing direct vents. In direct vent systems, flue products are vented throring of the vent. Co e in three basic configurations: room heaters, wall furnaces, and floor furnaces. Room d installed directly within the spac ey are heating. All room heaters are sold as gravity-type units but optional air-c ans can be installed with the units to improve efficiency. Wall furnaces are either installed on the wall as a free within the wall. A m y of wa ace ty-type units wh as fan-type units. As their name implies, fan-type wall furnaces utilize air-circ ans to force air over the h hanger in a counterf direproducts. Because counterflow air cir n greatly improves eat e n-type wall furnaces are more efficient than gravity-type units. Fl rna om the s are sold as
ravity-type units.
ugh the center of the vent while outdoor air for combustion is aspirated through the outer
nventional systems com heaters are free-stan ing and are e th
irculation f
-standing unit or recessed ajorit ll furn s are graviile some are soldulation f eat exc
culatiolow the h
ction to the flue xchange process, fa
oor fu ces are suspended fr floor of the heated space within an unconditioned crawl space. All floor furnace
g
3-2
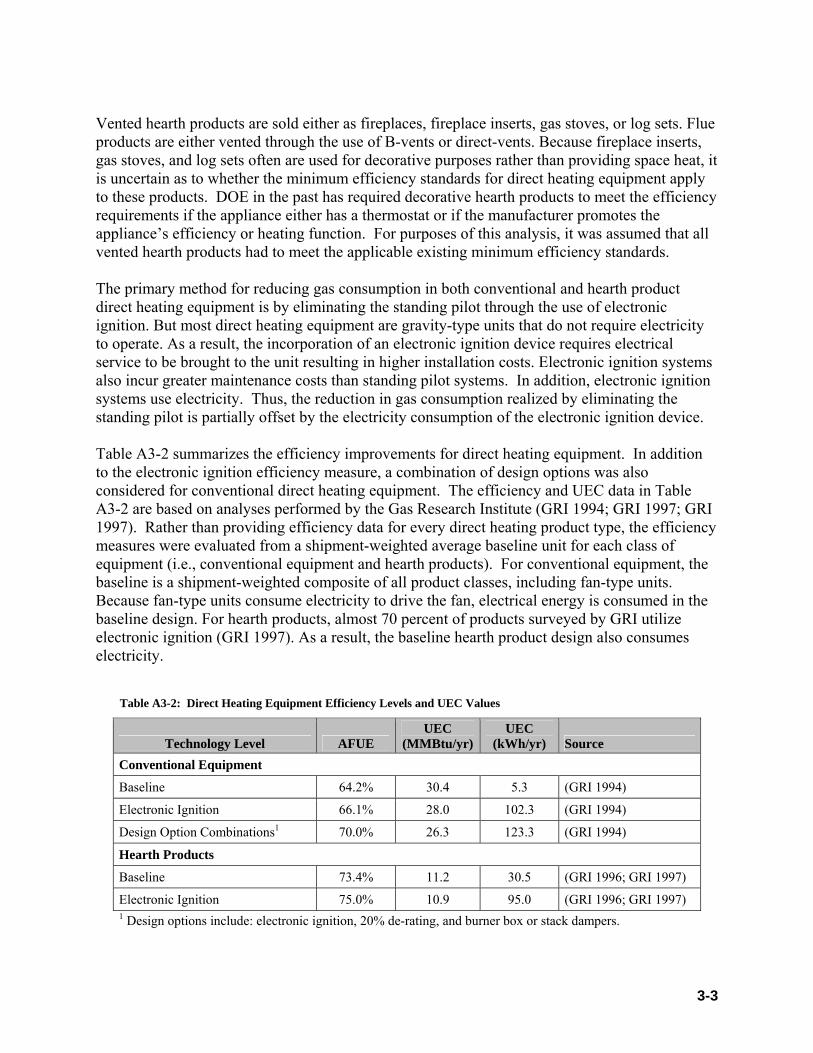
Vented hearth products are sold either as fireplaces, fireplace inserts, gas stoves, or log sets. Fluproducts are either vented through the use of B-vents or direct-vents. Because fireplace inserts,gas stoves, and log sets often are used for decorative purposes rather than providing space h
e
eat, it uncertain as to whether the minimum efficiency standards for direct heating equipment apply these products. DOE in the past has required decorative hearth products to meet the efficiency
requirem ostat or if the manufacturer promotes the appliance’s efficiency or heating function. For purposes of this analysis, it was assumed that all vented hearth products had to meet the applicable existing min fficiency standards. The prim educ c tion in both conventional and hearth product direct heating equipmigni ting equipment are gravity-type units that do not require electricity to o s a result, the inco on elec ignition device requires electrical serv to the un ting igher lation co Elec ion systems also maintenance costs than standing pilot systems. In addition, electronic ignition syst ricity. Thus, uct gas consumption realized by eliminating the standing pilot is partially offset by the electricity consumption of the electronic ignition device. Tab ummarizes the eff i men r direct h ng eq n to th ion efficiency mea com tion of de n optcons e efficiency and UEC data in Table
3-2 are based on analyses performed by the Gas Research Institute (GRI 1994; GRI 1997; GRI 997). Rather than providing efficiency data for every direct heating product type, the efficiency
measures were evaluated from a shipment-weighted average baseline unit for each class of equipment (i.e., conventional equipment and hearth products). For conventional equipment, the
omposite of all product classes, including fan-type units. its consume electricity to drive the fan, electrical energy is consumed in the
Table A3-2: Direct Heating Equipment Efficiency Levels and UEC Values
isto
ents if the appliance either has a therm
imum e
ary method for r ing gas inating th
onsumpe standing pilot through the use of electronic ent is by elim
tion. But most direct heaperate. A rporati of an tronicice to be brought it resul in h instal sts. tronic ignit incur greater ems use elect the red ion in
le A3-2 s iciency mprove ts fo eati uipment. In additioe electronic ignit sure, a bina sig ions was also idered for conventional direct heating equipment. Th
A1
baseline is a shipment-weighted cBecause fan-type unbaseline design. For hearth products, almost 70 percent of products surveyed by GRI utilize electronic ignition (GRI 1997). As a result, the baseline hearth product design also consumes electricity.
Technology Level AFUE UEC
(MMBtu/yr)UEC
(kWh/yr) Source Conventional Equipment
Baseline 64.2% 30.4 5.3 (GRI 1994)
Electronic Ignition 66.1% 28.0 102.3 (GRI 1994)
Design Option Combinations1 70.0% 26.3 123.3 (GRI 1994)
Hearth Products
Baseline 73.4% 11.2 30.5 (GRI 1996; GRI 1997)
Electronic Ignition 75.0% 10.9 95.0 (GRI 1996; GRI 1997) 1 Design options include: electronic ignition, 20% de-rating, and burner box or stack dampers.
3-3

Table A3-3 provides retail price information corresponding to the efficiency levels specified in Table A3-2. Table A3-3 also includes the installation and annual maintenance costs. The price
ata were taken from analyses performed by GRI (GRI 1994; GRI 1996) and inflated to 2002 dollars using consum
Table A3-3: Direct Heating Equipment Retail Pri
der price index data from the U.S. Department of Labor (DOL 2004).
ces
Technology Level AFUE
Retail Price
($2002)
Installation Price
( ) $2002
Annual Maintenance
Cost ($2002) Source
Conventional Equipment
Baseline 64.2% $520 $3 (G 4) $211 RI 199
Electronic Ignition 66.1% $631 $229 $8 (GRI 1994)
Design Option $771 $14 (G 4) Combinations 70.0% $276 RI 199
Hearth Products
Baseline 73.4% $1532 NA $3 (GRI 1996; GRI 1997)
Electronic Ignition 75.0% $1608 $61 $5 (GRI 1996; GRI 1997)1 I stallation price is the price increase relative to the baseline. n
3.3 Test Procedure Status
heating equipment on May
12, 1997 (DOE 1997).
year are derived by taking the national annual energy savings and multiplying it by the corresponding electricity price from the DOE-Energy Information Administration’s Annual Energy Outlook 2004 (DOE 2004). Consumer national equipment cost increases are derived by taking the per unit change in equipment cost and multiplying it by the annual shipments. Cumulative bill savings and equipment cost
A
The Department adopted a Final Rule of the test procedure for direct
A3.4 Energy Savings Estimates and Calculations
Table A3-4 presents the energy savings potential for the efficiency levels specified in Table A3-2. Also provided in Table A3-4 is the economic benefit or burden to consumers for each efficiency level. Note that none of the efficiency levels result in economic benefits to consumers. Also note that the electronic ignition design option for hearth products actually results in negative energy savings due to the additional electricity consumption of the ignition device. Consumer national utility bill savings for a given
3-4

increases are summed over the time period 2010-2035 with the net benefit or burden being the difference between the two values.2
Table A3-4: Direct Heating Equipment Potential Energy Savings and Economic Impact Estimates
Technology AFUE
Energy Saving Potential, 2010-2035
(quad)
Potential Economic Benefits/Burdens;
Cumulative NPV 2010-2035 (billions of $2002)
Conventional Equipment
Baseline 64.2% NA NA
Electronic Ignition 66.1% 0.10 -0.15
Design Option Combinations 70.0% 0.19 -0.45
Hearth Products
Baseline 73.4% NA NA
Electronic Ignition 75.0% -0.10 -1.25
A3.5 Regulatory Actions and Cumulative Burdens
In the Fiscal Year 2004 Priority-Setting memorandum, direct heating equipment was listed as a low-priority product (DOE 2003). No significant changes have occurred since then.
A3.6 Issues Impacting Potential Energy Efficiency Standards
The smoke from wood-burning fireplaces contributes to outdoor air pollution. In the western U.S., atmospheric inversions are common: warmer air above traps cooler air below, resulting in a highly stable atmospheric condition where pollutants disperse slowly. Because of such “brown cloud” inversions, many western states have restricted wood burning. Restrictions are also in place in parts of the northeast. Usually the restrictions amount to levying fines for wood burning on certain days. Although the laws are seldom enforced, they do affect consumer behavior. Due to the restrictions placed on wood-burning fireplaces, many consumers are turning to gas-fired hearth products as an alternative. Because gas-hearth products are being used by consumers in response to air quality regulations, it may not be wise to impose efficiency regulations on these products, especially if such regulations significantly increase the retail price of the equipment and dissuade consumers from purchasing these products.
2 Economic calculations are performed with a spreadsheet tool which is available on the DOE Building Technologies Program, Appliances and Commercial Equipment Standards web site. http://www.eere.energy.gov/buildings/appliance_standards/docs/fy05_priority_setting_spreadsheets.zip
3-5

With respect to gas ignition systems, the maintenance costs associated with the electronic
data) may no longer be presentative of electronic devices that can now be used by direct heating equipment. Because
e systems may be equivalent to ose associated with standing pilot systems. As a result, electronic ignition systems may be
this analysis.
ignition system assumed for this analysis (based on early 1990’sremanufacturers have had additional years to improve the reliability of electronic ignition systems since the early 1990’s, the maintenance costs associated with thesthmore cost-effective as a means in which to reduce the energy use of direct heating equipment than shown by
3-6

3-7
sment of Technology for Improving the Efficiency of Gravity Direct Heating Equipm Gas Research Institute (GRI). 1996. “Gas Hearth Products Market se”. Chicago, IL. G Gas Research Institute (GRI). 1997. “Hearth tudy (1995-1997)”. Chicago, IL. GRI 97/0298. Hearth Products Association. 2004. Private communications w eithley.
r l
fice of Energy Efficiency and Renewable Energy. 1994. “Energy Conservation Program for Consumer Products; Proposed Rule.” Federal Register 59
.
2004
References
Appliance Magazine. 2003. “Statistical Review.” May, 2003. Gas Research Institute (GRI). 1994. “Asses
ent”. Chicago, IL. GRI-94/0342.
Fact BaRI-96/0013.
Products Meter S
ith Carter K National Appliance Energy Conservation Act (NAECA), 1987, Pub. L. 100-12 U.S. Department of Energy (DOE)-Office of Codes and Standards, 1993. “Technical Support Document: Energy Efficiency Standards for Consumer Products: Room Air Conditioners, WateHeaters, Direct Heating Equipment, Mobile Home Furnaces, Kitchen Ranges and Ovens, PooHeaters, Fluorescent Lamp Ballasts & Television Sets.” Washington, DC DOE/EE-0009, Volume H. U.S. Department of Energy (DOE)-Of
(43): 10464-10532. U.S. Department of Energy (DOE)-Office of Conservation and Renewable Energy. 1997"Energy Conservation Program for Consumer Products: Test Procedures for Furnaces/Boilers, Vented Home Heating Equipment, and Pool Heaters." Federal Register 62 (91): 26140-26165. U.S. Department of Energy (DOE)-Building Technologies Program. 2003. “Fiscal YearPriorities for the Appliance Standards Rulemaking Process.” Available online: http://www.eere.energy.gov/buildings/appliance_standards/pdfs/october_memo.pdf U.S. DepartmOut 0383(2004). January 20
004. Consumer Price Index-All Av le online: http://w
ent of Energy (DOE), Energy Information Administration. 2004. “Annual Energy look 2004 with projections to 2025.” Washington, DC. DOE/EIA-
04. U.S. Department of Labor (DOL), Bureau of Urban Consumers.
Labor Statistics. 2ailab ww.bls.gov/cpi/

A4.1 Background
Dishwashers use heated water and dishwashing detergent to clean and dry dishes. Collectively, the installed base of approximately 61.7 million residential dishwashers consumes about 0.26 quad of energy per year (see Table A4-1).
Table A4-1: Residential Dishwasher Background Data
Data Type Value Source Installed Base, millions 61.7 Meyers et al. (2002) Annual Shipments, millions 6.4 Appliance (March 2004) Equipment Lifetime, years 13 DOE EREN FEMP AEC, quad 0.26 Meyers et al. (2002), modified to use an updated estimate
of 215 average cycles/year, rather than 250 cycles/year, based on CFR 2004.
A4.2 Product Technology Descriptions and Market Presence
For ene 1) whether Dishwa ed cycle beenergy er energy use, so any feature
th a
cedure, nor do they consider the relative quantity of higher efficiency / soil-sensing pected that much of this
nufacturers must make their annual
Table A4-2: Residential Dishwasher Technology Levels and Energy Factor Values
rgy consumption considerations, dishwashers are categorized by two metrics— equipped to sense the amount of soil in the wash load, and 2) the dish load capacity.shers equipped with soil sensors offer the potential to save energy compared to a timcause the dishwasher only uses the volume of water needed to clean the dishes. The
used to heat the water is the main component of dishwashthat saves water will also reduce energy consumption. Standard size dishwashers are units widish load capacity of 8 or more place settings. Compact dishwashers are units with a dish load capacity of less than 8 place settings.
The stock unit energy consumption (UEC) levels (see Table A4-3) include dishwashers at and below the current minimum efficiency standard. ENERGY STAR® qualified dishwashers use 25% less energy than the federal standard for energy efficiency. The federal minimum efficiency standard remains unchanged. However, Energy Factor values (Table A4-2) for the Stock and particularly, the Typical New level are dated. These values do not consider the effect of restating Energy Factor values for soil-sensing dishwashers in light of the new dishwasher prodishwashers in the mix of shipped and installed units. It is exinformation will be compiled within the year when all mastatements to the Federal Trade Commission.
Technology Level Energy Factor [cycles/kWh]
Comments/Source
Stock 0.41 Meyers et al. (2002) Minimum Efficiency Standard
0.46 DOE EREN FEMP (2000)
Typical New 0.50 ADL (2000) ENERGY STAR® 0.58 http://www.energystar.govSoil-Sensing 0.60 Typical value for soil-sensing units
listed at http://www.energystar.govBest Available 1.19 http://www.energystar.gov
A4 Dishwashers (Residential)
4-1

The Energy Factor associated with best available technology is taken from the latest data r these data
ent data gather d a
e dishwashers use much less energy than the minimum standard and the ENERGY STAR®
sents several significant additions and
a test method to measure standby power for all dishwashers—both soil-sensing and fixed-cycle machines, and
er year
ct has e
2001). Further, the rev of soil and expresses the masses of food soil in terms of the food soils used cleaning test, ANSI/AHAM DW-1. The andar DW place setting with 31.3 gram fic fo am in the review, the amount of food soil at each soil level is Light - 1/2 of 1 soiled place setting (15.65 gra 2 soiled place setting 6 grams), and soiled place settings (125.2 grams).
lative el of soil on the dishware in their dishwashers. Therefore, the calculation of the energy
available at the ENERGY STAR® site. However, there is some question whetherepres e ccording to the new test procedure.
Somrating. The best available dishwasher uses approximately 39%3 of the energy level specified in the minimum efficiency standard and approximately 49% of the energy level specified in the ENERGY STAR® rating. The primary factor in dishwasher energy consumption is water use – the less water used the more energy saved.
A4.3 Test Procedure Status
On August 29, 2003 the Department of Energy published its final rule for the “Uniform Test Method for Measuring the Energy Consumption of Dishwashers” (10 CFR 430 Subpart. B, App. C). This update to the dishwasher test procedure prerevisions, including:
• Addition of three-point test method, specifically for soil-sensing dishwashers • Addition of
• Reduction of the number of average-use cycles p Soil-sensing dishwashers must now be tested with soiled dishware to more accurately refletheir energy and water consumption (effective 2/25/04). A review of dishwasher survey datashown that relative to the level of soil on dishware in dishwashers, U.S. households distributinto three levels of soil--Light-62%, Medium-33%, and Heavy-5% (ADL,
iew finds survey data to define the mass of food soil at each of these three levels in the industry'
d, ANSI/AHAMs egg, oatmeal, preserves, potatoes, ground
s 'worst-case'-1, soils each test st
s of speci od soils, sucheat, coffee, etc. Based on the find gs of:
ms), Medium - Heavy - 4
s (62. Based on the recommendations of the review, the energy factor for soil-sensing dishwashers is now determined from a weighted average of energy consumption tests conducted at each of the three soil levels. For example, of the eight place settings used in the energy consumption test, the heavy soil level has four of those place settings soiled per DW-1. The weighting of the average of the energy consumption tests results from the distribution of U.S. households reo the levt
factor of a soil-sensing dishwasher (EFsoil-sensing) is:
3 KWh/cycle is the inverse of the Energy Factor value presented in Table A4-2. Thus, the best available technology uses 0.46/1.19 = 39% of the energy used by a product meeting the minimum efficiency standard.
4-2

EFsoil-sensing = 1/ (0.62 * EnergyLight Soil Level + 0.33* EnergyMedium Soil Level + 0.05 * EnergyHeavy Soil Level)
to include the measurement of standby power for all dishwashers. However, a dishwasher’s standby power is not included in its energy
s
5
rs determined from a review of five surveys of consumers’ usage habits, including the 2001 RECS data (ADL 2001).
ddition of definitions to support the soil-sensing test method, and modifications to improve the clarity and repeatability of
ates of the current energy consumption and potential energy savings for residential dishwashers. The energy savings calculations assume that the entire installed base of dishwashers consume energy at the “typical new” level.
Table A4-3: Residential Dishwasher Current Energy Consumption and Potential Saving Estimates
The dishwasher test procedure is the first test procedure
factor calculation and therefore does not impact the minimum standard. The standby power measurement is factored into a dishwasher’s estimated annual operating cost (EAOC) and ireported on its EnergyGuide label.
The number of average-use cycles per year for a dishwasher has been reduced to a value of 21(264 was the value used prior to FY2003). This average-use number represents a midpoint in a range of average-use numbe
In addition to these major modifications, other updates included the a
the test procedure.
A4.4 Energy Savings Estimates and Calculations
Table A4.3 presents the estim
Technology/Standard Level UEC (MMBtu/yr)
Annual Energy Savings Potential
(quad)
Energy Saving Potential, 2010-
2035 (quads) Typical Dishwasher (Current Stock) 4.05 NA NA ‘Typical New’ 3.28 NA NA ENERGY STAR® 2.83 0.028 0.52 Soil-Sensing 2.73 0.034 0.63 Best Available 1.40 0.12 2.17
The energy savings potential between ENERGY STAR® and best available dishwasher technology shows a wide range of potential energy savings. However, as noted above the data on best available dishwasher technology may not reflect testing against the new test procedure. Further there is a relatively low saturation level, ~60%, of homes with dishwashers, which gives room for much more saturation and lends some additional uncertainty in potential energy savings. Additional dishwasher energy savings could be realized if consumers’ habit of pre-treating dishes with water can be avoided. It is well documented that approximately 70% of households with dishwashers pre-treat dishes with water before putting them into the dishwasher (ADL
4-3

2001). Estimates of water consumption vary widely and little information is available on the mount of hot water used. Therefore, estimating this potential energy savings is currently
likely to be uncertain.
ishwashers are regulated for energy efficiency under NAECA and have the minimum energy rs,
ompanies that manufacture dishwashers typically produce other white goods that have been ding clothes washers & dryers,
mproved electronic . Standby energy
adifficult and
A4.5 Regulatory Actions and Cumulative Burden
Defficiency level listed in Table A4-2. The extent to which regulation impacts dishwasheincluding health and safety, was not determined. Csubject to past energy efficiency regulations under NAECA, inclurefrigerators, and freezers.
A4.6 Issues Impacting Potential Energy Efficiency Standards
With increasing use of microprocessors to control the dishwashing cycle and iser interfaces (e.g., visual displays), the potential for standby losses increasesu
consumption on the order of 5 Watts could increase typical new dishwasher AEC by approximately 10%.
4-4

4-5
CFR
ADL, 2000, “Guide for Evaluation of Energy Savings Potential”. Report to the US Department of Energy, Office of Building Technology, State and Community Programs (BTS), February, 2000.
References
ADL, 2001, “Review of Survey Data to Support Revisions to DOE’s Dishwasher Test Procedure”, Report to U.S. Department of Energy, Energy Efficiency and Renewable Energy, Office of Building Technology, State and Community Programs, December 18, 2001. Appliance Magazine, 2004, appliance industry statistics, page 16 Appliance Magazine, March. Appliance Magazine, 2001, “Appliance Statistical Review: 48th Annual Report”. Appliance Magazine, May.
, 2004, 10 Code of Federal Regulations - Energy, as of March 15, 2004. DOE, 2000, Energy Efficiency and Renewable Energy Network (EREN), Federal Energy M rog ), “D sher Cost-Effectiveness Example”, Available at: h .d /procurement/dish_c
anagement P ram (FEMP ishwattp://www.eren oe.gov/femp ost.html .
M a ., McNeil, ., torical and Projected Impacts of U.S. Federal Efficiency Standards for Residen l A , Lawrence Berkeley National Laboratory Report, LBNL-49504, May.
eyers, S., McM hon, J M., and Liu, Xtia
2002, “Hisppliances”

A5.1 Background
Industrial motor systems are the largest single electrical end use in the U.S. economy. Accordto the United States Industrial Electric Motor Systems Market Opportunity Assessment (OIT2002), a study published by the United States Department of Energy, electric motors used in industrial processes consumed 679 billion kWh (approximately 7.5 quads of primary energy) 1994. This accounts for 23 percent of all United States electricity consumption. (OIT-2002) Motors covered by the Energy Policy Act (EPAct) account for 50-70 percent of all integral horsepower motors sold, and 23-32 percent of annual energy consumed by integral horsepowermotors. (OIT-2002) Table A5-1 shows background data on industrial sector motors i
ing -
in
n the size
range covered by EPAct. Industrial motors in the size range covered by EPAct consumed 380 billion kWh site energy, or 4.2 quads of primary energy, in 1994. Most industrial motors in the
ered general purpose; many motors used in the commercial sector are considered special purpose and therefore are not subject to EPAct efficiency standards). Thus energy consumption for the size range gives a
EPAct size range are in fact subject to EPAct (that is, they are consid
reasonable approximation of the total industrial sector energy consumption subject to EPAct. Table A5-2 shows the same data for commercial sector motors.
Table A5-1: Industrial Sector Motors, 1-200HP Background Data
Data Type Units Value Source Installed Base Million units 12.3 (OIT-2002) Annual Shipments, 2002
Million units 1.54 (Census-2002)
Equipment Lifetime (years)
Years 15-20 years for 80% turnover
(OIT-2002)
1994 AEC, 1-200 HP Motors5
quads 4.2 (OIT-2002)
Table A5-2: Commercial Sector Motors, 1-200HP, Subject to EPAct, Background Data
Data Type Units Value Source Installed Base Million units 4.1 (ADL-1999) Annual Shipments
Million units 0.54 (ADL-1999)
Equipment Lifetime (yea
Years 15 (ADL-1999) rs)
AEC, 1-200 HP Motors6
quad 0.7 (ADL-1999) EPAct
4 This figure is actually the total number of shipped motors in the size range; it is not restricted to industrial motors only. 5 This figure assumes that the distribution of motor system energy consumption by horsepower size for all industriidentical to the distribution for motors from the manufacturing sector. This annual energy consumption (AEC) figure includes allmotors in the EPAct size range, and thus may include energy consumed by some definite and special purpose motors not subject to EPAct.
al motors is
large
A5 Electric Motors, 1-200 HP
6 This figure is based on Tables 4-3 and 4-4 of (ADL-1999). Most of the energy subject to EPAct (in the 1-200HP size range, and not a special purpose motor such as a compressor) is consumed by blower motors in medium unitary air conditioners, unitary air conditioners, Central Station Air Handling Units, and pumps in Hydronic heating systems.
5-1

Commercial sector motors are much more numerous than industrial motors, and tend to be smaller: in 1995, there were 123 million commercial sector motors total; approximately 70 percent of those (87 million) are smaller than 1HP, and thus not subject to EPAct. About 36
illion commercial motors fall in the EPAct size range. The number of commercial sector ter than 200HP is very small. The Annual Energy Consumption for commercial
5.2 Product Technology Descriptions and Market Presence
otors designed for use under usual service conditions r type of application are known as “general-
e
d the norm
e rs
otor size
rive
order
ications, such as pumps and blowers, can match flow requirements by operating at different speeds appropriate to each application. Although ASDs
system efficiency, they can
mmotors greasector motors in 1995 was 356 billion kWh. Of that, 31 percent was consumed by fractional horsepower motors, and 7 percent by motors greater than 200HP. About 220 billion kWh was consumed by commercial motors in the 1-200HP range. 196 billion kWh (55 percent of the total) was consumed by motors in the range 1-20HP. (ADL-1999) Despite these apparently large numbers, most energy in the commercial sector is consumed by refrigerant compressors and other motors that are considered special purpose and thus not subject to EPAct.
A
AFor the purpose of efficiency standards, m
5.2.1 Motor Types
without restriction to a particular application opurpose motors.” (NEMA-2001). Usual service conditions include limits on variables such as temperature, altitude, power supply quality, mounting conditions, and ventilation conditions. (LINCOLN-1995) Motors that operate using alternating electrical current are known as AC Motors; motors powered by direct current are known as DC motors. Because AC motors arsimpler in construction, and because electric grids provide AC power, AC motors are typically used in industrial settings. Polyphase motors are simpler in construction, more reliable, anprovide higher power/size ratios than corresponding single phase motors, and thus arefor industrial applications. (LINCOLN-1995) AC Polyphase motor types The most common form of polyphase induction motor (again because of simplicity) is thsquirrel cage, so-named for the appearance of its rotor. The other types of AC polyphase motoare the wound rotor induction motor, and synchronous motor. The existing EPAct standards apply just to squirrel cage polyphase induction motors. MMotors below 1HP are known as fractional horsepower motors; those 1HP and above are knownas integral. DIf the power source driving the motor can only supply a fixed voltage and frequency, it is described as a single speed drive. If the source can vary the supply voltage or frequency in to control the motor speed, it is termed an Adjustable Speed Drive (ASD), or Variable Speed Drive (VSD). Some motor appl
typically result in a moderate (approximately 5%) decrease in motor realize large reductions in motor system energy consumption in applications that favorably accommodate operation of motors at reduced speed. For example, an ASD can reduce the
5-2

energy consumed by a central station air handler by approximately 40% (ADL-1999). Most induction motor ASDs are not integral parts of the motor; thus, they do not impact the tested fullload motor efficiency (see the “Test Procedure” section). Enclosure The most common types of industrial motor enclosures are Open Drip-Proof (ODP), and TEnclosed Fan-Cooled (TEFC). ODP motors have open vents, but are designed to tolerate drops of liquid falling
-
otally
on them from angles within 15 degrees of vertical. TEFC motors are more rotected than ODP motors, as an enclosure completely covers the motor internals. Cooling is
otors re
than
is losses (collectively known as “iron losses”). creased winding slot fill increases the amount of material (typically copper) in the stator
d resistive
., s,
proved rotor ar-lamination isolation to reduce resistive losses). Increasing the stack length enables
an
.
ies, such as permanent magnet and switched reluctance motors, have the otential to realize higher motor efficiencies than EPAct-level induction motors, particularly at
as
e
A5.2.3 Regulations and Voluntary Energy Efficiency Programs The Energy Policy Act of 1992 (EPAct) requires that general purpose, polyphase, single speed, squirrel-cage induction motors rated from 1-200hp manufactured for sale in the US from
pprovided by fan-driven airflow over the exterior of the motor enclosure. Although TEFC mare entirely enclosed, they are not airtight. (“Encapsulated motors,” with airtight enclosures, aavailable for more specialized applications including safety, but these are far less common ODP or TEFC enclosures.) Existing regulations apply to ODP and TEFC motors. The efficiency regulations for the two types of enclosed motors are different.
A5.2.2 Motor Design Efficiency Measures The efficiency of induction motors can be improved in several ways. In practice, all represent abalance between performance gain and cost. Better quality core materials for the motor rotor and stator can reduce eddy current and hysteresInwindings, which reduces resistance to electric flow in the stator windings and associate“copper” loss. Reduced rotor bar conductor resistance reduces losses from motor slip by switching the conductor material to copper or a different aluminum alloy. Improved manufacturing quality encompasses several potential measures that decrease motor losses (e.greduced lamination edge shorts on the stator and rotor to improve suppression of eddy currentimproved motor design and manufacturing processes to reduce stray load losses, imbattainment of required torque and power ratings with lower flux and current loadings thereby lowering iron and copper losses, but requires a greater expenditure of material and perhaps increase in motor frame size. Improved bearings and lubricants could reduce bearing friction loss. Improved fan designs and other aerodynamic improvements could reduce windage loss Other motor technologpsmaller motor sizes. Increasing the efficiency of motors may require changes to other motor parameters such inrush current, startup torque, and slip. In certain applications, motor efficiency cannot be increased beyond a certain point without altering other motor parameters beyond what is feasiblfor the application.
5-3

October, 1997 onward meet minimum efficiency standards. EPAct also requires standardized testing procedures and labeling. (EPACT-1992). The EPAct standard was adapted from earlier standards promSpeof 3600, 1800, and 1200 rpm the energy efficiencies listed in NEMA S and ng t IEEE Standard 112
th ca NV pendent testing laboratory
EMA tains e strin volun tandar wn as A Premium™. The nsort for Energy Efficiency (CEE) launched a Premium Efficiency Motors Initiative in 96. I 01, CE gned it andard NEMA Premium™, so there is no longer a inct stand The U State ironmental Protection Agency considered odu the En tar® label for integral horsepower elect otors, but decided not to, in
art because the combined CEE / NEMA Premium™ standard appeared to provide a broadly cognized and consistent means for identifying more efficient motors. Furthermore, anufacturer support for an alternative, potentially competing label was not strong. (EPA-2001)
The US Department of Energy (DOE) was an effort to improve motor efficiency throu regulation. This program has been integrated i to D Pra ich ficiency resources for a variety of industrial system st m
o r isio s M er” a ona ca otor anage and p ng as l to cu
ampaign is sponsored by a consortium o tor industry manufacturers and service centers, de as tions, ric utilities and government agencies. The campaign is sponsored or port y CEE A, EP DOE, m motocien ogram d othe ehold DECI S-200
he purpose of the Efficiency of Electric Motors (EEM) program of the National Institute of tandards and Technology (NIST), part of the National Voluntary Laboratory Accreditation
1995) (NIST-2004). Both EPAct and NEMA Premium™ use the same testing procedures, described later in section A5.3. The main difference between the EPAct and the NEMA Premium™ standards are the required efficiency levels. Table A5-3 below compares EPAct and NEMA Premium™ efficiency levels for 2 pole, 4 pole, and 6 pole Open Drip Proof motors at five representative motor size bands. Table A5-4 provides the same comparison for Totally Enclosed Fan Cooled Motors. The two standards differ in scope, that is, EPAct only applies to motors from 1 to 200 HP, whereas the NEMA Premium standard is defined for motors from 1 to 500 HP. Also,
ulgated by the National Electrical Manufacturer’s Association (NEMA). cifically, EPAct dictates that the nominal full load efficiencies for open and enclosed motors
are consistent with (NEt ard MG1, Part 12,
IEEE ), MA-1998) accordi
ut by /o tests specified in
appro deMe(NIST-1995).
od B ( -1996 rried o a NIST LAP ved in
N main a mor gent tary s d kno NEMCo ium19 n 20 E ali s st s withdist CEE ard. nited s Envintr cing ergyS ric mprem
Motor Challenge program of thegh education, rather than
n OE’s broader Best ctices program7, wh provides energy efs, not ju otors.
“M to Dec
mentn att
lanniis nati
a tool mpaign encouraging the use of sound m
t motor energy costs and increase productivity. The mc f motra socia electsup ed b , NEM A, ajor r manufacturers, utility and state energy-effi cy pr s, an r stak ers. ( SION 4). TSProgram (NVLAP), is to accredit testing laboratories to assure that standard test procedures for efficiency are followed in testing electric motors. Specifically, the EEM program addresses testing the efficiency of electric motors for EPAct and NEMA Premium™ standards. (NIST-
7 More information is available at: http://www.oit.doe.gov/bestpractices/motors .
5-4
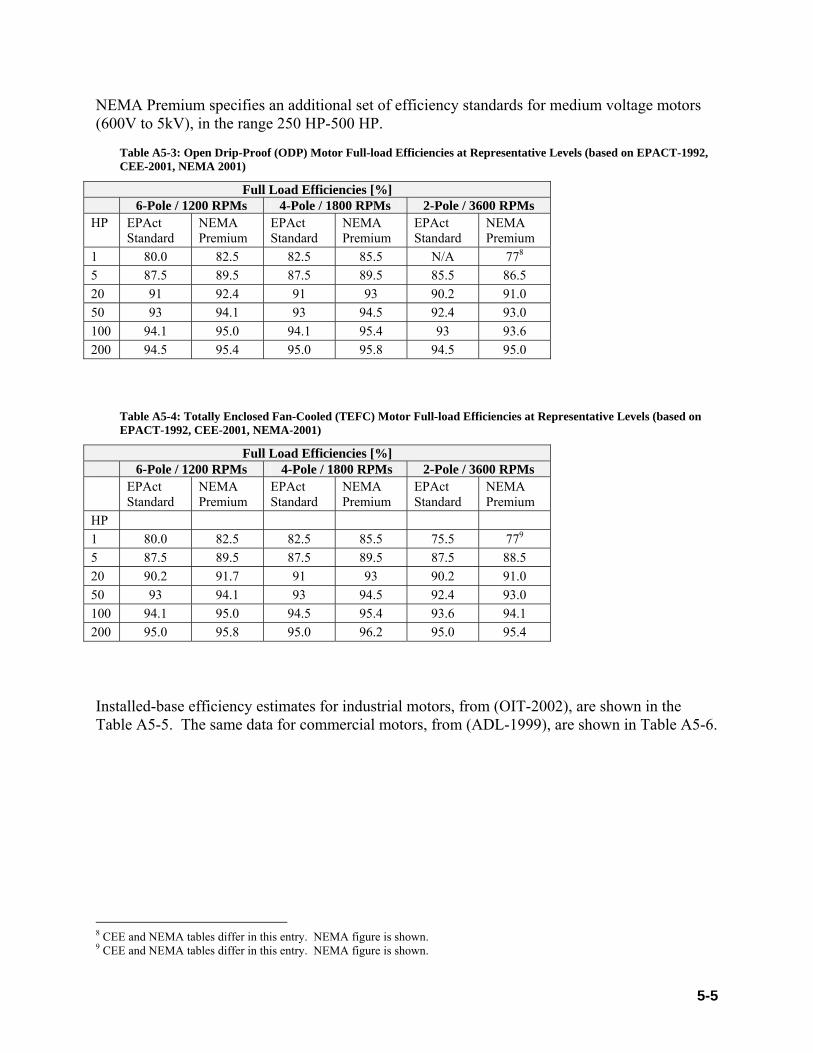
NEMA Premium specifies an additional set of efficiency standards for medium voltage motors
e A5-3: f (ODP) Motor Full-load Efficiencies at Representative Levels (based on EPACT-1992, -2001, N
(600V to 5kV), in the range 250 HP-500 HP.
Tabl Open Drip-ProoEMA CEE 2001)
Full Load Efficiencies [%] 6-Pole / 1200 RPMs 4-Pole / 1800 RPMs 2-Pole / 3600 RPMs
H Act rd
NP
EPAct Standard
NEMA Premium
EPAct Standard
NEMA Premium
P EPStanda
EMA remium
1 .0 82.5 85.5 N/A 778 80 82.5 5 .5 87.5 89.5 85.5 86.5 87 89.5 20 91 92.4 91 93 90.2 91.0 50 93 94 93 94.5 92.4 93.0 .1 1 94.1 94.1 95.4 93 93.6 00 95.0 2 94.5 95.0 95.8 94.5 95.0 00 95.4
Table A5-4: Totall closed Fan-Cooled (TEFC) Motor Full-load Efficiencies at Representative Levels (based on NEMA-2001)
y EnEPACT-1992, CEE-2001,
Full Load Efficiencies [%] 6-Pole / 1200 RPMs 4-Pole / 1800 RPMs 2-Pole / 3600 RPMs
Standard Premium
Standard
NEMA Premium
EPAct Standard
NEMA Premium
EPAct NEMA EPAct
HP 1 80.0 82.5 82.5 85.5 75.5 779
5 87.5 89.5 87.5 89.5 87.5 88.5 20 90.2 91.7 91 93 90.2 91.0 50 93 94.1 93 94.5 92.4 93.0 100 94.1 95.0 94.5 95.4 93.6 94.1 200 95.0 95.8 95.0 96.2 95.0 95.4 Installed-base efficiency estimates for industrial motors, from (OIT-2002), are shown in thTable A5-5. The same data for commercial motors, from
e (ADL-1999), are shown in Table A5-6.
8 CEE y. NEMA figure is shown. 9 CEE y. NEMA figure is shown.
and NEMA tables differ in this entr and NEMA tables differ in this entr
5-5

abl rial motors, 1998 (OIT-2002) T e A5-5: Installed base efficiency estimates for indust
HP Efficiency [%] >1-1.5 79.3 >5-7.5 85.16 >20-25 88.91 >50-60 91.29 >100-125 92.17 >150-200 93.03
Table A5-6: Installed base efficiency estimates for commercial motors, 1999 (ADL-1999)
HP Efficiency [%] 1 75 5 83 20 88 50 89 100 90 200 91
A5.3 Test Procedure Status
The various energy efficiency standards for motors (EPAct and NEMA / CEE) all rely on the ” of IEEE Standard 112, “IEEE
nd rent
s ss
ect d to
calculate the final value of total loss and the efficiency.” The specific test procedure for Method B consists of a series of measurements that must be performed in order, with interspersed calculations. The numbers below are the relevant section headings from IEEE-1996.
6.4.1.1 Rated load temperature test 6.4.1.2 Test under load 6.4.1.3 No load test 6.4.2.1 Friction and windage loss 6.4.2.2 Core loss 6.4.2.3 Stator I2R loss 6.4.2.4 Rotor I2R loss 6.4.2.5 Apparent total loss
same efficiency test procedures, the so-called “Method BStandard Test Procedure for Polyphase Induction Motors and Generators.” (IEEE-1996) Method B of IEEE Standard 112 is described as “Input-output with segregation of losses aindirect measurement of stray-load loss.” In this test, according to IEEE-1996, “the appatotal loss (input minus output) is segregated into its various components with stray-load loss defined as the difference between the apparent total loss and the sum of the conventional losse(stator and rotor I2R loss, core loss, and friction and windage loss). The value of stray-load lothus determined is plotted vs. torque squared, and a linear regression is used to reduce the effof random errors in the test measurements. The smoothed stray-load loss data are use
5-6

6.4.2.6 Stray-load loss determination (indirect method)
The p 4.1.2 i s which 6.4.1.2 references):
means of a mechanical brake or dynamometer (see 4.3.1).
adings of electrical power, current, voltage, freque lip, torque, ambient temperature, and tor winding temperature o winding resistance shall be obtained for four load points roximately equally spaced en not less than 2 nd up to and including 100% load, and
two load points suitably chosen above 100% load but not exceeding 150% load. (IEEE-1996)
strial ee
ls. ould be small, as efficiency of partially
aded motors does not drop off drastically until below 50%. Please see (ADL-1999) Figure 2-2 (after NEMA-1994) for a characterization of As of 1998, just 9 percent of industrial motors had ASDs; these m tors were responsible for just 4 per tor ene O
y Savings Estimates and Calculations
-7 shows the change in A l Energy Consum n that would result from shifting ct to NEMA Premium standards. The table shows that the proposed change in
ion could save 0.06 quad p r of primary energy (5.4 billion kWh per year).10
imately 1.0 quad, as shown in the third column of the table.
6.4.2.7 Smoothing of the stray-load loss
rocedure for 6. s described as follow (taken from 6.3.1,
The machine is loaded by Resta
ncy, sr stator
app betwe 5% a
The nominal efficiency, i.e., the efficiency listed on the motor nameplate and the regulated efficiency value, is the efficiency at 100% load. A more realistic typical load level for indumotors in the 1HP – 200HP size class would be 55%. Sub-appendix Table A5-A1 (please scolumn 3 and footnote 2) presents more detailed information on typical motor loading leveThe relative error resulting from this approximation shlo
efficiency as a function of loading.
oIT-2002) cent of total mo rgy consumption. (
A5.4 Energ
Table A5 nnua ptiofrom EPAregulat er yea In a scenario in which the market penetration of NEMA Premium™ level industrial motors ramps linearly from 0 in 2010 to 100% in 2025, and then remains at 100% through 2035, the total benefit resulting from mandating the NEMA Premium™ efficiency standard instead of EPACT would be approx
10 This calculation is based on the formula AEC (kWh) = Motor Size (HP) x 0.746 x Operating Hours x Loading x Installed Base / Efficiency. The data for Operating Hours, Loading, and Population in each size class comes from OIT-2002. Benefit = AECEPACT –AECNEMA Premium. The calculation details appear in the appendix.
5-7

Table A5-7: AEC Savings from Increasing 1-200HP EPAct Motor Efficiency Levels to NEMA Premium LevelsIndustrial Motors
,
Size Class (HP) AEC Savings [quad] Total AEC Savings, 2010-2035 [quad]
1 to 5 0.0094 0.16 5 to 20 0.014 0.25 20 to 50 0.015 0.27 50 to 100 0.0098 0.17 100 to 200 0.011 0.19 Total 0.060 1.0 (OI as much as 0.82 to 1.3 quads (75 to 122 billion kWh), or 11 to 18 percent, if all cost-effective applica ture prov ologies and practices were employed, in the manufa or alone. estimate includes savings from both motor
upgrades, and system efficiency upgrades.
Table A5-8: AEC Savings from Increasing 1-200HP EPAct Motor Efficiency Levels to NEMA Premium Levels, Commercial Motors
T-2002) estimates that industrial motor Annual Energy Consumption could be reduced by
tions of macturing sect
en efficiency techn (OIT 2002) This
efficiency
Size Class (HP) AEC Savings [quad] Total AEC Savings, 2010-2035 [quad]
1 to 5 0.0025 0.043 5 to 20 0.013 0.23 20 to 50 0.0 0.0 50 to 100 0.0 0.0 100 to 200 0.0 0.0 Totals 0.016 0.28 Table A5-8 shows AEC savings for the commercial sector.11 One source of uncertainty in this calculation is the estimate of installed base efficiency. Also, this calculation includes energy consumption from just a few motor applications that account for most of the consumed energy that is subject to EPAct. Estimates of motor operating hours are another significant source of uncertainty for our
for industrial motors, and indirectly affects our commercial savings estimates. (Our commercial calculation is based on an
r,
calculations. This uncertainty directly affects our savings calculation
Annual Energy Consumption figure from (ADL-1999) that in turn depends on an operating hoursestimate.) While the changes in efficiency being contemplated are small, on the order of a few percentage points, it seems plausible that the uncertainty in motor operating hours is much largeas an individual motor can easily run at any duty cycle from 0 to 100 percent. On the other hand,
11 The data in this table were calculated based on AEC data for commercial motors from ADL-1999 [figure ES-3, p. x] (“AECDEFAULT”), and assumed
stalled base efficiencies for commercial motors from ADL-1999 [figure 4-4, p. 4-5], shown in this document as Table 1-6 (“EFFDEFAULT”). The formula to calculate the table is
Benefit = AECEPACT - AECNEMA Premium, where AECEPACT =AECDEFAULT x EFFDEFAULT / EFFEPACT. Similarly, AECNEMA Premium =AECDEFAULT x EFFDEFAULT / EFFNEMA Premium.
inused
5-8

the same estimate of operating hours appears in both the EPAct and the NEMA Premium scenario calculations. In a scenario in which the market penetration of NEMA Premium™ level commercial motors
be realized in the period 2010-2035 by increasing the 1-200HP EPAct efficiency levels to NEMA Premium levels: approximately 1.3 quads of primary energy.
Table A5-9: AEC Savings from 2010-2035 from Increasing 1-200HP EPAct Motor Efficiency Levels to NEMA Premium Levels
ramps linearly from 0 in 2010 to 100% in 2025, and then remains at 100% through 2035, the total benefit resulting from mandating the NEMA Premium™ efficiency standard instead of EPACT would be approximately 0.28 quad, as shown in the third column of Table A5-8. Table A5-9 below summarizes the cumulative Annual Energy Consumption savings that could
Motor Type Total AEC Savings, 2010-2035 [quads]
Industrial 1.0 Commercial 0.28 Total 1.3
A5.5 Regulatory Actions and Cumulative Burden
EPAct regulates the full-load efficiency of 50-70 percent of all integral horsepower motors sold. (OIT-2002) In addition, many 1-200HP motors – both those covered EPAct and special-purpose motors not covered by EPAct – are major components of equipment regulated by EPAct, e.g., unitary A/C compressors and blowers. Two main kinds of motor manufacturers exist. Some motor manufacturers primarily manufacture motors and do not produce significant quantities of other products that face energy efficiency regulations. Most remaining motor manufacturers are a motors-focused division of a parent company. In the second case, other divisions of the parent may produce equipment that faces efficiency regulation, such as appliances.
A5.6 Issues Impacting Potential Energy Efficiency Standards
In the upcoming years, it is likely that the continued decreases in the cost of ASDs will increase their market share. Other (non-induction) motor technologies may achieve greater market share, particularly at the lower end of the 1 to 200HP range. In the future, some motors may directly incorporate an ASD in the motor design. However, these motors would not be subject to EPAct regulation, and thus do not represent an issue for the contemplated change in efficiency standards.
5-9

Premium Efficiency motors are not feasible for all applications, because the high efficiency vels would require changes to other motor parameters that would be inconsistent with
Efficiency motors tend to be economical, in the sense of year. Premium
fficiency motors that are run for 2000 or fewer hours per year tend not to yield a timely
re.
leapplication requirements. Because of their higher cost, Premiumproviding payback within two years, if they are run for 4000 hours or more perEpayback. (CEE-1999) For motors that are run for a small number of annual operating hours, the dollars invested in an efficiency upgrade might yield more energy savings if applied elsewhe
5-10

References ADL, 1999, “Opportunities for Energy Savings in the Residential and Commercial Sectors with
igh-Efficiency Electric Motors”, Final Report by Arthur D. Little, Inc., to the U.S. Department Hof Energy, December. Available at: http://www.eere.energy.gov/buildings/documents/pdfs/doemotor2_2_00.pdf . ADL-2000, “Guide for Evaluation of Energy Savings Potential”. Report to the US Department of
nergy, Office of Building Technology, State and Community Programs (BTS), February.
EE-1999, “Efficient Motors: Selection and Application Consideration,” Consortium for Energy
EE-2001, “CEE Premium-Efficiency Motors Initiative Efficiency Specifications,” ttp://www.cee1.org/ind/motrs/Cee-nema.pdf
E BESTPRACTICES-2003. Website: http://www.oit.doe.gov/bestpractices/motors/. CEfficiency, Boston, MA, 1999. http://www.cee1.org/ind/motrs/motr-broch.pdf Ch . Initiative web page
ttp://www.cee1.org/ind/motrs/motrs-main.php3h . CENSUS-2002, “Motors and Generators: 2002.” US Census Bureau report, MA335H(02)-1. Published by Information Services Center, MCD, Washington, D.C, 1993. CFR-1999, 10 Code of Federal Regulations - Energy, Revised as of January 1, 1999. DECISIONS-2003. Motor Decisions Matter program web site: http://www.motorsmatter.org/ EPACT-1992, Energy Efficiency Program for Certain Commercial and Industrial Equipment: Test Procedures, Labeling, and Certification Requirements for Electric Motors; Final Rule. 10 CFR Part 431. Federal Register, Volume 64, No. 192, October 5, 1999. EPA-2001, Kathleen Hogan, Director, Climate Protection Partnerships Division, Office of Air and Radiation, United States Environmental Protection Agency, “Letter to all interested parties,” October, 2001. IEEE-1996, “IEEE Standard Test Procedure for Polyphase Induction Motors and Generators,” IEEE Std 112-1996 (Revision of IEEE Std 112-1991). ISBN 1-55937-891-3. Published by IEEE, New York, 1997. LINCOLN-1995, “Fundamentals of polyphase electric motors,” Published by Lincoln Electric Motor Division, Cleveland, OH, 1995. Available on website: http://www.lincolnmotors.com/pdf/d-funds.pdf NEMA-1998, “Motors and Generators,” MG1-1998. Definitive standard defining NEMA Premium™ Efficiency levels. Published by NEMA, Rosslyn, VA, 1999.
5-11

NEMA-2001, “Information Guide for General Purpose Industrial AC Small and Medium .” A condensation of NEMA-1998. Published by
EMA, Rosslyn, VA, 2002.
Motors (EEM). A publication of the g ) o a
S nd gy ed v in ashington D.C., 1995. NIST – 2004 Directory of Accredited Laboratories, Efficiency of Electric Motors. Website:
ts.nist.gov ot.htm
Squirrel-Cage Induction Motor StandardsN
NIST-1995 Handbook 150-10, Efficiency of ElectricNational Volunta abora redry L
Technolotory Acc. Publish
itation Pro by US Go
ram (NVLAPernment Print
of the Natig Office, W
n l Institute oftandards a
http:// /ts/htdocs/210/214/scopes/eem . Most recen as of ng 2004.
2, “Uni ates In al Elec otor S arket Opportunities Assessment,” by the epartm f Ener ffice Effi and R
(EERE) and its Office of Industrial echnolo ), W n, D .
t update this writiJanuary OIT-200 ted St dustri tric M ystems MPublished US D ent o gy’s O of Energy ciency enewableEnergy T gies (OIT ashingto .C., 2002
5-12

Sub-Appen
ario
Annual Energy Consumption, Default scenario
dix: Detailed calculations
Ta nnual Ener dustrial ble A5-A1. A gy Consumption, In Motors, Default scen
Size Class Unit Operating hours (1)
oading Efficien(3)
Unit Energy C on
NuMotors (6
Annual rgy
mption
L(2)
cy onsumpti
mber of ) Ene
ConsuHP Hours /
Year P Percent / Year ercent kWh / Year kWh
1 to 5 2745 82.0 7306080 E+10 56.6 4.24E+03 3.105 to 20 3391 86.5 3288035 E+10 51.7 1.89E+04 6.2120 to 50 4067 90.0 1129527 E+10 57.1 6.74E+04 7.6150 to 100 5329 52.2 91.5 1.70E+05 363940 6.19E+10 100 to 200 5200 66.1 92.5 4.16E+05 220908 9.19E+10 Totals 6.76E+05 1.23E+07 3.23E+11
Tab
Annual
le A5-A2. Annual Energy Consumption, Industrial Motors, EPACT scenario
Energy Consumption, EPACT scenario Size Class Unit
Operating hours (1)
Loading (2)
Efficiency (4)
Unit Energy Consumption
Number of Motors (6)
Annual Energy
Consumption HP Hours /
Year Percent Percent kWh / Year kWh / Year
1 to 5 2745 56.6 85.0 4.09E+03 7306080 2.99E+10 5 to 20 89.25 1.83E+04 3288035 6.02E+10 3391 51.7 20 to 50 4067 57.1 92.0 6.59E+04 1129527 7.44E+10 50 to 100 5329 52.2 93.55 1.66E+05 363940 6.05E+10 100 to 20 00 66.1 94.55 4.07E+05 220908 8.99E+10 0 52Totals 6.61E+05 1.23E+07 3.15E+11
Annual
Table A5-A3. Annual Energy Consumption, Industrial Motors, NEMA Premium scenario
Energy Consumption, NEMA Premium scenario Size Cl
nsumption
ass Unit Operating hours (1)
Loading (2)
Efficiency (5)
Unit Energy Consumption
Number of Motors (6)
Annual Energy
CoHP Hours /
Year Percent Percent kWh / Year kWh / Year
1 to 5 2745 56.6 87.5 3.97E+03 7306080 2.90E+10 5 to 20 3391 51.7 91.25 1.79E+04 3288035 5.89E+10 20 to 50 4067 57.1 93.75 6.47E+04 1129527 7.31E+10 50 to 100 5329 52.2 94.95 1.64E+05 363940 5.97E+10 100 to 200 5200 66.1 95.6 4.02E+05 220908 8.89E+10 Totals 6.53E+05 1.23E+07 3.10E+11
5-13

5-14
Table A5-A4 Savings comparison: EPACT vs. NEMA Premium, Industrial Motors
EPACT vs. NEMA Premium Absolute Savings comparison Size Class EPACT Savings NEMA Premium
Savings Benefit
HP kWh kWh kWh 1 to 5 1.09E+09 1.95E+09 8.54E+08 5 to 20 1.91E+09 3.23E+09 1.32E+09 20 to 50 1.65E+09 3.04E+09 1.39E+09 50 to 100 1.36E+09 2.25E+09 8.93E+08 100 to 200 1.99E+09 2.98E+09 9.87E+08 Totals 8.01E+09 1.35E+10 5.44E+09 Notes:
(2) Expecte ues based on Tabl “Loadi r,” OIT-2002, p. 46. istribution’ of loading leve ss, it lists
tors loaded less than 40%, 40-120%, or above 120%. The values we value of the lo assumi
ree load level classes. Also, w that motors were never their rated load.
( 02, Table 2-10, p. 65, 1800 R idrang very fine-grained, 1-1.5 HP, 1.5-2HP, etc. We picked a representative efficiency from the
(4) Efficiency standards for 4 pole (1800 RPMS) ODP motors. The EPACT efficiencies for the low and high end of the HP ranges were averaged to produce the EPACT efficiency number.
(5) Efficiency standards for 4 pole (1800 RPMS) ODP motors. The NEMA Premium™ averaged to produce the
OIT-2002, p. 40) to all industrial motors.
(1) OIT-2002, p. B-2 d load val e 1-19, ng by Horsepowe
This table provides a ‘dthe fraction of mo
ls: within each horsepower cla
used are the expected ading, ng that the distribution is uniformwithin each of the thloaded beyond 130% of
e assumed
3) OIT-20 PM, m e value taken (i.e., this table is
middle of our HP size classes.
efficiencies for the low and high end of the HP ranges were NEMA Premium™ efficiency number.
(6) OIT-2002, p. B-2. (7) Relative to 1994 AEC for 1-200HP Industrial motors: 3.81E+11 kWh. This AEC figure
assumes: (a) 1994 AEC for all industrial motors of 6.79E+11 (OIT-2002, p. 1), and (b) we can apply distribution of motor system energy with respect to horsepower size for manufacturing sector motors (

A6.1 Background
In 1987, the National Appliance Energy Conservation Act (NAECA) was signed into law establish rgy effi dard d p ters. As defined by NAECA, a pool heater is “an appliance designed for heating non-potable water contained at atmo including hea ater in swi g pool tubs, and similar application ited to residential gthe general application of NAECA to consumer products only. Pool heaters are a covered product. The energy efficiency descriptor for pool h is the cy. As prescribed by NAECA, all pool heaters must m minimum t al efficiency of 78 percent. Updated
inimum standards for pool heaters were proposed in 1994 but DOE never finalized the
ool Heater Background Data
ing minimum ene ciency stan s for gas-fire ool hea
spheric pressure, ting w mmin s, spas, hot s” (NAECA 1987). This definition is lim as-fired pools and spas by
eaters rmal efficieneet a herm
mproposed standards (DOE 1994). Table A6-1 provides background data on the installed base, annual shipments, lifetime, and national annual energy consumption of pool heaters.
Table A6-1: P
Data type Value1 Source/Comments
Installed Base, million 2.5 Based on historical shipments and ipment lifetime of 1r years equ
Annu n 0.205 DOE 1al Shipments, millio ( 993)
Equipment Lifetime, years 15 OE 1(D 993)
AEC, quad 0.082 ased o sed and stock nnual
B n installed baa energy use
1 Installed base, annual shipment, and values are fo ar 200 AEC r the ye 2.
A6.2 Product Technology Description and Market Presence
gh the pool heater. The pool heater does not store heated water. he heaters are installed on the water line that circulates pool water through the filter. This
r is turned off.
The majority of pool heaters being manufactured consist of finned copper tube heat exchangers are designed for outdoor installation.
e extra baffling on the vent for rotection from the elements. Baseline pool heaters have a standing pilot. Electronic ignition can
it lso
hen
A6 Pool Heaters, Gas
Water is heated as it passes throuTplumbing arrangement avoids an additional pump for the heater. When the circulating pool water temperature is too low, a thermostat turns on the heater. After the pool water reaches the desired emperature, the heatet
in a rectangular combustion chamber. Most pool heatersThe venting is directly out of the combustion chamber, with sompbe used to replace the standing pilot and reduce gas consumption, although the benefit of electronic ignition is not reflected in the thermal efficiency rating. The non-condensing limwas considered to have a thermal efficiency of 80 percent. Two condensing levels were aanalyzed. Table A6-2 summarizes the various efficiency levels considered by DOE in 1994 wupdated minimum efficiency standards were being considered (DOE 1993).
6-1

Table A6-2: Pool Heater Technology Levels and UEC Values
Technology Level Thermal
Efficiency UEC
(MMBtu/yr) Source Baseline 78% 30.5 (DOE 1993)
Electronic Ignition 78% 26.0 (DOE 1993)
Non-Condensing Limit 80% 24.7 (DOE 1993)
Condensing (Induced Draft) 91% 22.4 (DOE 1993)
Condensing (Pulse) 96% (DOE21.2 1993)
esponding to the efficiency levels specified in 6-2. Retail price data were taken from DOE’s 1993 Technical Support Document and
ollars using consumer price index data from the U.S. Dep nt of Labor
Heater Retail Pr
Table A6-3 provides retail price informTable A
ation corr
inflated to 2002 d artme(DOL 2004).
Table A6-3: Pool ices
Technology Level Thermal
Efficiency Retail Price
($2002) Source Baseline 78% $1785 (DOE 1993)
El ronic Ignition 78% $1905 ect (DOE 1993)
Non-Condensing Limit 80% $2080 (DOE 1993)
Condensing (Induced Draft) 91% $3196 (DOE 1993)
Condensing (Pulse) 96% $4318 (DOE 1993)
6.3 Test Procedure Status
12,
able A6-. Also provided in Table A6-4 is the economic benefit or burden to consumers for each
efficiency level. Note that the condensing designs do not yield an economic benefit to consumers. Consumer national utility bill savings for a given year are derived by taking the national annual energy savings and multiplying it by the corresponding electricity price from the
A
The Department adopted a Final Rule of the test procedure for gas-fired pool heaters on May1997 (DOE, 1997).
6.4 Energy Savings Estimates and Calculations A
Table A6-4 presents the energy savings potential for the efficiency levels specified in T2
6-2

DOE-Energy Information Administration’s Annual Energy Outlook 2004 (DOE 2004). onsumer national equipment cost increases are derived by taking the per unit change in
ngs and quipment cost increases are summed over the time period 2010-2035 with the net benefit or
Cequipment cost and multiplying it by the annual shipments. Cumulative bill savieburden being the difference between the two values.12
Table A6-4: Pool Heater Potential Energy Savings and Economic Impact Estimates
Technology
UEC (MMBtu/yr)
Energy Saving Potential, 2010-2035
(quad)
Potential Economic Benefits/Burdens;
Cumulative NPV 2010-2035 (billions of $2002)
Baseline 30.5 NA NA
Electronic Ignition 26.0 0.29 0.40
Non-Condensing Limit 24.7 0.37 0.28
Condensing (Induced Draft) 22.4 0.52 -1.22
Condensing (Pulse) 21.2 0.59 -2.88
6.5 Regulatory Actions and Cumulative Burdens A
n the Fiscal Year 2004 Priority-Setting memorandum, pool hI eaters were listed as a low-priority
ool heating. In particular, there is a DOE program called “Million Solar Roofs” which has
in solar pool heating systems: “The most cost-
effective use of solar energy today is to heat swimming pools. Swimming pools require low temperature heat which is where solar collectors are most efficient.” Because the market share of solar pool heating is growing, it will tend to reduce the savings from gas-fired pool heater standards below what are provided here (Table A6-4).
product (DOE 2003). No significant changes have occurred since then.
A6.6 Issues Impacting Potential Energy Efficiency Standards
Although not directly impacting gas-fired pool heaters, DOE actively promotes the use of solar presulted in increased use of solar pool heating (DOE 2004b). DOE also provides consumer guides detailing the benefits of solar pool heating (DOE 2004c). For example, DOE states their Energy Smart Management website for
12 Economic calculations are performed with a spreadsheet tool which is available on the DOE Building Technologies Program, Appliances and Commercial Equipment Standards web site. http://www.eere.energy.gov/buildings/appliance_standards/docs/fy05_priority_setting_spreadsheets.zip
6-3

6-4
ational Appliance Energy Conservation Act (NAECA), 1987, Pub. L. 100-12
r
ency and
ipment, and Pool Heaters." Federal
4
References
N U.S. Department of Energy (DOE)-Office of Codes and Standards, 1993. “Technical Support Document: Energy Efficiency Standards for Consumer Products: Room Air Conditioners, WateHeaters, Direct Heating Equipment, Mobile Home Furnaces, Kitchen Ranges and Ovens, Pool Heaters, Fluorescent Lamp Ballasts & Television Sets.” Washington, DC DOE/EE-0009, Volume G. U.S. Department of Energy (DOE)-U.S. Department of Energy-Office of Energy EfficiRenewable Energy. 1994. “Energy Conservation Program for Consumer Products; Proposed Rule.” Federal Register 59 (43): 10464-10532. U.S. Department of Energy (DOE)-U.S. Department of Energy-Office of Conservation and Renewable Energy. 1997. "Energy Conservation Program for Consumer Products: Test
rocedures for Furnaces/Boilers, Vented Home Heating EquPRegister 62 (91): 26140-26165. U.S. Department of Energy (DOE)-Building Technologies Program. 2003. “Fiscal Year 200Priorities for the Appliance Standards Rulemaking Process.” Available online: http://www.eere.energy.gov/buildings/appliance_standards/pdfs/october_memo.pdf U.S. Department of Labor (DOL), Bureau of Labor Statistics. 2004. Consumer Price Index-All Urban Consumers. Available online: http://www.bls.gov/cpi/ U.S. Department of Energy (DOE), Energy Information Administration. 2004a. “Annual Energy Outlook 2004 with projections to 2025.” Washington, DC. DOE/EIA-0383(2004). January 2004. U.S. Department of Energy (DOE), Energy Efficiency and Renewable Energy. 2004b. “MillionSolar Roofs: A Technology
Success Story”.
http://www.millionsolarroofs.com/articles//static/1/binaries/ChristyMSRIPresentation0703.pdf U.S. Department of Energy (DOE), Energy Efficiency and Renewable Energy. 2004c. “Reduce Swimming Pool Energy Costs”, Energy Smart Management: Solar Pool Heating Systems. http://www.eere.energy.gov/rspec/solar.html

A7.1 Backgroun
Refrigerators, refrigerator-freezers, and freezers are major ho for the refrigerated storage efrigerato sists gned for t s tures e 0°C ow 3.9°C (39°F), configured for general refrigerated food storage, and having a source ofsing alterna rgy inpu nly. A refrigerator may include a compartment for the storage of food at temperatures below 0 de a separate low temperature compartment designed for freezing ood at temperatures below -13.3°C (8°F) er is a cab t whicompartment designed for the refrigerated storage of food at 2°F) and at le ther co he freezing and storage of food at temperatures below -13.3°C (8°F) cabinet for the storage and freezing of foods at -17.8°C (0°F) or belo igerators are defined by the DOE as having less than a 7.75 cubic foot capacity and 36 in In 1987, the National Appliance Energy Conservation Act (NAECA) was signed into law estab inimu dards frige tor-freezers, and freez elve A specified the m lowable energy in kilowatt-hours per year for prSubsequent to the NAECA requirements, a new set of minim me effective first in 1993 then again in 2001 (DOE 1997). The new mn 19 y by 25 to 30 percent relative
the NAECA requirements. The minimum efficiency standards that became effective on July 1, 2001 increase the efficiency of the most popular product class, top mount refrigerator-freezers
ta ers,
A7 Refrigerators and Refrigerator-Freezers, Freezers, and Compact Refrigerators
d
usehold appliances designed of a refrigerated cabinet desiof food products. A r r con
he refrigerated
le phase,
torage of food at tempera abov (32°F) and bel refrigeration requiring
ting current electric ene t o°C (32°F), but does not provi and storage of f
. A refrigerator-freez ine ch consists of at least one temperatures above 0°C (3
ast one o mpartment designed for t. A freezer consists of aw. Compact refr
ches or less in height.
lishing mers. For tw
m energy efficiency stan for re rators, refrigera product classes, NAEC
oducts manufactured on or afteaximum al
r January 1, 1990 (NAECA 1987). um efficiency standards beca
inimum efficiency standards ito
93 eliminated 99 percent of the models and increased efficienc
with auto-defrost, by approximately 30 percent relative to the 1993 standards.
Table A7-1 provides background data on the installed base, annual shipments, lifetime, and national annual energy consumption for refrigerator-freezers and freezers. The background daare divided into three categories: standard size refrigerators and refrigerator-freezers, freezand compact refrigerators.
7-1

Table A7-1: Standard Refrigerator, Freezer, and Compact Refrigerator Background Data
Type Data type Value1 Source/Comments
Installed Base, millions 142 equipment lifetime of 19 years Based on historical shipments and
Annual Shipments, millions 9.74 (Appliance 2004)
Equipment Lifetime, years 19 (DOE 1995)
Refrigerator & Refrigerator-Freezers
Based on installed base and stock AEC, quad 0.86 annual energy use
Installed Base, millions 29 Based on historical shipments and equipment lifetime of 19 years
Annual Shipments, millions 1.49 (Appliance 2004)
Equipment Lifetime, years 19 (DOE 1995) Freezers
AEC, quad 0.14 Based on installed base and stock annual energy use
Installed Base, millions 12 Based on historical shipments aequipment lifetime of 19 years
nd
Annual Shipments, millions 1.40 (Appliance 2004)
Equipment Lifetime, years 11 (DOE 1995) Compact Refrigertors
AEC, quad 0.04 Based on installed base and stock annual energy use
1 Installed base, annual shipment, and AEC values are for the year 2002.
A7.2 Product Technology Description and Market Presence
Technology for improving refrigerator and freezer performance include: using more efficient compressors, reducing the power consumption of fans, using smart defrost technology to minimize the amount of defrost that is needed and adding insulation. The saturation of refrigerators/refrigerator-freezers was 96 percent in 2001, based on the number of households with at least one refrigerator (AHAM 2003). The sales of compact refrigerators have increased appreciably in the last several years. While most seem to be sold to residential consumers, significant amounts are also prevalent in non-residential applications such as hotels, dormitories and offices. The Federal Energy Management Program (FEMP), ENERGY STAR®, and the Consortium for Energy Efficiency (CEE) specify voluntary efficiency requirements for refrigerators, refrigerator-freezers, and freezers (FEMP 2004; ENERGY STAR® 2004; CEE 2004). FEMP provides efficiency targets only for standard size refrigerator-freezers. For example, for top-mount refrigerator-freezers with auto-defrost, the specified annual energy use reduction target is four percent lower than the current minimum standard. FEMP is in the process of revising its purchasing recommendations for refrigerators, in order to be in alignment with ENERGY STAR® specifications. The difference between FEMP and ENERGY STAR® will be that while
7-2

ENERGY STAR® specifies an efficiency curve, FEMP divides recommendations into bins based on capacity and reports their recommincr ENERG ies annual e duc ets of 15, 10, and 20 percent for
e refrigerator-freezers, freeze p rs respectively. CEE targets ator-freezers. CEE specifie evels specifying annual energy
s of 20, 25, and 30 pe relativ inimum efficiency standards.
efficiency erator uged somewhat by meeting the ENE STAR ations and CEE tier levels. The reports that 25 p t of sal rator products over 6.5 cu. ft. in STAR® levels (AHAM 2003). On January 1, 2004, the ENERGY
u. ft in capacity). For top-ls currently meet
NERGY Sr ENERGY STAR® 2004). All single-door refrigerator models meeting ENERGY STAR® have volumes less than 7.75 cu.ft., qualifying them as compact refrigerators. According to information compiled by ENER meet the CEE tier levels. Over 50 refrigerato e., energy use of 20 to 25 percent lower than existing minimum standards), five models lie between the second and third CEE tier gy use of 25 t lo ting minimum standards), and
ave lower energy consumpti an the t level (ENERGY STAR®
ables A7-2 through A7-4 provide the UEC values corresponding to various efficiency levels of standard-size refrigerator-freezers, freezers, and compact refrigerators.
endations in kWh/year rather than as a percentage ease in efficiency.
Y STAR® specif nergy use re tion targstandard siz rs, and com act refrigeratoonly standard-size refriger s three tier luse reduction target rcent e to current m The market presence of higher refrig s and freezers can be gathe number refrigerators RGY ® specificAHAM 2003 Fact Book ercen es of refrigecapacity meet ENERGYSTAR® criteria changed for all full size refrigerators (above 7.75 cmount refrigerator-freezers with volumes between 16.5 to 18.4 cu. ft., 33 modethe ENERGY STAR® criteria. For chest freezers, twelve models currently meet the E
TAR® criteria; however, none were in the 22.5 to 24.4 cu. ft. range. For single-door efrigerators, 23 models currently meet the ENERGY STAR® criteria (
GY STAR®, several refrigerator-freezer modelsr-freezer models lie between the first two CEE tier levels (i.
levels (i.e., ener to 30 percen wer than exissix models h on th hird CEE tier 2004). T
7-3

Table A7-2: Standard-Size Refrig reezer vels and UEC Values erator-F Technology Le
Technology Level UEC1
Sou( kWh/year) rce Typical New 552 (AHAM 2003)
Minimum Efficiency Standard 4842 (DOE 1997)
FEMP3 (4% decrease) 530 (FEMP 2004)
ENERGY STAR® (15% decrease) 469 (EN 2004) ERGY STAR®
CEE Tier 1 (20% decrease) 442 (CEE 2004)
CEE Tier 2 (25% decrease) 414 (CEE 2004)
CEE Tier 3 (30% decrease) 338 (CEE 2004) 1 UEC values are a shipment-weighted average of all standard-size refrigerator-freezers. 2 Mi erator-freezer with auto defrost, 21.4 cu. ft. adjusted volume. 3 FEMP is in the process of revising its purchasing recommendations for refrigerators, in order to be in alignment
with ENERGY STAR® specifications. erence b nd ENERGY STAR® will be that while ENE an effic MP di men to bins based on capacity and
commendations in kWh/ye er than as a ge inc .
nimum standard for top- mount refrig
The diff etween FEMP aRGY STAR® specifies iency curve, FE vides recom dations in
reports their re ar rath percenta rease in efficiency
Table A7-3: Freezer Technology Levels and UEC Values
Technology Level UEC1
( kWh/year) Source Typ 4 (AHAM 2003) ical New 44
ENERGY STAR® (10% decrease) 40 NERGY STAR® 2004) 0 (E1 UEC -weighte freez values are a shipment d average of all ers.
Table A7-4: Compact Refrigerator nology Leve EC V Tech ls and U alues
Technology Level UEC1
( kWh/year) Comment/Source Typical New 300 (AHAM 1996)
ENERGY STAR® (20% decrease) 240 (ENERGY STAR® 2004) 1 UEC values are a shipment-weighted average of all compact refrigerators. Tables A7-5 through A7-7 provide retail price information corresponding to the efficiency levels
ecified in Tables A7-2 through A7-4. Retail price data for typical new standard-size sprefrigerator-freezers and freezers are provided by AHAM in their 2003 Fact Book (AHAM 2003). A representative retail price for a typical new compact refrigerator was obtained from a retailer website (WalMart 2004). Retail prices are generated for high efficiency levels from the percentage price increases indicated by the price versus efficiency relationships in DOE’s 1995 refrigerator Technical Support Document (TSD) (DOE 1995).
7-4

Table A7-5: Standard-Size Refrigerator-Freezer Retail Prices
Technology Level UEC
( kWh/year) Retail Price
($2002) Source Typical New 552 $788 (AHAM 2003)
FEMP (4% decrease) 530 $796 (DOE 1995)1
ENERGY STAR® (15% decrease) 469 $856 (DOE 1995)1
CEE Tier 1 (20% decrease) 442 $903 (DOE 1995)1
CEE Tier 2 (25% decrease) 414 $961 (DOE 1995)1
CEE Tier 3 (30% decrease) 338 $1031 (DOE 1995)1
1 Price vs. efficiency relationship, top-mount refrigerator-freezer with auto-defrost, Table 4.1.
Table A7-6 Freezer Retail Prices
Technology Level UEC
( kWh/year) Retail Price
($2002) Source Typical New 444 $405 (AHAM 2003)
ENERGY STAR® (10% decrease) 400 $415 (DOE 1995)1
1 Price vs. efficiency relationship, chest manual defrost freezer, Taefficiency range.
ble 4.8, baseline to design option 2
Table A7-7: Compact Refrigerator Retail Prices
Technology Level UEC
( kWh/year) Retail Price
($2002) Source Typical New 300 $125 (WalMart 2004)
ENERGY STAR® (20% decrease) 240 $131 (DOE 1995)1
1 Price vs. efficiency relationship, compact manual defrost refrigerator, Table 4.9.
A7.3 Test Procedure Status
Standard-size refrigerators, refrigerator-freezers, freezers, and compact refrigerators are all covered under the same DOE test procedure. They are tested at an ambient temperature of 90°F while internal volume temperatures are kept within specified temperature conditions. DOE has recently taken action on a couple of issues regarding the test procedure. Also, there have been recent actions to improve AHAM’s test standard. The National Institute of Standards and Technology (NIST) has investigated the possibility of harmonizing the U.S. test procedure with international test standards. All of these recent actions are described in more detail below.
7-5

Credit for a more efficient defrost system DOE issued a direct final rule, which became effective in May 2003, amending the calculation of
its (DOE 2003). This change gives le of detecting frost so that the defrosting occurs other than during a
ompressor-on cycle, thereby saving energy by taking advantage of the natural warming of the
.
em less
n was to exclude wine coolers from the energy efficiency regulation (DOE 2001). This rule may also affect other compact refrigerators designed to store and cool beverages other than wine. For example, since the time of the test procedure revision, a new pro and wine cooler whose performance cannot be rated by the existing test procedure. Repeatability issues for testing compact refriBecause s in te for comp tio titute of Stan estigated repeatability and reproducibility issues and published a report entitled “Repeatability of Energy Consumption Test Results for Compact Refrigerators”. In addition, NIST participated in a task force formed by the Association of Hom acturers (AHAM) to revise their AHAM HRF-1 test procedure. The latest version of AHAM’s test procedure is now AHAM HRF-1, 2003. But the existing DOE test procedure still references an older version of the AHAM test procedure, AHAM HRF-1, 1979 y need to amend the test procedure to reference the most recent version of AHA . Harmonizing with international standards NIST has done comparisons between ISO’s international test standards and the North American test standard. The two test procedures are similar but not identical. Differenc clude the amb ich the refrigerators are tested and the ISO specified test load. There is so t in harmonizing and unifying the two test procedures by manu rers interested in internatio ecently, the United States, Canada, and Mexico have harmonized their test
the test time period for “long-time” automatic defrost uncredit for a control capabcevaporator during the compressor-off cycle. This revision has no effect on the testing of refrigerators and refrigerator-freezers that do not employ a long-time automatic defrost system Change in electric refrigerator definition to exclude wine coolers Several manufacturers of wine coolers requested exemptions from the refrigerator energy efficiency standards. Some wine coolers are made with glass front doors, which make thenergy efficient than standard refrigerators. As a result, the DOE amended the definition of “electric refrigerator”, effective December 19, 2001, to include a maximum temperature of the fresh food storage compartment, and to exclude certain appliances whose physical configuration makes them unsuitable for general storage of perishable foods. The purpose of the revised electric refrigerator definitio
duct has entered the market that is both a compact refrigerator
gerators act refrigerators, the Na of inconsistencie st results nal Ins
dards and Technology (NIST) inv
e Appliance Manuf
. DOE maM HRF-1
es inient temperature at whme interes factu
nal trade. Rprocedures.
7-6

A7.4 Energy Savings Estimates and Calculations
Table A7-8 presents the energy savings potential for the FEMP, ENERGY STAR®, and CEE efficiency levels specified in Tables A7-2 through A7-4. Also provided in Table A7-8 ieconomic benefit or burden to consumers for each efficiency level. Note that only the FEMP and ENERGY STAR® efficiency levels yield an economic ben
s the
efit to consumers. Consumer ational utility bill savings for a given year are derived by taking the national annual energy
savings and multiplying it by the corresponding electricity price from the DOE-Energy Information Administration’s Annual Energy Outlook 2004 (DOE 2004). Consumer national
ipment cost and multiplying it by the annual shipments. Cumulative bill savings and equipment cost increases are
mmed over the time period 2010-2035 with the net benefit or burden being the difference
n
equipment cost increases are derived by taking the per unit change in equ
subetween the two values.13
Table A7-8: Refrigerator Potential Energy and Economic Impact Estimates
Technology Level UEC
(kWh/yr)
Potential Economic Benefits/Burdens; Cumulative Energy Saving
Potential, 2010-2035 (quads)
NPV 2010-2035 (billions of $2002)
Standard-Size Refrigerator-Freezers
Base Case 552 NA NA
FEMP 530 0.77 1.00
ENERGY STAR® 469 2.89 0.52
CEE Tier 1 442 3.85 -1.28
CEE Tier 2 414 4.82 -4.07
CEE Tier 3 386 5.78 -7.85
Freezers
Base Case 444 NA NA
ENERGY STAR® 400 0.38 0.61
Compact Refrigerators
Base Case 300 NA NA
ENERGY STAR® 240 0.48 0.87
13 Economic calculations are performed with a spreadsheet tool which is available on the DOE Building Technologies Program, Appliances and Commercial Equipment Standards web site. http://www.eere.energy.gov/buildings/appliance_standards/docs/fy05_priority_setting_spreadsheets.zip
7-7

A7.5 Regulatory Actions and Cumulative Burden
or full line manufacturers of white goods, consideration needs to be given to what other
lso, refrigerator manufacturers had to recently comply with U.S. EPA regulations on the phase-
onsideration given to updated minimum efficiency requirements needs to account for the effort
. This set of as faced since
Fregulatory actions are in effect for other products. Aout of HCFC-141b in 2003, the blowing agent that was used for foam insulation. Any cand cost manufacturers expended for meeting this regulation.
A7.6 Issues Impacting Potential Energy Efficiency Standards
DOE’s most recent energy efficiency standards became effective on July 1, 2001tandards is the third set of minimum efficiency requirements that the industry hs
1990. The first set of standards took effect in 1990 and the second set in 1993. Wine cooler and beverage centers as well as combination refrigerator/beverage coolers, need
efinitions and possible test procedures and standards. d Compact refrigerators are a fast growing part of the overall refrigerator market. Thus, due to their increased national energy consumption, potential energy savings could become greater in the future.
7-8

7-9
ppliance Magazine. 2004. “Healthy Times Ahead.” January, 2004.
onsortium for Energy Efficiency (CEE). 2004. www.cee1.org
References
A Association of Home Appliance Manufacturers (AHAM). 1996. Data on compact refrigerators. Chicago, IL. Association of Home Appliance Manufacturers (AHAM). 2003. “Fact Book 2003.” Chicago, IL. C ENERGY STAR®. 2004. www.energystar.gov Federal Energy Management Program (FEMP). 2004. http://www.eere.energy.gov/femp/technologies/eeproducts.cfm National Appliance Energy Conservation Act (NAECA), 1987, Pub. L. 100-12 U.S. Department of Energy (DOE)-Office of Codes and Standards, 1995. “Technical Support Document: Energy Efficiency Standards for Consumer Products: Refrigerators, Refrigerator-Freezers, & Freezers .” Washington, DC. DOE/EE-0064. U.S. Department of Energy (DOE)-Office of Energy Efficiency and Renewable Energy. 1997.
Federal Register 62 (81): 23102-3116.
U.S. Departm“Energy Conservation Program for Consu oducts: Am efinition of Electric Refrigerator; Final Rule.” Federal Register (223): 57845 U.S DOE)-Office of Energy Efficie able Energy. 2003. “Energy Conservation P fo es Refrigerators and Refrigerator-Freezers; Direct Final Rule.” Federal Register 68 (45): 10957-10961. U.S nt of Energy (DOE), Energy rmation Ad nergy Out anuary 004
WalMart. 2004. Retail price for a Haier 4.2 cu.ft. compact refrigerator. March, 2004. www.walmart.com
“Energy Conservation Program for Consumer Products: Energy Conservation Standards for Refrigerators, Refrigerator-Freezers and Freezers; Final Rule.”2
ent of Energy (DOE)-Office of Energy Efficiency and Renewable Energy. 2001. mer Pr endment to the D
66 -57848.
. Department of Energy (rogram
ncy and Renewt Procedure forr Consumer Products: T
. Departme Info ministration. 2004. “Annual Elook 2004 with projections to 2025.” Washington, DC. DOE/EIA-0383(2004). J. 2

A8.1 Background
A room air conditioner is an encased assembly designed as a unit to be mounted in a window or rough a wall that provides cool or warm conditioned air to an enclosed room or space. In 1987,
itioners (NAECA 1987). The energy fficiency descriptor for room air conditioners is the energy efficiency ratio (EER). The EER is
e
eating through heat pump operation).
only units equipped with louvered sides
nd ranging in capacity from less than 6000 Btu/hr to 20,000 Btu/hr. The second set of standards
, annual shipments, lifetime, and ational annual energy consumption of room air conditioners.
ththe National Appliance Energy Conservation Act (NAECA) was signed into law establishing minimum energy efficiency standards for room air condethe ratio of the cooling capacity (in Btu/hr) to the input power (in Watts). Minimum EER standards were first prescribed by NAECA and went into effect on January 1, 1990 ranging from 8.0 to 9.0 EER depending on the product class. A total of twelve product classes were established by NAECA based on the cooling capacity of the unit, the presence oflouvered sides (to enhance air flow over the outdoor coil), and the presence of a reversing valv(to allow the unit to provide space-h A second set of revised minimum efficiency levels went into effect on October 1, 2000 raising the minimum efficiency standards for the most popular product classes to 9.7 or 9.8 EER (DOE1997). The most popular product classes are cooling-aalso established minimum efficiency requirements for four additional product classes, two of which explicitly accounted for units designed for mounting in casement windows. Table A8-1 provides background data on the installed basen
Table A8-1: Room Air Conditioner Background Data
Data type Value1 Source/Comments
Installed Base, millions 57 Based on historical shipments and equipment lifetime of 13 years
Annual Shipments, millions 6.15
6.06 (year 2006 forecast) (Appliance 2004)
Equipment Lifetime, years 13 (DOE 1997a)
AEC, quad Based on installed based and stock 0.33 annual energy use 1 Installed base, annual shipment, and AEC values are for the year 2002 except where noted.
A8 Room Air Conditioners
8-1

A8.
air conditioner eff ies are typically ieved the performance of
s, compressor, fan motor, and fans.
Heat exchanger performanc d by one or more of the following methods: increased additi ws, inc ed fin esign,
improved tube design, and adding a er coil. Most, if not all onditioners, co drips off the indoor evaporator coil into a pan
beneath the outdoor condenser coil. The condensate is sprayed on to the condenser coil via a attached to the c e of the con r fan the heat exchanger
ce of the con
s with efficiencies of up to 11.0 EER
f ot utilized in room air conditioners.
EN nergy Efficiency (CEE) specify voluntary EER requirements for room air conditioners (ENERGY STAR® 2004; CEE 2004). CEE’s efficiency targets of greater than 11.0 EER seem to be quite as acco ciation of
anufacturer AM) 2003 D of C nditioners, can meet CEE’s EE ecifications. H r, th models meeting the
® voluntar requirements of 10.7 and 10.8 EER for units with capacities of less than 8-2 provides the EER and UEC values
ing to various typeration per 750 hours in DOE’s test procedure. The 533 hour
value is based on more recent data from the 1997 Technical Support Document for room air rs (DOE 199
2 Product Technology Description and Market Presence
Higher room icienc ach by improvingthe heat exchanger
e is improvefrontal coil area, onal refrigerant tube ro
sub-cooler to the outdoor condensreas density, improved fin d
room air c llect the condensate that
slinger ringperforman
ircumferenc dense to improvedenser coil.
Room air conditioners typically use rotary-type compressorat standard rating conditions. Most units utilize a permanent split capacitor (PSC) fan motor to drive both the evaporator blower and condenser fan. Designs that improve the seasonal or cyclic performance of the unit, such as variable speed or multi-speed compressors, variable-opening expansion devices, and advanced control systems, typically do not improve the steady-state efficiency or EER of the unit. Therefore, these types odesigns are typically n
ERGY STAR® and the Consortium for E
aggressive,irectory
rding to the Assoed Room Air CoH
few models ome Appliance M s’ (AH ertifi
ere are severalR sp oweveENERGY STAR y efficiency
20,000 Btu/hr. Table Acorrespondhours of op
es of room air conditioners. Note that the UEC is based on 533 year as opposed to the
conditione 7a).
8-2

Table A8-2: Room Air Conditioner Technology and UEC Values
Technology Level EER UEC1
(kWh/yr) Source Typical New 9.75 536 (AHAM 2003)
Minimum Efficiency Standard 9.7 to 9.82 538 to 533 (DOE 1997)
ENERGY STAR® 10.7 to 10.82
(10% efficiency increase) 486 (ENERGY STAR® 2004)
CEE Tier 1 11.2 to 11.32
(15% efficiency increase) 465 (CEE 2004)
CEE Tier 2 11.6 to 11.82
(20% efficiency increase) 445 (CEE 2004)
1 Based typical new cooling capacity of 9800 Btu/hr and 533 hours of operation. 2 Corresponds to units with cooling capacities less than 20,000 Btu/hr. Table A8-3 provides retail price information corresponding to the EER levels specified in Table
8-2. RetaARetail prices are generated for high EER levels
il price data for a typical new unit is provided by AHAM in their 2003 Fact Book. from the percentage price increases indicated by
the price versus efficiency relationship in DOE’s 1997 room air conditioner TSD for units with ouvered sides, and without reversing
valves (DOE 1997a). cooling capacities between 8000 to 14,000 Btu/hr, with l
Table A8-3: Room Air Conditioner Retail Prices
Technology Level EER Retail Price
($2002) Comment/Source Typical New 9.75 $322 (AHAM 2003)
ENERGY STAR® 10.7 to 10.82
(10% efficiency increase) $357 (DOE 1997)1
CEE Tier 1 11.2 to 11.32
(15% efficiency increase) $460 (DOE 1997)2
CEE Tier 2 (20% efficiency increase)
$520 (DOE 1997)211.6 to 11.82
1 Price vs. efficiency relationship, 8000 to 14,000 Btu/hr with louvered sides, without reversing valve, Table 4.4, 9.3 to 11.0 EER efficiency range.
2 Price vs. efficiency relationship, 8000 to 14,000 Btu/hr with louvered sides, without reversing valve, Table 4.4, greater than 11.0 EER efficiency range.
8-3

A8.3 Test Procedure Status
The cedure for room conditioners references ASHRAE Standard 16-69, Method of Te oom Air Conditioners. While the ASHRAE Standard has been revised in 1983 and reaffirmed in 1999, the DOE test procedure references the 1969 version. The changes made to ASHRAE Standard 16-69 since 1969 have b ditorial (i.e., to clari guage for
terpretive purposes). Thus there are no substantive technical differences between the 1969 and
dards published on September 24, 1997,
the Department recognizes that the current test procedure is not adequate for determining the enefits due to designs that improve seasonal or cyclic performance, such as variable speed
gy savings and multiplying it by the corresponding the DOE-Energy Information Administration’s Annual Energy Outlook
2004 (DOE 2004). Consumer national equipment cost increases are derived by taking the per ents. Cumulative bill
savings and equipment cost increases are summed over the time period 2010-2035 with the net enefit or burden being the difference between the two values.14
DOE test pro air sting for Rating R
een e fy lanin1999 versions.
In DOE’s Final Rule regarding minimum efficiency stan
bcompressors. Although the current test procedure cannot measure the benefits of designs that improve seasonal or cyclic performance, the Department has no plans to revise the test procedure.
A8.4 Energy Savings Estimates and Calculations
Table A8-4 presents the energy savings potential for the ENERGY STAR® and CEE efficiency levels specified in Table A8-2. Also provided in Table A8-4 is the economic benefit or burden to consumers for each efficiency level. Note that only the ENERGY STAR® efficiency level yields an economic benefit to consumers. Consumer national utility bill savings for a given year re derived by taking the national annual enera
electricity price from
unit change in equipment cost and multiplying it by the annual shipm
b
14 Economic calculations are performed with a spreadsheet tool which is available on the DOE Building Technologies Program, Appliances and Commercial Equipment Standards web site. http://www.eere.energy.gov/buildings/appliance_standards/docs/fy05_priority_setting_spreadsheets.zip
8-4

Table A8-4: Room Air Conditioner Potential Energy Savings and Economic Impact Estimates
Technology Level UEC
(kWh/yr)
Potential Economic Benefits/Burdens; Cumulative Energy
Savings Potential, 2010-2035 (quads)
Cumulative NPV 2010-2035 (billions of $2002)
Typical New 536 NA NA
ENERGY STAR® 486 0.80 0.03
CEE Tier 1 465 1.15 -4.14
CEE Tier 2 445 1.47 -6.29
A8.5 Regulatory Actions and Cumulative Burden
The U.S. Environmental Protection Agency is phasing out the use of R-22 in 2010 for use in neappliances. R-22 is a hydrochlorofluorocarbon that has been found to contribute to atmospheric ozone depletion. Because R-22 is the refrigerant used in room air conditioners, the industry mfind a replacement. The central air c
w
ust onditioning and heat pump industry is also faced with the
me environmental regulation. As a result, this industry has identified two replacements: R-
oning and heat pump industry. But because R-410a has properties that result in higher compressor discharge pressures, equipment may have to be redesigned to accommodate this refrigerant. It is still uncertain which refrigerant the room air conditioner industry will choose to replace R-22. Regardless of the choice, room air conditioner designs will likely change to accommodate the new refrigerant as well as maintain equipment efficiencies in order to meet current minimum efficiency requirements.
A8.6 Issues Impacting Potential Energy Efficiency Standards
The largest single issue facing the industry is the phase-out of R-22. As noted earlier, manufacturers will likely need to redesign their units to accommodate the new refrigerant while preventing any degradation in equipment efficiency.
sa410a and R-407c. Although R-407c can be used as a “drop-in” replacement, it tends to degrade the efficiency of the equipment. Thus, R-410a seems to be the likely choice by central air conditi
8-5

8-6
References
004. “Healthy Times Ahead.” January, 2004. Appliance Magazine. 2
Association of Home Appliance Manufacturers (AHAM). 2003. “Fact Book 2003.” Chicago, IL. Consortium for Energy Efficiency (CEE). 2004. www.cee1.org ENERGY STAR®. 2004. www.energystar.gov National Appliance Energy Conservation Act (NAECA), 1987, Pub. L. 100-12
U.S and Renewable Energy. 1997. “Energy Conservation Program for Consumer Products: Conservation Standards for Room Air Conditioners; Final Rule.” Federal Register 62 ( -50
(DOE)-Office of Codes and Standards, 1997a. “Technical Support y Conservation Standards for R ir Condi ners, Volu – Detailed
Levels (Docket Numbers EE-RM-90-201 & EM-RM-93-801-RAC).” mber, 1997.
ergy Information Administration. 2004. “Annual Energy rojections to 2025.” Washington, DC. DOE/EIA-0383(2004). January
. Department of Energy (DOE)-Office of Energy Efficiency
185): 50122 150. U.S. Department of EnergyDocument for Energ oom A tio me 2Analysis of EfficiencyWashington, DC. Septe U.S. Department of Energy (DOE), EnOutlook 2004 with p2004.

A9.1 Background
External power supplies and battery chargers are used by many types of consumer electronic and
ce ble shows products used in
oth the residential and commercial sectors.
electrical devices. In some products, the battery charger and power supply are integrated within the electronic or electrical device. For other products, the battery is integrated into the device (e.g., cell phones) and an external power supply is used to charge the battery. Table A9-1 provides background data on battery chargers and external power supplies collected by LawrenBerkeley National Laboratory (LBNL) and Ecos Consulting. The tab
Table A9-1: Background Data on Battery Chargers and Power Supplies
Device Total in Use
(millions) Lifetime (years)
Sales in 2002 (millions)
Electronic Musical Instruments 10.00 6 1.67 Digital camera charger 10.75 6 4.50 Answering Device 47.00 6 5.64 Phone: Conference Phone 1.15 6 0.16 Phone: Cordless 128.40 6 31.27 Phone: Cordless/Answering Machine Combo 76.94 6 15.10 Phone: Other Powered 10.27 5 1.47 Phone: Wireless 140.80 2 57.00 CFL Desk Lamp 0.43 7 0.61 Low-voltage halogen lighting 25.00 7 3.57 Rechargeable Appliances 23.15 4 5.79 Security Systems, Home 3.20 10 0.32 Battery Chargers 8.00 4 2.00 Handheld Computers 8.24 4 2.06 Portable Computer 49.43 4 10.90 Desktop Calculators 40.00 6 6.67 Dictation Equipment Desktop 1.71 6 0.28 Dictation Equipment Portable 2.70 6 0.45 Computer Speakers 59.62 4 20.08 External Modems 5.16 4 1.29 LCD Computer Monitor, external PS (Commercial/Industrial) 4.35 4 2.30
LCD Computer Monitor, external PS (Residential) 2.25 4 1.13 Multifunction device, Inkjet (External PS) 0.22 5 0.74 Printer, Inkjet, external PS 29.50 5 6.76 Printer, Thermal, external PS 4.91 5 0.70 Broadband Internet Devices Hubs in Ports, External PS 35.81 4 8.95 Broadband Internet Devices LAN 8.31 4 2.08 Broadband Internet Devices Routers, External PS 1.56 4 0.39 Source: All data is extracted from a draft spreadsheet being developed by Ecos Consulting and LBNL. Primary
urces include Appliance Magazine, technical reports, and internal/professional estimates.
A9 Battery Chargers / External Power Supplies
so
9-1

A9.2 Product Technology Description and Market Presence
The distinction between external power supplies and battery chargers is not well defined becafor many products, such as cell phones, the power supply’s function is to charge the battery. For purposes of this a
use
nalysis, if the power supply is physically separated from the battery charger, it referred to as an external power supply. Also for purposes of this analysis, battery chargers
function is to charge batteries. With regard to power supplies, there are both external and internal types. Power supplies provide the function of red 115 volts ost often
irect current (DC) voltage. In other cases, the voltage is simply lternating current (AC) voltage. For this assessment, only external AC to
es are being considered. Draft legislation currently being considered by AC to AC power supplies (often referred to as transformers) which are
tions such as door bells.
e most common type of power supply was the linear . Linear power coil of wire (similar to a transformer) to lower voltage. Recently, a new type of sing electronic circuitry, called a switch mode power supply (SMPS), entered the
ned to be more efficient than linear power supp SMPSs are aller in size and can be made more compatible with different frequencies
hem more suitable for the international market. As a result, SMPSs are widely used in some products. Currently integrated circuit manufacturers sell
hip required for SMPSs to a power supply assembler. Most SMPSs are a, particularly China. The wholesale cost of SMPSs is inally higher than
er supplies. However, because SMPSs are lighter and ler in size, their linear types after factoring in shipping costs. Future road map
Power Sources Manufacturers Association (PS ) presented at the ectronics Conference (APEC) in February 2004, foresees little or no cost
en linear and SMPS power supplies.
ode of the operational modes include: no load (i.e., while
rging a device), active mode (i.e., actively charging a r sleep mode. In many cases, even when the device is drawing full
its full rated capacity. As exemplified by cell the device is used. In the case of cell phones, the
l phone battery, (2) connected cell phone even cell phone,
e the charger or power pply spends under a specific load condition affects its UEC. The output voltage also affects e efficiency of the power supply. A high efficiency power supply is more difficult to anufacture at lower output voltages.
isare defined as a product whose sole
ucing primary voltage from to a lower voltage. Mthis is also converted to a dreduced to a lower aDC power suppliCongress also includesused in applica Up until recently, th typesupplies use a power supply umarket. SMPSs are desig lies. typically lighter and smand voltages making tbecoming morethe power supply cassembled in Asi margthat for linear pow smalcost may be comparable toanalyses sponsored by the MAApplied Power Eldifference betwe
ncy are affected by the operational mUnit energy consumption (UEC) and efficiepes of battery charger or power supply. Ty
t but not chaplugged in a wall sockedevice), and low power oload, the power supply is operating at less than
e affected by howphones, operational modes arpower supply may be: (1) charging the cel to theafter the battery is fully charged, (3) left in the wall socket but disconnected from theor (4) disconnected from the wall socket. Obviously, the amount of timsuthm
9-2

ENERGY STAR® has proposed voluntary efficiency requirements for battery chargers and power supplies. It is estimated that approximately 12 percent of power supplies can meet the
mum limits for both no-load and active modes.
es ranges from 30 to 90 percent with most in the range of 60 to 70 es the typical UECs for the battery charger and power supply
ciencies
Table A9-2: Battery Charger and Power Supply UECs
proposed ENERGY STAR® maxi The efficiency of power supplipercent. Table A9-2 summarizdevices listed in Table A9-1. The UECs are based on a representative distribution of effifor each device.
Device Typical UEC (kWh/yr) Electronic Musical Instruments 29.4 Digital camera charger 7.5 Answering Device 34.5 Phone: Conference Phone 30.8 Phone: Cordless 42.3 Phone: Cordless/Answering Machine Combo 50.6 Phone: Other Powered 34.2 Phone: Wireless 14.2 CFL Desk Lamp 23.2 Low-voltage halogen lighting 29.3 Rechargeable Appliances 16.7 Security Systems, Home 122.6 Battery Chargers 7.5 Handheld Computers 0.3 Portab omputer le C 27.0 Deskto Calculators p 14.0 Dictation Equipment Desktop 0.3 Dictation Equipment Portable 0.1 Computer Speakers 19.6 External Modems 47.3 LCD Computer Monitor, external PS (Commercial/Industrial) 101.2 LCD Computer Monitor, external PS (Residential) 56.0 Multifunction device, Inkjet (External PS) 11.9 Printer, Inkjet, external PS 40.8 Printer, Thermal, external PS 40.8 Broadband Internet Devices Hubs in Ports, External PS 11.0 Broadband Internet Devices LAN 35.0 Broadband Internet Devices Routers, External PS 350.4 Sso
ource: All data is extracted from a draft spreadsheet being developed by Ecos Consulting and LBNL. Primary urces include Appliance Magazine, technical reports, and internal/professional estimates.
9-3

A9.3 Test Procedure Status
Department of Energy (DOE) DOE does not have a test procedure for either power supplies or battery chargers. Draft
gislation being considered by Congress would specify that DOE prescribe by notice and
nvironmental Protection Agency (EPA) & California Energy Commission (CEC)
d several sues that could not be resolved. EPA and the interested parties decided that emphasis should e placed on finalizing a test procedure for external power supplies. The test procedure
measures energy use and efficiency under no-load conditions and at 25, 50, and 75 percent of rated current loading.
At the Applied Power Electronic Conference in February 2004, EPA announced a draft test rocedure and a draft ENERGY STAR® specification for external AC to DC power supplies.
t
isting definitions and test procedures used for easuring energy consumption in standby mode and other modes and assess the current and
projected future market for battery chargers and external power supplies.”
lecomment, definitions and test procedures for the power use of battery chargers and external power supplies, within 18 months after the date of the legislation’s enactment. EThe EPA and the CEC collaborated in developing a test procedure for external power supplies and battery chargers. Contractors developing the test procedures were Ecos Consulting and EPRI-PEAC. In November 2003, EPA vetted the test procedures of both external power supplies and battery chargers to interested parties. The battery charger test procedure haisb
pBattery chargers and power supplies with integrated battery charging circuitry are currently not included in the EPA specifications.
A9.4 Pending Energy Legislation
As noted above, draft legislation is currently being considered by Congress that would establish definitions and establish a schedule for the development of test procedures for external power supplies and battery chargers. The draft legislation defines an external power supply to be an external power supply circuit that is used to convert household electric current into either DC current or lower-voltage AC current to operate a consumer product. The draft legislation defines a battery charger to be a device thacharges batteries for consumer products and includes battery chargers embedded in other consumer products. The legislations also states: “In establishing these test procedures, the Secretary shall consider, among other factors, exm
9-4

9-5
A9.5 International Test Procedures
EPA issued a draft test procedure for external power supplies in February 2004. EPA has not yet issued a test procedure for battery chargers because testing battery chargers would be more com include the type of battery to be charged, th charging anconsum
ecently, EPA distributed to its stakeholders a letter, co-signed by the CEC and representatives f Australia, Brazil, Canada and China, indicating strong international support for a single test
procedure for single voltage external AC/DC power supplies.
European Code of Conduct n testing devices at a 100 percent loading. Standby power test procedures affecting power
st procedure on standby power (IEC 62301) and the U.S. Executive
ngs Estimates and Calculations
The en a distribution of power supply and battery chaassessmdistribution of power supply efficiencies for each device. The distribution of efficiencies was bas oassump ere used in all applications.
gs estimated in Table A9-3 are based on estimating the energy usage in four modes
by
ent of rated output current). Based n the testing, efficiency was found not to vary significantly with load, except at very low loads
or light load conditions). The distribution of efficiencies is based on the models
plex than power supplies. Factors that need to be considered e rates of charging and dis d other factors that influence energy
ption. Ro
Other test procedure activities include voluntary specifications by theosupplies include the IEC teOrder on standby power, recommending standby power consumption under one Watt.
A9.6 Energy Savi
ergy savings potential assessment was based onrger efficiencies representing the range of efficiencies currently on the market. The
ent was based on the size of the power supply used by each device as well as a
ed n a sample tested by Ecos Consulting. Energy savings estimates were based on the tion that 80 percent efficient power supplies w
Energy savinof operation: active, ready, low, and off. Not all devices have all four modes. As noted above,the UEC for a device is also based on a distribution of power supply efficiencies as measuredEcos Consulting. Ecos sorted these power supplies into bins based on their rated output. The power supplies were tested at more than one loading (i.e., perco(e.g., no load Ecos had available to them for testing and is not necessarily representative of a shipment-weighted average of all available power supplies. The lifetime of a power supply is assumed to be at least as long as the product it is used with.

Table A9-3: Battery Charger and Power Supply Savings Potential Estimate
Technology/ Standard Level Energy Saving Potential, 2010-2035 (quads) 80% efficient in active mode 1.8
A9.7
DraPerhaps ntial efficiency standards is the pending energy legi ti and enacted, battery chargers nd power supplies will become covered products. Even if the draft legislation is signed into
need to contend with in trying to regulate these roducts including:
but
• The draft legislation uses the term “consumer” to define power supplies and battery chargers. Clarification is needed whether use of the term consumer excludes commercial sector applications.
• Power quality and power factor issues are not addressed. The power factor and power quality can be significantly lower for SMPSs.
Data needs The high variability in power supply usage as well as the large number of applications greatly affects the certainty of estimated potential energy savings. Thus, additional data need to be collected to better define the overall energy use of power supplies and battery chargers and the savings potential associated with higher efficiency products. EPA actions EPA announced in February 2003 a design competition to take place over the next year. This competition will assist in making information available on the efficiency and cost-effectiveness of various external power supply designs. ENERGY STAR® specifications will also be useful in obtaining more information on efficient power supplies. California Energy Commission The CEC is interested in establishing efficiency standards for both power supplies and battery chargers. But if the pending energy legislation is not approved by Congress, states will not be pre-empted from taking action on issuing efficiency regulations for these products.
Issues Impacting Potential Energy Efficiency Standards
ft Energy Legislation the largest issue impacting pote
sla on currently being considered by Congress. If approved alaw, there are several issues that DOE willp
• The draft legislation specifies the energy measurement for “standby and other modes”does not explicitly define the “other” modes.
9-6

9-7
and Concerns ome stakeholders have recommended that DOE wait until the outcome of the draft energy
ot an independent product. • Power supplies may be external for safety reasons and a regulation may encourage
haracteristics are different for different products. • Chargers have different characteristics based on the type of battery they are charging.
Stakeholder CommentsSlegislation is known before taking any action to cover and regulate these products. At the Technical Workshop on Power Supplies and Battery Chargers in San Francisco on November 7th, 2003, a representative from AHAM provided two lists to participants: one regarding external power supplies and the other on battery chargers. These memos ask the CEC, which is considering the regulation of these products, to consider a list of issues before addressing possible regulations. A sample of the issues listed for external power supplies include:
• External power supplies are n
companies to put them inside a product. • Power supplies are used in a wide variety of applications. Some safety regulations may
affect the power consumption. • Adding a power factor correction lowers the efficiency.
Issues listed for battery chargers include:
• Battery chargers are not a stand-alone, independent product. • Power requirements and stand-by c

A10.1 Background
merchandisers are refrigerated cabinets that hold bottled or
erchant is present. Accordingly, vending gns installed on the front to advertise the product and coin slots and
at
uction and size to reach-in refrigerators. The
of a typical reach-in refrigeraton rage merchandisers is to be able to rapidly “pull down” the
of he u refrigeration systems for beverage merchandisers than
Vending machines and beverage canned beverages at a cool temperature up until the time of purchase by the consumer. The vending machine is designed as self-operating while the beverage merchandiser is designed for use in a restaurant or store where a cashier or mmachines often have bright sidispensers to complete the transaction. The vending machines to be considered are ones thdispense canned beverages, bottled beverages, milk, and juice. Beverage merchandisers usuallyhave a glass door to display the product to the customer. Often, vending machines are sited outdoors at schools, gas stations, etc. On the other hand, most beverage merchandisers are located indoors to discourage theft.
everage merchandisers are very similar in constrBmain visual difference is the glass door on a beverage merchandiser compared to the solid door
r, which allows more heat leak into the case. An important ctional criterion for bevefu
temperature of warm beverages loaded into the merchandiser. For example, one of the largest customers of beverage merchandisers requires beverage merchandisers to bring the temperature
the beverages down to the desired level in a specific amount of time. The glass door and tll down requirement necessitate biggerp
comparably sized reach-in refrigerators. Table A10-1 presents the installed base data for vending machines and beverage merchandisers. There are approximately 3.7 million beverage vending machines and 800,000 beverage merchandisers installed in the US. The annual primary energy consumption of the vending machines and beverage merchandisers equals 0.122 and 0.052 quad, respectively.
Table A10-1: Installed Base Data for Vending Machines and Beverage Merchandisers
Equipment type Data type Value Source Installed Base, thousands (1994) 3,711 Annual Sales, thousands (2001) 353 Equipment Lifetime, years (1994) 7 to 10
Vending Machines
AEC, quad 0.122 Installed Base, thousands (1994) 800 Annual Sales, thousands (2001) 175 Equipment Lifetime, years (1994) 7 to 10
Beverage Merchandises
AEC, quad 0.052
ADL(1996); Appliance Magazine (2002)
A10 Beverage Merchandisers and Beverage Vending Machines
10-1

A10.2 Test Procedure Status
ion
y use is typically expressed in terms of daily power
• American Society of Heating, Refrigeration, and Air-Conditioning Engineers Standard 32.1-s of Testing for Rating Vending Machines for Bottled,
vending
d in a hot environment. In addition, a product temperature of 34° F is specified r packaged beverages. The standard product used in the CAN/CSA C804-96 is a 12 oz. can,
t state energy consumption test that has the same ambient temperature
onditions and a 2° F higher beverage temperature. The product temperature is 36° F and the e
in ASHRAE 32.1-97 test procedure specifies the same
tandard product as CAN/CSA C804-96, a 12 oz. can, but differs in specifying that the machine
cts. However, the recovery test does not include provisions for measuring the energy consumption during the test. The revised version of the ASHRAE 32.1-1997 test procedure has been recommended by the ASHRAE Standards Project Committee 32.1 for publication. This revised version specifies two energy consumption test temperatures - 90˚ F and 75˚ F. While one committee member wanted indoor vending machines to only be tested at 75˚ F, the committee voted to have these machines tested at both 90˚ F and
Neither vending machines nor beverage merchandisers have a DOE test procedure. Discussis provided in the following two subsections.
A10.2.1 Vending Machines or beverage vending machines, energF
consumption (kWh/day) per vendible capacity of the standard product. Two publicly availabletest procedures have been developed for rating refrigerated beverage vending machines, and they are widely used by manufacturers. There are also proprietary test procedures developed by bottling companies to evaluate energy consumption and performance of vending machines. The publicly available test procedures are: • Canadian Standards Association C804-1996 (CAN/CSA C804-96) Energy Performance of
Vending Machines, and
1997 (ASHRAE 32.1-97) MethodCanned and Other Sealed Beverages.
The CAN/CSA C804-96 prescribes standards as well as test procedures for a 24-hour steady-state energy consumption test. The standard rating conditions include an ambient temperature of90° F +/- 1.8° F and a relative humidity of 65% +/- 5%, which corresponds well to amachine installefoand the test procedure specifies that the machine be loaded to the minimum rated capacity, as specified by the manufacturer. The ASHRAE 32.1-97 test procedure is similar to the CAN/CSA C804-96 standard in that iincludes a 24-hour steady-cambient rating conditions are 90° F +/- 1.8° F ambient temperature and 65% +/- 5% relativhumidity. Since the ambient temperature specified is relatively high, it properly represents vending machines installed in a hot environment, such as certain outdoor locations in the summer. This temperature rating condition does not accurately represent machines installed indoor, air-conditioned locations. The sbe fully loaded to capacity. In addition, the ASHRAE 32.1-97 test procedure includes a vend test, where the machine dispenses products at a regular frequency, and a recovery test, where a half empty machine is loaded with warm produ
10-2

75˚ F. The energy consumption test is at steady state and does not include a recovery test. Bottles or cans can be used as the standard test package for the tests.
o publicly available test procedures listed above, there are a number of d
s include a recovery test spe own warm products introduced into the machine. Both the CAN/CSA C804-96 and the ASHRAE 32.1-97 are well-defined, easy to im ent, and have similar rati The A is wi ed in C but not in the US. On the other hand, the ASHRAE 32.1-97 te ure is widely accepted and used by US manufacturers and state agencies. Therefore, it is recommend that the ASHRAE 32.1-97 be used as the foundation for developing a DOE test method for measuring the b ending potential itations of ASHRAE 32.1-97 can be addressed by including provisions to measure the energy consumption during the recovery ifying ambient rating temperatures that are consistent with conditions expected for
A10.2.2 Beverage rs No test procedures specifically target beverage merchandisers. However, the California Energy Commission classifies a beverage merchandiser as a glass door reach-in refrigerator, so it uses the ASHRAE 117 test with their specified product temperatures to test bever chandisers. Although the ASH test includes d openin does not ude uired to pull down the tem s that have just been loaded imerchandiser. It is unclear if the Canadian Standards Association’s CSA C827-98 standard applies to beverage merchandisers. The CSA standard “applies to commercial refrigerator … cabinets that are intended for storing or holding food products and other perishable merchandise” (CSA, 1998). Bottled and canned beverages may not fall under the definition of “food products” and are definitely not perishable. The ASHRAE 117 test with specified beverage temperatures could be an appprocedure for future energy efficiency standards. It includes energy consummode and door openings, a frequent occurr erchandisers. The 75°F ambient temperature used test o is wel d to represent the typical indoor location of a beve andiser. As for the reach-in freezers and refrigerators, the ASHRAE 117 test does not correlate closely with peak load conditions because of its moderate 75°F ambient temperature (relative to hotter temperatures encountered by outdoor units).
In addition to the twproprietary test procedures developed by bottling companies to evaluate energy use anperformance of beverage vending machines. These test procedure
cification that limits the amount of time required for a vending machine to cool d
plemanada, ng conditions. CAN/CS C804-96
s ddely us
t proce
energy efficiency of
test and specthe machine.
everage v machines. The lim
Merchandise
age merthe energy reqnto the
RAE 117 perature of warm beverage
oor gs, it incl
ropriate test ption during standby
ence with beverage m alsin the ASHRAE 117
rage merchl-suite
10-3

A10.3 Energy S timates and Calculations, and Technology D d Market Presence
The potential energy saving estimates are shown in Table A10-2.
Table A10-2: Vending Machines and Beverage Merchandisers - Energy Saving Potential Es
avings Es escription an
timates
Equipment Type
Technology/ Standard Level
% Energy Savings
Pote al
Annual Energy Savings
P l nti otentia(quad)
Energy Saving
Potential (2010-2035),
(quads)
Source
Energy Star Tier 1 0 0 0
% Energy Savings potential from Energy Star Website15
Energy Star Tier 2 13 0.016 0.33
% Energy Savings potential from Energy Star Website16
CEC Design Requirements 14 0.017 0.35
m CEC Appliance Efficie cy
17
% EnergySavings potential fro
Vending Machines
nRegulations
Royal Vendors - Econo-cool Technology 47 0.057 1.19
% Energy Savings potential from Royal Vendors Website18 (2002)
Combination 28 0.034 0.71 potential fromADL (1996)
% Energy Savings
<2 Years Payback (ECM Motors for Evaporator Fans and High Efficiency Compressor)
32 0.039 0.81
% Energy Savings potential from ADL (1996)
15 Available at: http://www.energystar.gov/ia/partners/prod_development/new_specs/downloads/vend_machines/ES_V1.0_VendingMachinc.pdf
e_spe
http://www.energystar.gov/ia/partners/prod_development/new_specs/downloads/vend_machines/ES_V1.0_VendingMachine_spec.pdf 17 Available at: http://www.energy.ca.gov/reports/2003-09-10_400-03-016.PDF 18 Available at: http://www.royalvendors.com/royal.html
16 Available at:
.
10-4

<5 Years Payback (High Efficiency Condenser Fan Motor)
42 0.051 1.06
% Energy Savings potential from ADL (1996)
CEC Tier 1 29 0.015 0.31
% Energy Savings potential from CEC Appliance Efficiency Regulations19
CEC Tier 2 36 0.019 0.39
% Energy Savings potential from CEC Appliance Efficiency Regulations20
Combina
% Energy tion 35 0.018 0.38 Savings
potential from ADL (1996)
<2 Years Payback (ECM Motors for Evaporator Fans and High Efficiency Compressor)
44 0.023 0.47
% Energy Savings potential from ADL (1996)
Beverage Merchandisers
<5 Years Payback (High Efficiency Condenser Fan Motor)
55 0.029 0.59
% Energy Savings potential from ADL (1996)
ENERGY STAR® has proposed two tiers of efficiency levels for beverage vending machines. The first tier will take effect on April 1, 2004, and the second tier is scheduled for January 1, 2007. The ENERGY STAR® tier 1 level for an 800 can capacity vending machine, the capacity chosen for analysis based on annual sales, equals 8.72 kWh/day which represents a 0% savings from the baseline 8.22 kWh/day. The tier 2 level for the vending machine is 7.14 kWh/day, a 13% savings. The California Energy Commission (CEC) does not have an energy level, but a design requirement for beverage vending machines. This design requirement states that the internal illumination shall only be T-8 flourescent lamps with electronic ballasts or a lighting system that has no fewer lumens per watt than a system using only T-8 flourescent lamps with electronic ballasts. According to Royal Vendors, Inc, this lighting system will give an energy savings of 14%. The next energy savings estimate is for a new line of vending machines from Royal Vendors, Inc. The “Econo-cool” line consists of T8 lighting, a brushless DC motor for the evaporator fan, a high efficiency compressor, and computer controls to turn off lighting during non-demand periods. Royal Vendors, Inc. claims a 50% reduction in energy consumption relative to another
19 Available at: http://www.energy.ca.gov/reports/2003-09-10_400-03-016.PDF 20 Available at: http://www.energy.ca.gov/reports/2003-09-10_400-03-016.PDF
10-5

vending machine made by the same manufacturer that just meets the CEC efficiency levels (Royal Vendors, 2002). An ASHRAE 32.1 energy consumption test of a baseline 800 can
icated 4.6 kWh/day. After retrofitting with “Econo-cool”, the unit
057
a).
diser is 10.42 kWh/day, which is a 29%
vings from the baseline 14.71 kWh/day, while the tier 2 level equals 9.41 kWh/day, giving a 5
nd
consist of a high fficiency compressor and a brushless DC evaporator fan motor. Both the compressor and the
f
capacity vending machine indconsumed 47% less energy than the baseline. Assuming a 47% savings is achieved for all vending machines because of “Econo-cool” the annual primary energy savings potential is 0.quad, and the energy savings potential from 2010 to 2035 is 1.19 quads. Implementing this technology has an incremental cost of $75 with a payback of less than one year (ACEEE, 2002 The CEC has proposed two tiers of energy efficiency standards for beverage merchandisers. The first tier took effect on March 1, 2003; the second tier is scheduled for August 1, 2004. The CECtier 1 level for a 27ft3 total volume beverage merchansa36% energy savings. These two tiers give an annual primary energy savings potential of 0.01and 0.019 quad, respectively, and the energy savings potential from 2010 to 2035 is 0.31 a0.39 quad, respectively. The two theoretical combinations of technologies presented in ADL (1996) eevaporator fan motor are relatively simple to change and could be deployed on a retrofit basis. The energy savings potential for vending machines equals 28%, with simple payback periods oabout 1 year for the high efficiency compressor and about 2 years for the brushless DC evaporator fan motor. The beverage merchandiser combination reduces energy consumption by35%, with simple payback periods of about 1 year for the high efficiency compressor and 1.4 to4.4 years for the brushless DC evaporator fan motor. Although the efficiency gains for beveragemerchandisers exceed those for vending machines, the larger installed base of vending machines results in higher annual energy savings potential for vending machines.
10-6

A10.4 Regulatory Action
The California Energy Commission (CEC) has prepared efficiency standards for glass door reach-in refrigerators that encompass beverage merchandisers (CEC, 2001). In addition, CEC requires registration of beverage vending machines and has prescribed a design standamandating the use of energy efficient T8 lamps for sign illumination (CEC, 2001). Regarding vending machines, the Canadian Standards Association has a maximum daily energconsumption level that depends on the can c
the rd
y apacity.
The EPA ENERGY STAR® program has developed voluntary efficiency improvements for beverage vending machines. In addition to the ENERGY STAR® program specification, ACEEE also recommends specifications to be developed by the Consortium for Energy Efficiency (CEE). The CEE has been monitoring the progress of the EPA on the ENERGY STAR® program but has not yet developed a CEE level (ACEEE, 2002b). Since all beverage merchandisers and vending machines use a vapor compression cycle, most manufacturers have contended with the elimination of ozone-depleting CFC refrigerants from new products imposed by the Montreal Protocol. Most manufacturers produce more than one type of commercial refrigeration equipment, so that regulation of refrigeration equipment as an equipment class would impact a broad range of products for many manufacturers. In addition, some commercial refrigeration manufacturers have other divisions that manufacture other types of equipment that have come under energy efficiency regulations, e.g., unitary air-conditioners. Hence, most manufacturers of beverage merchandisers and vending machines have already borne the cumulative burden of CFC elimination and previous energy efficiency standards (and also face the possible elimination of global warming refrigerants).
A10.5 Issues Impacting Potential Energy Efficiency Standards
In the beverage vending machine industry, there is a large market for refurbished vending machines. Many vending machines are refurbished after about five years and are then put back into the market. The EPA’s Energy Star Program Requirements for Refrigerated Beverage Vending Machines does not currently include specifications for remanufactured vending machines but does plan on implementing such a specification after discussions with industry representatives. In addition, there are now residential vending machines on the market that do not have coin mechanisms. The main issue impacting potential energy efficiency standards is the distinction between a beverage merchandiser and a glass door reach-in refrigerator. Specifically, the energy efficiency standards proposed by the CEC would require beverage merchandiser and glass door reach-in refrigerators to meet the same efficiency levels. Although both types of commercial refrigeration equipment can have similar physical dimensions and holding temperatures, a beverage
10-7

merchandiser cannot be expected to meet the same energy efficiency standards as a comparably-zed glass door reach-in. Beverage merchandisers usually have an oversized refrigeration stem to “pull down” the temperatures of newly-loaded beverages in a short period of time. As
door
posed by the “pull down” condition upon beverage merchandiser necessitates a larger
ed h also consume energy. In sum, due to different application
quirements, promulgating the same energy efficiency standards for beverage merchandisers
sisya result, the beverage merchandiser will typically cycle (on-off) more often than a glassreach-in refrigerator, reducing overall device efficiency. Moreover, the larger cooling loadsimevaporator fan, which consumes more energy and dissipates more heat in the units, further reducing unit efficiency. Finally, the beverage merchandiser may also have modest illuminatsigns to attract customers, whicreand reach-in refrigerators is inappropriate.
10-8

10-9
pment: A Briefing Report for Program erican Council for an Energy-Efficient Economy, Report No. A022, December. ADL, 1996, “Energy Savin l Refrig eport t f Energ ogy, S an rams, June. Appliance Magazine, 2002 pliance i ASHRAE, 1997. “Methods of Testing for Rating Vending Machines for Bottled, Canned, and
ther Sealed Beverages”, American Society of Heating, Refrigeration, and Air-Conditioning
CEC, 2001. California Energy Commission Proposed Amendments to California Code of 1-1608: Appliance
CSA r Food Service Refrigerators and Freezers”, Canadian Standa ion, C82 , September.
Energy Star®, 2003(?). “Energy S Beverage Versio .
“Econ oo roduct Documentation. Available at: http://www.royalvendors.com
References
ACEEE, 2002a. “Commercial Packaged Refrigeration: An Untapped Lode for Energy Efficiency,” American Council for an Energy-Efficient Economy, Report No. A015, May. ACEEE, 2002b. “Packaged Commercial Refrigeration Equi
Planners and Implementers,” Am
gs Potential for Commercia eration Equipment”, Final Rd Community Progo US Department o y, Office of Building Technol tate
, “49th Annual Report”, Ap Magaz ne, May.
OEngineers Standard 32.1.
Regulations, Title 20: Division 2, Chapter 4, Article 4, Sections 160Efficiency Regulations. Docket No. 00-AB970-APSTD, April. CEC, 2003. California Energy Commission California Code of Regulations, Title 20: Division 2, Chapter 4, Article 4, Section 1601-1608: Appliance Efficiency Regulations. Effective August. CSA, 1996. “Energy Performance of Vending Machines”, Canadian Standards Association, C804-96.
, 1998. “Energy Performance fords Associat 17-98
tar® Program Requirements for Refrigerated
Vending Machines”, n 1.0 Royal Vendors, 2002, o-C l Keeps Drinks Cool While Saving Money”, P
/royal.html .

A11.1 Backgroun
Most often found in residences, ceiling fans move air to enhance occupant comfort. Used the cooling sea the n ceiling fans is
weighted toward the Southern portion o t majority (about 95%) of ceiling udes associ umption and savings for the fan
na yzed ra
Fan Background Data
d
primarily during son, installed base of about 192.8 milliof the country. The vas
fan installations incl ated lighting, and the energy consmotor and lighting are a l sepa tely (Table A11-1).
Table A11-1: Ceiling
Type Data type Value Source Install aseed B , millions (2001) 192.8 Equipment Li ears (1997) 13 fetime, y
Ceiling Fans Motors AEC, quad 0.17
d Horowitz (updated 2003); ADL 1999; RECS (1997 & 2001); Appliance
Calwell an
Magazine (2000) Installed Base, millions (1997) 183.221
Equipment Lifetime, years (1997) 13 Ceiling fans (lighting only) AEC, quad 0.29
Calwell and Horowitz (2001); Appliance (2000)
Overall, ceiling fans consume about one-half quad of energy per year, with associated lighting accounting for about 63% of the total.
A11.2 Product Technology Description and Market Presence
ll ceiling fans use blades driven by a motor to mA ove air, but the efficiencies of different blade-
motor combinations vary substantially. For example, data collected in support of the ceiling fanENERGY STAR® program showed that fan air-moving efficiency (quantified using a cfm/W metric) varied by more than a factor of two between models. Table A11-2 presents the lighting UEC values for the different lighting options, while Table A11-3 displays the UEC estimates of the different fan and motor technologies, as well as the ENERGY STAR® air-moving efficiencythreshold, investigated for ceiling fans (fan motor energy only).
Table A11-2: Ceiling Fan Lighting UEC
Description Value Comments Stock UEC (kWh) 383 Based on a 120 watt baseline unit power
consumption, Calwell and Horowitz (updated 2003) Typical New UEC (kWh) 383 Assumed same as stock Minimum Efficiency Standard N/A No minimum efficiency standard Current ENERGY STAR ® Efficiency (kWh)
83 Based on a 26 watt average unit power consumption for ENERGY STAR® ceiling fans with lighting, Calwell and Horowitz (updated 2003)
21 The 183.2 million ceiling fan lighting units reflects an estimate by Calwell and Horowitz (2001 and updated in 2003) that 95%
of all ceiling fans have associated lighting.
A11 Ceiling Fans
11-1

Table A11-3: Ceiling Fan Motor UEC
Description Value Comments Stock UEC (kWh) Based on 100 cfm/W airflow, Calwell and
Horowitz (updated 2003) 164
Typical New UEC (kWh) 164 Assumed same as stock Minimum Efficiency Standard N/A No minimum efficiency standard Best Available Efficiency (cfm/W) 165 Aerodynamic fan blade and more efficient motor Current ENERGY STAR® Efficiency (cfm/W)
122.3 Aerodynamic fan blades
Future Technology (maximum technology) (cfm/W)
260 High-efficiency motor and aerodynamic fan blades, Permanent split capacitor or permanent magnet motor
Cei lighting effi R® ceil y thatwithout lighting and 19 freq ed compSTAR® ceiling fans (Calwell and H endments to the eil he required fan efficacy, as well as specify
e at Home Depot. Most eiling fans use a shaded pole motor (Parker et al., 1999), which have full-speed efficiencies in
t 9). Replacing the shaded p s a permanent split capacitor (PSC) or a b iency relative to current motors (ADL, 1999). B range used by ceiling fan motors. However, the effect of design constraints particular to ceiling fans, such as reversing the position
f the rotor and stator, on motor feasibility has yet to be studied. It is also not known whether h-
es the separate erformance gains for the aerodynamic fan design and the high-efficiency motor options. To
ling fans do not have minimum efficiency standards for either air moving efficacy or cacy, but do fall under the voluntary ENERGY STAR® program. The ENERGY STAing fan requirement specifies that the ceiling fan motors should have an air moving efficienc is about 49% lower than that for typical motors. As of February, 2004, 487 fan models
an models with lighting have met the ENERGY STAR® uirements.22 The ENERGY STAR® program requires that the ceiling fan include pin-bas
act fluorescent fixtures. The 26 watt level reflects the average wattage of ENERGY orowitz, updated in 2003). Future am
ing fan ENERGY STAR® program may increase tcadditional controls and noise requirements. The aerodynamic fan blade reflects efficiency gains attained via improved blade design (airfoil shape) to enhance its air moving efficiency. Specifically, the energy savings reflect test data measured for the Hampton Bay “Gossamer Wind”23 fan, currently for salche 10 to 20% range for sizes typically used in ceiling fans (ADL, 199ole motor with a more efficient motor type, such arushless DC motor,24 could easily double the efficoth PSC and brushless DC motors are available in the size
ocommercially-available ceiling fans incorporate either PSC or brushless DC motors. The higefficiency motor and aerodynamic blade performance level simply combinpdate, no commercially-available fans offer this technology combination.
ation about ceiling fans meeting the ENERGY STAR® requirements is available at: 22 Inform
http://www.energystar.gov/index.cfm?c=ceiling_fans.pr_ceiling_fans. 23 Based on the / Aeroenvironments CF-1 design; more information available at: http://www.fsec.ucf.edu/~bdac/PROTOTYPE/CFAN.htm .
24 Also known as an electronically commutated permanent magnet (ECPM) motor.
11-2

Economic cost-benefit analyses have yet to be performed for any of the technology options. In particular, the motor options require additional information about how motor design issues specific to ceiling fans – if any – impact motor selection and costs.
A11.3 Test Procedure Status
Ceiling fans do not have a DOE test procedure for a lighting or air moving efficiency. The air moving efficiency of ceiling fa
y electrical input power (W), or cfm/Wns is given in air volume (cubic feet per minute or cfm) divided
. There are a number of existing test procedures that
nd Regulators, • Canadian Standards Association C814-96 (CAN/CSA C814-96) Energy Performance of
sidential Ceiling Fans. During EPA’s discussions with dustry stakeholders, stakeholders concluded that the Hunter Fan Company’s Solid State Test
includes a specific set of standard test conditions, the results using this method are reproducible,
non-repetitive within a
bhave been developed to measure this efficiency, including:
• National Electrical Manufacturers Association Standard Publication No. FM1-1951 (NEMA FM1-51),
• International Electrotechnical Commission Standard 60879-1986 (IEC 60879-86) Performance and Construction of Electric Circulating Fans a
Ceiling Fans, • American National Standards Institute and Air Movement and Control Association
Standard 230-99 (ANSI/AMCA 230-99) Laboratory Method of Testing Air Circulator Fans for Rating, and
• Hunter Fan Company Solid State Test Method. The test procedures listed above were all considered during the development of the EPA’s ENERGY STAR® Program for ReinMethod was the preferred test procedure for several important reasons: • the test method•• test conditions represent “real life” conditions, • testing costs and turnaround time were reasonable, and • test equipment is widely accessible.
The Solid State Test Method was therefore recommended by stakeholders to be used as the official metric for cfm determination in the ENERGY STAR® Program. The NEMA FM1-51 test procedure utilizes a mechanical anemometer instrument along with manual readings of air velocity along three-inch centers in a standard room. The equipment and instrumentation used for this test procedure are inexpensive. However, because of the way the
easurements are taken, the test is time-consuming and the readings are mreasonable tolerance. This test procedure has been used by the Hunter Fan Company and Air Cool. The IEC 60879-86 test procedure is similar to the NEMA FM1-51 test procedure but utilizes controlled airflow in a standard room. The limitations for IEC 60879-86 are the same as NEMA
11-3

FM1-51 with regard to the time needed to run the tests and lack of repeatability for the measured results. The test procedure was developed in Europe and is used extensively outside the U.S.
ithin the U.S., it is used by Home Depot (for its Hampton Bay ceiling fan products), Air Cool,
er than the NEMA FM1-51 and the IEC 60879-86 test procedures. This test procedure is not widely used.
l to measure the downward thrust of the fan’s air movement in an axial direction and specific room geometry. The thrust is used to
Because of the limitations with existing test procedures, the Hunter Fan Company internally developed an improved and refined method of measuring ceiling fan air delivery based on the IEC lid State Test Method improves upon the IEC 60879-86 test m ister anemometers that are mounted on a sensor arm and allows for simultaneous, multi-point velocity measu improv g uced testin nd much greater accura to Hu C the nts using this test method are typically within 3% of each other. The distinguishing feature of this test method is that it uses the latest developments in air v rements to im e upon racy alon th aut s to reduce t One major limitation of the Solid State Test Method is its inabili airflow values for hugger type ceiling fans. Hugger fans are i ed flu eiling as opposed to hanging from a down-rod pendant style, and subsequently move much less air because of the limited amount of space behind the fan blades. A ugger fans tested with the Solid State Test Method are higher than normal b r fans are mounted on a down-rod during the test, thus move more air than they would when installed flush
he ENERGY STAR® Ceiling Fan program does not ertify hugger fans because of the limitations of the method of testing.
energy efficiency of ceiling fans. The Solid State Test Method correlates well with ceiling fan motor energy consumption, energy savings potential, and
WKing of Fans, Minka and CEI. The CAN/CSA C814-96 test procedure is similar to the IEC 60879-86 test procedure but uses hot wire velocity measurements and a different room configuration. The time needed to run the tests is slightly low
The ANSI/AMCA 230-99 test procedure uses a load cel
calculate the amount of air movement. The test is inexpensive to conduct but it is very sensitive to ceiling fan wobble, vibrations, and the design of the ceiling fan blades, which contribute to inaccuracies in the test results. Because the load cell is set up to measure airflow in the axial direction, any airflow in the lateral direction is not accounted for.
60879-86 test method called the Solid State Test Method. The Soethod by incor
ompany,
porating solid state hot-wire therm
reatly red measureme
r scy. Accordingements. Thi ed method allows for g time a
nter Fan
elocity measu prov accu g wi omated measurementhe testing time.
ty to report accurate sh mounted to the cnstall
irflow values from hecause the hugge
to a ceiling. The Solid State Test Method is currently used as the test procedure for certifying ENERGY STAR® compliant ceiling fans. Currently, tc Because of the superiority of the Solid State Test Method over the other various test methods in terms of accuracy, repeatability, and short test duration, it is recommend as the basis for a uniform test method for measuring the
11-4

peak demand impact because it directly measures power draw in all air-moving modes and most fans are exp To a robl mea typ modifications would have to be ma S M re onfigura he test setup to be more applicable to hugger fans, applying a correction factor to (this could b determ ), or deve g a complete fferent fan performance.
A Savin stimate Calculation
The best available technology standard level (aerodynamic fan blades and high efficiency motor co n y saving ntial of 1.22 , whil ology standard level (future technology with aerodynamic fan blades and improv tor efficiency) can realize 1.93 quads of savings (see Table A11-4). The ENERGY STAR® level en s poten uals 0.5 .
ected to operate during (hot) peak demand periods.
ddress the p em in tate Test
suring hugger ethod by either
e ceiling fans, arranging the cde to the Solid tion of t
hugger fan test datatest method to measure hugger e empirically ined lopin ly di
11.4 Energy gs E s and s
mbination) has a energ s pote quads e the future techned mo air moving efficacy
ergy saving
tial eq 7 quad
Table A11-4: Ceiling Fan UEC and Energy Savings Potential (Fan Energy Only)
Technology/ Standard Level
UEC (kW-h)
Annual Energy Savings
Potential (quad)
Energy Saving
Potential (2010-2035),
(quads)
Source
Typical Device (current stock) 164 NA NA Calwell and Horowitz
(updated 2003) ‘Typical New’ 164 NA NA Assumed same as Stock
Best Available Technology 100 0.067 1.22 UEC from CalwellHorowitz (updated
and
2003)
ENERGY STAR(R), Fan 25 134.5 0.031 0.57
UEC HorowEfficacy Only
from Calwell and itz (updated
2003)
Future Technology (maximum technology) 62.3 0.104 1.93
UEC from Calwell and Horowitz (updated 2003)
Due to a lack of data differentiating energy consumption of fans by vintage, both the fan motor and lighting energy consumption analyses assume the same energy consumption levels for the installed base and typical new equipment. ENERGY STAR® lighting standard levels, future technology lighting standard levels (maximum technology), and best available lighting technology standard levels assume the use of pin-based compact fluorescent fixtures, which could save 4.22 quads of energy each over the 2010-2035 period (see Table A11-5).
25 http://yosemite1.epa.gov/ESTAR/consumers.nsf/content/ceilingfans.htm .
11-5

Table A11-5: Ceiling Fan UEC and Energy Saving Potential (Lighting Only)
Technology/ Standard Level
UEC (kW-h)
Annual Energy Savings Potential
(quad)
Energy Saving Potential (2008-2030) (quads)
Source
Current stock 383 NA NA Calwell and Horowitz (updated 2003)
Typical new 383 NA NA Assumed same as stock
Best Available 84.3 UEC from Calwell and
0.228 4.22 Horowitz (updated 2003)
ENERGY STAR(R) Lighting 84.3 0.228 4.22
UEC from Calwell and Horowitz (updated 2003)
Future Technology (maximum 84.3 0.
UEC from Calwell and
technology)
228 4.22 Horowitz (updated 2003)
The installed base of all ceiling fans has grown dramatically over the past quarter century, from
ughly 10 million units in 1976 (Sanchez, 1997) to more than 190 million units in 2001. It is
5 period.
her
or breeze, which decreases the
he cooling energy savings realized by ceiling fans may well exceed their own energy
a
rounclear if the trend will continue in the future; continued strong growth will increase both the energy consumption and savings potential over the 2010-203
A11.5 Regulatory Actions and Cumulative Burden
Ceiling fans have not been subject to regulation for energy efficiency. The extent to which otregulations impact ceiling fans, such as safety regulations, was not determined.
A11.6 Issues Impacting Potential Energy Efficiency Standards
eiling fans improve occupant comfort by generating an indoCperceived indoor air temperature. As a result, ceiling fans can enable higher indoor air temperature settings, displacing a portion of an air conditioning load and saving cooling energy.
hus, tTconsumption. Potential energy efficiency standards need to ensure that the incremental cost of an efficiency standard (if any) does not deter the purchase of ceiling fans and potentially create net increase in energy consumption.
11-6

11-1
ith
rograms, December.
AN r Rating”, American Nat dard 230-1999. App ce Mag
,
mation Administration, 2001, “Residential Energy Consumption Survey (RECS)”. vailable at: http://www.eia.doe.gov/emeu/recs/pubs.html
References ADL, 1999, “Opportunities for Energy Savings in the Residential and Commercial Sectors wHigh-Efficiency Electric Motors”, Final Report to US Department of Energy, Office of Building Technology, State and Community P
SI/AMCA, 1999. “Laboratory Method of Testing Air Circulator Fans foional Standards Institute and Air Movement and Control Association Stan
liance Magazine, 2000, “23rd Annual Portrait of the U.S. Appliance Industry”, Applianazine, September, pp. 87-89.
Callwell, C. and Horowitz, N., 2000, "Residential Ceiling Fan - A Look at Their Energy Use and Opportunities for Energy Savings," June 2000 (updated by author in April 2003) Calwell, C. and Horowitz, N., 2001, “Ceiling Fans: Fulfilling the Energy Efficiency Promise”Home Energy, Jan./Feb., pp. 24-29. CAN /CSA, 1996. “Energy Performance of Ceiling Fans”, Canadian Standards Association C814-1996. Energy Information Administration, 1997, “Residential Energy Consumption Survey (RECS)”.Available at: http://www.eia.doe.gov/emeu/recs/pubs.html
nergy InforEA
ion Agency, 2002, “Energy Star® Testing Facility Guidance Manual: ility and Performing the Solid State Test Method for Energy Star®
ualified Ceiling Fans”, Version 1.1, December.
Environmental ProtectBuilding a Testing FacQ IEC, 1986. “Performance and Construction of Electric Circulating Fans and Regulators”,International Electrotechnical Commission Standard 60879. NEMA, 1951. National Electrical Manufacturers Association Standard Publication No. FM1-
951. 1 Parker, D., Callahan, M., and Sonne, J., 1999, “Development of a high efficiency ceiling fan”, Florida Solar Energy Center.FSEC-CR-1059-99* Available at: ttp://wwwh .fsec.ucf.edu/~bdac/pubs/CR1059/CR1059.html .
Sanchez, M., 1997, "Miscellaneous Electricity Use in U.S. Residences", M.S Thesis in the Energy and Resources Group, University of California at Berkeley.

The frigerators, freezers, and re rs, beverage v achines, and beverage merchandisers. These products all use a vapor com o remove heat from beverage items or food p ct three en -c ts of a vapor c er • The compresso gh the eration cycle; • orator ed over old• enser r hot condenser to rem the
refrigeration sy ts heatction elim
T , the energ tent rigeration equipment ponents, the effectiveness of the condenser and
vaporator heat exchangers, and the refrigeration system heat gain from insulation, air leaks, door openings, etc. In addition, auxiliary devices such as lighting or a door frame heater also
ome of the equipment installed base estimates are about 10 years old, creating the theoretical
n
reasonable estimates of the current installed base of commercial refrigeration
eac irefrigresp ct duct below freezing, usually around 0° °F and 40°F Besides the normfram nside t
.012 quad, spectively. Despite the larger installed base of refrigerators, the annual energy consumption of
all reach-in freezers exceeds that of refrigerators because of freezers’ greater power draw levels.
A12 Commercial Reach-In Refrigerators, Freezers, and Refrigerator-Freezers
commercial refrigeration equipment category consists of reach-in refrigerator-freeze ending m
pression refrigeration cycle troducts and rejeompressor refrig
the heat to ambient air. The ergy onsuming componenation cycle are:
r: moves the refrigerant throu refrig The evap The cond
air fan: blows air to be cool the c evaporator; ove heat fromair fan: blows ambient air ove
stem. Some equipment rejec fan.
f the condenser via natural romconve
herefore
inating the condenser
y consumption and savings po ial of commercial refdepend on the efficiency of these three come
consume electrical power. Spotential for uncertainties in the current installed base. Since commercial refrigeration equipment has been in the marketplace for decades and the primary venues using refrigeratioequipment have not increased dramatically over the past 15 years, the older installed base data hould provide s
equipment.
A12.1 Background
R h- n refrigerators, reach-in freezers, and reach-in refrigerator-freezers are upright,
erated cases with solid or glass doors that hold frozen or refrigerated food products ively. The freezers maintain the temperature of the food proe
F, and the refrigerators typically maintain food product temperatures between 35.
al complement of power-consuming devices for the refrigeration system, a e heater is required to prevent condensation on the outside of the case. In addition, lighting
he case illuminates the inside of the case when the door is open. i Table A12-1 shows that the installed bases of reach-in freezers, refrigerators and refrigerator-freezers in 1994 were 800,000, 1.3 million, and 200,000, respectively. Reach-in freezers, refrigerators and refrigerator-freezers have an average lifetime of 8 to 10 years, and freezers, refrigerators and refrigerator-freezers annually consume 0.066 quad, 0.054 quad, and 0re
12-1

Table A12-1: Installed Base Data for Reach-In Freezers and Reach-In Refrigerators
Equipment type Data type Value Source Installed Base, thousands (1994) 800 Annual Sales, thousands (2001) 47 Equipment Lifetime, years (1994) 8 to 10
Reach-In Freezers
AEC, quad 0.066
ADL(1996); Appliance Magazine (2002)
Installed Base, thousands (1994) 1,300 Annual Sales, thousands (2001) 260 Equipment Lifetime, years (1994) 8 to 10
Reach-In Refrigerators
ADL(1996); Appliance
Primary AEC, quad 0.054 Magazine (2002)
Installed Base, thousands (2003) 200 Annual Sales, thousands - Equipment Lifetime, years (1994) 8 to 10
Reach-In Refrigerator-Freezers
AEC, quad 0.012
ADL (1996); Personal communication with PG&E FSTC
A12.2 Test Procedure Status
A DOE test procedure does not exist for reach-in freezers, reach-in refrigerators, or reach-in refrigerator-freezers; however, several organizations have test procedures for reach-in refrigeration. Measures of energy use or efficiency for commercial refrigeration typically consist of an amount
, ion
t
• National Sanitation Foundation/American National Standards Institute Standard 7-2001
• American Society of Heating, Refrigeration, and Air-Conditioning Engineers Standard
of energy the product uses (per unit volume per unit time). For reach-in refrigerators, freezersand refrigerator-freezers, energy use is typically expressed in terms of daily energy consumpt(kWh/day) per internal volume of the refrigerated space (ft3). There are a number of existing tesprocedures that have been developed for rating commercial refrigeration equipment. These include the following:
(NSF/ANSI 7-01) Commercial Refrigerators and Freezers; • Air-Conditioning and Refrigeration Institute Standard 1200-2002 (ARI 1200-02)
Commercial Refrigerated Display Cases; and
117-2002 (ASHRAE 117-02) Method of Testing Closed Refrigerators. The NSF/ANSI 7-01 test procedure was developed with food safety as an objective, and therefore does not include measurements of energy consumption. However, the ARI 1200-02 and the ASHRAE 117-02 test procedures were developed to allow comparisons of commercial refrigeration equipment, and therefore include measurements of energy consumption.
12-2

The NSF/ANSI 7-01 test procedure is a performance test for reach-in refrigerators and frused to store and/or display cold food. This test procedure is used to ensure that the refrigeration equipment can maintain temperatures safe for food preservation by requiring a case temperature of less than 40° F for refrigerators and less than 0° F for freezers, while the surroundtemperature is maintained at 100° F and the compressor duty cycle is no more that 70% during the test. The 100° F ambient rating condition is appropriately conservative for food safety
eezers
ing ambient
urposes but may not represent real-world conditions for commercial refrigeration. The test n
d ce
ting conditions for the closed type isplay cases are based on the ASHRAE Standard 117 test procedure. However, two different
n
adian Standards Association in the CSA C827-88 Standard, the California Energy Commission (CEC) as the test method for their commercial refrigeration standards, and the EPA certification of commercial refrigeration products for their ENERGY STAR® program. The ASHRAE 117 standard is used for all types of closed refrigerators and freezers that hold or display food, and it applies to both remote and self-contained products. In the ASHRAE 117 test, the refrigerated case is filled to capacity with a combination of simulated food and space fillers. The doors are opened for specific intervals during an 8-hour period, in order to simulate typical operation. The energy consumption is measured over a 24-hour period, while the ambient conditions are fixed at a dry-bulb temperature of 75° F +/- 2° F and a wet bulb temperature of 64˚ F +/- 2° F. There are several potential limitations of the ASHRAE 117 test procedure. First, the ambient temperature rating condition may not represent the typical real-world conditions found in active commercial kitchens. These temperatures can be well above the 75° F ambient rating condition and may even reach 100° F at times. Furthermore, ASHRAE 117 does not include a recovery test where the energy consumption required to cool down warm food is measured. This could be particularly important for beverage merchandisers if DOE decides that rapid “pull down” of product temperature is an important feature of beverage merchandisers and accounts for significant energy use. Finally, the ASHRAE 117 test procedure does not specify a case
pprocedure by itself is not sufficient to be used for energy efficiency standards because it lacks aelectrical consumption test. The ARI 1200-02 test procedure for commercial refrigerated display cases provides test anrating requirements for self-contained or remote, open or closed, and service and self-servicommercial refrigerated display cases. It was developed to provide guidance to the commercial refrigeration industry and allows comparison of energy consumption among remote commercial refrigerated display cases or comparison of energy consumption among self-contained commercial refrigerated display cases. The rating conditions for the open type display cases are based on the ASHRAE Standard 72 test procedure, and the radambient temperature conditions are used for each type of display case, depending on the environment in which the equipment is installed. Type I display cases are intended to be used iareas where the ambient temperatures do not exceed 75° F and are therefore rated at an ambient dry-bulb temperature of 75° F +/- 2°F. Type II display cases are intended to be used in areas where the ambient temperatures do not exceed 80° F and are therefore rated at an ambient dry-bulb temperature of 80° F +/- 2°F. The ASHRAE 117-02 test procedure is used as the basic test method by many organizations, including the Can
12-3

temperature or a food temperature and is thus inadequate by itself for energy efficiency uld
procedure is fairly difficult to carry out and is generally performed by test labs, not manufacturers. In current testing for the CEC, not all units made by a manufacturer are tested. Instead, representative units are tested, and performance estimates are extrapolated to other units.
The ASHRAE 117 test procedure is, however, widely used and has been revised several times since it was originally developed in 1983. It is currently undergoing a revision under ASHRAE’s continuous maintenance program, which will combine ASHRAE 117 with AS SA C827-88 standard, the ASHRAE 117 test procedure is mo e mperature of 38° F for re fo s. rocedure is modified to include an integrated av d of 38° +/- 2°F for refrigerators. For freezers, an integrated average product temperature of 0° +/- 2°F is specified. The EPA’s program for commercial reach-in refrigerators and freezers takes the s approa specifying the same integrated average product temperatures. Because the ASHRAE 117 test procedure is widely used, has been i eing im eral sions sinc 3, serves as asis fo ings for m and is applicable to many types of commercial refrigeration equipment, it is a good basis for measuring the energy efficiency of commercial refrigeration equipment. To o to the rating cond sidered, possibly including: ambient temperature ratings more closely repres pically encountered by the equipment, a recovery test that measures the energy consumption required to co cts introduced into the cabinet, and an integrated average product temperature rating condition.
standards, because a valid comparative evaluation of energy consumption among products worequire equal food or case temperatures to be maintained during the tests. The ASHRAE 117 test
HRAE 72 for open type refrigerators and freezers. In the Cdified to includFor the CEC, the ASHRAE 117 test p
uct temperature
a cabinet air tefrigerators and 0° F r freezer
erage pro
ame ch as the CEC by
mproved and is br performance ratproved through sev
any organizationsrevi e 198 the b
vercome the limitations identified, modifications
ol warm produ
itions may be conentative of those ty
12-4

A12.3 Energy Savings Estimates and Calculations, and Technology Description and Market Presence
Table A12-2 presents the potential energy saving estimates for reach-in freezers.
Table A12-2: Potential Energy Saving Estimates for Reach-In Freezers
Technology/Standard Level
% Energy Savings
Potential
Annual Energy Savings
Potential (quad)
Energy Saving Potential (2010-
2035) (quad) Source
Combination 35 0.023 0.47 % Energy Savings potential from ADL (1996)
<2 Years Payback (High Efficiency % Energy Savings Compressor, and Non-Electric Anti Sweat Heating)
30 0.020 0.40 potential from ADL (1996)
<5 Years Payback (ECM Motor for Evaporator Fans, Hot 44 0.029 0.59
% Energy Savings potential from AD
Gas Defrost, and L
(1996) Defrost Controls
CEC Tier 1 8
% Energy Savings potential from CEC 0.005 0.11 Database of Energy Efficient Appliances26
CEC Tier 2 13 0.008 0.17
% Energy Savings potential from CEC Database of Energy Efficient Appliances27
ENERGY STAR® 20 0.013 0.27 % Energy Savings potential from ENERGY STAR® website28
The first combination employs several technologies to save energy: • hot gas antisweat; • high efficiency compressor; • brushless DC evaporator and condenser fan motors.
26 Available at: http://www.energy.ca.gov/appliances/appliance/ . 27 Available at: http://www.energy.ca.gov/appliances/appliance/ . 28 Available at: http://yosemite1.epa.gov/estar/consumers.nsf/content/refrigerator.htm .
12-5

The annual energy savings potential if all reach-in freezers employed these technologies equals 35%, which translates into 0.47 quad over the pay Th ngs ass iManufacturers provided these conditions and, given th cy ly door o baseline e gy consumption is 14.2 kWh/ an esti nts the average consumption for units of all sizes (ADL, 1996). The California Energy Commission (CE s proposed t ers of standards. The first tier took effect on March 1, 2003; the second tier is scheduled for August 1, 2004. The CEC database of appliances produces an average daily ene consum or reach-i een 19 an 1 ft3 of 11.74 kWh/day. This is lower than the 14.24 kWh/day baseline used by ADL (1996), because it only considers the smaller-sized units. For units in the 1 ange, assuming all new units consume 11.74 kWh/day, the energy savings of CEC’s tier 1 standards would equal 8%29. The energy savings of CEC’s tier 2 standards are 13%. Subsequently, it is assumed the 8 13% energy ngs ca s the entire volume range of reach-in freezers. The ENERGY STAR® efficiency level for reach-in freezers is slightlCEC’s but only applies to solid-door units, i.e,. glass door are n The E R® level for a 20 cubic foot solid door freezer equals 9.36 kWh/day which represents a 20% savings from the baseline of 11.74 kWh/day. Similae gs can be applied across the entire volume ran of reach Table A12-3 shows two different combinations of technologies to reduce energy consumption in r igerators, as w l as the energy savings for reach-in refrig y for ENERGY STAR® certification.
2010-2035 period. All features have a simple back period of less than three years.
ese energy savi estimates ume a 70°F amb ent temperature and a 75% duty cycle. e high duty cle, probably imp
mate that represepenings. The ner day,
C) ha wo ti energy efficiency
rgy ption for solid don freezers betw d 2
9 to 21 ft3 size r
% and savi n be applied acros
y more stringent than the ot in the program. units
NERGY STArly, it is assumed the 20% -in freezers. nergy savin ge
each-in refr el erators that qualif
29 That is, the CEC Tier 1 standard requires that a unit in the same range consume no more than 10.79 kWh/day; the Tier 2 level caps energy consumption at 10.24kWh/day.
12-6

Table A12-3: Potential Energy Saving Estimates for Reach-In Refrigerators
Technology / Standard Level
% Energy Savings
Potential
Annual Energy Savings Potential
(quad)
Energy Saving Potential (2010-
2035), (quad) Source
Combination 1 44 0.024 0.49 % Energy Savings potential from ADL(1996)
Co 0.036 0.74 % Energy Savings potential from ADL (2001 and 2002b)
mbination 2 67
Co 80 0.043 0.89 potential from ADL (2002b)
mbination 3 % Energy Savings
<2 (ECEvaHigCoNoSweat Heating)
0.019 0.39 % Energy Savings potential from ADL (1996)
Years Payback M Motors for porator Fans, h Efficiency 35
mpressor, and n-Electric Anti
<5 Years Payback (ECM Motor for Condenser Fan)
45 0.024 0.50 % Energy Savings potential from ADL (1996)
CEC Tier 1 0 0 0 vings
potential from CEC (2002)30
% Energy Sa
CE 0.005 0.10 % Energy Savings potential from CEC (2002)31
C Tier 2 9
EN 0.016 0.32 % Energy Savings potential from Energy Star, See Footnote32
ERGY STAR® 29
Com tive list of improvements: •
st sy
bination 1 is a short but effec Hot gas antisweat; • High efficiency compressor; • Brushless DC evaporator and condenser fan motors.
The 44% energy savings potential translates into 0.49 quad over the 2010-2035 period. The latwo technologies, a high efficiency compressor and brushless DC fan motors, are relatively eato implement while the first, hot gas antisweat, requires product redesign and retooling for a new case. All features have a simple payback period of less than three years.
30No reduction in ASHRAE 117 Energy use from 9kWh/day (ADL(current)) to 9.65kWh/day for 43.5 cuft unit. 31Reduction in ASHRAE 117 Energy use from 9kWh/day (ADL(current)) to 8.20kWh/day for 43.5 cuft unit 32 Reduction in ASHRAE 117 Energy use from 9 kWh/day (ADL(current)) to 6.39 kWh/day for 43.5 cubic ft. unit.
12-7

These projected savings assume a 70°F ambient temperature and a 65% duty cycle for thebaseline refrigeration system. Such a high duty cycle of the baseline refrigerator at 70°F atemperature means that it may fail the NSF7 test at the higher ambient temperature of 100Since refrigerators cannot be sold without NSF approval, it is likely that the 65% duty cyc
mbient °F. le
cludes door openings, suggesting that the energy savings estimate is based on reasonably
ombination 2 is a more aggressive application of energy saving features, incorporating:
ents to face frame
• line t• evaporator fan m•• Refrigeration system optimization.
The dition assumptions apply as for the “Combination 1” approach. The final energy savings analysis results in 67% annual energy savings potential or 0.74 quad over the 201
rs;
tion systems may not be h-in refrigerators in the
market. The California Energy Commission (CEC) includes two tiers of energy efficiency standards for all reach-in refrigerators. Analysis of a two-door solid reach-in refrigerator with an interior
inrealistic operating conditions. C• Improved face frame design; • Improved gasket; • Reduced antisweat heater wattage (done in conjunction with improvem
design and gasket); Condensate Brushless DC
rap; otor;
PSC condenser fan m Evaporator fan shutdown; and
otor;
•
same operating con
0-2035 period. Simple payback periods were not calculated for this option.
Combination 3 includes the following design modifications: • Improved Face Frame Design; • Improved Gasket; • Reduced Antisweat Heat Input; • Condensate Line Trap; • Brushless DC Evaporator and Condenser Fan Moto• Variable-Speed Refrigeration System; and • Hot Gas Antisweat Heating.
The same operating condition assumptions apply as for the “Combination 1” approach. The final energy savings analysis results in 80% annual energy savings potential or 0.89 quad over the 2010-2035 period. Simple payback periods were not calculated for this option. All of the options considered in the three “combinations” – with the possible exception of the
ariable-speed refrigeration systems – are presently feasible and the components needed to vimplement the options commercially available. Variable-speed refrigeraavailable in sizes (and with refrigerants) compatible with all sizes of reac
12-8

volume of 43.5 ft3 indicates that the first tier will not realize measurable energy savings. Howstandards apply to glass door reach-in refrigerators, which have inherently higher energy cons ls, th po e aforementioned values. If all reach-in refrigerators attained ENERGY STAR® certification, then the annual energy sa would be T hows one com on of technolog reduce energy consumption in reach-in re eezers.
Table A12-4: Potential Energy Saving Es es for Reach-In Refrigerator-Freezers
ever, the second tier will achieve 9% energy savings. On the other hand, if the CEC
umption leve e energy savings tential will exceed th
vings potential 29%.
able A12-4 s binati ies tofrigerator-fr
timat
Technology / Standard Level
% Energy Savings
Potential
Primary Annual Energy Savings Potential(quad)
Energy Saving Potential (2010-
2035), (quad) Source
Combination 1 35 0.0041 0.08 % Energy Savings potential from ADL(1996)
Combination 1 is the same list of improvements as the reach-in freezer: • Hot gas antisweat; • High efficiency compressor; • Brushless DC evaporator and condenser fan motors.
he 35% energy savings potential is from the data for reach-in freezersT . This combination was
hile retooling for a new case. All features
y
es
chosen because it has a lower energy savings potential than that of the reach-in refrigerator. The energy savings potential translates into 0.08 quad over 2010-2035. The last two technologies, a high efficiency compressor and brushless DC fan motors, are relatively easy to implement whe first, hot gas antisweat, requires product redesign andt
have a simple payback period of less than three years. Differences in test conditions complicate direct comparison of the ADL (1996) cases with the other energy savings approaches, as the ADL (1996) savings assume a 70o F ambient temperature, as well as a 65% duty cycle. The other approaches base their savings calculation on the ASHRAE 117 test conditions, which assume a slightly higher (i.e., 75o F) ambient temperature and specifies a certain quantity and duration of door openings. In turn, this likelleads to a lower duty cycle than used for the ADL (1996) energy consumption and savings potential. In sum, these differences require further study, but because the ambient temperaturassumed are similar, the energy savings potential calculations should be broadly comparable. Table A12-5 summarizes the information presented in this sub-section.
12-9

Table A12-5: Total Savings Potential for Reach-in Freezers, Reach-in Refrigerators, and Reach-in Refrigerator-Freezers
Technology / Annual Energy Energy Saving Savings Potential
(quad) Potential (2010 – 2035)
(quads) Standard Level
Combination 1 0.051 1.04 Combination 2 0.036 0.74 33
Combination 3 34 0.043 0.89 CEC Tier 1 35 0.005 0.11 CEC Tier 2 36 0.013 0.27 ENERGY STAR® 37 0.029 0.59
A12.4 Regulatory Action
Reach-in freezers, refrigerators, and refrigerator-freezers do not currently have a minimum energy efficiency standard in the United States, but do fall under the voluntary ENERGY STAR® program. The ENERGY STAR® program began qualifying reach-in refrigerators, freezers, and refrigerator-freezers on 1 September, 2001. In addition, the California Energy Commission (CEC) has promulgated energy efficiency standards for all reach-in freezers and refrigerators sold in California. The Canadian Standards Association also has energy efficiency standards for reach-in freezers, refrigerators, and refrigerator-freezers. The ENERGY STAR® program only qualifies solid door refrigerators, freezers, and refrigerator-freezers. The energy efficiency level depends on the internal volume of the case and on the reach-in type, i.e. freezing or refrigerating temperatures. Since all reach-in refrigerators and freezers use a vapor compression cycle, most manufacturers have contended with the elimination of ozone-depleting CFC refrigerants from new products imposed by the Montreal Protocol. If the U.S. ratifies the Kyoto Protocol or adopts other legislation to reduce emissions of greenhouse gases, then the makers of commercial refrigeration equipment may also have to convert to refrigerants with reduced global warming potential. Most manufacturers produce more than one type of commercial refrigeration equipment, so that regulation of refrigeration equipment as an equipment class would impact a broad range of products for many manufacturers. In addition, some commercial refrigeration manufacturers have other divisions that manufacture other types of equipment that have come under energy efficiency regulations, e.g., unitary air-conditioners. Hence, most manufacturers of reach-in refrigerators and freezers have already borne the cumulative burden of CFC elimination and
33 Reach-in refrigerators only. 34 Reach-in refrigerators only. 35 Reach-in refrigerators and reach-in freezers only. 36 Reach-in refrigerators and reach-in freezers only. 37 Reach-in refrigerators and reach-in freezers only.
12-10

previous energy efficiency standards, and face the possible elimination of global warming frigerants.
r
andards may be high if ASHRAE 117 continues to be the basis of test procedures.
re
A12.5 Issues Impacting Potential Energy Efficiency Standards
The ASHRAE 117 test is a time-consuming (24-hour) and meticulous test standard. As a matteof fact, the California Energy Commission has only qualified two laboratories to perform ASHRAE 117 tests. Therefore, the burden on manufacturers in adopting energy efficiency st
12-11

12-12
Building Technology, April. ADL, 2002a cial Office and Telecommunications Equipment in Com al Buildings – Volu rgy Consumption Baseline”, Final Report to US Departm Energ nology, St ndJ ADL, 2002b, “Appli ctices to t sig tors – Development of a High Efficiency Reach-In Refrigerator,” Arthur D. Little, Inc., Final Report, June 2002.
Society of Heating,
“49th Annual Report”, Appliance Magazine, May.
References
ADL, 1996, “Energy Savings Potential for Commercial Refrigeration Equipment”, Final Report to US Department of Energy, Office of Building Technology, State and Community Programs, June. ADL, 2001, “Energy Consumption Characteristics of Commercial Building HVAC Systems – Volume I: Chillers, Refrigerant Compressors, and Heating Systems,” Final Report to US Department of Energy, Office of
, “Energy Consumption by Commermerci me I: Ene
ent of anuary.
y, Office of Building Tech ate a Community Programs,
cation of Best Industry Pra he De n of Commercial Refrigera
ARI, 2002. “Commercial Refrigerated Display Cases”, Air-Conditioning and Refrigeration Institute Standard 1200-2002.
ASHRAE, 2002. “Method of Testing Closed Refrigerators”, AmericanRefrigeration, and Air-Conditioning Engineers Standard 117-2002.
Appliance Magazine, 2002, California Energy Commission, “Database of Energy Efficient Appliances”. Available at: http://www.energy.ca.gov/appliances/appliance/. ENERGY STAR® website, “Energy Star Qualified Products”. Available at: http://yosemite1.epa.gov/estar/consumers.nsf/content/refrigerator.htm. NSF/ANSI, 2001. “Commercial Refrigerators and Freezers”, National Sanitation Foundation/American National Standards Institute Standard 7-2001. Zabrowski, David, 2003, Personal Communication, PG&E Food Service Technology Center.

A13.1 Background
bustion
Gas unit heaters and gas duct furnaces both burn natural gas for space heating, typically in commercial and industrial buildings. Unit heaters usually hang from the ceiling and use a fan or blower to circulate room air through a heat exchanger (which transfers heat from the comgases), heating the air and distributing it to the room/space. Duct furnaces are installed in a ventilation duct system to heat moving air (a duct furnace does not have its own fan or blower). The approximately 3.9 million gas unit heaters in use in the United States in 2001 consume about 0.65 quad of energy each year, while approximately 0.25 million gas duct furnaces consume about 0.10 quad (Table A13-1).
Table A13-1: Gas Unit Heater and Duct Furnace Data
Type Data type Value Source Installed Base, millions (2001) 3.9 GAMA (2003) and calculation Equipment Lifetime, years 21.538 GRI (1997) Gas unit heaters AEC, quad 0.65 ADL (2001b) and calculation Installed Base, m GAM ation illions (2001) 0.25 A (2003) and calculEquipment Lifetim GRIe, years 16.539 (1997) GaAEC, quad .10
s duct furnaces 0 Calculation
The installed base and Annual Energy Consumption (A ) esti AMA (2003), GRI (1997) and ADL (2001b) (see the Sub-Appendix fo
A gy Descrip and Mar form
n e
etal heat exchanger and passes out through the vent where it is exhausted outdoors. fan blows indoor air over the hot outer surface of the heat exchanger and distributes the heated
air throughout the space.
n the
its (currently with very limited commercial availability) are designed to
EC mates were derived from Gr calculation details).
13.2 Product Technolo tions ket In ation
A13.2.1 Gas Unit Heaters Gas unit heaters are self-contained units that usually hang from the ceiling of a space, but can also be installed on floors or walls. A gas supply line feeds fuel to the burner and combustiochamber where the gas is burned to release heat. The hot combustion gas then travels through thinside of a mA
Power vented units use a separate fan to draw combustion products through the combustion chamber. This configuration can improve combustion efficiency and reduce off-cycle flue losses. Power vented units with separated combustion bring in combustion air from the outside of the heated space. This configuration further reduces losses and improves the seasonal efficiency of these designs. At one time, pulse combustion unit heaters, that utilize combustiopulses to enhance heat transfer, were offered to improve efficiency but are no longer on market. Condensing unextract more energy from the combustion products to improve efficiency. Water vapor in the exhaust gas condenses on the walls of the heat exchanger, improving efficiency by extracting latent heat. 38 average of lifetimes (ranges between 17-26 years depending on type, capacity, and location). 39 average of lifetimes (ranges between 15-20 years depending on type, capacity, and location).
A13 Gas Unit Heaters / Gas Duct Furnaces
13-1

Table A13-2 displays the steady-state efficiency and estimated Annual Fuel Utilization Efficiency (AFUE) values for currently available gas unit heater technologies. AFUE considcycling and other seasonal effects on efficiency while steady-state efficiency is a measurement afull-load operation. Minimum efficiencies for gas unit heaters and gas duct furnaces as prescribed by ASHRAE Standard 90.1 (as of October 29, 2001) are set at 80% combustion efficiency. These levels hav
ers t
e not been changed in subsequent versions of ASHRAE 90.1 to date. previous versions of ASHRAE 90.1, a thermal efficiency requirement was prescribed.
However, for products of this type, thermal and combustion efficiency are virtually identical. A rev als that nearly all unit heaters and duct furnaces on the ma 9 lec ituation .1 requirements have been adopted by many building codes throughout the U.S. Seasonal efficiency values, used in late unit en consum an tential, are not currently prescribed in ASHRAE nd ther are
ter Efficie
In
iew of current product literature reverket today meet ASHRAE 0.1. This ref ts the s that ASHRAE 90
this analysis to calcu ergy ption d design option savings po estimated. 90.1 a efore
Table A13-2: Gas Unit Hea ncy
Technology/Standard Level Steady-State Efficiency
AFUE Efficiency Comments/Source
Stock Efficiency 78% 72% ates ADL (2001b) and estimTypical New Efficiency 80% 74 stimates % Product catalogs and eMinimum Efficiency ASHRAE 90.1-1999 (as of 10/29/2001) 80% -- Standard only specifies steady-
state combustion efficiency. Power Vented - Separated Combustion 82% 80% Product catalogs and estimates
Best Available (condensing) 93% 93% Product catalogs and estimates In 1995, the majority of gas unit heaters sold (~85%) were simple gravity vented units. Power-vented units claimed the rest of the market (~15%). Data are not available to estimate the current
t-separated combustion unit heaters. Condensing units were
en travels through the inside of a metal heat exchanger and passes out
e
share of power vent or power venintroduced in 1999 and are available in the U.S. but apparently have not gained significant market share. A product search identified one condensing model, the Reznor SHE condensing unit heater.
A13.2.2 Gas Duct Furnaces Gas duct furnaces are heating system components that are installed as a section in the supply ductwork of a ventilation system (they do not have fans or blowers of their own). A gas supply line feeds fuel to the burner and combustion chamber where the gas is burned to release heat. The hot combustion gas ththrough the vent where it is exhausted to the outdoors. The ventilation system fan or blower blows air over the hot outer surface of the heat exchanger and distributes the heated air throughout the space. Power-vented units use a separate fan in the venting system to draw combustion products through the combustion chamber to improve combustion efficiency and reduce flue losses (by restricting the flow of warm air out the vent when the unit is off). Separated combustion units aralso available that further reduce seasonal losses by using outside air for combustion. Pulse
13-2

combustion is no longer viewed as a viable design option to improve efficiency. Condensing units are designed to extract more heat from the combustion gases to the point where the water vapor in the combustion products condenses on the walls of the heat exchanger (improving efficiency by extracting latent heat). ASHRAE 90.1 minimum efficiency requirements are the
cussion). Table A13-3 displays the steady-state efficiency and estimated Annual Fuel Utilization Efficiency (AFUE) values for gas same for duct furnaces as for unit heaters (see earlier dis
duct furnace technologies.
Table A13-3: Gas Duct Furnace Efficiency
Technology/Standard Level Steady-state Efficiency
AFUE Efficiency Comments/Source
Stock Efficiency 78% nd es72% ADL (2001b) a timates Typic 80% anal New Efficiency 74% Product catalogs d estimates Minimum Efficiency ASHRAE 90.1-1999 (as of 10/29/2001)
80% -- St nly specstate combustion efficiency
andard o ifies steady-.
Power Vented-Separated 82% 80% Product catalogs and estimCombustion
ates
Best Possible (condensing) 93% 93% Product catalogs and estimates While the exact numbers are not known, 5 the m ductinstal nted un r-vented aimed t arket. No condensing duct furnaces are currently av ble i et, bu . m nsing warm air furnaces, indicating that condensing duct furnaces are technologically feasible.
13.3 Test Procedure Status
ve a DOE st procedure, but do follow an ANSI test procedure. Specifically, ASHRAE Standard 90.1
t
) to
ad, a ency value such as Annual Fuel Utilization Efficiency (AFUE) can better predict
ow much fuel the equipment consumes on a yearly basis by taking into account cycling losses (attributed to warm-up and cool-down) and when a standing pilot is used, pilot losses (gas consumed by the pilot burner when the unit is not operating). Existing DOE test procedures for NAECA covered heating products, such as residential furnaces and boilers, describe the test
in 199 ajority of gas units cl
n the U.S. mark
furnaces sold and he rest of the m
t several U.Sled were simple gravity ve its. Powe
ailaanufacturers market conde
A
Gas unit heaters and duct furnaces, primarily commercial/industrial products, do not hateestablishes minimum steady-state combustion efficiency levels for gas unit heaters and ducfurnaces based on the ANSI Z83.8 (CSA 2.6) test procedure. The ANSI test procedure establishes a uniform experimental setup and procedure (at maximum steady-state operationmeasure the heating value of the natural gas burned and the heat lost through the vent in the form of hot combustion gases and water vapor (flue losses). The combustion efficiency calculation equals 100% minus the flue losses. The test standard and efficiency determination do not include the electricity consumed. Steady-state efficiency may not be the most accurate way to calculate annual energy consumption because it does not account for losses due to equipment on-off cycling. Insteseasonal efficih
13-3

procedure for determining AFUE, but an AFUE has not been prescribed by ASHRAE for unit heaters or duct furnaces.
al and
t mption.
A13.4 Energy Savings Estimates and Calculations
Table A13-4 and Table A13-5 present the Unit Energy Consumption (UEC) and the potentinational energy saving estimates for the different technologies available for gas unit heaters duct furnaces. All energy savings calculations use estimated AFUE values to better reflecexpected annual energy consu
Table A13-4: Gas Unit Heater UEC and Potential Saving Estimates
Technology/Standard Level UEC (MM- Btu)
Annual Energy Savings Potential
(quad)
Energy Saving Potential
(2010-2035, quads) Typical Device (current stock) 167 NA NA Typical New 162 NA NA Condensing 129 0.13 1.8 Power Vent-Separated Combustion 150 0.047 0.67
Table A13-5: Gas Duct Furnace UEC and Potential Saving Estimates
Technology/Standard Level UEC (MM-Btu)
Annual Energy Savings
Potential(quad)
Energy Saving Potential (2010-
2035), (quad) Typical Device (current stock) 419 NA NA Typical New 408 NA NA Condensing 324 0.021 0.34 Power Vent-Separated Combustion 377 0.008 0.13
Condensing technology has over twice the energy savings potential of power vent-separated combustion because it offers both much higher steady-state and seasonal efficiencies. Some uncertainty exists in the calculation of national energy savings potential for gas unit heaters because assumptions were necessary when deriving the AEC estimate for the installed base. ADL (2001b) provided an estimate of the AEC of gas unit heaters in the commercial building sector, but no data could be found for the AEC in industrial buildings. Instead, based the widespread application of the unit heater in the industrial sector, it was assumed that gaheaters consume 85% of the natural gas heating energy consumption in the industrial sector.UEC calculation assumed that shipments for the years before 1992 equaled the mean of shipments during th
on s unit The
e 1992 to 2001 period. Depending on actual sales figures before this period, the gas unit heater installed base could be either higher or lower. This treatment of shipment data could also affect energy estimates for duct furnaces (see the Sub-Appendix for more information).
13-4

A13.5 Regulatory Actions and Cumulative Burden
he DOE has not regulated gas unit heaters or gas duct furnaces for energy efficiency. A
pal and regional building codes and which sets a minimum ces also
anufacture air-conditioning equipment and furnaces for which the DOE has established
he extent to which other regulations impact gas unit heaters and duct furnaces, including health
.1 and DOE mulgated for
y Bill) include requiring vent dampers and banning pilots. The current ASHRAE 0.1 standard for gas unit heaters and duct furnaces is a performance-based standard that sets the
minimum steady-state efficiency level and allows the manufacturer flexibility in execution. An AFUE efficiency level standard is also performance based, and prescribing a minimum AFUE level (rather than steady-state efficiency) for these products would further impact equipment design. A new test procedure would also be necessary to measure AFUE. In addition, the electricity consumed by this equipment could be regulated by future efficiency standards (e.g., electricity consumed by the fan or blower of unit heaters or the power venting system of duct furnaces). A broader issue when setting efficiency standards for heating equipment is quantifying how effectively heaters deliver warm air to building occupants. For example, many unit heaters are installed near the ceiling of tall spaces; in which case, a portion of the heat generated may not reach the occupants at floor level. Duct furnaces could be impacted by ventilation system distribution inefficiencies, such as duct leakage. It is not clear how to best address such “system” effects and whether future equipment efficiency standards can effectively address installation issues.
Tprovision in the new National Energy Bill would require, if passed, that unit heaters have an intermittent ignition device and either power venting or an automatic flue damper. As discussed above, unit heaters and duct furnaces are covered by ASHRAE Standard 90.1, which has been adopted as part of many municiefficiency requirement. Some manufacturers of gas unit heaters and gas duct furnamminimum efficiency levels. Tand safety, was not determined.
A13.6 Issues Impacting Potential Energy Efficiency Standards
Commercial furnaces have been subjected to efficiency standards (by ASHRAE 90tandards published in the Federal Register – January 2001), which, if similarly pros
gas unit and/or duct heaters, could force manufacturers to abandon certain designs and/or technologies. Examples of possible prescriptive standards (such as being considered in the
ational EnergN9
13-5

References ADL, 2001, “Energy Consumption Characteristics of Commercial Building HVAC Systems – Volume I: Chillers, Refrigerant Compressors, and Heating Systems”, Final Report by Arthur D. Little, Inc.to US Department of Energy, Office of Building Technology, State and Community Programs, April. Available at: http://www.eren.doe.gov/buildings/documents/pdfs/hvacvolume1finalreport.pdf . ANSI/CGA, 1996, Standard for Gas Unit Heater and Gas-Fired Duct Furnaces, American
6/CGA2.6-M96. ASHRAE, 1999, ASHRAE/IE 0.1 – 1999 Design of New Buildings pt Low-Rise Residential Buildings, ASHRAE P tlanta, GA. GAMA, 2 Statistical Highligh
National Standard Institute / Canadian Gas Association Standard, Z83.8-199
SNA rd 9 Standa , Ene icientrgy Eff Exce ress: A
003, ts, Gas Appliance Manufac ssociation, Arlington, VA, March 4. GRI, 1995 eline Projection Data Book, 1995 Edition, Ga rch Institute. GRI, 1997, "Commercial Space Heating Equipment Market," search Institute Report, GRI-97/0
turers A
, Bas s Resea
Gas Re100.
13-6

Sub-Appendix. Gas Unit Heaters and Duct Furnaces Calculation Details Installed Base Calculations
A ture search did not yield gas unit heate duc talled base estimates, nor s e lifetime of t vice e installed base estimates u ta from GAMA (2003) for the period of 1992-2001 (Table A13-A1). The a t perio the e were used to estimate i e.
T t Heaters and Duct Furnaces Ann pmen AMA 2003)
litera r and t furnace inshipment data spanning the entirtilize shipment da
he de s. Instead, th
verage annual shipment volume for thanstalled bas
d and device lifetim
able A13-A1: Gas Uni ual Shi ts (Source: G
Year Gas Unit heaters Gas Duct Furnaces 1992 130,884 15,114 1993 147,338 15,378 1994 167,187 15,718 1995 171,256 16,812 1996 184,670 16,201 1997 202,350 16,692 1998 206,185 15,845 1999 209,195 14,033 2000 216,141 12,908 2001 166,137 11,049
Average, 1992 to 2001 180,134 14,978 Thus, the installed base estimate equals the product of the average lifetime and the average annual shipments from 1992 to 2001. The drawback of this approach is that the backward extrapolations may not capture sales trends. AEC Calculations
The AEC estimate for unit heaters was based on an earlier study performed by ADL in 2001 using shipment data from 1991 through 1995. To account for the increase in the installed base from 3.2 million in 1995 to 3.9 million in 2001, the AEC estimate was increased proportionally to the increase in installed base, approximately 20%. The result is a change from the 1995 AEC
escribe the analyses performed to produce the original 0.54 quad estimate.
The AEC includes energy consumed by devices in both the commercial sector and industrial
ad, umption data
for buildings in the manufacturing sector (see Table A13-A2).
of 0.54 quad to an AEC based on 2001 data of 0.65 quad. The following three paragraphsd
building sectors. ADL (2001b) provides an estimate of commercial sector unit heater AEC; however, no estimate for the AEC of unit heaters in the industrial sector could be found. Instethe gas unit heater AEC estimate was derived from gas space heating energy cons
13-7

Table A13-A2: Gas Unit Heaters AEC Calculation
Type Data Source Commercial sector gas unit(quad)
heater consumpt 0.20 ADL (2 ) ion 001b
Total Manufacturing sector total gas ion (quad) 0.40 MECS ) consumpt (1998
% in Manufacturing sector consumed by gas unit heaters 85 % ADL Estimate
Manufacturing sector gas unit heater consumption (quad) 0.34 Calculation
Total sector gas unit heater consumption (quad) 0.54 ommercial and Manufacturing sector Sum of C
Because the stock split of commercial-size unit heaters between the two building sectors was u cturing r e uming that g ng in the manufacturing sector. This yields an estimate that gas unit he o f primary energy per y
er AEC was developed, using the same procedure as used for e duct furnaces, i.e., based on the average unit heater output, the installed base, average duty
cycle and the seasonal efficiency data. Using this method yields an AEC of ~1.0 quad, a value IA) survey estimates that industrial space heating
consumed a total of about 0.4 quad of gas. Even if unit heaters consume all of this heat, the total for
n and unutilized
quipment. The above estimate of 0.54 quad seems to be a more accurate estimate. The gas duct furnace AEC estimate is derived by estimating the total installed capacity of duct furnaces and multiplying it by the average annual duty cycle for duct furnaces:
nknown, the industrial/manufa secto nergy consumption was estimated assas unit heaters account for a large percentage (85%) of gas heati
aters c nsume about 0.54 quad oear.
As a check, another gas unit heatth
that is clearly too high. The 1998 MECS (E
gas consumption estimate would be 0.6 quad (0.2 for the commercial consumption plus 0.4 the industrial consumption), much less than the above estimate of ~1 quad. The high estimatiomay occur for a variety of reasons, including widespread equipment over-sizing e
cycledutyaveragebaseinstallednewtypicalefficiencyseasonal
AEC ⋅⋅= 8760)(
outputsizeunitAverage )(⋅ ,
where the ycle equals th heat to the peak-heating load:
duty c the ratio of e annual ing load
loadheatingPeakloadheatingAveragecycledutverage ya =
W duty cycle data from E-2 com er m (see Table A13-A3) performed for presentative warehouses in two climates(LBL, 1990) were used to model duct furnace duty
ycles, as these products are often deployed in buildings similar to warehouses.
.
arehouse DO put odel runsrec
13-8

13-9
Table A13-A3: Gas Duct Furnaces Load Data
Type Annual Heating Load (Btu/ft2)
Peak Heating Load (Btu/hr–sq. ft)
Approximate Duty Cycle
(%) Warehouse, Fort Worth, TX 7902 13 6.8 Warehouse, New York City 28,226 22 14.6 Average NA NA 10.7 The average gas duct furnace size (output in kBtu/hour), is assumed equal to the approximate
ipment-weighted aveage over thsh e years 1991 to 1995. Table A13-A4 presents the data used in the calculations, resulting in an AEC estimate of 0.10 quad.
Table A13-A4: Gas Duct Furnace AEC Calculation
Type Data Source Av 321 Calculation based on data from GRI (1997) erage unit size (output, kBtu/hr) Seasonal effic ge installed) 72 RI 1995 iency (avera % GAverage duty cycle 10.7 alculatio A4 % C n , Table A13-AEC(quad) 0.1 Calculation
Energy Savings Potential Calculations
‘typical new’ AFUE to that of the technology:
)
For a given heating load, energy consumption is proportional to the inverse of the seasonal efficiency, in this case AFUE. Thus, the energy savings potential of an advanced technology equals one minus the ratio of the
( )( LevelTechUEAF
Sav.
−
ings potenti displayed below (Table A13-A5).
t Heaters and Duct Furn
NewTypicalAFUEPotentialings 1=
This yields the sav als
Table A13-A5: Gas Uni aces Savings Potential
Type Seasonal
Efficiencies (% FUE), A
Savings Potential
(%)
AFUE Source
Current Stock 72 NA GRI (1995) Typical new 74 NA ADL (2001b) Condensing 93 20% Power vent 80 8% Estimates
Product Literature and

A14.1 Background
An exit sign is an internally illuminated sign that is permanently fixed in place and used to identify the exit from a building. An internal light source illuminates the sign or letters spellin“EXIT”. The sign is connected to only one source of power at a time (normal or emergency), andis designed to remain illuminated via an emergency power source upon failure of the normal power supply (EPA, 2004a).
g
Exit signs in the U.S. consume 0.0282 quad of energy per year (see Table A14-1). The total installed base of exit signs is approximately 33 million units, with LED, compact fluorescent andincandescent representing 26.4, 5.0 and 1.6 million units respectively (NCI, 2003).
Table A14-1: Exit Signs Background Data
Data type Value Source Ins NCI, 2003. talled Base, million (2002) 33.0
Equipment Lifetime, years 11 Calculated, based on NEMAthe estimated installed base.
, 2003 and
AEC, quad 0.0282 NCI, 2003; Calculation
A14.2 Product Technology Descriptions and Market Presence
Table A14-2 presents the technology level and wattage levels for several types of exit signs ncandescent, CFL, and LED). (i
Table A14-2: Exit Sign Technology Levels and Wattage Values
Technology Level Wattage Comments/Source Stock Efficiency 8.9 Weighted average wattage from installed base and
product class average wattages. NCI, 2003. Typical New (LED) 6 Estimated average. NCI, 2003. Minimum Efficiency
NA No national energy standard, however California has passed standards that are consistent with ENERGY STAR® (CEC, 2003).
Incandescent 32 Weighted average wattage. NCI, 2003. Compact Fluorescent 17 Weighted average wattage. NCI, 2003. Light Emitting Diode 6 Weighted average wattage. NCI, 2003. Best Available Efficiency (LED light source)
< 1 Some ENERGY STAR® Exit Signs are listed that consume less than one watt. EPA, 2004b.
ENERGY STAR® Efficiency 5 W per face
ENERGY STAR® Program Requirements for Exit Signs. Eligibility Criteria. EPA, 2004a.
Maximum Efficiency (Future Technology)
< 1 Electroluminescent and some LED panels already use 1 W or less.
A14 Illuminated Exit Signs
14-1

LED exit signs have considerably lower operating costs than other types of signs and last muchlonger. According to E-Source, LED signs typically cost less than $5 a year to operate, depending on the model and local utility costs (E Source, 2002). Total costs over a ten-year period, including first cos
t, energy, and maintenance will be approximately $380 for candescent signs and about $65 for LED signs. Even on a first cost basis, which can be an
uires a
battery. LED first costs have fallen in part due to the red LED being a relatively mature and well-understood technology (NCI, 2003).
iciency standard, but they do fall under the voluntary E S ® program (see Table A14-3). The E S ® requirement for
inimportant purchasing determinant, LEDs have become competitive. While incandescent signs without battery backup are still marginally less expensive than LED signs, the price for bothtypes of signs with battery backup is about the same because the incandescent system reqmuch larger
Currently, exit signs do not have a national minimum effNERGY TAR NERGY TAR
exit signs requires 5 watts or less per face. In addition, certain luminance specifications that are consistent with National Fire Protection Association requirements must be met (EPA, 2004a). Some key performance characteristics are presented in Table A14-3.
Table A14-3: ENERGY STAR® Requirements for Exit Signs
Selected Performance Characteristics ENERGY STAR® Specification (summarized) Input power demand ≤ 5 W per face Luminance contrast Greater than 0.8 Average Luminance Greater than 15 candelas/meter2 (cd/m2) measured at
normal (0o) and 45o viewing angles Min al (0o) and
iewing anglimum Luminance Greater than 8.6 cd/m2 measured at norm
45o v es Maxim uminance an 20:1 measured at normal ( o
g angles um to Minimum L Less th 0o) and 45
viewin D ics, better performance, enhanced safety cap lities, a ing program NERGY STA ® D exit signs have already captured a s t s arket. With an 8 t share, the alled base of D exit eady
ore than 26 million compared to about 1.6 million for incandescent signs (NCI, 2003).
ife afety Code and the Underwriters Laboratory 924 Standard for Safety: Emergency Lighting and
Power Equipment.
ue to favorable econom abi nd markets such as E
hare of this mR Exit Signs, LE0% marke
ignifican signs is alr inst LE
m
A14.3 Test Procedure Status
The Department of Energy does not have a test procedure for Exit Signs. The draft Energy Bill states that the “Test procedures for illuminated exit signs shall be based on the test method used under Version 2.0 of the ENERGY STAR® program of the Environmental Protection Agency for illuminated exit signs.” This test procedure draws on several industry standards and methods, including the National Fire Protection Association document 101 LS
14-2

The appropriate true root-mean square watt meter at the input voltage representing ion. For an exit signinclude battery ci all t ful measur e. T nt po are to be ured in acc nce with NFPA 101, Life
afety Code, figure A-7-10.6.3. The positions where the luminances are to be measured are Standard for Safety: Emergency Lighting and Power
Equipment.
d Y
exit signs in 2002. The proportions of technologies
s are still being sold (NCI, 2003).
input power of the exit sign model is measured with an normal operat
be connected and model that
ly charged before anysements are mad a battery, the rcuit sh he battery
he luminance measureme sitions meas ordaSdetailed in figure 40.9 of UL 924,
A14.4 Energy Savings Estimates and Calculations
The energy savings calculation for exit signs assumes an installed base of 33 million units nation-wide, which operate 24 hours per day (NCI, 2003). The energy savings scenario is baseon the standard level included in the draft Energy Bill, requiring all new exit signs to be ENERGSTAR® compliant products. Table A14-4 presents data for the baseline scenario, including
stalled base, wattage, and usage data for inshown in the table for the baseline scenario were held constant over the analysis period. This was done to be consistent with the methodologies followed in other priority setting analyses, and because even though more than 90% of exit signs sold today are based on LED technology, incandescent and CFL unit
Table A14-4: Exit Sign Installed Base, Wattage, and Usage Data
Exit Sign Type Installed Base/Stock Wattage Hours of
use/day References
Light Emitting Diode 26.5 million 6 24 NCI, 2003.
Compact Fluorescent Lamp 4.9 million 17 24 NCI, 2003.
Incandescent 1.6 million 32 24 NCI, 2003.
As discussed earlier, approximately eighty percent of the installed base of exit signs have already converted to ENERGY STAR® compliant technology. Thus, the energy savings estimate is based on converting the remaining 20% of exit signs, which includes both compact fluorescent and incandescent technology signs. For this analysis, it was assumed that half of the replacement incandescent and compact fluorescent exit signs have two faces and that half have one face, meaning the average energy consumption is reduced to 7.5 watts per unit, based on the threshold for ENERGY STAR® certification (less than 5 watts per face). The annual energy savings that would result from this conversion is approximately 0.008 quad. On a cumulative basis over the analysis time period of 2010-2035, the energy savings totals 0.16 quad (see Table A14-5).
14-3

Table A14-5: Exit Sign AEC and Potential Energy Saving Estimates
Technology/ Standard Level
AEC (quad)
Annual Energy Savings Potential
(quad)
% Energy Savings
Energy Saving Potential (2010-2035),
(quad) Baseline 0.0282 NA NA NA Scenario 1 (ENERGY STAR®) 0.0200 0.008 29% 0.16
A14.5 Regulatory Actions and Cumulative Burden
Exit signs are not subject to regulatory action on energy consumption, however there are
on, but also the fety, battery life operating hours, and other non-energy related aspects that are critical to the
The State of California adopted energy standards for exit signs such that input power, luminance contrast, minimum luminance, average luminance and maximum to minimum luminance ratio of illuminated exit signs manufactured on or after March 1, 2003 must meet the requirements of the ENERGY STAR® program.
A14.6 Issues Impacting Potential Energy Efficiency Standards
There is good availability of ENERGY STAR® compliant products on the market already, and the trend is toward LED-based technology due to its savings on both energy and maintenance.
considerable regulations associated with dimensions and visibility, operating hours and other safety-related attributes. Indicative of this is the fact that the ENERGY STAR® test method for qualification includes not just a method for measuring the energy consumptisasafe operation of exit signs (EPA, 2004a).
14-4

14-5
6,
PA, 2004a. ENERGY STAR® Program Requirements for Exit Signs, Eligibility Criteria; PDF
e at: http://www.energystar.gov/ia/products/prod_lists/exit_signs_prod_list.pdf
EMA, 2003. Email from Kyle Pitsor, Lighting Division Manager, National Electrical
References
CEC, 2003.California Energy Commission, Appliance Efficiency Regulations. P400-03-01Sacramento, California. Eposted on the EPA website, available at: http://www.energystar.gov/ia/partners/product_specs/eligibility/exit_signs_elig.pdf EPA, 2004b. Exit Signs Product List, Current as of Feb. 27, 2004. PDF posted on the EPA website, availabl NCI, 2003. Energy Savings Estimates of Light Emitting Diodes in Niche Lighting Applications, prepared for U.S. Department of Energy, Office of Energy Efficiency and Renewable Energy, Building Technologies Program by Navigant Consulting, November 2003. NManufacturers Association, Roslynn, Virginia. June 2, 2003.

A15.1 Background
The Energy Policy Act of 1992 (EPACT 92) established minimum average lamp efficacy standards (LPW) for incandescent reflector lamps, although ellipsoidal reflector (ER) and breflector (BR) shaped lamps were exempted. EPACT 92 defines an ER incandescent reflector la
ulge
mp as “a reflector lamp with an elliptical ction below the bulb’s major diameter and above its approximate baseline as shown in Figure 1
(RE) on page 7 of ANSI C79.1-1994 (see 10 CFR 430.22) and a finished size and shape as shown in ANSI C78.21-1989 including the referenced reflective characteristics in part 7 of ANSI C78.
EPACT 92 defines an BR incandescent reflecto as “a reflector lamp with a bulged section lb’s major diameter and above its a line as shown in Figure 1 (RB)
C79.1-1994 (se FR 4340 lamp ha ttage of 120 or less” (10 CFR 430.2(c)(16)).
amps were exempted, they reflector lamp shipments. However, since that t rket forces have expanded the proportion
ey now t mores. ER/BR lamps have a lower first- e
igher operating costs because of their lower relative efficacy.
se
21-1989.”
r lampbelow the bu pproximate baseon page 7 of ANSI e 10 C 0.22). A BR lamp has a lamp wattage of 85 or less than 66 and a BR s a lamp wa At the time ER/BR l constituted a very small percentage of total
ime, maof ER/BR lamps so that thUnited Stat
represen e than 50% of all reflector lamp sales in the cost than regulated reflector lamps, but they hav
h There are approximately 165 million ER/BR lamps in service in the United States. This estimate was prepared by looking at national shipments supplied by the National Electrical ManufacturersAssociation (NEMA), and then deriving a national installed base using estimates of operating hours and lamp lifetimes. These reflector lamps (ER/BR) consume approximately 0.166 quad per year (see Table A15-1).
Table A15-1: ER/BR Background Data
Data type Value Source
Installed Base, millions (2003 165 Calculated estimate, based on NEMA, 2003; NCI, 2002; and Manufacturer Catalogues, 2003.
Annual Shipments, millions (2003) 108 NEMA, 2003.
Equipment Lifetime, years 1.57 Weighted average lifetime of ER/BR lamps in residential and non-residential applications (NCI, 2002).
AEC, quad 0.166 Calculation, all sectors
A15.2 Product Technology Descriptions and Market Presence
a ly
A15 Lamps, Incandescent Reflector – ER/BR
Two energy savings scenarios were considered for ER/BR lamps. The first scenario evaluates lamp efficacy standard in which ER/BR lamps are subject to a halogen standard (approximate
15-1

18% increase in lamp efficacy). This first scenario is approximately equivalent to the EPACT 9standard for reflector lamps (removing the exem
2 ption for ER/BR). The second energy savings
scenario evaluates a higher efficacy standard in which incandescent reflector lamps shift to the halogen infrared reflector (HIR) technology (54% increase in lamp efficacy). This higher
rporating HIR technology are only starting to enter the market. Only efficacy levels were used for this energy savings analysis; standard level is commercially available, but lamps inco
dimming capability or usage was not considered.
Table A15-2: ER/BR Technology Levels and Efficacy Values
Technology Level Value Comments/Source Stock Power Consumption 71 W Shipments estimate and average wattages, NEMA,
2003. Typical New 71 W Unregulated lamp. Minimum Efficiency None No known standard. Incandescent Efficiency 12 LPW Efficacy of a 75-watt reflector lamp. Halogen Efficiency 14.2 LPW Halogen reflector lamp of equivalent light output. Halogen IR Efficiency 18.5 LPW Halogen infrared reflector lamp of equivalent ligh
output. t
Maximum Efficiency (Future 18.5 LPW No known method of improving performance of Technology) incandescent technology without changing technology
(e.g., CFL, LED) ER/BR lamps are being considered because the volume of these lamps shipped has been increasing since the exemption was made in EPACT 1992. By 2001, 57% of all reflector lamp ship 03), and these lamps accounted for an estimated 77% of all reflector lamp shipments to the residential sector (NEMA, 2003 major NEM manufacture roduc p. T alf tor lamp sales are now exempt from .
ts of parabolic aluminized reflector (PAR) lamps, which a gulated byed h from 9-2002. In co st, shipme amps
trend is primase in es that use reflector lamps (e.g.,
cessed ceiling and track lighting), and 2) BR lamps are the lowest first-cost reflector lamp, Recent shipment information on ER lamps do not
show an increasing trend like BR, however, the Department is concerned that if standards were promulgated for BR lamps and not ER, the ER-shape lamp may expand its market share, as it may then become the lowest first-cost reflector lamp. For this reason, the Department is considering ER/BR lamps as a group of reflector lamps.
A15.3 Test Procedure Status
The Department of Energy has a test procedure for reflector lamps that already covers ER/BR lamps (10 CFR 430 Subpart B, Appendix R, 4.3). This test procedure applies to all reflector
ments were ER/BR lamps (NEMA, 20and NRCan, 2002). All
hus, more than hA lamp rs now p EPACT
e this lam of all reflec
Shipmen re re and are compliant with EPACT, showcontinue to increase over that sam
no growte time period at
199about 6% a year. This
ntra nts of BR larily due
to two factors: 1) an incre the prevalence of low-cost fixturrealthough they do have higher life-cycle costs.
15-2

lamps, and incorporates appropriate test methods promulgated by the Illuminating Engineering Soc
A15.4 E s Estima Calcu
The energy savings calculation for ER/BR lamps sed on a ca ed installed base of 165 m R, ulged pa aluminum ctor (BPA its. The e R, B BPAR l s 1.5 million, 157.6 million, and 5.6 million respectively. The shipment-weighted average wattages for ER lamps is 87W, for BR
, 2003). Operating hours are 2.4 hours all other sectors (NCI, 2002).
s potential is 0.09 quad, a savings of 54.2%. Over the
Table A15-3: ER/BR Efficacy and Usage Data
iety of North America (IESNA) and ANSI.
nergy Saving tes and lations
is ba lculat refleillion lamps, including ER, B and b rabolic R) un
stimated installed base of E R, and amps i
lamps is 68.8W, and for BPAR lamps is 135.9W (NEMAper day in the residential sector and 9.7 hours per day in Two energy savings scenarios are considered (see Table A15-3). The first evaluates a lamp efficacy standard in which incandescent reflector lamps (12 LPW) shift to halogen technology (14.2 LPW). This first energy savings scenario is approximately equivalent to the standard already in place for regulated reflector lamps. The second energy savings scenario evaluates a lamp efficacy standard in which incandescent reflector lamps shift (12 LPW) to the HIR technology (18.5 LPW). For the first scenario, the annual energy savings potential is 0.0304 quad, a savings of 18.3%. Over the cumulative analysis period 2010-2035, these savings total 0.74 quad. For the second cenario, the annual energy savings
cumulative analysis period 2010-2035, these savings total 2.17 quads (see Table A15-4).
Scenario Efficacy Hours of use/day
Residential
Hours of use/day Commercial
Industrial, Outdoor References
Bas 2.4 9.7 NCI, 2002. eline 12 LPW
Scenario 1 (H .2 LPW 2.4 2002. alogen, EPACT 92) 14 9.7 NCI,
Scenario 2 (HIR techn 18.5 LPW 2.4 NCI, 2002. ology) 9.7
15-3

Table A15-4: ER/BR AEC and Potential Energy Saving Estimates
Technology/ Standard Level
AEC (quad)
Annual Energy Savings Potential
(quad)
% Energy Savings
Energy Saving Potential
(2010-2035) (quads)
Baseline 0.166 NA NA NA Scenario 1 (Halogen, EPACT 92) 0.136 0.030 18.3% 0.74 Scenario 2 (Halogen Infrared) 0.076 0.090 54.2% 2.17
A15.5 Regulatory Actions and Cumulative Burden
ased on the definition of incandescent reflector lamps in EPACT 92, ER/BR lamps were xempted from standards. EPACT 92 states “Incandescent reflector lamp (commonly referred to s a reflector lamp) means any lamp in which light is produced by a filament heated to candescence by an electric current, which is not colored or designed for rough or vibration
service applications that contains an inner reflective coating on the outer bulb to direct the light; has an R, PAR, or similar bulb shape (excluding ER or BR) with an E26 medium screw base; has a rated voltage or voltage range that lies at least partially in the range of 115 and 130 votes; has a diameter that exceeds 2.75 inches; and is either low(er)-wattage reflector lamp that has a rated wattage between 40 and 205; or a high(er)-wattage reflector lamp that has a rated wattage above 205.” (see 10 CFR 430.2(c)(16)). The Energy Policy Act of 1992 set the following standard for incandescent reflector lamps: “Each of the following incandescent reflector lamps manufactured after November 1, 1995 shall meet or exceed lamp efficacy standards shown in the table in this paragraph.
Table A15-5: Incandescent Reflector Lamps
Beain
Nominal Lamp Wattage (Watts)
Minimum Average Lamp Efficacy (LPW)
40-50 10.5 51-66 11.0 67-86 12.5
86-115 14.0 116-155 14.5 156-205 15.0
(10 CFR 430.2(n)(2)). ER/BR lamps are not part of the draft Energy Bill. If the Energy Bill becomes law, the Department must decide whether to continue attempting to cover this product or reprioritize ER/BR lamps for a later date.
15-4

A15.6 Issues Impacting Potential Energy Efficiency Standards
s were forced to comply with the PACT 92 standard for reflector lamps, consumers may start installing general incandescent
lectors or optics designed for recessed fixtures) in their fixtures designed for flector lamps. This type of substitution could be problematic because when installed in a
t
One issue that has been raised with respect to the regulation of ER/BR lamps is the consumer demand for low-first-cost reflector lamps. If ER/BR lampElamps (A-type) or other shapes of these lamps (e.g., K-type director lamps which do not have aluminized refrerecessed lighting fixture or track-lighting housing, the system efficiency (lamp + fixture) could be lower when compared to the same fixture operating with an ER/BR lamp, which directs lighmore efficiently.
15-5

15-6
CI, 2002, “U.S. Lighting Market Characterization Volume I: National Lighting Inventory and f
References
NEMA, 2003, ER/BR Reflector Lamp Shipment and Market Share Data, provided by NEMA in a meeting with the Department of Energy on April 2003. NRCan, 2002, Reflector Study by Navigant Consulting, Inc. for Natural Resources, Canada, March 2002. NEnergy Consumption Estimate”, prepared by Navigant Consulting, Inc. for the Department oEnergy. Washington D.C. September 2002. Available at: http://www.eere.energy.gov/buildings/documents/pdfs/lmc_vol1_final.pdf.

A16.1 Background
Large unitary air conditioners (A/C) (i.e., those with more than 240 kBtu/hr of cooling cheat, cool, and ventilate comm
apacity) ercial buildings. This section focuses on cooling performance.
he heating function may be provided by a gas-fired warm air furnace section, electric resistance heat, or, less commonly, a heat pum used in those areas of the d heat generally has an Annual Fuel Utilization Efficiency (AFUE) within a couple of percentage points of 80%.
ost common large unitary figuratio sing of top nly or so-called year-round cooli s
ty range together, the installed base of approximrs consu approximately 0.32 quad for cooling (see Table A16-1).
6-1: Large Unitary ($240kBtu/hour) Background Data for Maj
Tp cycle. Electric resistance tends to be
U.S. that have mild winters and low heating degree-days. Gas-fire
The m A n/C co n e is th le package horizontal roconfiguration (cooling o with ng and heating), but split system
ately 421,000 are also used in this capacilarge unitary air conditione
. Almes
Table A1 or Unit Classes
Type Data type Value Source Installed base, units 12 U.S2,000 . Census Bureau (1988-2002) Annual shipments (2002), units 10,950 U.S. Census Bureau (2002) Equipment lifetime, years 15 DO
>65kBtu/hour to <240kBtu/hour E (2003) for Unitary
Single package cooling only
AEC, quad (cooling only) 0.12 ADL (1999), ADL (2001); for 1995 Installed base, units 182,000 U.S. Census Bureau (1988-2002) Annual shipments, units 14,790 U.S. Census Bureau (2002) Equipment lifetime, years 15 DOE (2003) for Unitary
>65kBtu/hour to <240kBtu/hour
Single package year-round
AEC, quad (cooling only) 0.12 ADL (1999), ADL (2001); for 1995 Installed base, units 101,000 U.S. Census Bureau (1988-2002) Annual shipments, units 7,140 U.S. Census Bureau (2002) Equipment lifetime, years 15 DOE (2003) for Unitary
>65kBtu/hour to <240kBtu/hour Split systems
AEC, quad (cooling only) 0.08 ADL (1999), ADL (2001); for 1995 Installed base, units 406,000 U.S. Census Bureau (1988-2002) Annual shipments, units 32,880 U.S. Census Bureau (2002) Equipment lifetime, years 15 DOE (2003) for Unitary
>65kBtu/hour to <240kBtu/hour
All Large Unitary (above categories)
AEC, quad (cooling only) 0.32 ADL (1999), ADL (2001); for 1995 *All AEC values based on fraction of total shipments tonnage, all units $240kBtu/hour Shipments of all large unitary air conditioners in 2002 totaled 33,265 units. In 1993, what was then a record level of 18,860 large unitary air conditioners, were shipped. Without analyzing the capacity distribution of either 1993 or 2002 shipments, shipments grew over that nine-year period at a compound annual growth rate of 6.5 %. The often-predicted slow-down to a mature industry unit volume growth rate has yet to materialize.
A16 Large Unitary Air Conditioners (≥ 240 kBtu/hr)
16-1

A16.2
The m age systems. Table A16-2 summarizes efficiency levels.
Table A16-2: Large Unitary Air Conditioner Technology levels and UEC Values
Product Technology Descriptions and Market Presence
ajority of large unitary air conditioners are single pack
EER Btu/Watt-hr Technology Level 240-760
kBtu/hr >760
kBtu/hr Comments/Source
Stock 8.5 ~8.2 Meet ASHRAE 90.1-1989 ~Typical New 5 ~9.2 Meet ASHRAE 90.1-1999 ~9.Minimum Efficiency StandASHRAE 90.1 (1999)
ard 9.5 9.2
ASHRAE (1999)
EnergyStar® N/A N/A ENER AR® 03) GY ST (20CEE Tier 2 10.0 10.0 CEE (2003) Maximum Available 1.0 9 Lenn 2003) for 360 kBtu/hr
Car 004) for kBtu/hr. Hig fficiencie ievable with som tom pack
1 .2 ox (rier (2
240 to>760
her e s ache cus ages
A16-3 summarize efficiency
levels for unitary air con m for Energy Efficiency asing capacity,
given that the effects of large scale usually favor increased large unitary. First, space and
ent, making it ecessary to reduce duct and coil face areas relative to capacity. In the largest sizes, the need to
r
Table s current DOE and ASHRAE 90.1 standards and minimum ditioners that fall under the voluntary Consortiu
(CEE) and EnergyStar® programs. Minimum efficiency levels decrease with increwhich is somewhat counter intuitive, efficiency. Some unique circumstances account for this situation insize constraints become more acute with increasing size of unitary equipmnfit a single package on a standard flat bed truck is a size constraint. The ARI 340/360 test procedure also recognizes that larger capacity systems cover more floorspace and require longeduct runs.
16-2

Table A16-3: Energy Efficiency Levels - Standards and Voluntary Efficiency Programs for Electrically Operated Air- at-Pumps (Cooled Air-Conditioners and He in Cooling Mode Only)
Minimum EER*
Standard <65 kBtu/hr
65 – 135 kBtu/hr
135 – 240 kBtu/hr
240 – 760 kBtu/hr
>760 kBtu/hr
ASHR 989
package)**
8.9** ** 8.5 8.2 AE 90.1 – 1
10 SEER (split
system) 9.7 SEER
(single
8.5
ASHRAE 90.1 – 1999*** (Baseline level for ongoing rulemaking)
10 SEER (split
system) 9.7 SEER
(single package)
10.3 9.7 9.5 9.2
EnergyStar® 13 SEER 11.0 10.8 N/A N/A CEE Tier 1 (obsolete) 12 SEER 10.3 9.7 9.5 9.5
CEE Tier 2 11.3
(13 SEER) 11.0 10.8 10.0 10.0
LEED Requires that minimum standard be met, credit points based on >20% energy savings relative to minimum efficiency standard
*Minimum EER: Steady-state energy efficiency ratio, as determined by ARI 210/240 or 340/360 test procedures at ARI Standard Conditions **Current DOE/EPAct, as of January, 1992 ***Deduct 0.2 EER from units with heating other than electric resistance heat.
The CEE Tier 1 level was discontinued as of 31 December, 2002 “in response to increasing Federal standards” (CEE 2003). In 2001, about 43% of units (presumably for all size ranges) met or exceeded the Tier 1 level, while 16% of units (all size ranges) met the Tier 2 level (CEE 2003). Table A16-4 shows the external static pressure requirements (accounting for distribution duct pressure loss) for the indoor airside, as specified in the unitary test procedure, ARI-340/360. Theincreasing external static pressure increases the blower power. Since indoor air moving power typically equals 15 to 20% of unit power draw, a 25% to 40% increase in a
ir moving power decreases EER by 4 to 8%. This accounts for a large part of the difference between the
all and large unitary. minimum efficiency levels for sm
16-3

Table A16-4: Minimum External Static Pressure for Testing Unitary Products (from ARI 2000)
Standard Capacity Ratings kBtu/hour For Tons
Minimum External Resistance [in H O] 2
135 to 210 11.3 - 17.5 0.35 211 to 280 17.5 - 23.3 0.40 281 to 350 23.2 - 29.2 0.45 351 to 400 29.2 – 33.3 0.55 401 to 500 33.3 – 41.7 0.65
501 + 41.7 and over 0.75 The basic options for increasing the full load, standard conditions EER are to specify more efficient refrigerant compressors, increase condenser and/or evaporator coil face area and heat transfer area, and to specify high efficiency fans, blowers, or motors. Application of one or more
off that is constrained by total unit cost for each manufacturer, including aforementioned unit size.
annual
andard 62, energy recovery heat and/or enthalpy exchange between the ventilation mcon itions (per ANSI/ARI 340/360). This app o red ergy consumption. Airside e scri A everal circumstances, can also
s in seas l energy cons n. Variable air volume (VAV) wer, cou with compressor capacity modulation (typically through
pressors) is her approach t n appreciably reduce seasonal energy y in a AV is the need to deliver a constant flow of outdoor E 62. ther hand, if a separate blower brought in the outdoor
ons in outdoor air delivery in e
n reduce annual HVAC energy consumption in buildings by decreasing the quantity of outdoor air that requires conditioning; it does not impact unitary equipment efficiency performance (TIAX 2002).
ir
tested according to ANSI/ARI
andard 340/360. The standard provides for determining the EER at a standard condition, analogous to the EER at the DOE A test condition in the NAECA test procedure for residential
efficiency measure is a design-specific cost-benefit trade
Some large unitary products may also include one or more technologies that can reducecooling energy consumption and/or improve seasonal energy efficiency. When the unitary AC supplies outdoor ventilation air mandated by ASHRAE St
ake up air and exhaust air can reduce energy sumption by a significant amount (10% or more) under standard test cond
roach can alsbed by ASHR
uce seasonal enE 90.1-1999 under s
um ioconomizers, which are pre
realize significant reductionor blo
ona ptoperation of the indo pledthe use of multiple com anot hat caconsumption. One difficult pplying Vair to comply with ASHRAair (and another blower rec
On the oted additiircula onal air for cooling and heating purposes), varying the
recirculated indoor airflow rate would have minimal impact on outdoor air delivery rates. Large mand control ventilation (DCV) allows reductiunitary AC with de
response to building occupancy, for which measurements of CO2 levels in occupied zones servas a proxy (per ASHRAE Standard 62). Thus, DCV ca
A16.3 Test Procedure Status
A DOE energy efficiency test procedure has not been instituted for commercial unitary aconditioners. Industry (ANSI/ARI) test procedures are used instead. ASHRAE 90.1 minimum efficiency requirements for large unitary products are specified interms of EER. The efficiency of large unitary air conditioners is st
16-4

central air conditioners. It also determines Integrated Part Load Value (IPLV) as an approximation of seasonal average performance. In addition, ANSI/ARI 340/360 enables performance evaluation for units that have a separate pre-cooling coil for outdoor ventilation air In general, the IPLV procedure in ARI 340/360 does not appear to correlate w
.
ell with actual asonal performance (based on discussions with major unitary equipment manufacturers). The
ers on seasonal energy use. It also does not consider the energy performance of efficient methods of preconditioning outdoor ventilation air (e.g., heat or enthalpy recovery exchange). ASHRAE
n and energy savings for new technologies, along ith anticipated annual energy savings from 2008-2030.
Table A16-5: Energy Savings Potential Associated with Various Efficiency Improvements
seARI 340/360 Engineering Committee is beginning to work on an improved method for determining part-load performance and seasonal energy consumption. Furthermore, ARI 340/360 does not account for the seasonal energy impact of VAV, DCV, or economiz
guideline V, however, addresses this configuration.
A16.4 Energy Savings Estimates and Calculations
All energy savings calculations assume that the entire installed base of large unitary air conditioners operate at the ASHRAE 90.1 – 1999 minimum EER levels. Table A16-5 summarizes the potential energy consumptiow
Technology/Standard Level UEC Savings Potential [%]
Energy Savings Potential [2010-2035;
quads] Typical New Device (9.5 EER) — — CEE Tier 2 (10.0 EER) 5% 0.25 Best Available (11.0 EER) 14% 0.7* Typical New Device with VAV ~30%** 1.1 Typical New Device with ERV ~40%*** 1.6 *Calculated as if 11.0 EER is available across the entire capacity range. However, 11.0 EER products are generally not available at the upper end of the capacity range. **From ADL (1999) ***Includes the savings from VAV. Does not include heating-season savings. Savings can vary, depending on climate, ventilation rates, and other factors. From TIAX (2003).
A16.5 Regulatory Actions and Cumulative Burden
A significant fraction of all large unitary air conditioners are produced by manufacturers who produce smaller commercial unitary and residential central air conditioners. Commercial unitary equipment ≥65 kBtu/hr and <240 kBtu/hr have been subject to minimum EER since the provisions of the Energy Policy Act of 1992 (EPAct) took effect. Residential central air conditioners and heat pumps have been subject to minimum SEER and HSPF standards since 1990. Standard levels were increased in 1993 and in 2004 with the end of the rulemaking litigation on residential central air conditioners and heat pumps.
16-5

The Energy Policy Act of 1992 (EPAct) first established minimum efficiency levels for ommercial unitary based on the recommended minimum efficiency levels for unitary in SHRAE 90.1-1989. ASHRAE 90.1-1999 raised the minimum efficiency. An ongoing DOE
el. To avoid having to manage deral performance standard.
ore information should be available in early April on the status of ARI’s proposal.
allation) ecome more acute with increasing equipment capacity. Some efficiency improvement
ts. y faces the phase out of HCFC refrigerants. Switching to HFC alternatives
uch as HFC-410a) may impact efficiency.
cArulemaking for unitary equipment with capacity ≥65 kBtu/hr and <240kBtu/hr is considering whether to adopt 90.1-1999 efficiency levels or to set more stringent levels. Several states are considering setting standards at the state levmultiple state-level standards, ARI is developing a proposal for a feM
A16.6 Issues Impacting Potential Energy Efficiency Standards
As discussed in Section A16.2 above, space constraints (for both shipping and instbmeasures (such as increasing coil size or adding energy recovery/enthalpy exchange) tend to increase unit physical size, so unit physical size constraints may limit efficiency improvemenAlso, the industr(s
16-6

References ADL, 1999, “Energy Consumption Characteristics of Commercial Building HVAC Systems –
olume II: Thermal Distribution, Auxiliary Equipment, and Ventilation”, Final Report by Arthur VD. Little, Inc. to the U.S. Department of Energy, Office of Building Technology, State and Community Programs, October. Available at: http://www.eren.doe.gov/buildings/documents/pdfs/comhvac.pdf . ADL, 2001, “Energy Consumption Characteristics of Commercial Building HVAC Systems – Volume I: Chillers, Refrigerant Compressors, and Heating Systems”, Final Report by Arthur D. Little, Inc.to US Department of Energy, Office of Building Technology, State and Community Programs, April. Available at: http://www.eren.doe.gov/buildings/documents/pdfs/hvacvolume1finalreport.pdf . ARI, 2000, ARI Standard 340/360, 2000, Standard for Commercial and Industrial Unitary Air-Conditioning and Heat Pump Equipment, The Air-Conditioning and Refrigeration Institute: Arlington, VA. ARI, 2003, “Guideline V: 2003 Guideline for Calculating the Efficiency of Energy Recovery Ventilation and Its Effect on the Efficiency and Sizing of Building HVAC Systems,” The Air-Conditioning and Refrigeration Institute: Arlington, VA. ASHRAE, 1989, ASHRAE/IES Standard 90.1 – 1989, Energy Efficient Design of New Buildings Except New Low-Rise Residential Buildings, ASHRAE Press: Atlanta, GA. ASHRAE, 1989, ASHRAE/IESNA Standard 90.1 – 1999, Energy Efficient Design of New Buildings Except Low-Rise Residential Buildings, ASHRAE Press: Atlanta, GA. Carrier, 2004, Telephone conversation between Dick Lord of Carrier and Bob Zogg of TIAX, March 15, 2004. CEE, 2003, “Fact Sheet: High-Efficiency Commercial Air Conditioning and Heat Pumps,” Consortium for Energy Efficiency. Available at: http://www.cee1.org/resrc/facts/hecac-fx.php3 . DOE, 2003, “DOE Rulemaking: Commercial Unitary Air Conditioners and Heat Pumps,” Documentation available at: http://www.eere.energy.gov/buildings/appliance_standards/commercial/ac_hp.html . ENERGY STAR®, 2004, “EnergyStar® Program Requirements for Light Commercial HVAC – Eligibility Criteria,” Downloaded on 9 March, 2004, from: http://www.energystar.gov/ia/partners/product_specs/eligibility/lchvac_elig.pdf . Lennox, 2003, Engineering Data, L Series® – LCA.C – 60 Hz, 13 to 60 Ton, Packaged Cooling. Available at: http://pirl.lennox.com/C03e7o14l/ehb_lcalcc_13to30_0309.pdf
16-7

16-8
onsumption Characteristics of Commercial Building HVAC Systems – Volume III: Energy Savings Potential,” Final Report by TIAX LLC to US Department of
nergy, Office of Building Technology, State and Community Programs, July. Available at:
TIAX, 2002, “Energy C
Ehttp://www.eren.doe.gov/buildings/documents/pdfs/hvacvolume3finalreport.pdf . TIAX, 2003, “Energy Efficient Rooftop Air-Conditioner—Design, Development and Field Testing”, Final Technical Report by TIAX LLC to US Department of Energy, National ETechnology Laboratory, DOE Cooperative Agreement Num
nergy ber DE-FC26-99FT40640, June.
U.S 40 eports – Refrigeration, Air Conditioning, and War
. Census Bureau, 2002 , “Current Industrial Rm Air Heating Equipment: 2002,” Issued July.
40 Reports were also used for the years 1988 through 2001, in which case the title changes to reflect the actual year, e.g., for 2001the title is: “Current Industrial Reports – Refrigeration, Air Conditioning, and Warm Air Heating Equipment: 2001.”

A17.1 Background
e
Table A17-1: Residential Furnace Fan Background Data
Residential gas-fired furnaces use electricity for the circulating air fan as well as for other electrical components. In many applications, the furnace fan is also the air handler for the air conditioner. The electricity use for non-weatherized furnaces is shown in Table A17-1. Sincone circulating air blower is included in every residential furnace, the installed base and equipment lifetime are the same as for residential furnaces.
Data type Value1 Source/Comments
Installed 48 Based on historical shipments and eq years Base, millions .9 uipment lifetime of 20
Annual Shipments, millions 3.38
3.20 (year 2006 st)
(K(A
endall 2002) ppliance 2004) foreca
Equipment Lifetime, years 20 (Appliance 2004)
0.58 B nnual en
ased on installed based and stock aergy use AEC, quad
1 t, and AEC values are for the Installed base, annual shipmen year 2002 except where noted.
-curved impellor is made of stamped sheet metal. The air handlers are sized move air for the air conditioner with which the furnace is installed.
Nom r (hp) and operate at about 1075 rpm. Usually, ⅓ hp motors are used in furnaces designe air conditioner and ½ hp motors for a four-ton air conditioner. The motors are built with multi usually three or four, which connect to different windings in the m for different speed settings. The lower speeds are much less efficient than the higher speeds. The motorsetting when erating. urnaceused are sold PSC er. The combined efficiency of these motor and blowers is typically 10 to 15 percent. Ano tor technology that is also used in aces is rmanent magnet (BPM)
otor. This variable speed motor technology is more efficient and more expensive than PSC motors. The variable speed capabilities of these motors are used in as much as 20 percent of condensing furnaces. The primary selling point is the extra consumer utility of being able to operate the furnace air handler at a reduced airflow, thereby improving consumer comfort and reducing noise. This motor is currently used with standard forward-curved centrifugal blowers.
A17 Residential Furnace Fans
A17.2 Product Technology Description and Market Presence
The baseline design for the furnace circulating-air blower is a centrifugal design with a forward-curved impellor in a sheet metal scroll powered by a permanent split capacitor (PSC) induction motor. The forwardto
inal motor sizes are less than 1 horsepowed for a three-ton
ple electrical taps,otor
is usually set to the highest speed operation, a lower motor setting is motor and centrifugal-type blow
the air conditioner is op. About 95 percent of furnaces
For fwith a
ther mo furn the brushless pem
17-1

With DOE assistance, General Electric has developed a prototype backward inclined blower with
ent geometry of this blower requires it to operate at a higher otor to be smaller in size. Improvements to the aerodynamics of the
M
Table A17-2: Residential Furnace Fan Technology Levels and UEC Values
a smaller BPM motor. The differspeed, but allows the mblower inlet cone were also included. This prototype blower has about double the efficiency of the baseline blower and blower-motor design. The impellor is likely to be more expensive,because it is more difficult to make, but the motor will likely be less expensive than current BPmotor designs because it is smaller. Table A17-2 provides the UEC values corresponding to the furnace fans discussed above.
Technology Level UEC
(kWh/yr) Source/Comments
PSC motor, forward-curved blBased on metered data from condensing
ower 1,085 furnaces with air conditioners in Wisconsin. (Pigg 2003)
BPM motor, forward-curved blower 645 Based on metered data from condensing furnaces with air conditioners in Wisconsin. (Pigg 2003)
BPM motor, backward-inclined 566 Based on laboratory comparison with baseline blower and blower-motor. blower (Walker et.al. 2003)
Table A17-3 provides the change in retail price for the two BPM designs listed in Table A17-2. The BPM retail price is based on a cost estimate from the Sachs and Smith (Sachs and Smith 2003) multiplied by a manufacturer cost-to-retail price markup estimated by DOE (DOE 2002The additional price of the backward-inclined blower is based on a DOE estimate for the balone (DOE 2002).
Table A17-3: Residential Furn
). lower
ace Fan Retail Prices
Technology Level Delta Retail Price
($2002) Source/Comments PSC motor, forward-curved blower NA NA
BPM motor, forward-curved blower $174
Manufacturer cost estimated by Sachs and Smith multiplied by a retail price markup estimated by DOE (Sachs and Smith 2003; DOE 2002)
BPM motor, backward-inclined blower $275 Motor same as above. Blower price from
DOE (DOE 2002)
17-2

A17
The current DOE test procedure for furnaces m l U(AFUE), nclude . The tes ure does specify how to calculate Ann Use ( However this meter is not an efficand it includes electricity from other furnace components as well. EAE is measured during furn ling perfo ce and it does not i e the impact of standby power or air handler operation during air conditioning. The t and Control Ass tion International (AMCA) and ASHRAE have
eveloped Laboratory Methods for Testing Fans for Aerodynamic Performance Rating that could e adapted for use as the basis of a test for furnace air handler efficiency (ANSI/AMCA 210-99;
ANSI/ASHRAE 51-1999).
17.4 Energy Savings Estimates and Calculations
able A17-2. Also provided in Table A17-4 is the economic benefit or burden to consumers for each efficiency level taking into account both utility bill savings and the increased equipment costs.
taking the national annual
umulative bill savings and equipment cost increases are
.3 Test Procedure Status
easures Annual Fuet proced
tilization Efficiency which does not i electricity
ual Auxiliary Electricity EAE). para iency descriptor
ace testing. It does not measure air-hand rman nclud
Air Movemen ociadb
A
Table A17-4 presents the energy savings potential for the efficiency levels specified in T
Consumer national utility bill savings for a given year are derived by energy savings and multiplying it by the corresponding electricity price from the DOE-Energy Information Administration’s Annual Energy Outlook 2004 (DOE 2004). Consumer national equipment cost increases are derived by taking the per unit change in equipment cost and multiplying it by the annual shipments. Csummed over the time period 2010-2035 with the net benefit or burden being the difference between the two values.41 .
41 Economic calculations are performed with a spreadsheet tool which is available on the DOE Building Technologies Program, Appliances and Commercial Equipment Standards web site. http://www.eere.energy.gov/buildings/appliance_standards/docs/fy05_priority_setting_spreadsheets.zip
17-3

Table A17-4: Residential Furnace Fan Potential Energy Savings and Economic Impact Estimates
Technology Level UEC
(kWh/yr)
Energy Saving Potential, 2010-2035
(quads)
Potential Economic Benefits/Burdens;
Cumulative NPV 2010-2035 (billions of $2002)
PSC motor, forward-curved blower 1,085 NA NA
BPM motor, forward-curved blower 645 5.02 6.19
BPM motor, backward-inclined blower 566 5.92 5.44
A17.5 Regulatory Actions and Cumulative Burdens
The AFUE of furnaces are regulated for energy efficiency under NAECA. Furnace manufacturers currently measure and publish the airflow performance of furnaces for a range of static pressures. These are guidelines for contractors to use when installing furnaces.
A17.6 Issues Impacting Potential Energy Efficiency Standards
Perhaps the largest issue impacting potential efficiency standards is energy legislation currently being considered by Congress. If approved and enacted, DOE would be allowed to regulate the electricity consumption of furnace fans. DOE has not adopted a test procedure to rate the efficiency of residential furnace fans. This will have to be done before any standards are adopted. The current test procedure includes, but doesn’t require certification of, EAE. However this parameter is not an efficiency descriptor and it includes electricity from other furnace components as well. EAE is measured during furnace testing. It does not measure air-handling performance and it does not include the impact of standby power or air handler operation during air conditioning. The type of motor-blower combinations used in residential furnaces fans is also used in heat pumps. If DOE decides to pursue the regulation of furnace fan efficiency, the Department will need to determine if heat pump air handlers are also covered under residential furnace fans. Finally, as noted earlier, the backward-inclined blower is a prototype design. Thus, the energy and cost impacts may change significantly if the blower goes into mass production. The effectiveness of backward-inclined blowers has been confirmed through their use in large commercial equipment. But until backward-inclined blowers have been mass-produced for residential applications, their cost and energy impacts will be to some degree uncertain.
17-4

17-5
References
2004. “Healthy Times Ahead.” January, 2004.
U.S. Departm ergy (DOE), Energ mation Administration. 2004. “Annual Energy Outlook 2004 with projections to 2025.” W ington, D 2004). January 2 W e, and D.E. Bren 003. Im ficiency in
ications. LBNL 5 Berkeley: Lawrence Berkeley National aboratory.
Appliance Magazine. Kendall, Mark. 2002. Appendix A - Furnace Shipments; Appendix B - Boiler. Comment # 24 submitted to Docket Number: EE-RM/STD-01-350 Shipments. Arlington, VA: GAMA. Pigg, Scott. 2003. “Electricity Use by New Furnaces: A Wisconsin Field Study, Appendices.” Madison: Energy Center of Wisconsin. Sachs, H.M. and S. Smith. 2003. “Saving Energy with Efficient Residential Furnace Air Handlers: A Status Report and Program Recommendations,” American Council for an Energy-Efficient Economy (ACEEE), Washington DC A033, April 2003. U.S. Department of Energy (DOE), Office of Energy Efficiency and Renewable Energy, Building Technology Program, "Engineering Analysis, Furnaces and Boilers Standards Rulemaking, Draft Report for Review". September 19, 2002. http://www.eere.energy.gov/buildings/appliance_standards/residential/pdfs/furnace_engineering_analysis.pdf
ent of En y Inforash C. DOE/EIA-0383(
004.
alker, I.S., M.D. Minge n3606.
er. 2 proving Air Handler EfResidential HVAC ApplL

A1 d
hting fixtures oper nt light subcate of re minate
ient le space f ne f adjustable lighting level. Newer living
ly require mor ortabl y from ‘hard-wired’ fixture tive wall sconces. Newly
es and apartments tend to be built with switched electrical outlets rather than ures because lders ing
OE, 2002). This increases the demand for plug-in-the-wall lamps, including
here are approximately 69 million torchieres in the U.S. that consume approximately 0.238
nting
8.1 Backgroun
Torchieres, lig that ate a halogen, incandescent or compact fluoresclu
e(CFL) source, are aliving spaces with indirect, am
goryb
sidential lighting. These fixtures are used to ilight. Torchieres are popular because of their function –
illuminating a larg rom o ixture, often with an spaces typicaltrend awa
e p e (i.e., plug-in-the-wall) lamps because there is a generals, such as chandeliers or decora
constructed homhard-wired fixtfixtures (D
bui allocate less than 1% of their construction budget to light
torchieres. Tquad of energy per year (see Table A18-1). Total annual shipments of torchieres are approximately 12 million units, with halogen, incandescent, and compact fluorescent accoufor 1.3, 10.0, and 0.9 million units respectively (Ecos Consulting, 2003).
Table A18-1: Torchiere Background Data
Data type Value Source Installed Base, millions (2003 69 Ecos Consulting, 2003 Annual Shipments, millions (2003) 12 Ecos Consulting, 2003
Equipment Lifetime, years 4.5 Ecos Consulting, 2003 AEC, quad 0.238 Calculation, installed base
A18.2 Product Technology Descriptions and Market Presence
Two efficiency levels for torchieres were examined – one limiting the wattage to 190 watts per fixture (i.e., the California standard and the level in the pending federal energy bill) and one
miting the wattage to 70 watts per fixturli e, approximately equivalent to the ENERGY STAR®
A18 Torchieres
standard (see Table A18-2). Only wattage levels were considered; dimming capability or usage was not considered.
18-1

Table A18-2: Torchiere Technology Levels and Wattage Values
Technology Level Wattage Comments/Source Stock Efficiency 253 stalled base efficiency; Ecos Consulting, 2003. Average inTypical New 225 Incandescent torchiere wattage; Ecos Consulting, 2003. Minimum Efficiency 190 Energy Bill Standard; CEC maximum effective Draft
March 1, 2003. Incandescent 225 03. Ecos Consulting, 20Best Available Efficiency (CFL light source)
55 Assume light output of energy star light source held constant with225 W incandescent (3500 lumens)
ENERGY STAR® Efficiency
70 equivalent to halogen baseline. Assume light output of CFL source
Maximum Efficiency 40 Assume efficacy will improve to highest linear florescent tube (100 (Future Technology) LPW) and 4000 lumen output. Halogen and incandescent torchieres have a broad range in price due to differences in shades andmetal fixture surface finishes, but generally the most popular units are the least expensive,ranging between $10 and $30. CFL torchieres require a ballast and fluorescent lamp, in addition to aesthetic costs such as shades and finishes. Generally, CFL torchieres cost between $$70. Operat
40 and ing costs tend to be about $18 less per year for operating a CFL torchiere, with a
simple payback period of between 1.7 to 2.2 years. However, the majority of the residential torchiere market is first-cost sensitive, favoring the cheaper, but less efficient incandescent and
torchiere sales in 2003, while lower-wattage incandescent torchieres captured 82% of the market. In 2003, CFL torchieres
eir halogen torchieres for more energy efficient and afer CFL torchieres. Utilities have also sponsored rebate programs for CFL torchieres. The
o not have a national minimum efficiency standard, but they are included the voluntary ENERGY STAR® program for residential light fixtures (see Table A18-3). The
es
cifies that torchiere style portable fixtures shall be dimmable from 100 percent to 30 ercent or less of maximum light output, or be switchable to three levels of brightness, not
halogen torchieres. Halogen torchieres accounted for about 11% of
represented approximately 7% of the units shipped (Ecos Consulting, 2003). To promote the use of CFL torchieres, several utilities and university campuses have sponsored trade-in programs, where people can swap thsmaximum efficiency technology, which assumes that CFL technology efficacy will improve tothat of the most efficient linear fluorescent tube currently available, is not commercially available in torchiere form at this time. Currently, torchieres dinENERGY STAR® Residential Light Fixture Program requires 60 LPW for indoor fixtures 24 inchor shorter that consume 30 or more watts. The 60 LPW requirement translates to an allowed wattage of approximately 67 W per fixture, assuming a 4,000-lumen output. ENERGY STAR® also spepincluding the off position (DOE & EPA, 2001).
18-2

Table A18-3: ENERGY STAR® Requirements for Indoor Lights
Selected Performance Characteristics ENERGY STAR® Specification (summarized) System efficacy (LPW) All fixtures ≤24 inches and ≥30W
≥60 LPW
Power factor ≥0.5 Lamp current crest factor ≤1.7 per ANSI C82.11-5.6.1 Lamp color rendering CRI ≥ 80 for CFLs Dimming Torchiere style portable fixtures shall be dimmable from 100% to
30% or less of maximum light output, or be switchable to three levels of brightness, not including the off position.
Safety Must comply with NFPA 70, NEC Other ANSI and UL standards apply to specific fixture types
Despite concerted marketing efforts and more than 30 different compliant models for consumers
® cos
he Department does not presently have a test procedure for measuring the energy consumption
n respective programs. The three sections are: (A) the draft Energy Bill; (B) the alifornia Energy Commission standard; and (C) the ENERGY STAR® Torchiere program.
than 190 and (2) Shall not be capable of operating with lamps that total more than 190
atts.”
ture
re
to choose from, ENERGY STAR torchieres still represent just 7% of the units shipped (EConsulting, 2003). In fact, between 2001 and 2003, estimates of torchiere sales increased while the units sold and total shipment percentage of ENERGY STAR® CFL torchieres declined. Generally, consumers have not responded to the marketing efforts, bulk procurements, subsidies and awareness raising initiatives conducted to increase the market share of Energy Star torchieres.
A18.3 Test Procedure Status
Tof torchiere fixtures. However, industry-recognized testing procedures published by IESNA are available which provide standardized test methods by which engineers can measure the energy consumption and light output of a torchiere. This section is divided into three parts, each summarizing the test method by which torchieres are evaluated iC A) Draft Energy Bill In the event that Congress passes the draft Energy Bill, a national standard will be enacted for torchieres manufactured on or after January 1, 2005 that “(1) Shall consume not morewatts of power;w The IESNA has a test method that can be used to measure the power consumption of a fix(IESNA Guide for the Selection, Care, and Use of Electrical Instruments in the Photometric Laboratory; LM-28-98), addressing the first criterion, i.e., that the torchiere consume not mothan 190 watts of power.
18-3

The second criterion – that the torchiere shall not be capable of operating with lamps that total more than 190 watts – requires interpretation in order to develop an appropriate test method.
r a
test lamp(s). hese issues would need to be resolved in order to develop an acceptable test procedure.
, Section
more
ors
he ENERGY STAR® program includes torchieres in its portfolio of products. Rather than basing elig program sets a minimum efficacy (lumens of light produced per watt of energy consumed) requirement. The EPA has developed a test procedure by which turers can r nce. This proced es IESNA standards docum ethods for measuring efficacy and demonstrating c As presently written, this test p dure pertainse sources t coul t as metal halide high-
ity discharge lamps. Also, the test procedure measures the efficacy of the source rather tics
form the basis of a test procedure that can be
There are two possible interpretations of this statement. First, it could be interpreted to mean theluminaire was not originally designed to operate at more than 190 watts. This would require an inspection of the complete torchiere and lamp, as sold, to ascertain that the rated lamp wattage totals 190 watts or less. Second, a stricter interpretation of this clause would mean that the luminaire is not capable of operating at more than 190 watts. In order to ascertain whetheluminaire is capable of operating at more than 190 watts, a test method would need to be developed where lamps rated at more than 190 watts are installed into the fixture undergoing testing. In this scenario, the fixture may simply not operate (“not capable of operating”), or could operate, but only consuming 190 watts instead of the rated wattage of theT B) The California Energy Commission Standard The State of California recently passed an energy consumption standard for torchieres. Amending the California Code of Regulations, Title 20: Division 2, Chapter 4, Article 41605.3 (n), California mandated that torchieres manufactured on or after March 1, 2003 shall notconsume more than 190 watts and shall not be capable of operating with lamps that total than 190 watts. This standard does not provide or specify a test procedure, as it was not recognized as being necessary. Rated out-of-the-box wattage is the metric by which regulatdetermine compliance. C) The ENERGY STAR® Torchiere Program T
ibility on a wattage limit, the Energy Star
manufac demonst ate complia ure referencents LM-9 and LM-66 as the m
ompliance.
roce to fluorescent-source torchieres, to the xclusion of other light tha d meet he minimum efficacy such
intensthan overall system (fixture) efficacy. Expanding the test procedure to incorporate fixture opand thus measure the overall light output and performance of the luminaire may be advantageous. The IESNA publishes methods for photometric testing of luminaires (rather than simply light sources) that can be used to determine torchiere system performance. For testing indoor luminaires using HID or incandescent filament lamps, the IESNA publishes LM-46-98. For indoor fluorescent luminaires, the IESNA publishes LM-41. These two publications can be pplied to torchieres on the market today, and coulda
applied to all torchieres, irrespective of the light source used by the luminaire.
18-4

A18.4 Energy Savings Estimates and Calculations
The energy savings calculation for torchieres assumes an installed base of 69 million torchierincluding halogen, incandescent and compact fluorescent units. The average wattage, weighted by proportion of the installed base, is 253 watts (Ecos Consulting, 2003). Operating hours are3.4 hours per day (Home Energy, 2001). Two energy savings
es,
scenarios are considered (see
Table A18-4). The first scenario assumes a standard of 190 W, which assumes that those torchieres that consume more than 190 watts will move to exactly that consumpt
®ion level. The
cond scenario approximates an ENERGY STAR Torchiere standard. Although ENERGY STAR® is an efficacy-based standard, to keep the scenarios in consistent units, this standard has been app e Table A18-4). In the energy are the thconsum 0 watts s, all shipm f torchiere d been gre n 190 watts would become 190 watts. This first scenario approximates the energy savings potential of t the nergy Bil e second sc o, it was assu hat all torchieres must consume less than 70 watts. This assumption approximates the energy consumption standard for ENERGY STAR®, which has a residential fixtures efficacy threshold of 60 lumens per watt for torchieres. The typical source light output of a 225 incandescent
rce light output of a 300 watt halogen torchiere is approximately 5400 lumens. Therefore, the Department selected a source light
se
roximated as an energy consumption limit of 70 watts (se
first scenario, e less than 19
savings. Thu
calculated underents o
assumptions that ha
at all torchieres ater tha
he torchiere standard in draft E l. In th enari med t
torchiere is approximately 3200 lumens. The typical sou
output averaging these two products at 4300 lumens. This level attempts to balance customer utility (light output), while recognizing the market is transitioning to a lower light output torchiere (incandescent). At the ENERGY STAR® standard of 60 lumens per watt, 4300 lumensequates to 71.7 watts, or rounded down to 70 watts.
Table A18-4: Torchiere Wattage and Usage Data
Scenario Wattage Hours of use/day References
Baseline (weighted average installed base, 2003) 253 3.4 Ecos Consulting, 2003; Home Energy Magazine, 2001.
Scenario 1 (190 watt max) 225 3.4 Ecos Consulting, 2003; Home Energy Magazine, 2001.
Scenario 2 (70 watt max) 70 3.4 Home Energy Magazine, 2001.
For the potential energy saving estimate calculation, a slight modification to the baseline
d by incandescent torchieres, and halogen torchieres have been experiencing ecreasing proportions of shipments ever since the late 1990’s, when several fires caused by the
In 2003, the proportional breakdown of torchieres shipped was approximately 11 percent halogen (300 watts), 82 percent incandescent (225 watts) and 7 percent compact fluorescent (70
torchiere was made. In Table A18-4, the weighted average installed base of torchiere lamps isreported as 253 watts. This represents approximately 50 percent of the installed base being halogen torchieres (300 watts), 44 percent being incandescent torchieres (225 watts) and 6 percent being compact fluorescent torchieres (70 watts). However, it is clear that shipments in 2003 were dominatedhalogen fixtures raised concern among consumers.
18-5

watts). This 2003 shipment-weighted average wattage corresponds to an average baseline wattage torchiere of 222 watts, approximately 12 percent lower than the 253 watts for the
stalled base weighted average wattage. Due to the relatively short operating lives of these escent
’s torchiere market.
Table A18-5: Torchieres AEC and Potential Energy Saving Estimates
infixtures (3.1 – 6.6 years) and the fact that the market shown a strong preference for incandtechnology, the Department calculated the energy savings potential for this product using the 2003 shipment-weighted average wattage for torchieres. The Department believes that this adjustment to the baseline would give a more accurate estimate of the energy savings potential, as it more accurately reflects the dynamic qualities of today
Technology/ Standard Level
AEC (quad)
Annual Energy Savings Potential
(quad)
% Energy Savings
Energy Saving Potential (2010-2035),
(quads) Baseline 0.238 NA NA NA Scenario 1 (190 watt max) 0.199 0.038 16% 0.87 Scenario 2 (70 watt max) 0.095 0.143 60% 3.25
A18.5 Regulatory Actions and Cumulative Burden
The State of California passed an energy consumption standard for torchieres that took effect recently. Amending the California Code of Regulations, Title 20: Division 2, Chapter 4, Article 4, Section 1605.3 (n), California mandated that torchieres manufactured on or after March 1, 2003 shall not consume more than 190 watts and shall not be capable of operating with lamps that total more than 190 watts. Safety concerns for halogen torchieres have instigated regulatory attention and consumer demand for halogen torchiere substitutes. Halogen torchiere bulbs operate at extremely high temperatures, (700 to 1,000oF compared to 100 to 200oF for a comparable CFL torchiere) and thus present a fire hazard (DOE & EPA, 2001). Following multiple fires, Underwriters Laboratories banned halogen bulbs above 500W from UL listing in 1996. Many universities have also banned halogen torchieres from dormitories for safety reasons (LBNL, 1999).
A18.6 Issues Impacting Potential Energy Efficiency Standards
Although not mandated, many manufacturers have responded to torchiere safety concerns by installing safety measures such as lower wattage bulbs and protective cages to avoid materials coming into contact with the bulb. Any future efforts made to reduce the bulb temperature and/or wattage (e.g., the 190W standard in California) will impact lighting technology options available to torchiere lamps. Concern also exists regarding residential consumer acceptance of CFL light sources, specifically with respect to light quality, e.g., color rendering index (CRI). CRI is a measure of the quality of
18-6

color that a light source renders an object. Whereas incandescent and halogen light sources have CRI index of 100, CFL light sources score a CRI of approximately 80-88.42
onsume not more than 190 atts of power; and (2) Shall not be capable of operating with lamps that total more than 190
of the standard.
a In the event that Congress passes the Energy Bill, a national standard will be enacted for torchieres manufactured on or after January 1, 2005 that “(1) Shall cwwatts.” Issues related to this national standard have been raised, including the consideration of how to interpret and test the second clause
42 The ENERGY STAR® program mandates a minimum CRI of 80 for compact fluorescent lamps.
18-7

18-8
References
DOE, 2002, “The FY 2003 Priority-Setting Summary Report and Actions Proposed,” Appliance
OE & EPA, 2001, “ENERGY STAR Program Requirement for Residential Light Fixtures le at:
ust
BNL, 1998, “Energy Efficient Torchieres: From the Laboratory to the Marketplace,” c
Standards Program of the Department of Energy, August 22, 2002. Ecos Consulting, 2003. Estimated Inventory of Torchiere Lamps, prepared for the Department of Energy, Ecos Consulting, March 2003. DEligibility Criteria – Version 3.2,” Energy Star, Environmental Protection Agency. Availabhttp://www.energystar.gov/ia/partners/product_specs/eligibility/fixtures_elig.pdf. Home Energy, 2001 ,“CFL Torchiere Top Choice,” Home Energy Magazine Online. July/Aug2001. Accessed on March 30, 2004 at http://hem.dis.anl.gov/eehem/01/010709.html LACEEE 1998 Summer Study on Energy Efficiency in Buildings, August 23-28, 1998, PacifiGrove, California. Available at: http://eetd.lbl.gov/btp/papers/41648.pdf.

A19
ated c c rned or directed to . Traffic modules (or “balls”) typically come in eight- and twelve-inch
nals, consist of a s communicate s (stop, ca r , yellow, and
green light signals.
ls are an integral f t s, safely nt of ve s. I (NCI, ). A traffic signals,
a aigna CI,
e
.1 Background
Traffic signals are illumintake a specific action
traffi ontrol devices by which people are wa
diameter round sig ing light source and a lens. These modulemovement message ution o prepare to stop, and go) to drivers through red
Traffic signa part o he transportation system in the United Stateregulating the movemesignalized intersections
hicle n the United States, there are approximately 312,500 t each intersection, up to three types of 2003
including the three-colored ball, arrow, and controlling traffic flow. In
bi-modal arrow, can be found for the purposes of pproximately 75ddition, %, or about 234,400 intersections, also 2003). have pedestrian crossing s ls (N
Combining the inventories of colored ball, arrow, and pedestrian crossing signals, there arapproximately 15.3 million traffic signal modules in the U.S. These modules, including both incandescent and light emitting diode (LED) types, consume approximately 0.0374 quad of energy per year (see Table A19-1).
Table A19-1: Traffic Signals Background Data
Data type Value Source Installed Base, million units (2002 15.3 NCI, 2003 Equipment Lifetime, years 10 Estimate. AEC, quad 0.0374 NCI, 2003.
A19.2 Product Technology Descriptions and Market Presence
Table A19-2 presents the technology level and wattage levels for two types of traffic signals (incandescent and LED).
A19 Traffic Signal Modules
19-1

Table A19-2: Traffic Signal Technology Levels and Wattage Values
Technology Level Wattage Comments/Source Average energy consumption of installed base (watts)
95.2 Stock weighted average wattage, NCI, 2003.
Typical New (LED) 9.6 Assume LED. Estimated average. NCI, 2003. Minimum Efficiency None,
CEC: 2003
No national energy standard, however California has passed minimum efficiency standards that are consistent with ENERGY STAR®.
Incandescent 126.9 Average of 8-inch and 12-inch signals. NCI, 2003. LED 9.6 Estimated average LED. NCI, 2003. Best Available Efficiency (LED light source)
9.6 Assume LED, installed base weighted average
ENERGY STAR® Efficiency Variable See Table A19-3 Maximum Efficiency (Future Technology)
5.0 Assume doubling of LED system efficiency by 2020, relative to today’s LED efficiencies (NCI, 2003).
LEDs are emerging as the technology of choice for traffic and pedestrian control signals. Throughout the United States, municipalities are retrofitting and installing LED technology in these applications. These systems have a higher first-cost, however the energy and maintenance savings benefits offset those initial costs in a reasonable time period, justifying the replacements. For example, a red LED traffic signal costs about $75 compared with $3 for an incandescent signal. However, when considering the lower energy consumption, extended operating life and associated maintenance savings, over a seven year period, the cost of ownership of red LED traffic signals is about one-third that of incandescent traffic signal (CEE, 2002). Currently, traffic signals do not have a national minimum efficiency standard, but they do fall under the voluntary ENERGY STAR ® program (see Table A19-3). The ENERGY STAR® LED traffic signal modules include the following: LED vehicular traffic signal modules, including arrow modules and LED pedestrian signal modules. In addition, other (non-LED) technology products may be considered if they meet Institute of Transportation Engineer’s (ITE) Vehicle Traffic Control Signal Heads Part 1 or 2 (or other relevant future ITE specification), as well as consuming energy at or below the standards in Table A19-3. (EPA, 2004)
Table A19-3: Energy-Efficiency Criteria for ENERGY STAR® Qualified Traffic Signal Modules
Module Type Maximum Wattage (at 74°C)
Nominal Wattage (at 25°C)
12 inch Red Ball 17 watts 11 watts 8 inch Red Ball 13 watts 8 watts 12 inch Red Arrow 12 watts 9 watts 12 inch Green Ball 15 watts 15 watts 8 inch Green Ball 12 watts 12 watts 12 inch Green Arrow 11 watts 11 watts Combination Walking Man/Hand 16 watts 13 watts Walking Man 12 watts 9 watts Orange Hand 16 watts 13 watts
19-2

Due to their energy saving benefits and reduced maintenance costs of LEDs, as well as market transformation programs highlighting these advantages, approximately 30-33% of the traffic signal market has already moved to LEDs. Red signal heads have seen the highest level of market penetration at 39%, while green signal heads are approximately 29% LED. Because of their low duty-cycle, yellow LED traffic signals have a much longer payback period. This, coupled with the stringent luminosity specifications for yellow LED signals results in a low market penetration, assumed to be around 2% (NCI, 2003).
A19.3 Test Procedure Status
The draft Energy Bill states: “Test procedures for traffic signal modules shall be based on the test method used under the ENERGY STAR® program of the Environmental Protection Agency for traffic signal modules, as in effect on the date of enactment of this paragraph.” The ENERGY STAR® program for traffic signals specification states that “The products must meet the minimum performance requirements of the relevant ITE specification, and be tested under the conditions presented in Section 6.4.2 of the Vehicle Traffic Control Signal Heads, Part 2.”
A19.4 Energy Savings Estimates and Calculations
The energy savings calculation for traffic signal modules assumes an installed base of 15.3 million units (NCI, 2003). The energy savings estimate is based on the standard contained in the draft Energy Bill, which establishes an ENERGY STAR® efficiency standard. Thus, the remaining stock of non-LED traffic signals convert to ENERGY STAR® compliant LED modules. Although the Energy Star specifications allow for other products that meet certain requirements (see A19-3), only LED technology can currently meet these requirements (EPA, 2004). Table A19-4 presents data for the baseline scenario, including installed base, wattage, and usage data for traffic signals in 2002 (NCI, 2003).
Table A19-4: Traffic Signals Installed Base, Wattage, and Usage Data
Equipment Type Installed Base/Stock
Stock Average Wattage*
Hours of use/day References
Red 3,031,250 78 13.2 NCI, 2003. Yellow 3,031,250 120 0.7 NCI, 2003. Three
Colored-Ball Green 3,031,250 90 10.1 NCI, 2003. Red 937,500 85 2.2 NCI, 2003. Arrow
Green 937,500 91 2.2 NCI, 2003. Yellow 312,500 90 2.2 NCI, 2003. Bi-Modal
Arrow Green 312,500 98 2.2 NCI, 2003. Walking Man White 1,875,000 97 7.4 NCI, 2003. Hand Orange 1,875,000 97 7.4 NCI, 2003. *Note: Stock Average Wattage represents the weighted average wattage of the installed base of incandescent and LED traffic and pedestrian control signal heads.
19-3

Table A19-5: Traffic Signals Sign AEC and Potential Energy Saving Estimates
Technology/ Standard Level
AEC (quad)
Annual Energy Savings Potential
(quad)
% Energy Savings
Energy Saving Potential
(2010-2035) (quad)
Baseline 0.0374 NA NA NA Scenario 1 (Energy Star) 0.0086 0.029 77% 0.662
In this scenario, the annual energy consumption is reduced from 0.0374 quad to 0.009 quad, a 77% savings. Over the time period 2010-2035 the cumulative primary energy savings is more than half a quad, 0.66 quad (see Table A19-5).
A19.5 Regulatory Actions and Cumulative Burden
Traffic signals are not been subject to national regulation for energy efficiency. However, traffic signals are included in the draft Energy Bill currently being considered in Congress. If the Energy Bill is passed, the following standard will go into effect: “Traffic signal modules manufactured on or after January 1, 2006, shall meet the performance requirements used under the ENERGY STAR® program of the Environmental Protection Agency for traffic signals, as in effect on the date of enactment of this subsection, and shall be installed with compatible, electrically connected signal control interface devices and conflict monitoring systems.” The State of California considered energy efficiency standards for traffic signals in its proposed revisions to California Code of Regulations (CEC, 2002). In section 1605.3, the following revision is proposed to subsection (m) Traffic Signal Modules and Traffic Signal Lamps:
(1) Energy Efficiency Standards for Traffic Signal Modules. The power consumption of traffic signal modules manufactured on or after March 1, 2003, shall be not greater than the applicable values shown in [Table A19-6] when tested at the temperatures shown.
Table A19-6: California Energy Efficiency Standards for Traffic Signal Modules
Red Amber Green Type at 25ºC
(77ºF) at 74ºC
(165.2ºF) at 25ºC (77ºF)
at 74ºC (165.2ºF)
at 25ºC (77ºF)
at 74ºC (165.2ºF)
300 mm circular 11 watts 17 watts 22 watts 25 watts 15 watts 15 watts
200 mm circular 8 watts 13 watts 13 watts 16 watts 12 watts 12 watts
300 mm arrow 9 watts 12 watts 10 watts 12 watts 11 watts 11 watts
Lane control (X) 9 watts 12 watts No
requirement No
requirement No
requirement No
requirement Lane control (Arrow)
No requirement
No requirement
No requirement
No requirement 11 watts 11 watts
19-4

(2) Energy Efficiency Standards for Traffic Signal Lamps. The power consumption of traffic signal lamps manufactured on or after March 1, 2003, shall be not greater than 25 watts.
The California standard differs from the ENERGY STAR® standard in two ways – first, it does not include all the product classes and second, it adds some new ones that do not appear in ENERGY STAR®. However, those product classes it does have in common with ENERGY STAR® have identical standard levels.
A19.6 Issues Impacting Potential Energy Efficiency Standards
Commercial products from a range of manufacturers are available, and many municipalities are already switching voluntarily to ENERGY STAR® LED technology because it is more cost-effective. An issue that may impact the energy savings estimate for this product is the assumption holding the baseline technology mix constant (i.e., incandescent vs. LED). This assumption tends to increase the energy savings that would result from a possible standard, and may not be an accurate representation of today’s traffic signal market. In the late 1990’s, a few municipalities initiated programs to gradually replace incandescent traffic signals with LEDs as their capital budgets allowed. As LED signal heads became more affordable and the EPA started its ENERGY STAR® awareness program, more and more municipalities launched programs to upgrade their traffic signals. Municipalities are motivated by both the energy and the maintenance and labor savings associated with LED signals. The installed-base-weighted average percentage of LED signal heads in the United States is 27%. If this number were increased to 40%, the energy savings over the 2010-2035 analysis period would be reduced approximately 23%, to 0.50 quad of savings.
19-5

19-6
References CEC, 2002. California Energy Commission Express Terms (15-day language) and Notice of Adoption Hearing for Proposed Amendments to California Code of Regulations, Title 20: Division 2, Chapter 4: Energy Conservation, Article 4: Appliance Efficiency Regulatoins, Sections 1601-1608 and California Code of Regulations, Title 24: Part 6, Subchapter 2: Building Standards, Sections 110-111: Docket No. 01-AB970-APSTD, January 22, 2002. CEE, 2002. Consortium for Energy Efficiency, “LED Traffic Signals Provide Dramatic Energy Saivngs,” 2002, PDF file location: http://www.cee1.org/gov/led/led-cost.pdf EPA, 2004. Accessed EPA website to review PDF document of the eligibility requirements for traffic signal energy star eligibility requirements: http://www.energystar.gov/ia/partners/product_specs/eligibility/traffic_elig.pdf NCI, 2003. Energy Savings Estimates of Light Emitting Diodes in Niche Lighting Applications, prepared for U.S. Department of Energy, Office of Energy Efficiency and Renewable Energy, Building Technologies Program by Navigant Consulting, November 2003.


