This article was downloaded by: [University North Carolina - Chapel Hill] On: 30 July 2014, At: 07:32 Publisher: Routledge Informa Ltd Registered in England and Wales Registered Number: 1072954 Registered office: Mortimer House, 37-41 Mortimer Street, London W1T 3JH, UK Annals of the Association of American Geographers Publication details, including instructions for authors and subscription information: http://www.tandfonline.com/loi/raag20 The Geographic Sources of Innovation: Technological Infrastructure and Product Innovation in the United States Maryann P. Feldman a & Richard Florida b a Department of Economics and Management , Goucher College b Center for Economic Development, H. John Heinz Ill School of Public Policy and Management , Carnegie Mellon University Published online: 15 Mar 2010. To cite this article: Maryann P. Feldman & Richard Florida (1994) The Geographic Sources of Innovation: Technological Infrastructure and Product Innovation in the United States, Annals of the Association of American Geographers, 84:2, 210-229, DOI: 10.1111/ j.1467-8306.1994.tb01735.x To link to this article: http://dx.doi.org/10.1111/j.1467-8306.1994.tb01735.x PLEASE SCROLL DOWN FOR ARTICLE Taylor & Francis makes every effort to ensure the accuracy of all the information (the “Content”) contained in the publications on our platform. However, Taylor & Francis, our agents, and our licensors make no representations or warranties whatsoever as to the accuracy, completeness, or suitability for any purpose of the Content. Any opinions and views expressed in this publication are the opinions and views of the authors, and are not the views of or endorsed by Taylor & Francis. The accuracy of the Content should not be relied upon and should be independently verified with primary sources of information. Taylor and Francis shall not be liable for any losses, actions, claims, proceedings, demands, costs, expenses, damages, and other liabilities whatsoever or howsoever caused arising directly or indirectly in connection with, in relation to or arising out of the use of the Content. This article may be used for research, teaching, and private study purposes. Any substantial or systematic reproduction, redistribution, reselling, loan, sub-licensing, systematic supply, or distribution in any form to anyone is expressly forbidden. Terms
Transcript
This article was downloaded by: [University North Carolina - Chapel Hill]On: 30 July 2014, At: 07:32Publisher: RoutledgeInforma Ltd Registered in England and Wales Registered Number: 1072954 Registeredoffice: Mortimer House, 37-41 Mortimer Street, London W1T 3JH, UK
Annals of the Association of AmericanGeographersPublication details, including instructions for authors andsubscription information:http://www.tandfonline.com/loi/raag20
The Geographic Sources of Innovation:Technological Infrastructure andProduct Innovation in the UnitedStatesMaryann P. Feldman a & Richard Florida ba Department of Economics and Management , Goucher Collegeb Center for Economic Development, H. John Heinz Ill School ofPublic Policy and Management , Carnegie Mellon UniversityPublished online: 15 Mar 2010.
To cite this article: Maryann P. Feldman & Richard Florida (1994) The GeographicSources of Innovation: Technological Infrastructure and Product Innovation in the UnitedStates, Annals of the Association of American Geographers, 84:2, 210-229, DOI: 10.1111/j.1467-8306.1994.tb01735.x
To link to this article: http://dx.doi.org/10.1111/j.1467-8306.1994.tb01735.x
PLEASE SCROLL DOWN FOR ARTICLE
Taylor & Francis makes every effort to ensure the accuracy of all the information (the“Content”) contained in the publications on our platform. However, Taylor & Francis,our agents, and our licensors make no representations or warranties whatsoever as tothe accuracy, completeness, or suitability for any purpose of the Content. Any opinionsand views expressed in this publication are the opinions and views of the authors,and are not the views of or endorsed by Taylor & Francis. The accuracy of the Contentshould not be relied upon and should be independently verified with primary sourcesof information. Taylor and Francis shall not be liable for any losses, actions, claims,proceedings, demands, costs, expenses, damages, and other liabilities whatsoeveror howsoever caused arising directly or indirectly in connection with, in relation to orarising out of the use of the Content.
This article may be used for research, teaching, and private study purposes. Anysubstantial or systematic reproduction, redistribution, reselling, loan, sub-licensing,systematic supply, or distribution in any form to anyone is expressly forbidden. Terms
The Geographic Sources of Innovation: Technological Infrastructure and Product
Innovation in the United States Maryann P. Feldman* and Richard Florida**
*Department of Economics and Management, Goucher College **Center for Economic Development, H. john Heinz 111 School of Public Policy and
Management, Carnegie Mellon University
ince the sixteenth century, and perhaps before, the fortunes of regions and na- S tions have depended on new ideas and
new products that energized these places and facilitated their economic growth. If innovation is one of the keys to prosperity, then precisely how this happens-how a region breaks with convention and introduces new products-is a question of some significance. Not surprisingly, a variety of scholars have tried to find the keys to innovation, to unlock the doors of the inno- vation process, and to render what i s inside less mysterious and more accessible to less fortunate regions and states (Kline and Rosen- berg 1987; Landes 1969; Malecki 1991; Mokyr 1990; Rosenberg 1972; 1982). In his classic work on innovation and capitalism, Joseph Schumpeter (1 954) argues powerfully that eco- nomic growth requires innovation-the gen- eration of higher quality products at lower unit costs than had previously been obtainable.
What then do we know about this key vari- able for economic growth? The literature on innovation, as one might expect, is daunting; it ranges from heroic accounts of inventors and innovators to the more prosaic accent on the factors of land, labor, and capital. A full appre- ciation of innovation, of course, requires both of these approaches, and various others in be- tween; but in this paper we have space to deal with only a portion of the problem-the geo- graphic dimensions of innovation and their structural conditions in one place, the United States, and at one time, the early 1980s.
Geographers and economists have often noted the congruent clustering of economic activity and innovation. While much about this congruence remains unclear, we know that the
clustering or agglomeration of economic activ- ity creates scale economies, facilitates face-to- face interaction, and shortens interaction dis- tances. The interaction of all of these factors lends itself to innovation in economic pro- cesses and products. In contemporary devel- oped or mature economies, product innova- tion is also linked with the composition of firms and activities in these clusters. Especially im- portant in this regard is the technological infra- structure within these clusters. Building upon recent reconceptualizations in economic ge- ography and economics, we suggest that inno- vation in the late twentieth century is unusually dependent on an area's underlying technologi- cal infrastructure. Having burst beyond the confines of the organizational boundaries of an individual firm, innovation is increasingly de- pendent on a geographically defined infra- structure that is capable of mobilizing technical resources, knowledge, and other inputs essen- tial to the innovation process. This infrastruc- ture consists of sources of knowledge: net- works of firms that provide expertise and tech- nical knowledge; concentrations of research and development (R&D) that enhance oppor- tunities for innovation by providing knowledge of new scientific discoveries and applications; and business services with expertise in product positioning and the intricacies of new product commercialization. Once in place, these geo- graphic concentrations of infrastructure en- hance the capacity for innovation as their re- spective regions develop and specialize in par- ticular technologies and industrial sectors. Ge- ography, in other words, serves as the vessel in which entrepreneurs, venture capitalists, and other agents of innovation, organize an
Annals oi rhr Asaoc r.~r!un o1 Amri ican Geogrdphrr'. 8421, 7994, pp 270-229 0 Copyirght 7494 by A\rocratmn of American Geographers Publiihed by SlJckwell Publrshm, >38 M a n Srreel, Cmbndge, M A l I L I ? L and 708 CuMley Rod, Oxiord, OX4 716 UK
Dow
nloa
ded
by [
Uni
vers
ity N
orth
Car
olin
a -
Cha
pel H
ill]
at 0
7:32
30
July
201
4
The Geographic Sources of Innovation 211
infrastructure that brings together the crucial resources and inputs for the innovation pro- cess.
The empirical model of the geography of innovation presented here tests the hypothesis that innovation is concentrated in places that possess a well-developed technological infra- structure. The latter is defined in terms of the agglomerations of four indicators: 1) firms in related industries; 2) university R&D; 3) indus- trial R&D; and 4) business-service firms. Our analysis confirms and extends this hypothesis. We demonstrate that not only do innovations cluster geographically in areas that contain concentrations of specialized resources indica- tive of technological infrastructure, but also that these spatial concentrations of specialized re- sources mutually, and positively, reinforce a re- gion's capacity to innovate.
Innovation in Geographic Theory
Recent research on the geographic, organ- izational, and economic dimensions of innova- tion divides into three streams. The first of these deals with the location of R&D inputs and technology-based industries. Malecki's (1 981 ; 1985; 1986; 1990) documentation of the loca- tion of R&D activities has been followed up by research on the spatial distribution of high- technology industry and employment. Markusen, Hall, and Glasmeier (1 986) observe, for example, that high-technology industries are associated with higher wage rates and higher levels of unionization. Some scholars note that these clusterings of innovative capac- ity are less the result of planning and of con- scious strategy than of chance, serendipity, or "historical accidents" (Arthur 1990b; Scott and Storper 1990). It is difficult, however, to explain exactly why some regions are able to capture the consequent benefits of serendipity, while other regions are not and their fortunes lan- guish. A number of scholars have noted the increasing importance of innovation to the economic restructuring of advanced capitalist economies (Florida and Kenney 1990; Harvey 1989; Storper and Walker 1989). And there is a growing literature on national innovation sys- tems (Nelson 1993). However, given what is known about the innovation process, it is
worth considering sub-national or regional sys- tems of innovation.
A second stream of research attempts to do this, providing richly detailed case studies of the origins and development of "regional inno- vation complexes" (Stohr 1986). Case studies of Route 128 (Dorfman 1983), Silicon Valley (Saxenian 1985), and Orange County (Scott 1988), among others, suggest that innovation is a complex geographic process with multiple spatial determinants. The focus on individual case studies, while richly informative, does not yield the kind of general findings which would permit a broad conceptualization of the geo- graphic dimensions of innovation. The case study literature encourages scholars to shift fo- cus from the firm-level to a consideration of innovation as a social process reliant on exter- nal, geographically based sources of knowl- edge (Dosi 1988).
A third stream of literature considers the role of geographic agglomeration in technological innovation and economic development (Oakey 1985; Thomas 1985). Storper and Walker's (1 989) theory of "geographic industri- alization" captures the spatial nature of the process of technological change and industrial development. Other studies of the role of ag- glomeration economies focus upon the con- centrations of key resources and organizational networks (DeBresson and Amesse 1992). Flor- ida and Kenney (1988), for example, report that innovation is a product of an underlying social structure of innovation which is geo- graphically based. Jaffe (1989) and Acs, Audretsch, and Feldman (1992) note the pro- ductivity effects associated with the proximity of industrial and academic R&D. According to this line of thinking, the regional specialization of industrial activity is an important facet of advanced industrial economies (Krugman 1991 a; 1991 b; David and Rosenbloom 1990). Locational clusters of economic activity and in- novation are, in turn, the product of historical processes or "path-dependence'' (Arthur 1988; 1990a). As regions develop, certain ca- pacities are "locked-in" as resources are tai- lored to the innovative activity of specific tech- nologies or industries. Historical processes re- inforce the regional specialization of innovative capabilities. Innovation thus benefits from the congruent clustering of related institutions and the synergies created by embedded networks
Dow
nloa
ded
by [
Uni
vers
ity N
orth
Car
olin
a -
Cha
pel H
ill]
at 0
7:32
30
July
201
4
21 2 Feldman and Florida
of individuals and institutions-relationships not adequately incorporated into existing models.
Drawing upon recent advances in geo- graphic theory, particularly the concept of ”geographic industrialization” (Storper and Walker 1989), we suggest that geography in- deed plays a most fundamental role in the in- novation process. Innovations are less the product of individual firms than of the assem- bled resources, knowledge, and other inputs and capabilities that agglomerate in specific places. Innovating firms and organizations har- ness the institutions and the resources that constitute the technological infrastructures of specific places. This infrastructural perspective on innovation differs sharply with the prevail- ing ”location scanning” perspective. The latter suggests that individual firms freely scan the environment and select particular locations in accordance with the functional requirements of firms. The former suggests instead that in- novation depends on a technological infra- structure of various resources and institutions- the indigenous manufacturing capabilities of networks of firms, the R&D efforts and capa- bilities of private enterprises and universities, the concentrations of specialized commerciali- zation support services-that develop over time. In time, as it were, specific places de- velop differential technological capabilities and capacities for innovation. Geography thus plays a fundamental role in the innovation process; it constitutes the spatial locus wherein the various elements of technological infra- structure are organized.
Furthermore, given this general perspective on innovation processes, we do not believe that serendipitous events “spark” economic development: the spark of innovation and the ability of an area to capture the benefits of serendipity are rather the products of a well- rounded technological infrastructure. The re- gional capacity to sustain innovation is thus embodied in institutions and resources that reflect significant investments over time. In this sense, an area’s underlying technological infra- structure enhances the potential for innovation and shapes the locational choices of individual firms. Simply put, locational advantage and in- novative capacity stem from, and are embod- ied in, the technological infrastructure of a place.
The Geographic Distribution of Innovation in the United States in 1982
We begin our analysis with an overview of the geographic distribution of new product in- novations in the United States in 1982. Our source of data on commercial product innova- tion is the 1982 census of innovation citations from trade journals and business publications conducted by the Small Business Administra- tion (SBA). Unlike patent data which certify new inventions, the SBA innovation census re- ports on the market introduction of new prod- uct innovations.’ The SBA innovation census l ists 4,476 product innovations; of these, 4,200 innovations contain information on the loca- tion of the establishment that introduced the innovation.
As Figure 1 shows, the geographic distribu- tion of product innovations is highly concen- trated among states. Eleven states account for 81 percent of the 4,200 innovations (Table 1 ) . When the absolute distribution of innovations is converted to a rate of innovations per 100,000 manufacturing employees, geographi- cal concentration persists (Figure 2). The rates of product innovation in New Jersey, Massa- chusetts, and California are double the national rate; and seven other states-New Hampshire, New York, Minnesota, Connecticut, Arizona, Colorado, and Delaware-exceed the national average.
Table 2 sheds additional light on the relation- ship between innovation and other commonly used measures of innovative activity. Simple correlations between the 1982 SBA innovation data and patent counts, R&D expenditure, and high-technology employment by state2 suggest a close association. While R&D is considered an input to innovation, patents and high-tech- nology employment are often used as proxies of innovative output. The geographic distribu- tion of patents and high-technology under- score the patterns of concentration revealed in the SBA data. As Figure 3 demonstrates, pat- ents are geographically concentrated in Califor- nia and on the east coast in Massachusetts, New York, and New Jersey. Patents, however, exhibit more geographic dispersal than prod- uct innovations. Griliches (1 990), Mansfield (1984), and Scherer (1983) all warn that the
Dow
nloa
ded
by [
Uni
vers
ity N
orth
Car
olin
a -
Cha
pel H
ill]
at 0
7:32
30
July
201
4
The Geographic Sources of Innovation 21 3
Figure 1. Number of innovations by state in 1982.
number of patented inventions is not directly equivalent to a measure of innovative output as many patented inventions never become commercially viable products while many suc- cessful products are never patented. There i s a higher incidence o f patenting in the states o f Ohio, Pennsylvania, Illinois, and Michigan-the traditional manufacturing belt. This finding may reflect industry differentials in the propensity to patent. For example, Scherer (1983) finds a higher incidence o f patenting in traditional in- dustries such as industrial and residential equipment; stone, clay, and glass products; and household appliances. In addition, firms may opt not to patent in rapidly changing tech- nological fields such as advanced electronics because the technical detail required in patent applications release proprietary design details which can be easily exploited by competitors (Mansfield 1984).
The geographic concentration o f product in- novation is even more pronounced among particular industries. Table 3 shows consider- able specialization of innovative activity at the state level. California, for example, specializes in electronics-related innovation. Indeed, it is the most innovative state in five electronics-re- lated sectors: computers, measuring instru- ments, communications equipment, electronic equipment, and electronic industrial machin- ery. California’s advantage reflects, in large measure, the broad infrastructure for electron- ics-related innovation that has grown up in California’s Silicon Valley over the past three decades (Saxenian 1985). Similarly, New Jersey, wi th its world-class pharmaceutical and chemi- cal complexes, leads in innovations related to drugs and medicine (Feldman and Schreuder 1993). New York State, meanwhile, is a center for innovations in photographic equipment-a
Dow
nloa
ded
by [
Uni
vers
ity N
orth
Car
olin
a -
Cha
pel H
ill]
at 0
7:32
30
July
201
4
21 4 Feldman and Florida
Table 1. Distribution of Innovation bv State.
State
Innovations per 100,000
Manufacturing Innovations Workers
New Jersey Massachusetts California New Hampshire New York Minnesota Connecticut Arizona Colorado Delaware National Rhode Island Pennsylvania Illinois Texas Wisconsin Washington Ohio Florida Oregon
Source: Numbers of innovations are from the SEA innova- tion data. Numbers of manufacturing workers are from the 1982 Census of Manufacturers (U.S. Bureau of the Census 1986).
fact which is not altogether surprising given the opto-electronics complex around Rochester- comprised of companies such as Kodak, Xerox, and Bausch and Lomb, among others (Sternberg 1991 1. Innovation in metal fabrica- tion and industrial machinery are concentrated in the heavy manufacturing states of the indus- trial Midwest. Ohio, long a center for steel pro- duction and metal-working for heavy manufac- turing and consumer durable goods, is the
Table 2. Correlation Analysis of Alterna- tive Measures of Innovation.
~~
Employ- Innovation Patents R&D ment
Innovation 1 .oooo
R&D ,8551 ,8804 1,0000 Employment
Patents ,9344 1.0000
.9737 ,9888 ,7013 1.0000 Sources: Patent counts by state are from Jaffe (1989). High- technology employment data are from the US. Office of Technology Assessment (1 984). R&D expenditures are from the National Science Foundation as reported by Jaffe (1989).
leader in innovations in metal fabrication. Pennsylvania, with a similarly long history of heavy manufacturing in steel, electronic-power equipment, and other sectors, accounts for the lion’s share of innovation in the field of general industrial machinery. And lastly, Illinois with its massive industrial complexes around Chicago (Markusen and McCurdy 1989) and elsewhere accounts for the largest share of innovation in the domain of special industrial machinery.
The locational specialization of innovation is further highlighted in the location quotients re- ported in Table 3.3 The average location quo- tient of 239.5 for the thirteen most innovative industries offers a clear indication of a sig- nificant specialization in innovative activity by state. Generally speaking, then, the product innovation data convey considerable regional specialization in innovative activity in states that have developed specialized capacities for innovation in particular technologies and in- dustrial activities.
A Geographic Model of Innovation
The geographic distribution of innovation is, we believe, a function of an area’s underlying technological infrastructure. As noted above, this technological infrastructure consists of: concentrations of industrial and university R&D that enhance new product ideas and inven- tions by providing sources of technological op- portunity; agglomerations of manufacturing firms in related industries that provide addi- tional sources of expertise and tacit knowl- edge, particularly the capacity to translate new ideas into actual commercial products; and networks of business-service providers that support the overall product innovation process by supplying knowledge and information on technological trends and product markets. The congruent clustering of these several inputs creates scale economies, facilitates knowledge- sharing and cross-fertilization of ideas, and promotes face-to-face interactions of the sort that enhance effective technology transfer. The geographic proximity of these inputs promotes information transfer and spill-overs that lower the costs and reduce the risks associated with innovation. Furthermore, the clustering of these regional “stocks” of innovative capabili-
Dow
nloa
ded
by [
Uni
vers
ity N
orth
Car
olin
a -
Cha
pel H
ill]
at 0
7:32
30
July
201
4
The Geographic Sources of Innovation 21 5
ties and resources are embodied in human and institutional forms and interrelations that reflect a cumulative history of investments made in specific places over long periods of time (Sweeney 1987; Tassey 1991; Storper and Walker 1989).
Product Innovations: The Dependent Variable
The dependent variable in this model, namely the commercial product-innovation ci- tations compiled by SBA in 1982, is based on the only data currently available on the geo-
graphic locations of commercial innovation. These data represent an advance on previous research that measures innovation with the proxies of patents (Jaffe 1989), high-technology firms and employment (Markusen, Hall, and Clasmeier 1986), R&D expenditures (Malecki 1983), or R&D personnel.
Although the SBA data offer a more direct measure of product innovations, our source has its limitations and potential biases. First, the SBA innovation citations are compiled from a wide variety of industry announcements and trade publications, and these may be biased toward unusual or special-interest products. Second, the SBA data are compiled by states.
Dow
nloa
ded
by [
Uni
vers
ity N
orth
Car
olin
a -
Cha
pel H
ill]
at 0
7:32
30
July
201
4
21 6 Feldman and Florida
Figure 3. Number of patents by state in 1982.
Using the state as the unit of analysis inevitably obscures spatial processes that occur within a state or across state boundaries. While we would prefer to use sub-state units of analysis and then aggregate in accordance with func- tional linkages and dependencies (Czmanski and Ablas 1979), such data are simply unavail- able. Since the SBA data are the best that we have, we attempt, alternatively, to minimize potential sources of aggregation bias by intro- ducing an index of geographic concentration as a control variable. Third, the SBA data are only available for one year, 1982. While cross- sectional data such as these preclude consid- eration of subsequent technological and indus- trial restructuring, the SBA's selection of 1982 has some compensating virtues. The early 1980s is a particularly useful time to explore the geography of innovation, since these years are
generally regarded as ones of considerable in- novation (U.S. Office of Technology Assess- ment 1984). With the emergence of new high- technology industries such as personal com- puters, computer work-stations, software and biotechnology, innovation occurred in en- trepreneurial start-up companies as well as in the larger, more established firms such as IBM and DuPont. In this regard, 1982 provides a particularly useful vantage point on the geog- raphy of innovation. The SBA data, moreover, distinguish between the location of the estab- lishment responsible for the major develop- ment of an innovation and the location of the corporate headquarters or parent company. We, of course, use the establishment location in our analysis.
The dependent variable in our model, inno- vative output (INNis), is the number of innova-
Dow
nloa
ded
by [
Uni
vers
ity N
orth
Car
olin
a -
Cha
pel H
ill]
at 0
7:32
30
July
201
4
The Geographic Sources of Innovation 21 7
Table 3. State Competitive Advantage in Innovative Industries. Industry N Leading State n Location Quotient
Computers 954 California 356 167.8 Measuring Instruments 668 California 134 126.4 Communications Equipment 376 California 11 6 132.2
Medical Instruments and Supplies 228 New Jersey 57 248.2 General Industrial Machinery 164 Pennsylvania 25 261.5 Drugs I33 New Jersey 52 381.3 Special Industrial Machinery 11 6 Illinois 11 171.4 Misc. Fabricated Metal Products 105 Ohio 18 384.0
Photographic Equipment 61 New York 18 260.0 Plastic and Synthetic Materials 51 Texas 10 491.7 Cleaning Preparations 50 New York 10 183.3
Electronic Equipment 261 California 128 211.3
Electronic Industrial Machinery 74 California 17 94.4
N indicates the total number of innovations for an industry; and n indicates the number of innovations for a state.
tions for an industry i in a state s in 1982. When these data are stratified by state and by indus- try, a large number of zero cells result. In order to proceed with the estimation, we confine our analysis to the thirteen most innovative three- digit Standard Industrial Classification (SIC) code industries. Each of these industries ac- counts for 50 or more innovations, and the thirteen industries as a whole account for 80 percent of total innovations in our sample (Ta- ble 3). The remaining 82 industries with one to 50 innovations account for just 20 percent of all innovations in 1982.
Technological Infrastructure: The Independent Variables
The four independent variables in the model are indicators of technological infrastructure. They are: (1) firms in related manufacturing industries, (2) industry R&D, (3) university R&D, and (4) business services. These are sup- plemented by a series of control variables. Be- cause innovation is a process, it is charac- terized by a time lapse between the first stages of invention and the final stages of commer- cialization. The length of this lag i s difficult to specify, however. A recent study estimates that the lag between an academic research finding and the commercial introduction of a new product averages seven years, with a standard deviation of two years (Mansfield 1991 ). We thus assume that innovations introduced into
the market in 1982 would benefit from the stock of infrastructural resources that had been in existence for the preceding decade. Accord- ingly, we measure the stocks of the four inno- vative inputs as the average annual expendi- tures for each in the ten years prior to the 1982 introduction of innovations into the commer- cial market.
University research provides basic knowl- edge that may be critical for the innovation process. Nelson (1 986) and Mansfield (1 991 ) note that university R&D enhances the stock of basic knowledge, generates increased tech- nological opportunities across a wide range of industrial fields, and increases the potential productivity of private industrial R&D. Overall then, university R&D has a positive effect on commercial innovation and generates a sig- nificant social rate of return-in excess of 25 percent according to one recent study (Mans- field 1991). Figure 4 presents the distribution of university-research expenditures. While the concentration of university R&D in a few major clusters, for example Boston-Cambridge and the San Francisco Bay area, is well known, other states, notably New York, Texas, and Maryland also have high expenditures on uni- versity research. The presence of university re- search simply may not be sufficient by itself to guarantee innovation and technology-based spin-offs (Feldman 199413). There is some evi- dence that the co-location of university and industrial R&D at the state level tends to exert positive impacts on the generation of patents
Dow
nloa
ded
by [
Uni
vers
ity N
orth
Car
olin
a -
Cha
pel H
ill]
at 0
7:32
30
July
201
4
21 8 Feldman and Florida
Figure 4. Distribution of university R&D expenditures in 1989.
and innovations (Jaffe 1989; Acs, Audretsch, and Feldman 1992). But the evidence is not unequivocal; Markusen, Hall, and Glasmeier (1 986) report that university-research expendi- tures may have a negative effect on the loca- tion of high-technology i n d ~ s t r y . ~
Because of the vast differences in the scope and commercial applicability of university re- search, our measure of university R&D (UN/Vl,) is based on funding at the level of academic department. Using data from the National Sci- ence Foundation’s (NSF) Survey of Science Re- sources, we assign academic departments to relevant industries at the level of the two-digit SIC code. Innovations in industry SIC 283, Drugs, for example, are linked to research in the academic departments of medicine, biol- ogy, chemistry, and chemical engineering (Feldman 1994a).
Industrial R&D laboratories also serve as sources of scientific and technical knowledge
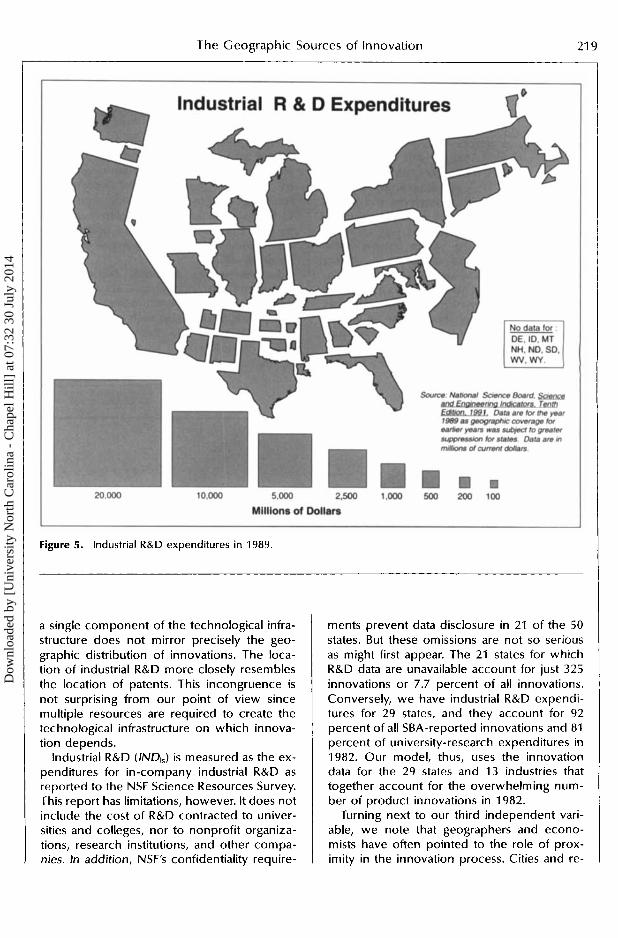
required for new product development. With the notable exceptions of firms such as ATT and IBM that conduct basic research in labora- tories, industrial R&D laboratories tend to spe- cialize in market-oriented R&D, and more spe- cifically, in the translation of scientific and tech- nical information into new innovations. Geog- raphers, in particular, have highlighted the regional concentration of industrial R&D and its important role in the innovation process and in the formation of regional innovation com- plexes (Stohr 1986; Tassey 1991 ). Malecki’s (1983) study of the geographic distribution of R&D noted the regional specialization of R&D activity, in general, and the marked concentra- tions on the East and West Coasts, in particular. Figure 5 demonstrates the continuation of this pattern with a proportional representation of state industrial R&D expenditures. Here it is important to note that, as we found with uni- versity research, the geographic distribution of
Dow
nloa
ded
by [
Uni
vers
ity N
orth
Car
olin
a -
Cha
pel H
ill]
at 0
7:32
30
July
201
4
The Geographic Sources of Innovation 21 9
a single component of the technological infra- structure does not mirror precisely the geo- graphic distribution of innovations. The loca- tion of industrial R&D more closely resembles the location of patents. This incongruence is not surprising from our point of view since multiple resources are required to create the technological infrastructure on which innova- tion depends.
Industrial R&D (INQ,) is measured as the ex- penditures for in-company industrial R&D as reported to the NSF Science Resources Survey. This report has limitations, however. It does not include the cost of R&D contracted to univer- sities and colleges, nor to nonprofit organiza- tions, research institutions, and other compa- nies. In addition, NSF’s confidentiality require-
ments prevent data disclosure in 21 of the 50 states. But these omissions are not so serious as might first appear. The 21 states for which R&D data are unavailable account for just 325 innovations or 7.7 percent of all innovations. Conversely, we have industrial R&D expendi- tures for 29 states, and they account for 92 percent of all SBA-reported innovations and 81 percent of university-research expenditures in 1982. Our model, thus, uses the innovation data for the 29 states and 13 industries that together account for the overwhelming num- ber of product innovations in 1982.
Turning next to our third independent vari- able, we note that geographers and econo- mists have often pointed to the role of prox- imity in the innovation process. Cities and re-
Dow
nloa
ded
by [
Uni
vers
ity N
orth
Car
olin
a -
Cha
pel H
ill]
at 0
7:32
30
July
201
4
220 Feldman and Florida
gions serve as ”incubators” of innovations (Thompson 1962). More specifically, in the case of high-technology regions, networks of manufacturing firms are particularly crucial for new ideas and sources of knowledge for inno- vation (Stohr 1986; Storper and Walker 1989; Sayer and Walker 1993). Concentrations or ag- glomerations of firms in related industries pro- vide a pool of technical knowledge and exper- tise and a potential base of suppliers and users of innovations. These networks play an espe- cially important role when technological knowledge is informal or ”tacit” in nature, when knowledge and ideas are hard to codify, and when “practical mastery” plays a large role (Storper and Walker 1989). Suppliers and end- users of a technology also provide an impor- tant source of additional knowledge and ideas (Von Hippel 1988). Concentrations of these firms foster important synergies in the innova-
tion process, as for example when innovations in semiconductors spill over into electrical, consumer electronics, and computer indus- tries.
The presence of concentrations of firms in related manufacturing industries (RELPRES,,) is measured as value-added for the major indus- try two-digit group that encompasses the three-digit industry under consideration (Figure 6). Returning to our example of the drug indus- try (SIC 283), we use the value added in the related industrial group of Chemicals and Allied Products-SIC 28.
Business-service providers constitute our fourth and final independent variable. These providers play key roles in regional innovation complexes (Stohr 1986) such as Silicon Valley (Saxenian 1985) and Route 128 (Dorfman 1983). Providers such as commercial-testing laboratories, market-research firms, and patent
~~
Figure 6. Distribution of manufacturing value added in 1977.
Dow
nloa
ded
by [
Uni
vers
ity N
orth
Car
olin
a -
Cha
pel H
ill]
at 0
7:32
30
July
201
4
The Geographic Sources of Innovation 221
attorneys offer important sources of informa- tion on technological and product opportuni- ties, marketing and sales trends, regulations and standards, the law, and financing of the sort required to bring innovations to market and to effectively position new product offer- ings. MacPherson (1991) finds a strong corre- lation between the usage of external producer services and new products; other research in- dicates that specialized producer services tend to locate near their clients (Coffey and Polese 1987).
Business services comprise a wide range of activities. Although a variety of firms provide knowledge of the market and the commerciali- zation process, the Census classification sys- tem makes it difficult to isolate those services that directly support the innovation process. For example, the census grouping of all legal services under one SIC classification (SIC 8111 ) makes it impossible to isolate the critical serv- ices of patent attorneys for the process of
product innovation. Only one SIC category- SIC 7397, Commercial Testing Laboratories-is clearly linked with the introduction of new in- novations. In the absence of other data, we use value-added in SIC 7397 as a surrogate indica- tor for specialized business services (BSERV,,). The geographic distribution of these services is presented in Figure 7. Once again, we observe geographic concentration in California, New York, New Jersey, Massachusetts, Pennsylva- nia, and Texas. O f all of our independent vari- ables, the location of specialized business serv- ices most closely resembles the location of product innovation. However, these mappings are not perfect, as some states, such as Florida, Louisiana, Connecticut, and Rhode Island have a relatively higher representation of business services when compared to innovation. But that is to be expected since our thesis suggests that it is the interactions and synergies of these elements of the technological infrastructure that provide the key to explaining the geo-
Figure 7. Distribution of producer services as measured by receipts of commercial testing labs.
Dow
nloa
ded
by [
Uni
vers
ity N
orth
Car
olin
a -
Cha
pel H
ill]
at 0
7:32
30
July
201
4
222 Feldman and Florida
graphic distribution of innovation, that is, these elements in space work interactively rather than in isolation.
Implementing a Geographic Model of Innovation: Specification and Estimation
Our geographic model of innovation regards innovation as a function of four classes of in- novative inputs: networks of firms in related manufacturing industries, concentrations of university R&D, concentrations of industrial R&D, and concentrations of business-service providers. In formal terms, innovative output (INNis), or the number of innovations for indus- try i in a geographic area s, is a function o f university research (UNIV,,), industrial R&D (/NDis), networks of related firms (RELPRfSi,), and specialized business services (BS€RVis):
Because we expect knowledge spill-overs across related technological fields, the sub- script I refers to industries that use similar tech- nology. Two variables are added to control for aggregation bias. State population (POP,s) con- trols for variable state sizes and thus facilitates cross-state comparisons. An index of geo- graphic concentration (CONC.,) controls for within-state variation and compensates for the use of states as the unit of ob~ervat ion.~ This index measures the share of the state’s value of manufacturing shipments held by the state’s largest SMSA. A third variable, industry sales (SALES,,), controls for variable demands for in- novations generated within an industry. The model further specifies innovation as a recur- sive system consisting of four equations and a series of individual equations that isolate the determinants of industrial R&D, university R&D, and business services.
The second equation in the model examines the determinants of the location of industrial R&D. We expect that R&D laboratories will tend to locate either near production facilities or near firm headquarters (Malecki 1985; 19901, that is to say, the locational patterns will reflect the historical development of industrial
R&D (Mowery and Rosenberg 1989) and that industrial R&D expenditures would be allo- cated to regions with strong and related uni- versity research programs (Jaffe 1989; Mans- field 1991). The industrial R&D equation ac- cordingly regards that variable as a function of university research, firms in related industries, and corporate headquarters, (HDQRTJ-an in- dicator of Fortune 500 corporate headquar- ters.6 The equation is as follows:
The third equation in the model examines the determinants of the location of university R&D. Given that firms tend to use research at nearby universities and the strong tendency for the co-location of industrial and university R&D, the third equation explores the interac- tion between university research, industrial R&D, and firms in related industries. This equa- tion also includes a variable for federally funded research and development centers (FFRDC.,)-an indicator of the university’s re- ceptiveness to participate in technology trans- fer with industry. Equation 3 is specified as fol- lows:
The fourth and final equation in the system examines the determinants of the location of specialized business services. The presence of such services is expected to reflect the client base on which these services depend, for ex- ample, industrial R&D laboratories (Coffey and Polese 1987). We also expect that specialized producer services, such as commercial testing laboratories, are a function of the overall base of business services, hence our inclusion of a variable (TOTALBSERV.,) that represents the stock of receipts for general management and consulting services (SIC code 7392). Equation 4 is thus specified as follows:
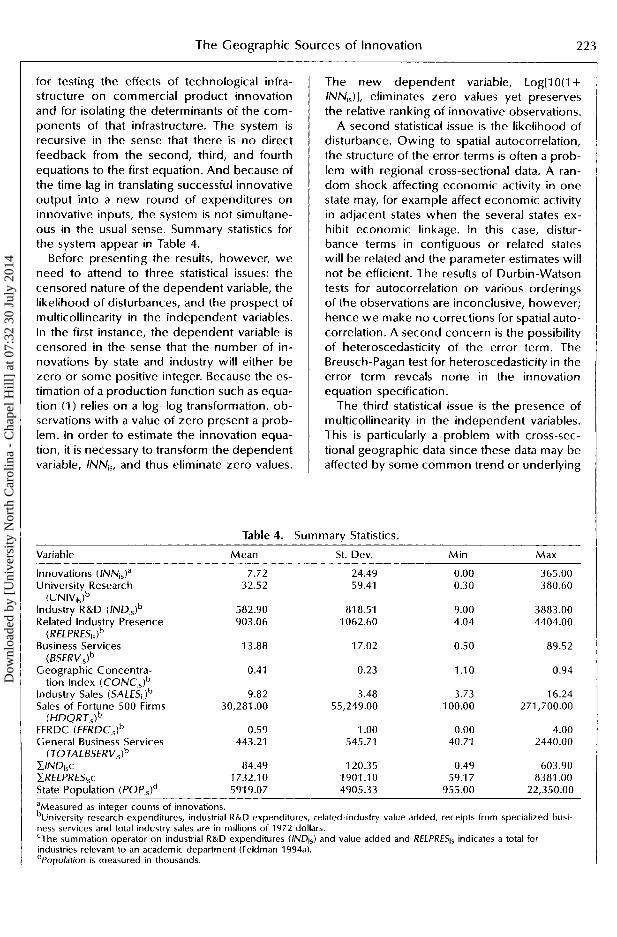
for testing the effects of technological infra- structure on commercial product innovation and for isolating the determinants of the com- ponents of that infrastructure. The system is recursive in the sense that there i s no direct feedback from the second, third, and fourth equations to the first equation. And because of the time lag in translating successful innovative output into a new round of expenditures on innovative inputs, the system is not simultane- ous in the usual sense. Summary statistics for the system appear in Table 4.
Before presenting the results, however, we need to attend to three statistical issues: the censored nature of the dependent variable, the likelihood of disturbances, and the prospect of multicollinearity in the independent variables. In the first instance, the dependent variable is censored in the sense that the number of in- novations by state and industry will either be zero or some positive integer. Because the es- timation of a production function such as equa- tion (1 ) relies on a log-log transformation, ob- servations with a value of zero present a prob- lem. In order to estimate the innovation equa- tion, it is necessary to transform the dependent variable, INNis, and thus eliminate zero values.
The new dependent variable, Log[lO(I + INN,,)], eliminates zero values yet preserves the relative ranking of innovative observations.
A second statistical issue is the likelihood of disturbance. Owing to spatial autocorrelation, the structure of the error terms is often a prob- lem with regional cross-sectional data. A ran- dom shock affecting economic activity in one state may, for example affect economic activity in adjacent states when the several states ex- hibit economic linkage. In this case, distur- bance terms in contiguous or related states will be related and the parameter estimates will not be efficient. The results of Durbin-Watson tests for autocorrelation on various orderings of the observations are inconclusive, however; hence we make no corrections for spatial auto- correlation. A second concern is the possibility of heteroscedasticity of the error term. The Breusch-Pagan test for heteroscedasticity in the error term reveals none in the innovation equation specification.
The third statistical issue is the presence of multicollinearity in the independent variables. This is particularly a problem with cross-sec- tional geographic data since these data may be affected by some common trend or underlying
Table 4. Summary Statistics.
Variable Mean St. Dev. M in Max
Innovations 7.72 24.49 0.00 365.00 University Research 32.52 59.41 0.30 380.60
Industry R&D (IND,s)b 582.90 81 8.51 9.00 3883.00 Related Industry Presence 903.06 1062.60 4.04 4404.00
Business Services 13.88 17.02 0.50 89.52
Geographic Concentra- 0.41 0.23 1.10 0.94
Industry Sales (SALESiJb 9.82 3.48 3.73 16.24 Sales of Fortune 500 Firms 30,281 .OO 55,249.00 100.00 271,700.00
FFRDC (FFRDC,,)~ 0.59 1 .oo 0.00 4.00 General Business Services 443.21 545.71 40.71 2440.00
DVDi,c 84.49 120.35 0.49 603.90 XREL PRES1,c 1732.1 0 1901 .I 0 59.1 7 8381 .00 State Population POP,,)^ 591 9.07 4905.33 955.00 22,350.00 aMeasured as integer counts of innovations. bUniversity research expenditures, industrial R&D expenditures, related-industry value added, receipts from specialized busi- ness services and total industry sales are in millions of 1972 dollars. ‘The summation operator on industrial R&D expenditures (INDl,) and value added and RELPRESl, indicates a total for industries relevant to an academic department (Feldman 1994a). dPopu/ation is measured in thousands.
(UNIViJb
(RELPRES,,)~
(BSERV. , )~
tion Index (CONC.,)b
(HDQR J . , ) ~
( 7 0 7A LL~SERV.,)~
Dow
nloa
ded
by [
Uni
vers
ity N
orth
Car
olin
a -
Cha
pel H
ill]
at 0
7:32
30
July
201
4
224 Feldman and Florida
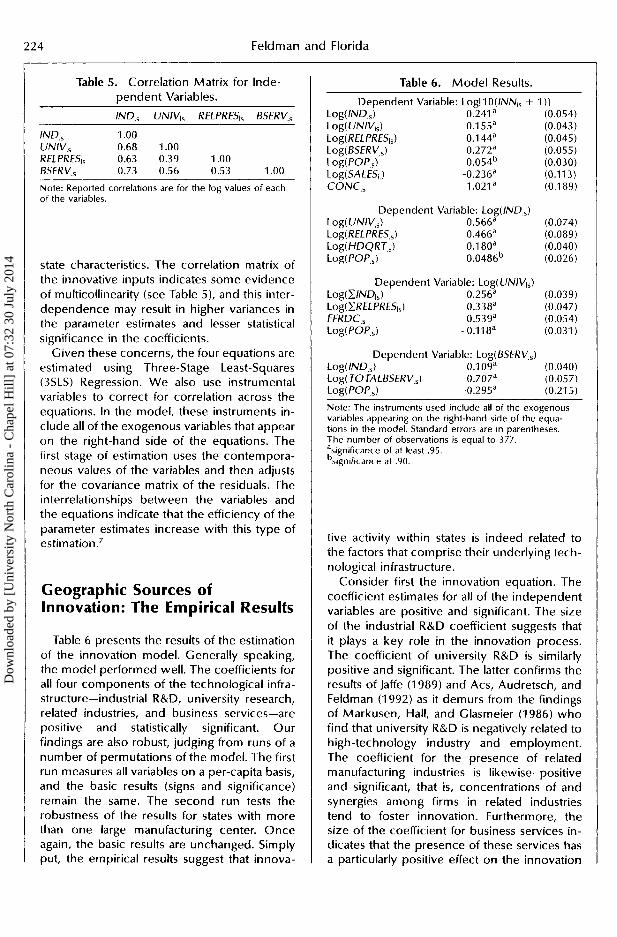
Table 5. Correlation Matrix for Inde- pendent Variables. IND, UNIK, RELPRESi, BSERV,
Note: Reported correlations are for the log values of each of the variables.
state characteristics. The correlation matrix of the innovative inputs indicates some evidence of multicollinearity (see Table 5), and this inter- dependence may result in higher variances in the parameter estimates and lesser statistical significance in the coefficients.
Given these concerns, the four equations are estimated using Three-Stage Least-Squares (3SLS) Regression. We also use instrumental variables to correct for correlation across the equations. In the model, these instruments in- clude all of the exogenous variables that appear on the right-hand side of the equations. The first stage of estimation uses the contempora- neous values of the variables and then adjusts for the covariance matrix of the residuals. The interrelationships between the variables and the equations indicate that the efficiency of the parameter estimates increase with this type of estimation.'
Geographic Sources of Innovation: The Empirical Results
Table 6 presents the results of the estimation of the innovation model. Generally speaking, the model performed well. The coefficients for all four components of the technological infra- structure-industrial R&D, university research, related industries, and business services-are positive and statistically significant. Our findings are also robust, judging from runs of a number of permutations of the model. The first run measures all variables on a per-capita basis, and the basic results (signs and significance) remain the same. The second run tests the robustness of the results for states with more than one large manufacturing center. Once again, the basic results are unchanged. Simply put, the empirical results suggest that innova-
Table 6. Model Results. Dependent Variable: Log[l O(INNi, + 1 ) I
Note: The instruments used include all of the exogenous variables appearing on the right-hand side of the equa- tions in the model. Standard errors are in parentheses. The number of observations is equal to 377. a .
bsignificance at .go. significance of at least .95.
tive activity within states is indeed related to the factors that comprise their underlying tech- nological infrastructure.
Consider first the innovation equation. The coefficient estimates for all of the independent variables are positive and significant. The size of the industrial R&D coefficient suggests that it plays a key role in the innovation process. The coefficient of university R&D is similarly positive and significant. The latter confirms the results of Jaffe (1 989) and Acs, Audretsch, and Feldman (1 992) as it demurs from the findings of Markusen, Hall, and Clasmeier (1986) who find that university R&D is negatively related to high-technology industry and employment. The coefficient for the presence of related manufacturing industries is likewise positive and significant, that is, concentrations of and synergies among firms in related industries tend to foster innovation. Furthermore, the size of the coefficient for business services in- dicates that the presence of these services has a particularly positive effect on the innovation
Dow
nloa
ded
by [
Uni
vers
ity N
orth
Car
olin
a -
Cha
pel H
ill]
at 0
7:32
30
July
201
4
The Geographic Sources of Innovation 225
process, perhaps because these services are critical in the concluding marketing phase of the commercialization process.
Turning now to the model’s sub-equations, the coefficients for the industrial R&D equation are all positive and statistically significant. In- dustrial R&D is related to university R&D ex- penditures, concentrations of firms in related manufacturing industries, and the presence of corporate headquarters. The magnitude of the coefficient of university R&D expenditures, as expected, suggests an especially strong rela- tionship between university and industrial R&D. This result affirms that university R&D increases technological opportunities available in a state or region and provides incentives to invest in private industrial R&D to exploit the stock of basic scientific knowledge (Nelson 1986). The coefficient for the presence of re- lated industries suggests a fairly strong relation- ship between industrial R&D and the broader industrial base. This is not surprising since in- dustrial R&D tends to feed off, as well as sup- port, clusters of manufacturing activity.
The empirical findings for the university R&D sub-equation indicate a close association be- tween it and industrial R&D and related indus- tries. The relationship between university R&D and the presence of corporate headquarters, however, is somewhat weaker, though still sig- nificant. The coefficient for federally funded research centers is positive and statistically sig- nificant. In sum, the association between uni- versity R&D expenditures and both industrial expenditures on R&D and industrial activity and industrial R&D in related fields reaffirms Mansfield’s (1 991) finding that private firms utilize research findings generated from nearby universities. O n the whole, it appears that uni- versity R&D has a greater effect on industry R&D than vice-versa. Indeed, the impact of university R&D on industrial R&D has twice the magnitude of the impact of industrial R&D on university R&D. University R&D may therefore play a critical role in the innovation process by attracting industrial R&D and by leveraging in- dustrial activities. However, the relatively smaller effect of industrial R&D on the univer- sity R&D may be explained by the fact that a large proportion of total university R&D, almost two-thirds, is provided by the federal govern- ment and as such it may be less responsive to state industrial priorities and concerns (Na- tional Science Board 1989).
The findings of the business services sub- equation indicate that the presence of special- ized business services i s positively related to industrial R&D and to the overall business-serv- ices sector. In other words, specialized busi- ness services, in this case commercial testing laboratories, are co-located with their principal clientele, the R&D laboratories. In addition, concentrations of specialized producer serv- ices are related to a large overall business serv- ice sector.
Taken together, these findings provide the beginnings of an explanation for the dynamics of an area’s technological infrastructure. The factors that comprise the region’s technological infrastructure work together to create an over- all capacity that is conducive to innovation. Each of the components must be in place for innovation to occur; however it is the interac- tion and synergy among these components that accounts for a higher propensity to inno- vate in particular places. Above all, our findings indicate the mutual reinforcement of the four major components of technological infrastruc- ture: industrial R&D, university R&D, firms in related industries, and business services. The synergies among these four components yield a technological infrastructure with a high pro- pensity for product innovation. The innovative capacity of an area-in this case, states-hinges on this underlying technological infrastructure. Thus, our empirical results confirm that ag- glomeration, and geography more broadly, play significant and important roles in the or- ganization and mobilization of knowledge in behalf of commercial product innovation.
Some Thoughts on the Geography of Product Innovation: Today and Tomorrow, Here and Abroad
We have explored the geography of innova- tion, suggesting that it is unusually dependent on an area’s technological infrastructure. We have oriented our analysis around an empirical model of the innovation process which intro- duces a new, and previously unavailable, measure of innovative output at the state level. Our model presumes that innovation is a func- tion of an area‘s underlying technological infra-
Dow
nloa
ded
by [
Uni
vers
ity N
orth
Car
olin
a -
Cha
pel H
ill]
at 0
7:32
30
July
201
4
226 Feldman and Florida
structure, which, in turn, consists of university R&D, industrial R&D, agglomerations of related industry, and specialized business services. The model is formulated as a recursive system in order to improve our understanding of the interrelationships between the four innovative inputs noted above.
The findings of the model confirm the hy- pothesis that innovation is a function of an area’s technical infrastructure. Innovation is re- lated to the geographic concentrations of in- dustrial R&D, university R&D, related indus- tries, and business services. Our results imply significant synergy and mutual reinforcement among the factors that comprise the techno- logical infrastructure.
Our findings further suggest that there is considerable geographic specialization in the technological infrastructures of various places. The capacity to innovate i s very much the his- torical legacy of specialized concentrations of R&D, industrial activity, and support services that build up in particular places over time. In other words, different places are the sources Of particular types of innovation. California- with its clusters of high-technology electronic producers, suppliers, business service provid- ers, and venture capitalists in places like Silicon Valley and elsewhere-specializes in innova- tions related to electronics. New Jersey, with its massive chemical and pharmaceutical com- plexes, is the center for innovations in drugs, medicines, and medical equipment. Innova- tions related to photographic equipment and opto-electronics are concentrated in New York, most notably in the Rochester-area’s opto-electronics complex composed of Xerox, Kodak, Bausch and Lomb, and related suppli- ers. The industrial Midwest, with its history of manufacturing infrastructure in steel, automo- tive, appliance, and consumer durable produc- tion, is the primary source of innovations in metal fabrication and industrial machinery. Yet while each of these complexes specializes in a specific type of innovations, they all depend upon a set of underlying factors that comprise a technological infrastructure for generating new ideas and bringing them to the market.
Our findings thus suggest that not only does geography play a central role in the innovation process, but further that innovation is itself a geographic process. Geography, in an integral sense, organizes and advances innovation. The
capacity to innovate is the product of com- plexes of enterprises and R&D; networks of institutions and institutional resources; concen- trations of human talent, knowledge, and skill; and a legacy of sustained investment in an area’s technological capability. Our findings, therefore, reinforce Storper and Walker’s con- cept of geographic industrialization (1 989) while adding to it the related notion that the sources of innovation that propel the contem- porary processes of industrialization are them- selves geographic in nature. Our results also redirect attention to the ways in which particu- lar places have acquired a comparative advan- tage for innovation and economic develop- ment. If we are correct, locational advantage would seem to reflect cumulative investments in human and technological capability in spe- cific places, more so than the conventional natural advantages of land, labor, and capital. In the modern economy, locational advantage in the capacity to innovate is ever more de- pendent on the agglomeration of specialized skills, knowledge, institutions, and resources that make up an underlying technological in- frastructure.
At a broader level, our findings provide a deeper understanding of innovation as a geo- graphic as well as an economic process. For students of capitalist development from Adam Smith to Karl Marx and Joseph Schumpeter, innovation has been regarded as a primary source-if not ”the” primary source-of eco- nomic growth and development. For such theorists, innovation is the product of individ- ual capitalist firms, entrepreneurs, and organi- zations which function to organize and har- ness the various technological and organiza- tional inputs required for innovation, profit, and growth. But, as we have seen, the capacity for innovation extends far beyond the bounda- ries of the individual firm. In the United States today, innovation is no longer the province of the inventor, the risk-taking entrepreneur, the insightful venture capitalist, or the large re- source-rich corporation. Innovation instead has its sources in a broader social and spatial struc- ture-a landscape of agglomerated and syner- gistic social and economic institutions welded into a technological infrastructure for innova- tion. It is in this fundamental sense that geog- raphy organizes the innovation process and helps sustain the spatially uneven growth and
Dow
nloa
ded
by [
Uni
vers
ity N
orth
Car
olin
a -
Cha
pel H
ill]
at 0
7:32
30
July
201
4
The Geograph ic Sources of Innovation 227
progress of advanced technological econo- mies.
Acknowledgments
Research funding from the U.S. Economic Devel- opment Administration, U.S. Small Business Admini- stration, and the Duquesne Light Fund for Economic Development at Carnegie Mellon is gratefully ac- knowledged. The authors would like to thank Zoltan Acs, David Audretsch, Wesley Cohen, Mark Kamlet, Edward Malecki, Donald F. Smith, Paula Stephan, and the anonymous referees for thoughtful comments. Appreciation is expressed to the Center for Regional Economic Issues at Case Western Reserve University and Marshall Feldman at the University of Rhode Is- land for assistance with various data. We would also like to thank Tom Rabenhorst and the cartography group at the University of Maryland Baltimore County for their assistance. Cynthia Brandt and Gail Cohen Shaivitz provided research assistance. The title of this paper i s respectfully and unabashedly borrowed from the work of Eric Von Hipple.
Notes
1. While precise data on the economic significance of each innovation are not available, the SBA pro- vided ratings of their economic significance; less than 1 percent represented the first type of prod- uct in a category, 14 percent represented a sig- nificant improvement over existing technology, and 85 percent represented a modest improve- ment to an existing product. Information on the revenue generated by each innovation is not avail- able.
2. R&D expenditures are from the National Science Foundation as reported by Jaffe (1 989). Patent counts by state are also from Jaffe (1989) and rep- resent the average annual number of patents re- ceived in 29 states over an eight-year period. High-technology employment data are from the U.S. Office of Technology Assessment (1984) for the year 1982.
3. Innovation quotients are calculated as the percent- age of industry innovations in a state divided by the percentage of national innovations in that in- dustry. The quotient is then multiplied by 100. An innovation quotient of 100 indicates that the inno- vations in a particular industry are equally distrib- uted in the state and national economies.
4. The result may be attributable to the measurement of university research as federal funding for a sin- gle year. Federal funds, on average, account for only 65 percent of total university research expen- ditures, albeit with sizable variations between in- stitutions. Furthermore, a one-year flow of funds may not capture the stock of university research that defines innovative capacity in an area.
5. In the estimation of the innovation equation, we
did not use the log of the geographic concentra- tion variable because there is no strong a priori functional specification and because the estima- tion of the innovation equation with a log transfor- mation of this variable yields similar results.
6. No simultaneity between an area’s innovative suc- cess and industrial R&D allocation is estimated be- cause of the time lag in introducing an innovation to the market. Industrial R&D typically precedes market introduction by four to five years and thus a firm’s response to successful innovative outputs will reflect that time delay.
7. The system of equations is estimated using Seem- ingly Unrelated Regression which essentially amounts to the first two stages of three-stage least squares. A comparison of the parameter estimates indicates a gain of efficiency with three-stage least- squares regression owing to the presence of cross-equation correlation.
References
Acs, Z. I., Audretsch, D. B., and Feldman, M. P. 1992. Real Effects of Academic Research: Com- ment. American Economic Review 81 :363-367.
Arthur, W. B. 1988. Urban Systems and Historical Path Dependence. In Cities and Their Vital Sys- tems, ed. J. Ausubel and R. Herman, pp. 85-97. Washington, D.C.: National Academy Press.
-. 1990a. Silicon Valley Locational Clusters: When Do Increasing Returns Imply Monopoly? Mathematical Social Sciences 19:235-251.
-. 1990b. Positive Feedbacks in the Economy. Scientific American 292-99.
Coffey, W., and Polese, M. 1987. Trade and Loca- tion of Producer Services: A Canadian Perspec- tive. Environment and Planning A 19:597-611.
Czmanski, S., and Ablas, L. A. de Q. 1979. Iden- tification of Industrial Clusters and Complexes. Urban Studies 16:61-80.
David, P., and Rosenbloom, J. 1990. Marshallian Factor Market Externalities and the Dynamics of Industrial Localization. journal of Urban Econom- ics 28:349-370.
DeBresson, C., and Amesse, F. 1992. Networks of Innovators: A Review and Introduction to the Issues. Research Policy 20:363-380.
Dorfman, N. 1983. Route 128: The Development of a Regional High Technology Economy. Re- search Policy 12:299-316.
Dosi, G. 1988. Sources, Procedures and Microe- conomic Effects of Innovation. lourndl of Eco- nomic Literature 36:1120-1171.
Feldman, M. P. 1994a. The Geography of lnnova- tion. Boston: Kluwer Academic Press. . 199413. The University and High-Technol-
ogy Start-ups: The Case of Johns Hopkins Uni-
Dow
nloa
ded
by [
Uni
vers
ity N
orth
Car
olin
a -
Cha
pel H
ill]
at 0
7:32
30
July
201
4
228 Feldman and Florida
versity and Baltimore. The Economic Develop- ment Quarterly 8.
Feldman, M. P., and Schreuder, Y. 1993. Pharma- ceutical Compound: An Historical Investigation of the Geographic Concentration of the Pharma- ceutical Industry in the Mid-Atlantic Region. Working paper, Hagley Museum and Library, Wilmington, Delaware.
Florida, Richard, and Kenney, Martin. 1988. Ven- ture Capital and Technological Innovation in the U.S. Research Policy 17:119-I 37.
-, and - . 1990. The Breakthrough lllu- sion: Corporate America’s Failure to Move from lnnovation to Mass Production. New York: Basic Books.
Griliches, Z. 1990. Patent Statistics as Economic Indicator: A Survey. journal o f Economic Litera- ture 28:1661-1707.
Harvey, D. 1989. The Condition o f Postmodernity. Cambridge, Massachusetts: Blackwell Publish- ers.
Jaffe, A. B. 1989. Real Effects of Academic Re- search. American Economic Review 79:957- 970.
Kline, S. J ., and Rosenberg, N. 1987. An Overview of Innovation. In The Positive Sum Strategy, ed. R. Landau and N. Rosenberg, pp. 275-305. Washington, D.C.: National Academy Press.
Krugman, P. 1991a. Geography and Trade. Cam- bridge, Massachusetts: MIT Press.
-. 1991b. Increasing Returns and Economic Geography. journal o f Political Economy 31 :483- 499.
Landes, D. S. 1969. The Unbound Prometheus. Cambridge: Cambridge University Press.
MacPherson, A. 1991. lnterfirm Information Link- ages in an Economically Disadvantaged Region: An Empirical Perspective from Metropolitan Buffalo. Environment and Planning A 23:591- 606.
Malecki, E. 1981. Science, Technology, and Re- gional Economic Development: Review and Prospects. Research Policy 10312-334.
-. 1983. Federal and Industrial R&D: Loca- tional Structures, Economic Effects and Interrela- tionships. Final Report to the National Science Foundation, Division of Policy Research and Analysis. Washington, D.C.
-. 1985. Industrial Location and Corporate Organization in High Technology Industries. Eco- nomic Geograp h y 75 :345 -3 69.
-. 1986. Research and Development and the Geography of High-Technology Complexes. In Technology, Regions and Policy, ed. John Rees, pp. 51-74. Totowa, New Jersey: Rowman and Littlefield.
-. 1990. Technological Innovation and Paths to Regional Economic Growth. In Growth Policy in the Age o f High Technology: The Role o f Re-
gions and States, ed. J. Schmandt and R. Wilson, pp. 97-119. Boston: Unwin Hyman.
. 1991. Technology and Economic Develop- ment. Essex: Longman Scientific and Technical.
Mansfield, E. J. 1984. Comment on Using Linked Patent and R&D Data to Measure Interindustry Technology Flows. In R&D, Patents, and Produc- tivity, ed. Z. Griliches, pp. 461-464. Chicago: University of Chicago Press.
-. 1991. Academic Research and Industrial Innovation. Research Policy 2O:l-12.
Markusen, A,, Hall, P., and Glasmeier, A. 1986. High Tech America: The What, How, Where and Why ofSunrise Industries. Boston: Allen and Un- win.
Markusen, A., and McCurdy, K. 1989. Chicago’s Defense Based High Technology: A Case Study of the ’Seedbeds of Innovation’ Hypothesis. Eco- nomic Development Quarterly 3:15-31.
Mokyr, Joel. 1990. The Lever o f Riches: Techno- logical Creativity and Economic Progress. Ox- ford: Oxford University Press.
Mowery, D., and Rosenberg, N. 1989. Technology and the Pursuit o f Economic Growth. New York: Cambridge University Press.
National Science Board. 1989. Science and Engi- neering Indicators. Washington, D.C.: U.S. Gov- ernment Printing Office.
Nelson, R. 1986. Institutions Supporting Technical Advance in Industry. American Economic Re- view 76:186-I 89.
-. 1993. National lnnovation Systems: A Comparative Analysis. New York: Oxford Uni- versity Press.
Oakey, R. 1985. High Technology Industries and Agglomeration Economies. In Silicon Land- scapes, ed. P. Hall and A. Markusen, pp. 94-117. Boston: Allen and Unwin.
Rosenberg, N. 1972. Technology and American Economic Growth. New York: Harper and Row.
-. 1982. lnside the Black Box: Technology and Economics. New York: Cambridge Univer- sity Press.
Saxenian, A. 1985. Silicon Valley and Route 128: Regional Prototypes or Historical Exceptions? In High Technology, Space and Society, ed. M. Cas- tells, pp. 81 -11 5. Beverly Hills: Sage.
Sayer, A., and Walker R. 1993. The New Social Economy. Oxford: Basil Blackwell.
Scherer, F. M. 1983. The Propensity to Patent. ln- ternational lournal of Industrial Organization 1 :I 07-1 28.
Scott, A. j. 1988. New Industrial Spaces. London: Pion.
-. 1990. Metropolis; From the Division o f La- bor to Urban form. Los Angeles: University of California Press.
Scott, A. I., and Storper, M. 1990. Work Organi- zation and Local Labor Markets in an Era of Flex-
Dow
nloa
ded
by [
Uni
vers
ity N
orth
Car
olin
a -
Cha
pel H
ill]
at 0
7:32
30
July
201
4
The Geographic Sources of Innovation 229
ible Production. lnternational Social Science lour- nal129:573-591.
Schumpeter, Joseph. 1954. Capitalism, Socialism and Democracy. 3rd ed. New York: Harper and Row.
Sternberg, Ernest. 1991. Sectoral Clusters in Eco- nomic Development: Lessons from Rochester and Buffalo, New York. Economic Development Quarterly 5:342-356.
Stohr, W. 1986. Regional Innovation Complexes. Papers o f the Regional Science Association 59:29-44.
Storper, M., and Walker, R. 1989. The Capitalist Imperative: Territory, Technology and Industrial Growth. Oxford: Basil Blackwell.
Sweeney, G. P. 1987. Innovation, Entrepreneurs and Regional Development. New York: St. Mar- tin‘s Press.
Tassey, G. 1991. The Functions of Technology In- frastructure in a Competitive Economy. Research Policy 20:329-343.
Thomas, M. 1985. Regional Economic Develop- ment and the Role of Innovation and Technologi- cal Change. In The Regional Economic Impact o f
Technological Change, ed. A. T. Thwaites and R. P. Oakey, pp. 13-33. New York: St. Martin’s Press.
Thompson, W. 1962. Locational Differences in In- ventive Effort and Their Determinants. In The Rate and Direction of lnventive Activity, ed. R. Nelson, pp. 253-271. Princeton: Princeton Uni- versity Press.
U.S. Department of Commerce, Bureau of the Cen- sus. 1981. 1977 Census of Manufacturers. Washington, D.C.: U.S. Government Printing Office.
. 1986. 1982 Census o f Manufacturers. Washington, D.C.: US. Government Printing Office.
Technology, lnnovation and Regional Economic Development. Washington, D.C.: Government Printing Office.
Von Hippel, E. 1988. The Sources of Innovation. New York: Oxford University Press.
Feldman, Maryann P., and Florida, Richard. 1994. The Geographic Sources of Innovation: Tech- nological Infrastructure and Product Innovation in the United States. Annals of the Association of American Geographers 84(2):210-229. Abstract.
The fate of regions and of nations increasingly depends upon ideas and innovations to facilitate growth. In recent years, geographers have made fundamental contributions to our understanding of the innovation process by exploring the diffusion of innovation, the location of R&D, and the geography of high-technology industry. This paper examines the geographic sources of inno- vation, focusing specifically on the relationship between product innovation and the underlying ”technological infrastructure” of particular places. This infrastructure is comprised of agglomera- tions of firms in related manufacturing industries, geographic concentrations of industrial R&D, concentrations of university R&D, and business-service firms. Once in place, these geographic concentrations of infrastructure enhance the capacity for innovation, as regions come to spe- cialize in particular technologies and industrial sectors. Geography organizes this infrastructure by bringing together the crucial resources and inputs for the innovation process in particular places. Using a direct measure of commercial product innovation, an empirical model of the geography is presented. The model tests the hypothesis that innovation is concentrated in places that possess a well-developed technological infrastructure. The analysis confirms this hypothesis; innovations cluster geographically in areas that contain geographic concentrations of specialized resources indicative of technological infrastructure. The spatial concentration of these resources, furthermore, reinforces their capacity to innovate. Key Words: industry R&D, innovation, knowl- edge-base, regional capacity, technological infrastructure, university R&D.