Page 1
BERA Conferences, 2012
George Kenyon Hall, University Hall Place
University of Manchester
1 Wednesday 5th September 2012
http://beraconference.co.uk/abstracts/
TECHNOPHOBIA VERSUS ICT ACCEPTANCE AND USE IN TEACHING AND
LEARNING AMONG ACADEMIC STAFF OF UNIVERSITIES IN NORTHERN
NIGERIA
Authors:
Suleiman Alhaji Ahmad1 (Ph.D.)
Manir Abdullahi Kamba2 (Ph.D.)
Muhammad Usman3 (Ph.D.)
College of Education PMB 44 Azare, Bauchi State Nigeria1
Bayero University Kano2
Abubakar Tafawa Balewa University Bauchi3
Corresponding email: [email protected]
Paper presented at the British Educational Research Association Annual Conference, University of
Manchester, 4-6 September 2012
Abstract
The paper x-rays the importance of information and communication technology (ICT)
as a tool for teaching, learning and research that is dramatically changing the
landscape of educational development since the last two decades. The incorporation
of ICT in educational sector is rendering plethora of opportunities for higher
institutions to integrate ICTs in teaching, learning and research. However, the
purview of literatures indicates that there exists a significant resistance to technology
(i.e. technophobia) among academic staff in tertiary institutions in Northern Nigeria.
This becomes a deterring factor for successful integration of ICTs in tertiary
institutions of Northern Nigeria and the country in general. The paper uses modified
Technology Acceptance Model (TAM) to ascertain the level of ICT acceptance and
utilisation in teaching and learning among academic staff in higher institutions in
northern Nigeria. Questionnaire was the only instrument used for collecting relevant
data for the study. Stratified random sampling was used and data was analysed using
SPSS. The findings of the study indicates a significant relationship between
availability, perceived usefulness, perceived ease of use, and intention to use,
whereas, ICT anxiety, mediated the relationship. The study concludes that
technophobia has been the major problem hindering academic staff to effectively use
ICT for teaching and learning process, thus, it is hoped that the study will open more
gaps for future researches that would enhance efforts in educational development,
thus, bridging the digital divide in the country.
Keywords: Technology Acceptance, Technophobia, Resistance to Technology, TAM, ICT,
Nigeria.
Page 2
BERA Conferences, 2012
George Kenyon Hall, University Hall Place
University of Manchester
2 Wednesday 5th September 2012
http://beraconference.co.uk/abstracts/
Introduction
The use of information and communication technologies (ICT) today has significant
impacts on our lives. In education sector many tertiary institutions realize the potentials of using
the technology in classrooms as an aspect of enhancing learning environment. The recent
technology infusion causes presentation of instruction and methods of communication in our
traditional university classrooms to have changed (Masrom, 2007). Information technology
widens opportunities for teachers to integrate the technological tools into the teaching-learning
process in order to improve the system. These advances create new opportunities for
collaboration, sharing, and interaction in learning (Suleiman 2011). The use of recent
technologies in schools inspires the educators to approach the teaching tasks with sense of
purpose which makes the learning process easy for students. The Internet, the multimedia
gadgets and other interactive programs on CD-ROMs assist students’ learning. The innovations
and recent advancements in ICT rapidly transform teachers and their work to the extent that
classrooms today must be technology-supported environment. Getting ready to adopt the use of
technology and understanding how the technology can support teaching-learning process should
form parts of the skills required in the teaching profession. There is the need for policies on
professional development designed to cover workshops and re-training of teachers to positively
influence them in adoption of the use of the computer technology in their work.
ICT is a gateway to the modern information, skills and orientation (ISO), which
distinguishes the world order. The adoption of ICT has set a landmark in educational sector in
the last two decades. The ICT adoption in educational system has become a background for
driving the potentials of new technological devices which revolutionize the educational system.
It is obvious that effectiveness of using ICT tools in education would be that factor which will
determine which countries would develop successfully in the future. However, Suleiman (2009)
asserts that the digital divide is today one of the wide-ranging encumbrance among people and
countries in this present digital era. It is the inequality of access to information technology. As
the people of more technically progressed societies become highly enriched by the knowledge
they tend to create, there is a cognizance that many more millions of people are not only offline
but also lack the freedoms associated with such prevailing civilization especially in Africa.
The convergence of a variety of technological, instructional, and pedagogical
developments altered teaching and learning process in recent times. Recent technology
challenges the educational structures which facilitate learning. Recent developments in the field
of computer technology and the diffusion of other technological devices such as multimedia
gadgets and other network resources pre-figure the development and implementation of
innovative teaching strategies. Many advocate educators of technology integration into teaching-
learning process believe that it will improve learning and better prepare learners for the 21st
century.
The introduction of ICT tools into the educational sector created new social stereotypes
and gender inequalities. Thus, old stereotypic gender differences in attitudes and achievements
that previously existed in mathematics and technological disciplines were extrapolated to the
area of ICT.
Page 3
BERA Conferences, 2012
George Kenyon Hall, University Hall Place
University of Manchester
3 Wednesday 5th September 2012
http://beraconference.co.uk/abstracts/
Statement of Problem
It is clear that technology is becoming an important part of education and teachers are
seen as a crucial link in developing ICT literate students. Teachers’ technology acceptance was
operationalized through Venkatesh, Davis and Moris (2007) the Technology Acceptance Model
2 (TAM2). The TAM2 combines measurement of social and cognitive influences on potential
computer users with users’ perceptions of the perceived usefulness and of their intentions to use
a computer system to understand the conditions for adopting computer system.
Academic staff perceptions of computer technology were areas needing investigation.
Another research gap, which requires attention, is that the academic staff are part of an
interactive social system; the educational system which, they are a part of shapes them as they
shape it as well (Bandura, 1997).
Academic staffs of universities are expected to prepare their syllabi and notes with a
word processor, to supplement their traditional lectures with PowerPoint presentations, or to
deliver their courses in state-of-the-art distance learning formats. Many have embraced emerging
technology, yet have resisted the changes to overcome other barriers. This resistance has
presented new challenges for university dons to promote their institutions as being well equipped
with cutting edge technology.
Information and communication technology (ICT) has reshaped the responsibilities of the
school teachers over the last decade by infusing ICT into teaching which emerged as an issue of
educational reform across countries. Teachers have been encouraged to use ICT to facilitate their
teaching tasks and create better learning environments. Kozma, (2003) states that a gap does
exists between ICT affordances and teachers’ intentions of use.
It is evident that there are no clear set of preconditions is dramatically leading teachers to
adopt ICT in teaching (Thomas, 2001). Many studies examined some factors such as anxiety,
attitude, and self-efficacy, but they did not pay attention to intention. Others focused attitude
which mediated by gender, and suggested for extension to include computer anxiety and
intention. The literature provided that further research is necessary to identify factors related to
instructors’ technology acceptance within educational environments. This study tries to fill these
gaps.
Objectives of the Study
This study, beside the broad objective which is to examine a wide range of both objective
and subjective factors that influence the academic staff’s attitude toward use of technology in
their assignments of teaching especially for class preparation. The study states the following
three specific objectives as they are translated into the stated research questions:
To investigate differences of attitude and acceptance of ICT technology among academic
staff in Northern Nigerian universities in terms of gender designation and institution.
To formulate a new fit model of Technology Acceptance Model in to Nigerian
educational system.
To examine relationship between availability, perceived usefulness, perceived ease of
use, and intention to use, whereas, ICT anxiety, mediated the relationship.
Page 4
BERA Conferences, 2012
George Kenyon Hall, University Hall Place
University of Manchester
4 Wednesday 5th September 2012
http://beraconference.co.uk/abstracts/
Research Hypotheses
Nine null hypotheses were developed based on the research objectives. These are adopted from
diffusion of innovations theory. The hypotheses are as follows:
H1o: There is no significant relationship between Usefulness and Anxiety
H2o: There is no significant relationship between Ease of Use and Anxiety
H3o: There is no significant relationship between Intention and Anxiety
H4o: There is no significant relationship between Availability and Anxiety
H5o: There is no significant relationship between Anxiety and Attitude
H6o: There is no significant relationship between Attitude and Acceptance
H7o: No significant difference in terms of Gender in the Anxiety and Attitude relationship
H8o: No significant difference in terms of Designation in the Anxiety and Attitude relationship
H9o: No significant difference in terms of Institution in the Anxiety and Attitude relationship
Figure: 1. The Proposed Research Model
Significance of the Study
The primary contribution of the study is that it allows a comparison of the relative
influence of these various factors (acceptance of technology, attitude towards use of technology
in teaching and availability, intention to use, perceived usefulness, perceived ease of use, and
technology anxiety). This will help policymakers and school administrators identify the relative
importance of various impediments to the academic staff’s use of ICT and educational
technology tools in general and in their particular university.
The significance of this study is to allow examine academic staff on the level attention
toward use of ICT and their adjustment with technology at their workplace. The conclusion
Anxiety
Usefulness
Intention
Ease of Use
Availability
Gender
Designation
Institution
Attitude Acceptance
Page 5
BERA Conferences, 2012
George Kenyon Hall, University Hall Place
University of Manchester
5 Wednesday 5th September 2012
http://beraconference.co.uk/abstracts/
drawn from this study will be crucial in choosing who are involved in or concerned about the
improvement of the development, effectiveness and adjustment to technology in their institution.
Besides, the findings from scope area Northern Nigerian universities will be useful and
interesting particularly to the educational researchers in terms of technology acceptance model.
This study examines the application of modified TAM in the Nigerian Educational system
because of the overwhelming amount of research on the TAM in other advance societies.
Limitations
Beside limitation in the scope area and limited unit of analysis i.e. academic staff, the
study provides useful insights into the relationship of various variables. However, the results
may be viewed in light of possible limitations. Since the study was conducted in Northern
Nigeria, the achieved results might not be generalized to other part of Nigeria which has
substantial differences in terms of cultural and educational background with the northern part.
Although the lecturers were arbitrary distributed across the universities, culture and environment
can affect the perception of the research instruments, the conceptual constructs and the
relationships of the variables. Therefore, generalizing findings from culture to culture should be
done with cautious. The present study is limited also because of the results that were completely
obtained from self-report data system. The results of this study are limited by the use
questionnaire as the only single method of data collection. Although there are more than one
hundred universities in Nigeria the study limits to only six sampled Universities in Northern
Nigerian (table ….) in order to have a manageable scope.
Methodological limitation can be seen in the TAM model. It is seen as a viable model in
identification of resistance to technology through focusing on behavioral constructs it is
considered to be the simplest, easiest, and most powerful measure of technology usage.
However, some critics believe that TAM is too simple and has a limited number of constructs to
describe behaviors.
Literature
The technology revolution is challenging and redirecting all forms of education,
including higher education. The incorporation of technology into the teaching–learning process
has become an important component throughout all areas of higher education.
Attitude is one of the determining factors in predicting people’s behavior it also
influences the positive or negative response to a specific object, situation, institution, or person
(Aiken, 2000). This has to be backed by perceived usefulness which is another major
determinant in the adoption of technology. Attitude therefore, plays an important role in
education. Computer attitude is a people’s thought that influences the use of computers. Over the
years researchers on technology acceptance have found close relationships between computer
attitudes and other variables (Teo, 2008). Computer anxiety has been referred to as aversion to
computer, fear or apprehension towards dealing with computers thus this can be an obstacle to
vital implementation and adoption ICT in universities in Nigeria.
Page 6
BERA Conferences, 2012
George Kenyon Hall, University Hall Place
University of Manchester
6 Wednesday 5th September 2012
http://beraconference.co.uk/abstracts/
The Technology Acceptance Model (TAM)
The original version of the Technology Acceptance Model was put forward by Davis et al
(1989). TAM adopts the well-established causal chain of beliefs, attitude, and intention,
behaviour that has been put forward by social psychologists (Ajzen, 1991), it later become the
Theory of Reasoned Action (TRA). Based on certain beliefs, a person forms an attitude about a
certain object, on the basis of which he or she forms an intention to behave with respect to that
object. The intention to behave is the sole determinant of actual behaviour.
The TAM has been empirically reviewed and modified in a variety of settings with
various levels of success. To obtain a better understanding of the acceptance information
technology by academic staff, stake holders should understand the effective elements on their
attitudes toward using information technology. Therefore, the study would facilitate a better
understanding about academic staff self-efficacy and the variables that appeared to influence
perceptions regarding attitude toward using information technology.
Venkatesh, Davis and Morris (2007) stated that TAM is considered to be well-established
and robust. The model consistently explained a substantial proportion of the variance in usage
intentions and behavior. Perceived usefulness and perceived ease of use we found to be
determinants in predicting intentions of actual computer use. The intention of use also shows that
it has a high ability to predict the use computer systems. Venkatesh, Davis and Morris (2007)
identified perceived ease of use as a key driver of user acceptance of computer technology with
additional key determinants of computer anxiety, and perceived enjoyment. Davis, (1993 p. 477)
stated that:
1. Actual use: is the individual’s behavior regarding the new system.
2. Perceived ease of use: is the degree to which the individual believes that using
the system would require little or no mental and physical effort.
3. Perceived usefulness: is the degree to which an individual believes the use of a
system could enhance job performance.
TAM theory symbolize that personal performance is determined by intention
synchronized with attitude and subjective norm. By using the theory of reasoned action as a
theoretical foundation, Davis (1989) created the TAM to focus on the domain of user acceptance
of technology by replacing the attitudinal components of the theory with perceived ease of use
and perceived usefulness.
Perceived ease of use
Perceived ease of use is theoretically based on the research of Bandura (1982) who
defined self-efficacy as “judgments of how well one can execute courses of action” (p. 122). In
other words, self-efficacy is the belief in one’s own ability to overcome the perceived difficulty
of a task. The self-efficacious persons see a link between their own efforts and a successful
outcome.
Page 7
BERA Conferences, 2012
George Kenyon Hall, University Hall Place
University of Manchester
7 Wednesday 5th September 2012
http://beraconference.co.uk/abstracts/
Perceived usefulness
Perceived usefulness is another major determinant in the adoption of technology. It is the
tendency of users to believe that the new technology will help them perform their job better
(Davis, 1989). Sun and Zhang (2006) found a correlation between performance and an undefined
construct similar to perceived usefulness. They also indicate the effects of perceived usefulness
as a statistically significant influence on attitude, behavioral intention and usage. They found that
perceived usefulness as a factor significant that influences user acceptance of technology. The
perception of usefulness is formed in interaction with other individuals and a system (Davis,
1989).
Intentions
Davis (1989) emphasized that within organizational settings, people form intentions
toward behaviors which they believe may increase their job performance. The concept of
continuance is critical because technology acceptance research often focuses on the initial
adoption of technology and overlooks or ignores long-term use and the integration of new
software into the daily activities of employees. Research must include more longitudinal studies
to ensure that new technologies actually have been accepted.
Computer anxiety
Computer anxiety is a psychological phenomenon that has been well-reported in the
literature. In many studies, computer anxiety has been variously referred to as aversion to
computer, fear or apprehension towards dealing with computers. In other words, it is possible for
people to be anxious about actively using a computer or watching others use a computer, or both.
Generally, computer anxiety refers to negative emotions in cognitive states evoked in actual or
imaginary interaction with computer-related technology. Students who experience a high level of
computer anxiety have been found to avoid computers or general areas where computers are
found; be extremely cautious with computers; possess negative feelings about computers, and
shorten the necessary use of computers (Bozionelos, 2001).
It is usually argued that, in a world where computer interactions are necessary,
particularly in the educational setting, computer anxiety may be a problem. Computer anxiety
refers to an unpleasant emotional state or negative feeling surrounding computers. Computer
anxiety is the result of negative past computer experience and an over exaggeration of the threat
posed by the computer interaction.
Venkatesh, Davis, and Morris (2007) have discussed that the TAM can help predict
acceptance, but does not always help us understand and explain acceptance beyond attributing
the system characteristics of ease of use and usefulness. Tung and Chang (2007) created an
extended TAM, which included computer self-efficacy, and computer anxiety to explain
adolescent technology acceptance. Computer anxiety had a negative impact on computer self-
efficacy and ultimate intent to use it.
Attitude toward ICT
The attitudes toward using the system are predicted from two factors which represent
user beliefs and attitude, perceived usefulness and perceived ease of use. As emerging
educational technology is a main driver in higher education a review of educational technology
Page 8
BERA Conferences, 2012
George Kenyon Hall, University Hall Place
University of Manchester
8 Wednesday 5th September 2012
http://beraconference.co.uk/abstracts/
trends and issues, as well as technology acceptance in education was conducted to discover what
is already known within these areas of research. The review revealed three main categories of
technology usage in educational environments: (a) instructional, (b) productivity, and (c)
administrative. Although instructional use of emerging educational technology is slowly
increasing, this revealed that several barriers to the effective use of emerging educational
technology in higher education still exist. The issues were related to all aspects of education,
including institutional, faculty, students and educational effectiveness. One major barrier is that
there is still no consensus as to the effectiveness of using emerging educational technology in
improving student outcomes, which is critical to instructor acceptance (Wenglinsky, 1998).
Acceptance
In technology acceptance research, it has consistently been found to have a significant
impact on technology acceptance. These constructs have been found to have both direct and
indirect influences on technology acceptance, and on each other. Because of these complex
relationships between the constructs, and because research results have been mixed, additional
research to clarify the relationships between the constructs has been recommended. The
investigation of these constructs provided the specific context for the research questions in the
current study.
ICT Use in Education in Nigeria
Information Communication Technology (ICT) is the processing and maintenance of
information, and the use of all forms of computer, communication, network and mobile
technologies to mediate information. Communication technologies include all media employed
in transmitting audio, video, data or multimedia such as cable, satellite, fibre optics, wireless
(radio, infra-red, Bluetooth, Wifi). Network technologies include personal area networks (PAN),
campus area network (CAN), intranets, extranets, LANs, WANs, MANs and the internet.
Computer technologies include all removable media such as optical discs, disks, flash memories,
video books, multimedia projectors, interactive electronic boards, and continuously emerging
state-of-the-art PCs. Mobile technologies comprises mobile phones, PDAs, palmtops, etc.
(Iloanusi, and Osuagwu 2010).
ICT Use in Education in Nigeria Computer applications in education are common to
reserve a classroom teaching and learning activity, which is universally agreed by education
practitioners. However, a reportedly obscure area in the computer-based instruction is how it can
systematically implement the different learning path for the diverse levels of students. The
advancement in computer technology has enticed various types of learning activities in the
classroom environment. For instance, students with computer simulation technologies could
learn complex science topics just as much enjoyable as they could have them literally
understood.
With the advent of Internet and mobile telecommunication in the world, much has
changed in the way we live, work and interacts with each other. In a traditional classroom
setting, teachers often ask students questions to determine the level of comprehension in the
class. In Nigeria, the story of ever evolving affairs has been the same. Many of the officials
Page 9
BERA Conferences, 2012
George Kenyon Hall, University Hall Place
University of Manchester
9 Wednesday 5th September 2012
http://beraconference.co.uk/abstracts/
wonder why they should spend money on communication rather than on social demands. While
many have been restrained by the above factors, the spirit of technophobia has kept some aback.
The feeling of dislike for technology, has led to lower patronage for technology devices
and services. And if not squarely addressed may limit the expected growth to an information
society. The universities teachers’ culture and collective practices each plays a crucial role in
enhanced technology-based teaching and learning. This is because ICT facilitates meaningful
learning and teaching only through transformed social practices (Hakkarainen et al., 2001). In
order to incorporate ICT with their teaching practices, the academic staff of the universities need
to change their everyday practices seeking and working with modern knowledge. It may span
through several years, but should not hamper the teachers’ effort to start using ICT intensively in
preparing and conducting their teaching activities (Hakkarainen et al., 2001). In the
transformation with ICT teachers’ work appears to becoming more and more knowledge
intensive in nature. As a consequence, teachers have to engage in lifelong learning and efforts of
keeping knowledge, expertise, and competence up-to-date throughout their life. Working within
a collaborative community is likely to provide overlapping zones of proximal development that
smooth professional development (Vygotsky, 1962). Educators’ taking active part in using ICT
are likely to belong to community of networked practices. It is asserted that teachers have the
reported the benefits of on-line networking as the ways to sharing knowledge, expressing and
receiving collegial and emotional support, and an opportunity to air frustration and to learn new
things.
The ICT in Nigeria experiences some evolutionary measures. Government had been
trying a lot to intensify ICT in Nigeria right from primary to tertiary education. This is through
various means in form of training, provision of facilities and sponsoring various projects and
researches. This trend suggests that the level of technophobia among Nigerian academic staff of
universities has been slowing drastically vis a vis the level of ICT usage which is growing
significantly. Government has been committing to many efforts through agencies such as
National Communication Commission (NCC) and Tertiary Education Trust Fund (TETFund) in
provision and enhancing ICT tools and services in tertiary institutions. The establishment of ICT
centres and Centres for Educational Technology (CET) had been done in most institutions.
Provision of e. libraries, and enhancing staff development on capacity building had been on the
epoch all over the tertiary institutions in the country for the last half decade.
There are a lot of development opportunities for teachers to equip themselves with ICT
skills especially on the web. The Teachers’ Registration Council (TRC) had been doing a lot in
campaigns to prepare teachers for ICT skills acquisition. Training on ICT is now a pre-requisite
for all academic staff in tertiary institutions in Nigeria. As this may have been the avenue to
enhancing the ICT in educational sector.
Technophobia
Technophobia can be seen as fear or dislike of an advanced complex device like
computers or the technology in general. It generally refers to the sense of an irrational fear, but
others contend fears are justified. It is the opposite of technophilia or techonphile the love for
technology.
The presence of computers in the classroom is seen as a means which students would
thrive in a modern learning environment They become motivating factors as they allow students’
access to several information and they promote a greater understanding by allowing the students
Page 10
BERA Conferences, 2012
George Kenyon Hall, University Hall Place
University of Manchester
10 Wednesday 5th September 2012
http://beraconference.co.uk/abstracts/
to learn in various ways unimagined previously (Rubin, Fernandes, Avgerinou & Moore 2010).
Computer and Internet in classroom has steadily become part of that educational landscape.
Growing use of computers in education has substantial benefits to their integration in the
curriculum. Olaniyi (2006); Okon, Chika and Emmanuel (2007) identified factors influencing
digital divide and negative attitude towards ICT in Nigeria as:
Expensive devices
Poor access
Poor skills to use
Inadequate financial capacity
Poor internet services and low teledensity
Poor of power supply
Poor level of awareness
Poor technical assistance and maintenance culture
In appropriate ICT policies
Poor implementation of the policies
Population explosion
Government negative attitude toward rural areas
Low government commitment to education
People attitude and fear towards technology
Methodology
The study is descriptive research and survey research technique. The researchers
collected data by distributing questionnaires to the sample of the accessible population.
The population comprised all the academic staff in the universities in Northern Nigeria.
(Table 1) This population was chosen for the fact that the university’s academic staff had been
involved in provision and using ICT tools in their service delivery in the country
Table: 1 List of Universities sampled
S/N Institutions Sampled Year
Established.
Statu
1 *Ahmadu Bello University, Zaria 1962 Federal
2 *Bayero University, Kano 1975 Federal
3 *University of Jos, Jos 1975 Federal
4 *University of Maiduguri, Maiduguri 1975 Federal
5 *Usman Danfodiyo University, Sokoto 1975 Federal
6 *Abubakar Tafawa Balewa University, Bauchi 1988 Federal
7 ABTI - America Yola 2003 Private
8 Bauchi State University Gadau 2010 State
Data were collected through the use of questionnaire which comprised two sections. The
first section deals with the demography information on the respondents, example: Gender,
Page 11
BERA Conferences, 2012
George Kenyon Hall, University Hall Place
University of Manchester
11 Wednesday 5th September 2012
http://beraconference.co.uk/abstracts/
Designation, and Institution. The second part assessed the availability of ICT facilities,
usefulness of ICT facilities, ease of use, intention to use, anxiety in using, attitude toward and
acceptance of ICT technology. This section comprised seven items structured on a Likert (1932)
five point scale ranging from strongly agree to strongly disagree. Four hundred copies of the
questionnaires were distributed to the respondents. The respondents were contacted physically
(in person) who were urged to complete the questionnaire. A total of 200 copies of the
instruments were required, the 200 copies were duly completed and returned thus, were the ones
used for the analysis.
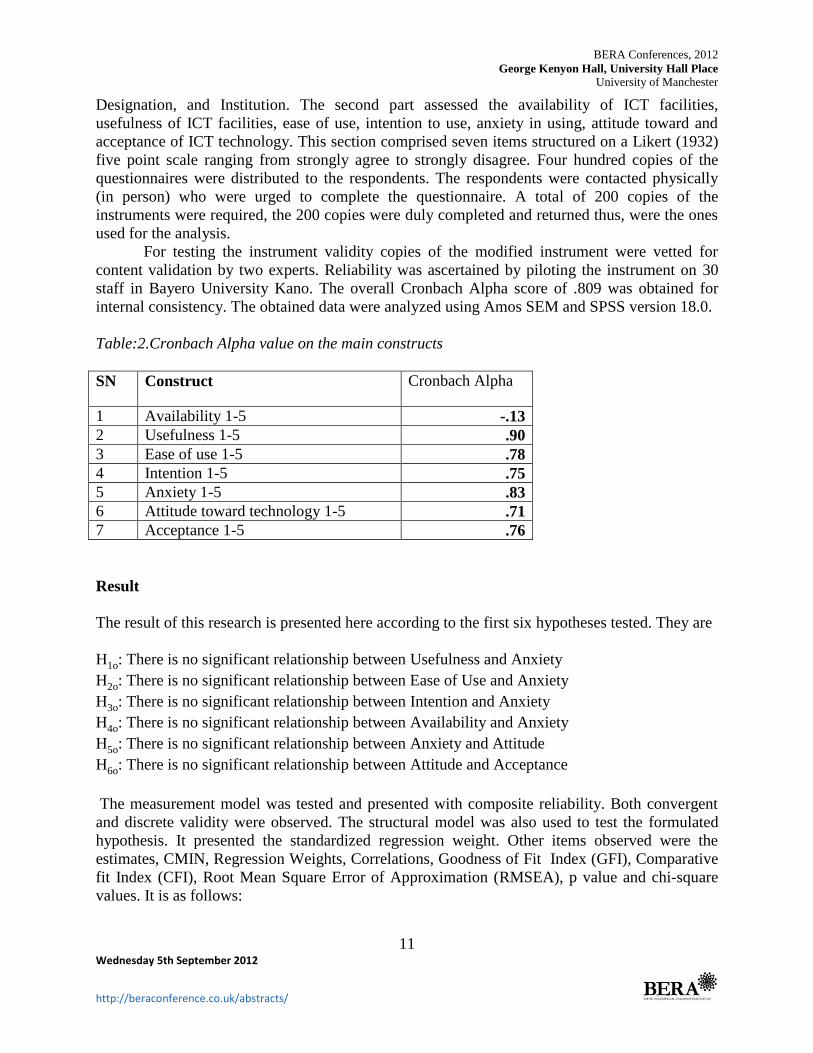
For testing the instrument validity copies of the modified instrument were vetted for
content validation by two experts. Reliability was ascertained by piloting the instrument on 30
staff in Bayero University Kano. The overall Cronbach Alpha score of .809 was obtained for
internal consistency. The obtained data were analyzed using Amos SEM and SPSS version 18.0.
Table:2.Cronbach Alpha value on the main constructs
SN Construct Cronbach Alpha
1 Availability 1-5 -.13
2 Usefulness 1-5 .90
3 Ease of use 1-5 .78
4 Intention 1-5 .75
5 Anxiety 1-5 .83
6 Attitude toward technology 1-5 .71
7 Acceptance 1-5 .76
Result
The result of this research is presented here according to the first six hypotheses tested. They are
H1o: There is no significant relationship between Usefulness and Anxiety
H2o: There is no significant relationship between Ease of Use and Anxiety
H3o: There is no significant relationship between Intention and Anxiety
H4o: There is no significant relationship between Availability and Anxiety
H5o: There is no significant relationship between Anxiety and Attitude
H6o: There is no significant relationship between Attitude and Acceptance
The measurement model was tested and presented with composite reliability. Both convergent
and discrete validity were observed. The structural model was also used to test the formulated
hypothesis. It presented the standardized regression weight. Other items observed were the
estimates, CMIN, Regression Weights, Correlations, Goodness of Fit Index (GFI), Comparative
fit Index (CFI), Root Mean Square Error of Approximation (RMSEA), p value and chi-square
values. It is as follows:
Page 12
BERA Conferences, 2012
George Kenyon Hall, University Hall Place
University of Manchester
12 Wednesday 5th September 2012
http://beraconference.co.uk/abstracts/
Table: 3: Model Fit Values
Chi-square = 1131.9 (= 548) p<.05
Chi Square = \cmin 2.066
df 548
GFI .763
AGFI .727
NNFI /TLI .761
CFI .780
RMSEA .073
CMIN 2.066
p-value p<.05
Model Supported
Figure1. Measurement Model on relationship between AVL, PUS, PEU, INT, AXY, ATT and
ACP
Page 13
BERA Conferences, 2012
George Kenyon Hall, University Hall Place
University of Manchester
13 Wednesday 5th September 2012
http://beraconference.co.uk/abstracts/
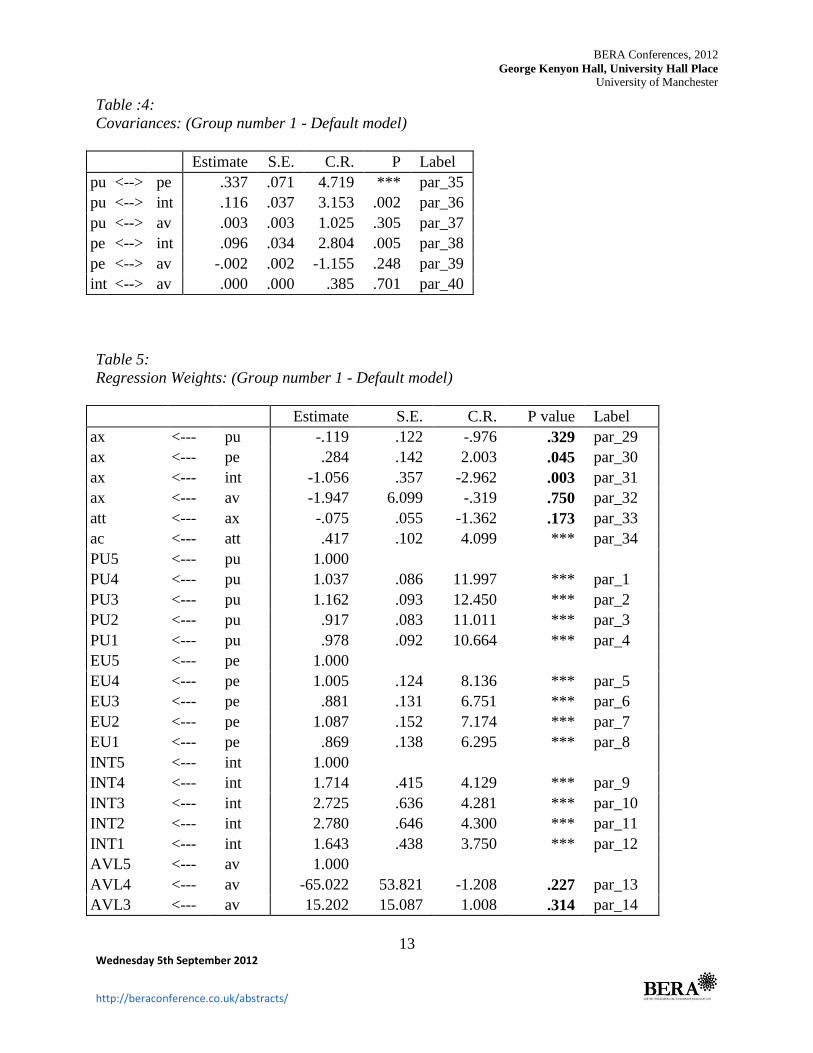
Table :4:
Covariances: (Group number 1 - Default model)
Estimate S.E. C.R. P Label
pu <--> pe .337 .071 4.719 *** par_35
pu <--> int .116 .037 3.153 .002 par_36
pu <--> av .003 .003 1.025 .305 par_37
pe <--> int .096 .034 2.804 .005 par_38
pe <--> av -.002 .002 -1.155 .248 par_39
int <--> av .000 .000 .385 .701 par_40
Table 5:
Regression Weights: (Group number 1 - Default model)
Estimate S.E. C.R. P value Label
ax <--- pu -.119 .122 -.976 .329 par_29
ax <--- pe .284 .142 2.003 .045 par_30
ax <--- int -1.056 .357 -2.962 .003 par_31
ax <--- av -1.947 6.099 -.319 .750 par_32
att <--- ax -.075 .055 -1.362 .173 par_33
ac <--- att .417 .102 4.099 *** par_34
PU5 <--- pu 1.000
PU4 <--- pu 1.037 .086 11.997 *** par_1
PU3 <--- pu 1.162 .093 12.450 *** par_2
PU2 <--- pu .917 .083 11.011 *** par_3
PU1 <--- pu .978 .092 10.664 *** par_4
EU5 <--- pe 1.000
EU4 <--- pe 1.005 .124 8.136 *** par_5
EU3 <--- pe .881 .131 6.751 *** par_6
EU2 <--- pe 1.087 .152 7.174 *** par_7
EU1 <--- pe .869 .138 6.295 *** par_8
INT5 <--- int 1.000
INT4 <--- int 1.714 .415 4.129 *** par_9
INT3 <--- int 2.725 .636 4.281 *** par_10
INT2 <--- int 2.780 .646 4.300 *** par_11
INT1 <--- int 1.643 .438 3.750 *** par_12
AVL5 <--- av 1.000
AVL4 <--- av -65.022 53.821 -1.208 .227 par_13
AVL3 <--- av 15.202 15.087 1.008 .314 par_14
Page 14
BERA Conferences, 2012
George Kenyon Hall, University Hall Place
University of Manchester
14 Wednesday 5th September 2012
http://beraconference.co.uk/abstracts/
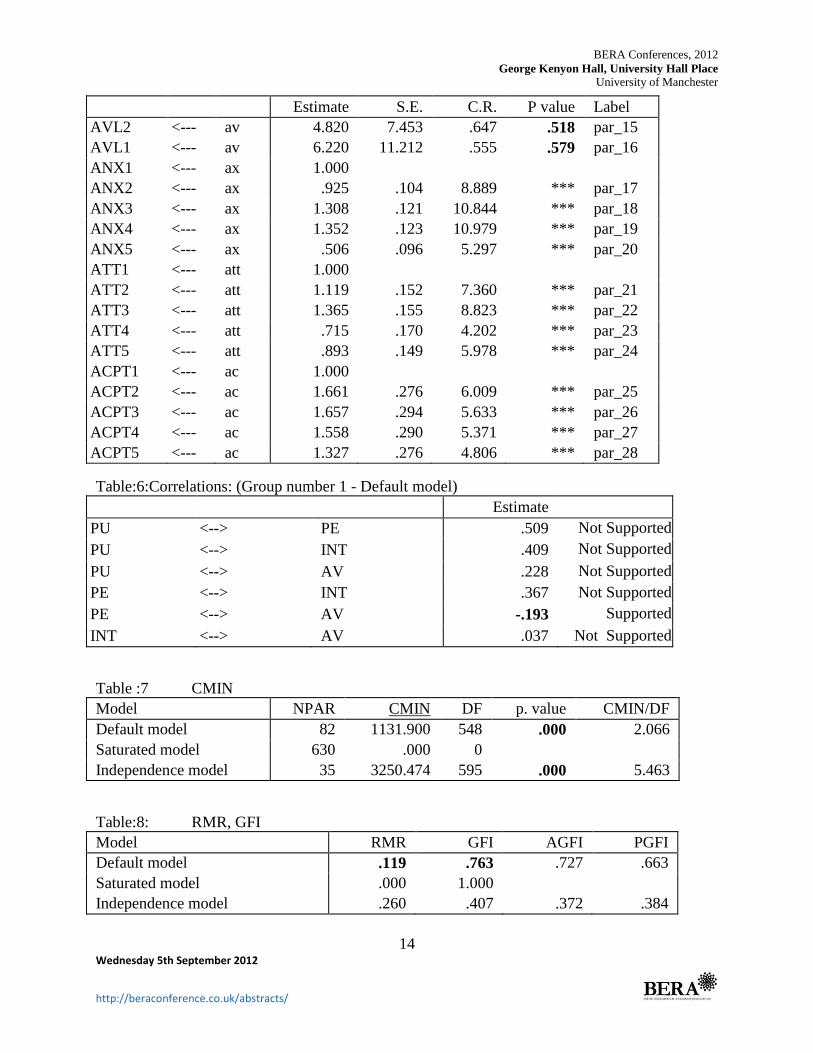
Estimate S.E. C.R. P value Label
AVL2 <--- av 4.820 7.453 .647 .518 par_15
AVL1 <--- av 6.220 11.212 .555 .579 par_16
ANX1 <--- ax 1.000
ANX2 <--- ax .925 .104 8.889 *** par_17
ANX3 <--- ax 1.308 .121 10.844 *** par_18
ANX4 <--- ax 1.352 .123 10.979 *** par_19
ANX5 <--- ax .506 .096 5.297 *** par_20
ATT1 <--- att 1.000
ATT2 <--- att 1.119 .152 7.360 *** par_21
ATT3 <--- att 1.365 .155 8.823 *** par_22
ATT4 <--- att .715 .170 4.202 *** par_23
ATT5 <--- att .893 .149 5.978 *** par_24
ACPT1 <--- ac 1.000
ACPT2 <--- ac 1.661 .276 6.009 *** par_25
ACPT3 <--- ac 1.657 .294 5.633 *** par_26
ACPT4 <--- ac 1.558 .290 5.371 *** par_27
ACPT5 <--- ac 1.327 .276 4.806 *** par_28
Table:6:Correlations: (Group number 1 - Default model)
Estimate
PU <--> PE .509 Not Supported
PU <--> INT .409 Not Supported
PU <--> AV .228 Not Supported
PE <--> INT .367 Not Supported
PE <--> AV -.193 Supported
INT <--> AV .037 Not Supported
Table :7 CMIN
Model NPAR CMIN DF p. value CMIN/DF
Default model 82 1131.900 548 .000 2.066
Saturated model 630 .000 0
Independence model 35 3250.474 595 .000 5.463
Table:8: RMR, GFI
Model RMR GFI AGFI PGFI
Default model .119 .763 .727 .663
Saturated model .000 1.000
Independence model .260 .407 .372 .384
Page 15
BERA Conferences, 2012
George Kenyon Hall, University Hall Place
University of Manchester
15 Wednesday 5th September 2012
http://beraconference.co.uk/abstracts/
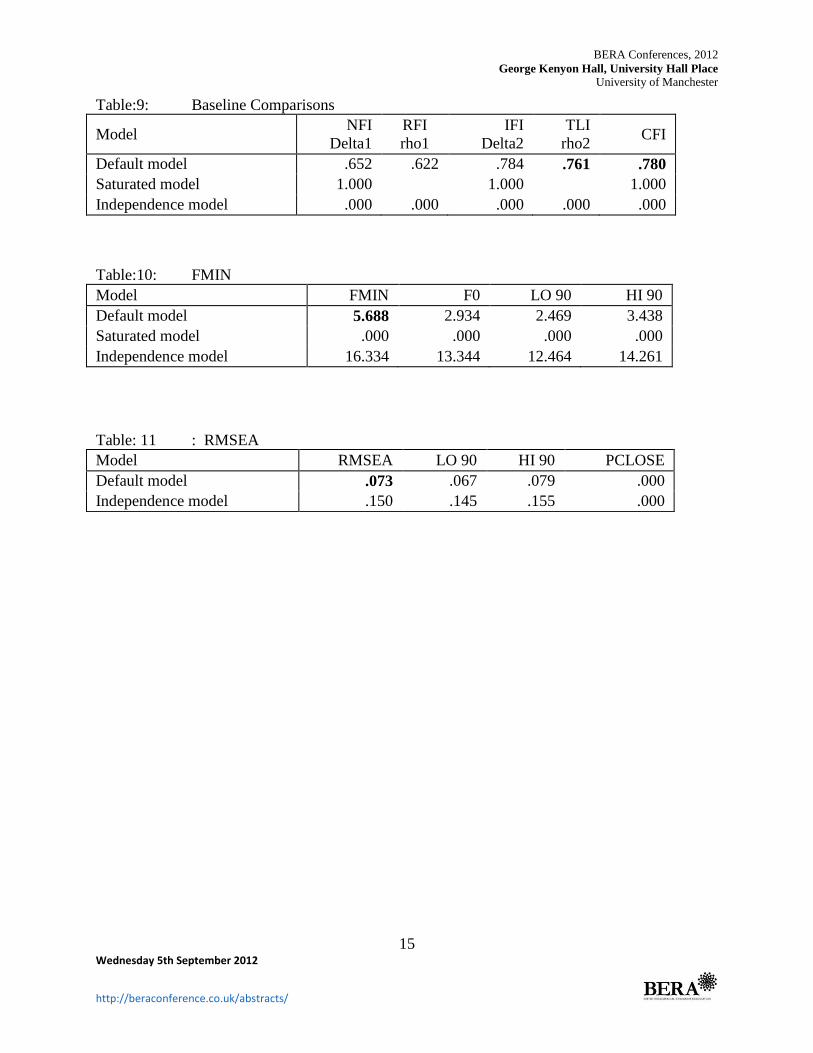
Table:9: Baseline Comparisons
Model NFI
Delta1
RFI
rho1
IFI
Delta2
TLI
rho2 CFI
Default model .652 .622 .784 .761 .780
Saturated model 1.000
1.000
1.000
Independence model .000 .000 .000 .000 .000
Table:10: FMIN
Model FMIN F0 LO 90 HI 90
Default model 5.688 2.934 2.469 3.438
Saturated model .000 .000 .000 .000
Independence model 16.334 13.344 12.464 14.261
Table: 11 : RMSEA
Model RMSEA LO 90 HI 90 PCLOSE
Default model .073 .067 .079 .000
Independence model .150 .145 .155 .000
Page 16
BERA Conferences, 2012
George Kenyon Hall, University Hall Place
University of Manchester
16 Wednesday 5th September 2012
http://beraconference.co.uk/abstracts/
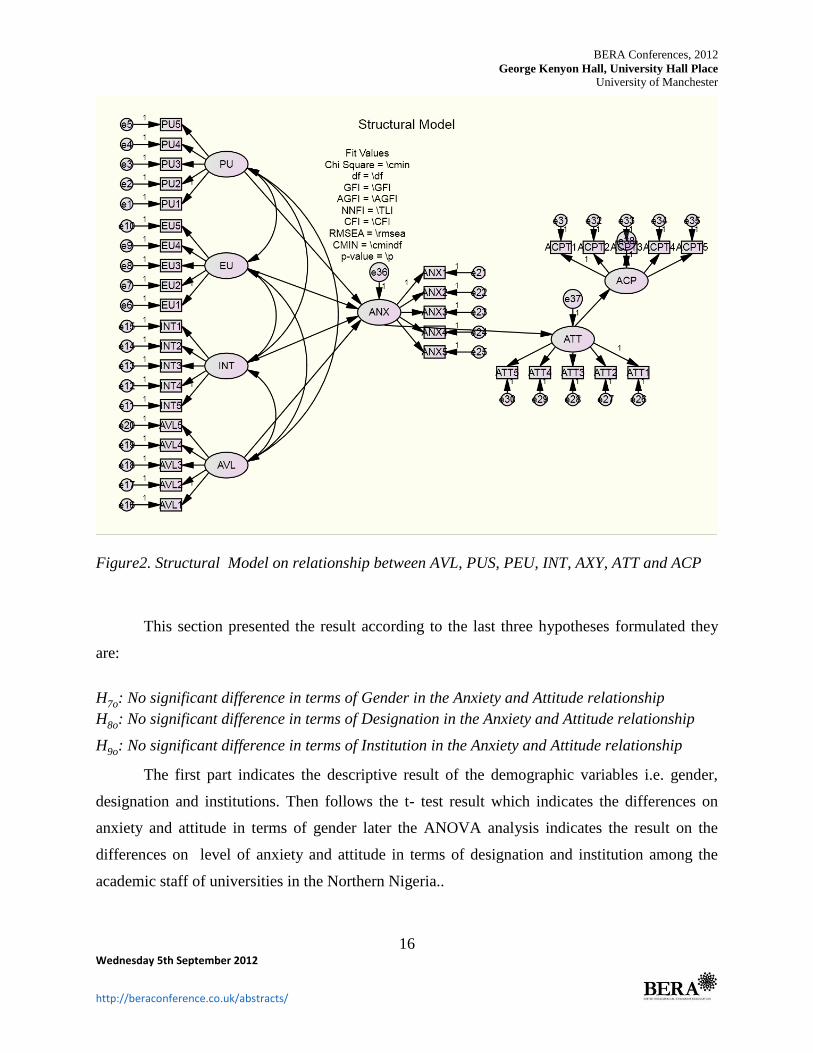
Figure2. Structural Model on relationship between AVL, PUS, PEU, INT, AXY, ATT and ACP
This section presented the result according to the last three hypotheses formulated they
are:
H7o: No significant difference in terms of Gender in the Anxiety and Attitude relationship
H8o: No significant difference in terms of Designation in the Anxiety and Attitude relationship
H9o: No significant difference in terms of Institution in the Anxiety and Attitude relationship
The first part indicates the descriptive result of the demographic variables i.e. gender,
designation and institutions. Then follows the t- test result which indicates the differences on
anxiety and attitude in terms of gender later the ANOVA analysis indicates the result on the
differences on level of anxiety and attitude in terms of designation and institution among the
academic staff of universities in the Northern Nigeria..
Page 17
BERA Conferences, 2012
George Kenyon Hall, University Hall Place
University of Manchester
17 Wednesday 5th September 2012
http://beraconference.co.uk/abstracts/
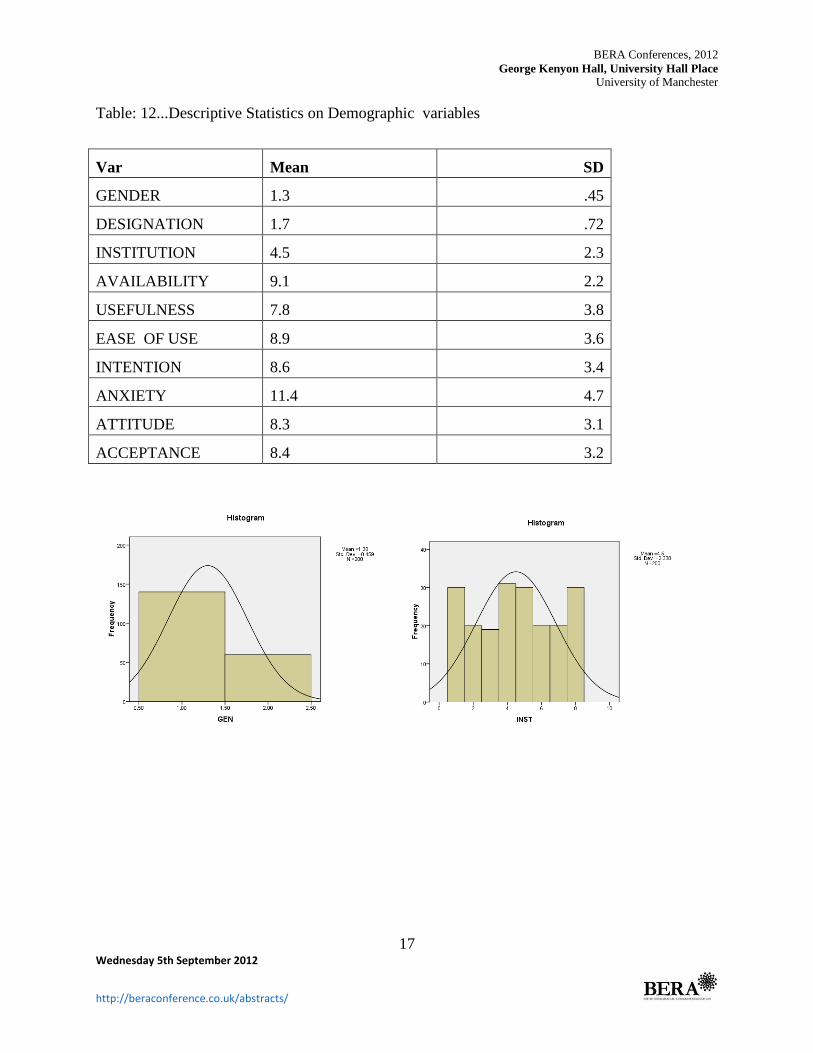
Table: 12...Descriptive Statistics on Demographic variables
Var Mean SD
GENDER 1.3 .45
DESIGNATION 1.7 .72
INSTITUTION 4.5 2.3
AVAILABILITY 9.1 2.2
USEFULNESS 7.8 3.8
EASE OF USE 8.9 3.6
INTENTION 8.6 3.4
ANXIETY 11.4 4.7
ATTITUDE 8.3 3.1
ACCEPTANCE 8.4 3.2
Page 18
BERA Conferences, 2012
George Kenyon Hall, University Hall Place
University of Manchester
18 Wednesday 5th September 2012
http://beraconference.co.uk/abstracts/
Page 19
BERA Conferences, 2012
George Kenyon Hall, University Hall Place
University of Manchester
19 Wednesday 5th September 2012
http://beraconference.co.uk/abstracts/
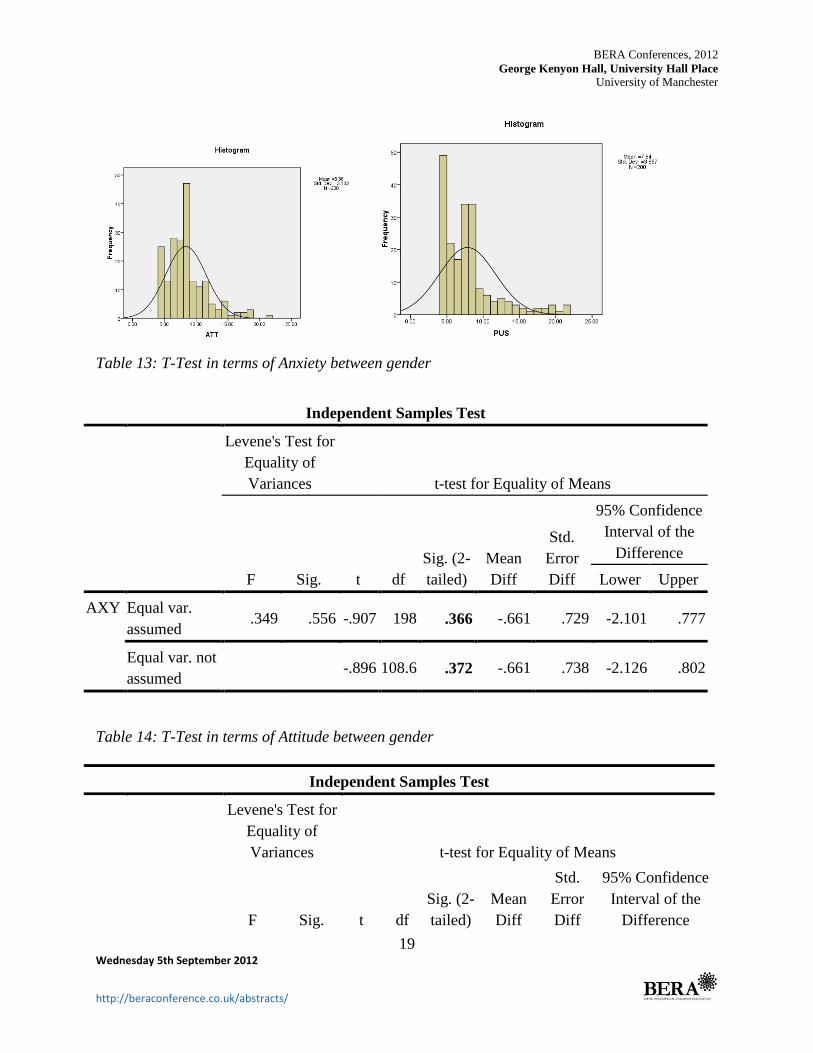
Table 13: T-Test in terms of Anxiety between gender
Independent Samples Test
Levene's Test for
Equality of
Variances t-test for Equality of Means
F Sig. t df
Sig. (2-
tailed)
Mean
Diff
Std.
Error
Diff
95% Confidence
Interval of the
Difference
Lower Upper
AXY Equal var.
assumed .349 .556 -.907 198 .366 -.661 .729 -2.101 .777
Equal var. not
assumed
-.896 108.6 .372 -.661 .738 -2.126 .802
Table 14: T-Test in terms of Attitude between gender
Independent Samples Test
Levene's Test for
Equality of
Variances t-test for Equality of Means
F Sig. t df
Sig. (2-
tailed)
Mean
Diff
Std.
Error
Diff
95% Confidence
Interval of the
Difference
Page 20
BERA Conferences, 2012
George Kenyon Hall, University Hall Place
University of Manchester
20 Wednesday 5th September 2012
http://beraconference.co.uk/abstracts/
Lower Upper
ATT Equal var.
assumed .016 .901 .832 198 .406 .409 .491 -.560 1.378
Equal var. not
assumed
.854 118.6 .395 .409 .478 -.539 1.357
Table: 15: ANOVA on Anxiety and Attidute in terms of Designation
ANOVA
Sum of Squares df Mean Square F Sig.
ATT Between Groups 120.637 7 17.234 1.745 .101
Within Groups 1895.905 192 9.875
Total 2016.542 199
AXY Between Groups 1653.160 7 236.166 16.228 .000
Within Groups 2794.180 192 14.553
Total 4447.340 199
Table 16: Difference in Bonferroni Tests on Attitude and Anxiety in terms of Institution
ATT UDUS ABU 1.83333 .90712 1.000 -1.0405 4.7072
AXY UNIJOS ABU 2.04333 .90712 .712 -.8305 4.9172
Table: 17 ANOVA on Anxiety and Attitude in terms of Designation
ANOVA
Sum of Squares df Mean Square F Sig.
ATT Between Groups 11.829 2 5.915 .581 .560
Within Groups 2004.713 197 10.176
Total 2016.542 199
AXY Between Groups 91.652 2 45.826 2.073 .129
Within Groups 4355.688 197 22.110
Page 21
BERA Conferences, 2012
George Kenyon Hall, University Hall Place
University of Manchester
21 Wednesday 5th September 2012
http://beraconference.co.uk/abstracts/
ANOVA
Sum of Squares df Mean Square F Sig.
ATT Between Groups 11.829 2 5.915 .581 .560
Within Groups 2004.713 197 10.176
Total 2016.542 199
AXY Between Groups 91.652 2 45.826 2.073 .129
Within Groups 4355.688 197 22.110
Total 4447.340 199
Table: 18: Differences in Bonferroni Tests on Attitude and Anxiety in terms of Designation
ATT PROFESSOR SENIOR .29386 .49279 1.000 -.8960 1.4838
AXY LECTURER 3-1 SENIOR 1.09614 .72638 .399 -.6578 2.8500
Table: 19: Regression on relationship between AVL, PUS, PEU, INT, AXY, ATT and ACP
Model Summary
Model R R Square
Adjusted
R Square
Std. Error
of the
Estimate
Change Statistics
R
Square
Change
F
Change df1 df2
Sig. F
Change
1 AVL .047a .002 -.003 3.24496 .002 .440 1 198 .508
2 PUS .231b .053 .044 3.16859 .051 10.659 1 197 .001
3 PEU .249c .062 .047 3.16262 .008 1.745 1 196 .188
4 INT .277d .077 .058 3.14543 .015 3.148 1 195 .078
5 AXY .280e .078 .055 3.15057 .002 .364 1 194 .547
6 ATT .470f .221 .196 2.90478 .142 35.220 1 193 .000
Page 22
BERA Conferences, 2012
George Kenyon Hall, University Hall Place
University of Manchester
22 Wednesday 5th September 2012
http://beraconference.co.uk/abstracts/
Discussion
The influence of this system and its effect on academic staffs’ ICT tools acceptance
cannot be overlooked. Therefore, university teacher’s acceptance and use becomes an area of
critical concern to the government as a measure of the successful of these efforts in encouraging
the use of ICT tools in education.
In this paper it indicates that the proposed model had been supported with enough evident
as fit model. The structural model output of Regression Weights, Correlations, Goodness of Fit
Index (GFI), Comparative fit Index (CFI), Root Mean Square Error of Approximation
(RMSEA), p value and chi-square values suggest that the causal effect do exist in the
relationship among the latent variables tested. . The entire exogenous (independent) variables
directly influence the endogenous (dependent) which is the acceptance. Thus, is translating the
high level of technophobia and moderate level of ICT tools usage among the academic staff. At
the same time, ICT tools acceptance has been an important research issue in information
systems. Among the various models appeared to evaluate and to predict acceptance, Technology
Acceptance Model (TAM) is the most widely referred. TAM was firstly introduced by Davis
(1989) where he proposed that perceived usefulness and perceived ease of use are the
fundamental determinants of user acceptance. Perceived usefulness being seen as the degree to
Page 23
BERA Conferences, 2012
George Kenyon Hall, University Hall Place
University of Manchester
23 Wednesday 5th September 2012
http://beraconference.co.uk/abstracts/
which a person believes that using a particular system would enhance his or her job performance;
perceived ease of use is seen as the degree to which a person believes that using a particular
system would be free of extensive effort. The two determinants were found highly correlated to
usage. This is consistent with logical relationships that when a person finds a system easy to use
and useful, he or she would be fear free and would have a higher motivation and intention to use
it especially in higher institutions of learning.
It is revealed in this study that among the personal ICT competencies that lecturers need
to develop, the highest scoring item is the development of the ability to use key ICT skills in
developing and presenting information. Freedman (1999) presents personal key ICT skills in four
main areas of knowledge namely: hardware, software, curriculum and general knowledge. These
key ICT skills are not limited to knowledge of technical skills such as key boarding and technical
use of some software packages. They include the ability to recognize when and how to apply
ICT to the solution of academic problems. Clarke and Englebright (2003:56) state that “the key
skill on ICT is based on user being able to find, explore, develop, and present information in the
form of text, images and numbers.” This is in line with the idea of many educational
technologists that emphasis should not be on mere knowledge of technical skills. However,
knowledge of ICT skills is the foundation for the development of ICT competencies.
Consequently, from knowledge of skills, the academic staff are expected to progress to that of
how, where, when and why each skill should be used.
Another finding of this study is that the academic staffs need to develop competencies not
only in selecting, developing, monitoring and evaluating ICT instruction but also in developing
and maintaining educational website. This is to make it possible for learners to interact with the
learning content anytime and anywhere. The need for the academic staff to develop
competencies in the instructional integration of ICT in their areas across the curriculum is to
ensure that ICT based education promotes the integration of diverse subject areas. This type of
ICT based education offers opportunities for spiritual, moral, social and cultural development of
pupils. It is quite interesting that all the respondents overwhelmingly agree that teachers need to
develop competencies in using ICT as an instructive tool in the class as well as in developing
learner’s ICT capability. Using ICT as a instructive tool implies using it to establish dynamic and
powerful instructional strategies and environment. Developing learner’s ICT capability is an
important aspect of instructional competencies and it requires that learners be helped to
understand the potentials of ICT and to have confidence and desire to use ICT. Educators with
instructional competencies are far more in demonstrating confidence in making meaningful use
of ICT than those who are not. Williams, Wilson, Richardson, Tuson, and Cole (1998:2) affirm
that such educators “have the capacity not only to enhance the richness of the learning
experience but also encourage the development of information literacy in their own students.”
Conclusion and Recommendations
In conclusion, the review of previous TAM research points out that there is a need to
focus on more diverse populations, various technology applications, and various settings
regarding new technology acceptance. This paper revised version of the Technology Acceptance
Model to understand academic staff usage behaviour of ICT tools. The result of the study
indicates a significant relationship between availability, perceived usefulness, ease of use, and
intention to use, while, anxiety and attitude mediated the relationship. The study concludes that
Page 24
BERA Conferences, 2012
George Kenyon Hall, University Hall Place
University of Manchester
24 Wednesday 5th September 2012
http://beraconference.co.uk/abstracts/
technophobia has been one of the major problem hindering academic staff to effectively use ICT
for teaching and learning process
It is obvious that in this era of ICT, Nigeria as a nation will find it very difficult to cross
the digital divide if concerted effort is not made to promote and continue to enhance ICT
education. One of the strategies to be adopted in this regard is the production of academic staffs
that have developed competencies for the instructional use of ICT. Academic staffs who do not
possess these competencies cannot impart same onto the learners. Nonetheless, to ensure the
development of academic staff ICT competencies the following recommendations are made:
1. More funds and allocation toward ICT in schools
2. ICT policy to make compulsory course for all lecturers
3. Lecturers should be helped empowered on competent in and receptive to ICT
4. ICT facilities be made available in all universities for easy access
5. The Federal Government should intensify the ICT development
6. ICT competencies set as a priority and targets be set for all long serving lecturers
7. Newly employed lecturer are expected to become ICT-literate as mandatory
8. It should ensure ICT integration into education across the curriculum in the country
9. NGO, Philanthropist individuals and Private companies needs to get involve in ICT
10. Future Research
This paper has contributed to the original TAM model by incorporating the conceptual
findings of previous TAM research, by successfully introducing the concept of availability,
anxiety and attitude. Thus, this work is subject to a number of limitations. We have investigated
only academic staff of universities in Northern Nigeria; this scope can be extended to cover other
categories of staff and to cover the whole country. There is obvious bias in the sample, because
we considered Kriejcy and Morgan’s (1970) sample size; this increases the possibilities of
measurement error. Finally, the constructs were restricted only to availability, usefulness, ease of
use, anxiety, attitude, intention and acceptance to use. The study also examines only gender,
designation, specialization and institution as demography variable. Researchers are therefore
encouraged to pursue on these limitations.
Acknowledgement: we are highly indebted to TEDfund Abuja Nigeria for their contribution and
sponsorship to this conference. Our sincere appreciations go to the respondents (some academic
staff of universities in Northern Nigeria).
References
Ajzen, I. (1991). The theory of planned behavior. Organizational Behavior and Human Decision
Processes, 50(2), 179-211.
Bandura, A. (1982). Self-efficacy mechanism in human agency. American Psychologist, 37(2),
122–147.
Bandura, A. (1997). Self-efficacy: The exercise of control. New York: W. H. Freeman.
Page 25
BERA Conferences, 2012
George Kenyon Hall, University Hall Place
University of Manchester
25 Wednesday 5th September 2012
http://beraconference.co.uk/abstracts/
Bozionelos, N. (2001). Computer anxiety: Relationship with computer experience and
prevalence. Computers in Human Behavior, 17(2), 213–224
Clarke, Alan and Englebright, Lisa (2003). ICT: The new basic skill, Oxford: NIACE.
Davis, F. D. (1989). Perceived usefulness, perceived ease of use and user acceptance of
information technology. MIS Quarterly, 13(3), 319–340.
Davis, F. D. (1993). User acceptance of information technology: System characteristics, user
perceptions and behavioral impacts. International Journal of Man–Machine Studies,
38(3), 475–487.
Davis, F. D., Bagozzi, R. P., & Warshaw, P. R. (1989). User acceptance of computer technology:
A comparison of two theoretical models. Management Science, 35(8), 982–1003.
Fishbein, M., & Azjen, I. (1975). Belief, attitude, intention and behavior: An introduction to
theory and research. Reading, MA: Addison-Wesley.
Freedman, Terry (1999). Managing ICT, England: Hodder & Stoughton.
Hakkarainen, K., Muukkonen, H., Lipponen, L., Iloma¨ki, L., Rahikainen, M., & Lehtinen, E.
(2001). Teachers’ skills and practices of using ICT and their pedagogical thinking.
Journal of Technology and Teacher Education, 9, 181–197.
http://www.ets.org/research/pic/technolog.html
Iloanusi, N. O. and Osuagwu C. C. (2010). ICT in Education: Achievements so far in Nigeria.
Kozma, R. B. (2000). The relationship between technology and design in educational
Research, Reflections and Innovations in Integrating ICT in Education
Krejcie, R. V. & Morgan, D. W., (1970). in getCited, (2008). Retrieved from
http://www.getcited.org/pub/103368600
Likert, R. (1932). A technique for the measurement of attitudes. Archives of
Management Systems on Student and Faculty Outcomes. Presented at the 2010 DePaul
Faculty Teaching and Learning Conference. Retrieved from
www.depaul.edu/~jmoore/d2lstudy-dtl
Masrom M. (2007). Technology Acceptance Model and E-learning. A paper presented at the
12th International Conference on Education, Sultan Hassanal Bolkiah Institute of
Education Universiti Brunei Darussalam 21-24 May 2007
Okon E. A., Chika U. and Emmanuel U. A., (2007). Bridging the digital divide in
Nigeria: a study of internet use in Calabar Metropolis, Nigeria. Library Management Vol.
28 No. 6/7, pp. 355-365. Retrieved from Emerald database.
http://www.scribd.com/doc/18499389/
Olaniyi S. S., (2006). e-Learning Technology: The Nigeria Experience. A paper at Shape the
Change XXIII FIG Congress. Munich Germany, October 8-13, 2006
Psychology, 27(140), 44–55.
Page 26
BERA Conferences, 2012
George Kenyon Hall, University Hall Place
University of Manchester
26 Wednesday 5th September 2012
http://beraconference.co.uk/abstracts/
Rezaei, M., Mohammadi, H. M., Asadi, A., & Kalantary, K. (2008). Predicting e-learning
application in agricultural higher education using technology acceptance model. Turkish
Online Journal of Distance Education, 98(1), 85–95.
Robert Gordon University.
Rubin B., Fernandes R.., Avgerinou M. D., and Moore J. (2010). The effect of learning
management systems on student and faculty outcomes. Internet and Higher Education 13
(2010) 82–83 from ScienceDirect
Rubin B., Fernandes,R. Avgerinou M., and Moore J., (2010). Effect of Learning
Siegel, D. M. (2008). Accepting technology and overcoming resistance to change using the
motivation and acceptance model. Unpublished doctoral dissertation, University of
Central Florida, Orlando.
Singapore. Interactive Learning Environments, 14(1), 17–24.
skills and knowledge needs: Report on a study conducted for SOEID. Aberdeen: The
Suleiman A. A. (2009). Bridging the Digital Divide with OLPC XO: The Actualization of
Digital Society or a Digital Hegemony? (International conference on education for all
(ICEFA 2009 proceeding) at University Malaya Malaysia pp179-191
Suleiman A. A. (2011). Essentialities for e-learning: the Nigerian tertiary institutions in question.
Academic Research International. Volume 1, Issue 2, 2011
Sun, H., & Zhang, P. (2006). The role of moderating factors in user technology acceptance.
International Journal of Human-Computer Studies, 64(2), 53-78.
Teo, T. (2008). Attitudes toward computers: A study of post-secondary students in technology
research and development: A reply to Richey. Educational Technology Research and
Development, 48(1), 19-22.
Thomas, R. M. (2001). Computer technology: An example of decision-making in technology
transfer. In R. M. Thomas & V. N. Kobayashi (Eds.), Educational technology: its
creation, development and cross-cultural transfer, Oxford: Pergamon Press, 25-34.
Thompson, R., Compeau, D., & Higgins, C. (2006). Intentions to use information technologies:
An integrative model. Journal of Organizational and End User Computing, 18(3), 25-47.
Tung, F., & Chang S. (2007) Exploring adolescents’ intentions regarding the online learning
courses in Taiwan. CyberPsychology & Behavior, 10(5), 729–731.
Venkatesh, V., Davis, F. D., & Morris, M. G. (2007). Dead or alive? The development, trajectory
and future of technology adoption research. Journal of the Association for Information
Systems, 8(4), 267–286.
Venkatesh, V., Morris, M. G., Davis, G. B., & Davis, F. D. (2003). User acceptance of
information technology: Toward a unified view. MIS Quarterly, 27(3), 425–478.
Vygotsky, L. S. (1962). Thought and language. Cambridge, MA: MIT Press.
Wenglinsky, H. (1998). Does it compute? The relationship between educational technology and
student achievement in mathematics [policy information report]. Princeton, NJ:
Educational Testing Service.
Williams, D.; Wilson, K.; Richardson, A.; Tuson, J.; & Coles, L. (1998). Teachers’ ICT
Page 27
BERA Conferences, 2012
George Kenyon Hall, University Hall Place
University of Manchester
27 Wednesday 5th September 2012
http://beraconference.co.uk/abstracts/
Apendix1
The scale on section B is as follows:
(1=strongly agree 2=Agree 3=No Decision 4=Disagree 5=Strongly Disagree)
Section A
Gender: Male Female
Designation Lecturer 3-1 Senior Reader/Professor
Specialization _________________________________________________________________
Institution _________________________________________________________________
Section B
SN Dimensions SA A ND D SD
Availability 1 2 3 4 5
1 There is a befitting ICT center in the University
2 Staff has adequate access to ICT centre
3 ICT facilities and Internet are available for utilization in the
University to every academic staff
4 I owned my personal computer
5 I owned other ICT tools such as iPad, Smart phones, PDA,
Projector
Usefulness
1 Using the ICT tools would enable me to accomplish tasks more
quickly
2 Using the ICT tools would improve my job performance
3 Using the ICT tools would improve my productivity
4 Using the ICT tools would enhance my effectiveness on the job
5 Using the ICT tools would make it easier to do things
Ease of use
1 Use ICT tools for teaching and learning
2 Use of different instructional software packages
3 Use of different operating systems (Windows and Androids)
4 Use of e-mail and other internet resources
Page 28
BERA Conferences, 2012
George Kenyon Hall, University Hall Place
University of Manchester
28 Wednesday 5th September 2012
http://beraconference.co.uk/abstracts/
5 Using ICT skills in presenting information (Teaching)
Intention
1 I intend continued use of the ICT tools in the future
2 I believe it is worthwhile to use the ICT tools
3 I will use the ICT tools in the next few months
4 It is necessary to use the ICT tools in the future
5 I intend to collaborate with others to use ICT tools
Anxiety
1 I am afraid of using ICT technology
2 Using ICT tools is difficult to non technologist
3 I hate anything technology in my service
4 I don’t want to use ICT technology
5 ICT tools are very expensive
Attitude toward technology
1 I like using ICT tools
2 I want to participate in online discussion
3 I enjoy using ICT tools
4 I encourage others to use ICT tools
5 I can support any ICT incline activity
Acceptance
1 Integrate ICT in other discipline across the curriculum
2 Identifying and using available hardware
3 Solve common ICT problems relating to instruction
4 Prepare ICT-based learning materials
5 Use ICT for teaching and learning
This document was added to the Education-line collection on 5 September 2012


![[Amnesty] Who inspires you?](https://static.documents.pub/doc/80x56/577d21691a28ab4e1e952ed0/amnesty-who-inspires-you.jpg)


