Page 1
Ted Schroeder
Agricultural Economist
Kansas State University
Montana Livestock Forum and Nutrition Conference
Bozeman, MT – April 21, 2009
Build Consumer Beef Demand:Build Consumer Beef Demand:Prescription for ProsperityPrescription for Prosperity
www.NAIBER.org
Page 2
Ted’s ThesisTed’s Thesis
Prosperity of cattle & beef industry is driven by consumer demand
All new $ that flow into your industry originate from consumers
Page 3
Ted’s ThesisTed’s Thesis
Prosperity of cattle & beef industry is driven by consumer demand
All new $ that flow into your industry originate from consumers
Yet, we continuously make policy, production, and marketing decisions that fail to appreciate this well documented fact!
Page 4
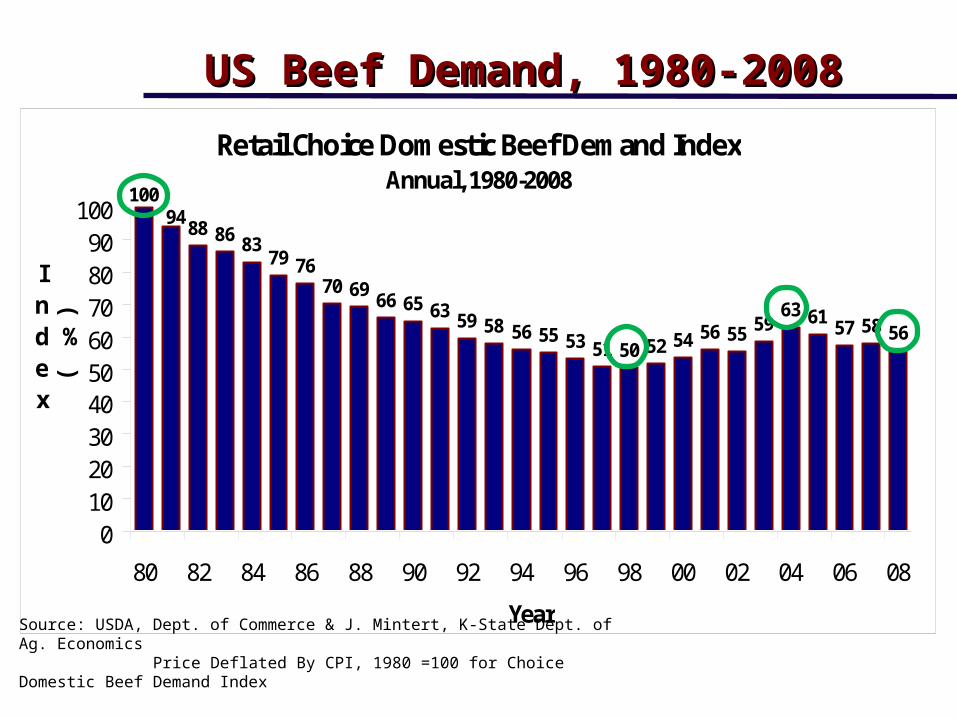
Retail Choice Domestic Beef Demand IndexAnnual, 1980-2008
88 86 8379 76
70 69 66 65 63 59 58 56 55 53 51 50 52 54 56 55 5963 61 57 58 56
94100
0102030405060708090100
80 82 84 86 88 90 92 94 96 98 00 02 04 06 08
Year
Index
(
%
)
Source: USDA, Dept. of Commerce & J. Mintert, K-State Dept. of Ag. Economics Price Deflated By CPI, 1980 =100 for Choice Domestic Beef Demand Index
US Beef Demand, 1980-2008US Beef Demand, 1980-2008
Page 5
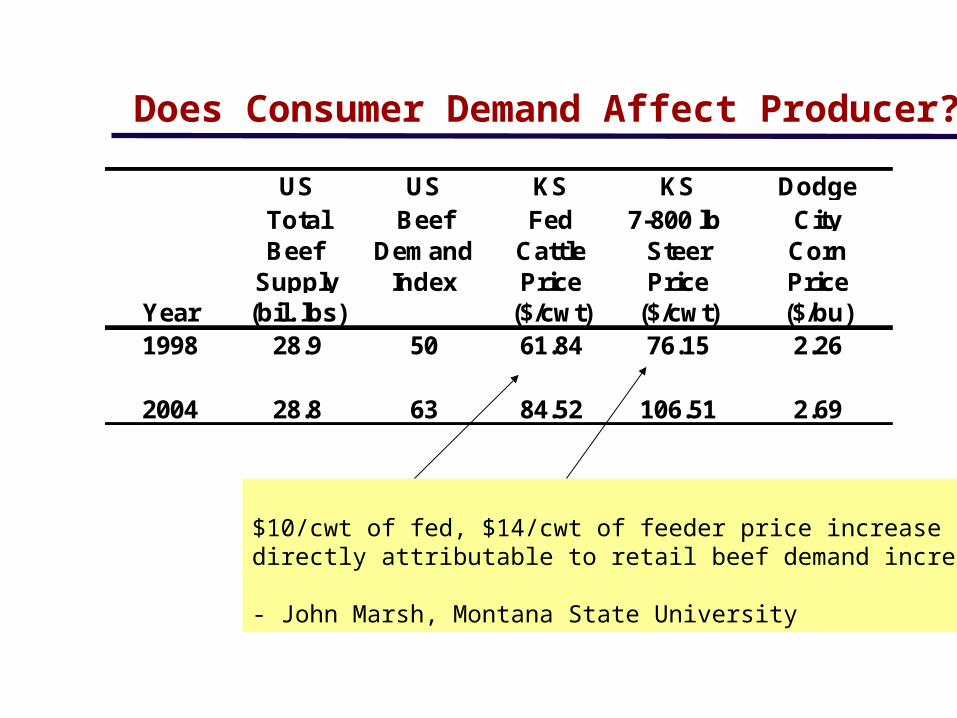
US US KS KS DodgeTotal Beef Fed 7-800 lb CityBeef Demand Cattle Steer Corn
Supply Index Price Price PriceYear (bil. lbs) ($/cwt) ($/cwt) ($/bu)1998 28.9 50 61.84 76.15 2.26
2004 28.8 63 84.52 106.51 2.69
Does Consumer Demand Affect Producer?
$10/cwt of fed, $14/cwt of feeder price increase directly attributable to retail beef demand increase
- John Marsh, Montana State University
Page 6
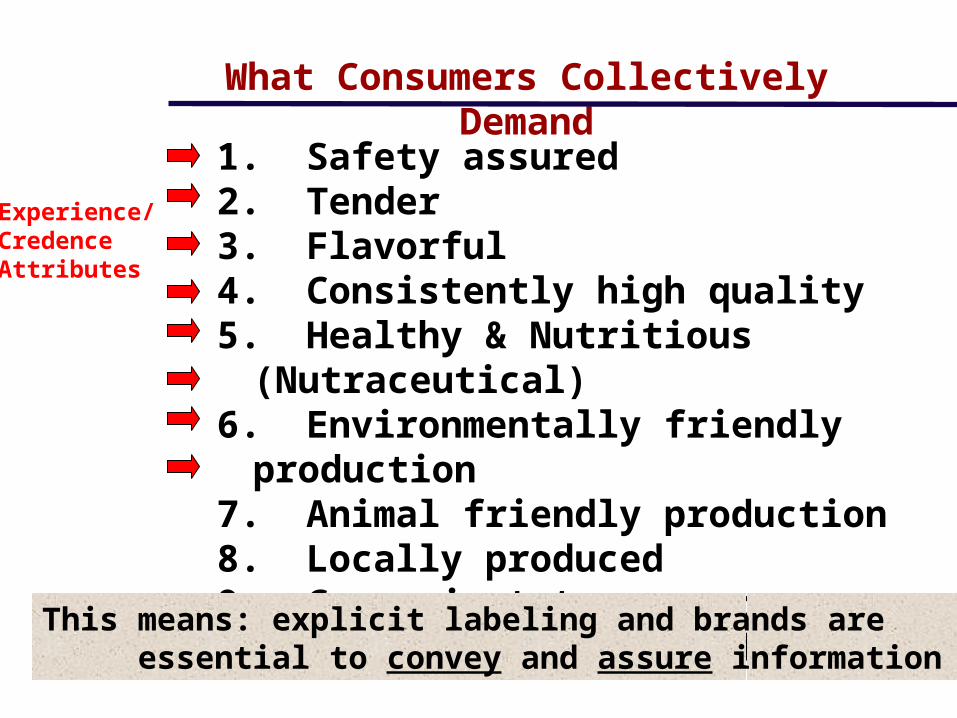
1. Safety assured2. Tender3. Flavorful4. Consistently high quality5. Healthy & Nutritious (Nutraceutical)6. Environmentally friendly production7. Animal friendly production8. Locally produced 9. Convenient to prepare10. Competitively priced
What Consumers Collectively Demand
Experience/CredenceAttributes
This means: explicit labeling and brands are essential to convey and assure information
Page 7
Economy and Beef DemandEconomy and Beef Demand
Page 8
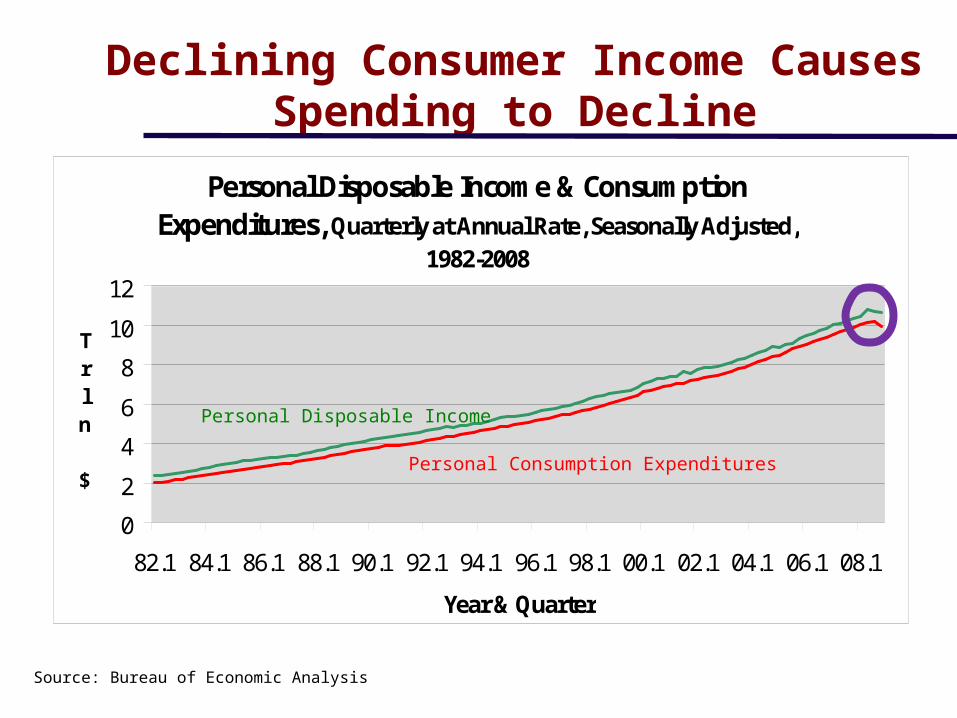
Personal Disposable Income & Consumption Expenditures, Quarterly at Annual Rate, Seasonally Adjusted,
1982-2008
0
2
4
6
8
10
12
82.1 84.1 86.1 88.1 90.1 92.1 94.1 96.1 98.1 00.1 02.1 04.1 06.1 08.1
Year & Quarter
Trln $
Declining Consumer Income Causes Spending to Decline
Source: Bureau of Economic Analysis
Personal Consumption Expenditures
Personal Disposable Income
Page 9
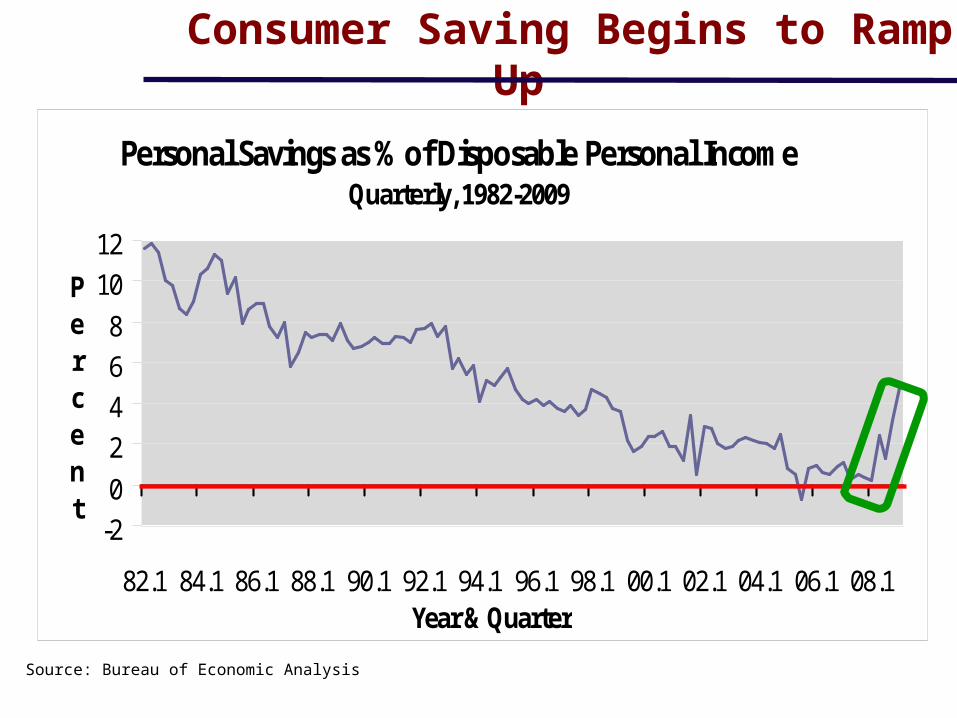
Consumer Saving Begins to Ramp Up
Personal Savings as % of Disposable Personal IncomeQuarterly, 1982-2009
-2024681012
82.1 84.1 86.1 88.1 90.1 92.1 94.1 96.1 98.1 00.1 02.1 04.1 06.1 08.1Year & Quarter
Percent
Source: Bureau of Economic Analysis
Page 10
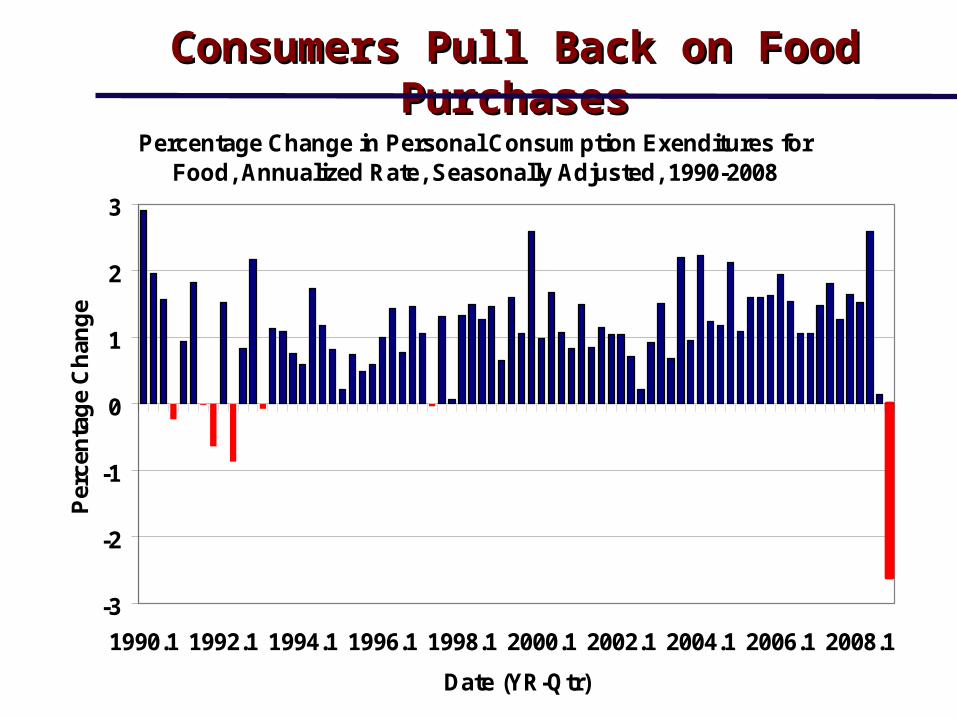
Consumers Pull Back on Food PurchasesConsumers Pull Back on Food Purchases
Percentage Change in Personal Consumption Exenditures for Food, Annualized Rate, Seasonally Adjusted, 1990-2008
-3
-2
-1
0
1
2
3
1990.1 1992.1 1994.1 1996.1 1998.1 2000.1 2002.1 2004.1 2006.1 2008.1
Date (YR-Qtr)
Per
cen
tag
e C
han
ge
Page 11
Consumers Are Trading DownConsumers Are Trading Down
Whole Foods
Weekly Value of $10,000 Invested on Jan 2, 2008 in Selected Food Companies, Jan. 2008 - April 2009
$0
$2,000
$4,000
$6,000
$8,000
$10,000
$12,000
1/2/2008 4/2/2008 7/2/2008 10/2/2008 1/2/2009 4/2/2009
Date
Va
lue
of
$10
,000
In
vest
ed
McDonalds
Dow Jones Industrial
Whole Foods
Ruth's Hospitality
Page 12
Food Safety, Health, Nutrition,Food Safety, Health, Nutrition,Product Development, & QualityProduct Development, & Quality
Page 13
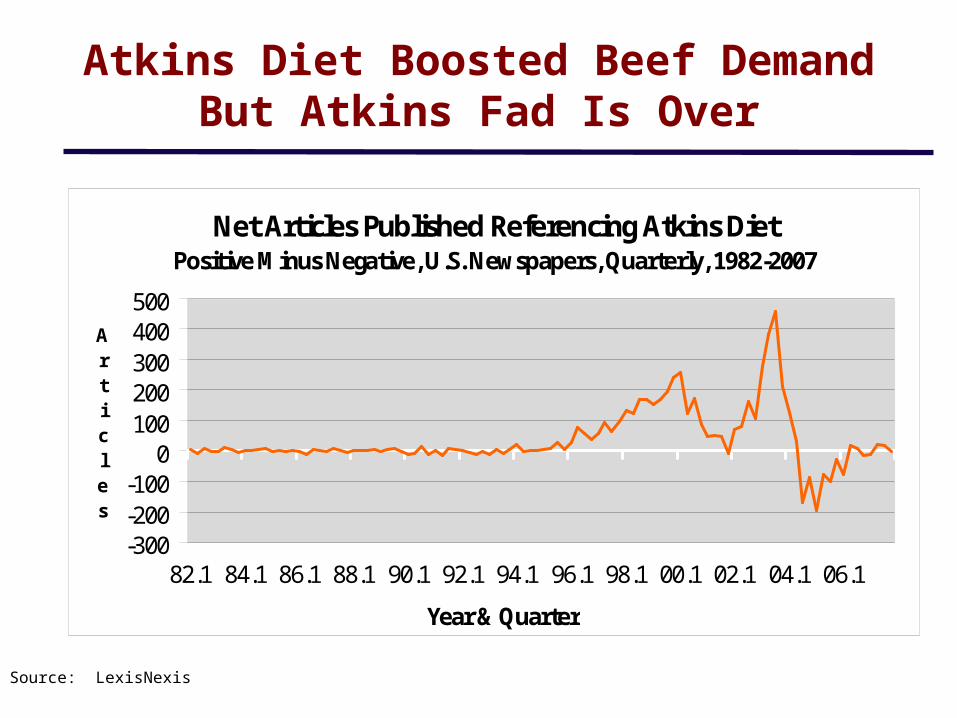
Atkins Diet Boosted Beef DemandBut Atkins Fad Is Over
Net Articles Published Referencing Atkins DietPositive Minus Negative, U.S. Newspapers, Quarterly, 1982-2007
-300-200-100
0100200300400500
82.1 84.1 86.1 88.1 90.1 92.1 94.1 96.1 98.1 00.1 02.1 04.1 06.1
Year & Quarter
Articles
Source: LexisNexis
Page 14
Medical Journal Info. on Heart DiseasePeaked, Still Having a Negative Effect
Articles Published Referencing Heart Disease & DietMedical Journals, Quarterly, 1982-2007
0
20
40
60
80
100
82.1 84.1 86.1 88.1 90.1 92.1 94.1 96.1 98.1 00.1 02.1 04.1 06.1
Year & Quarter
Articles
Source: Medline
1982-2004 contributed a 9% drop in beef demand
Page 15
Medical Journal Information
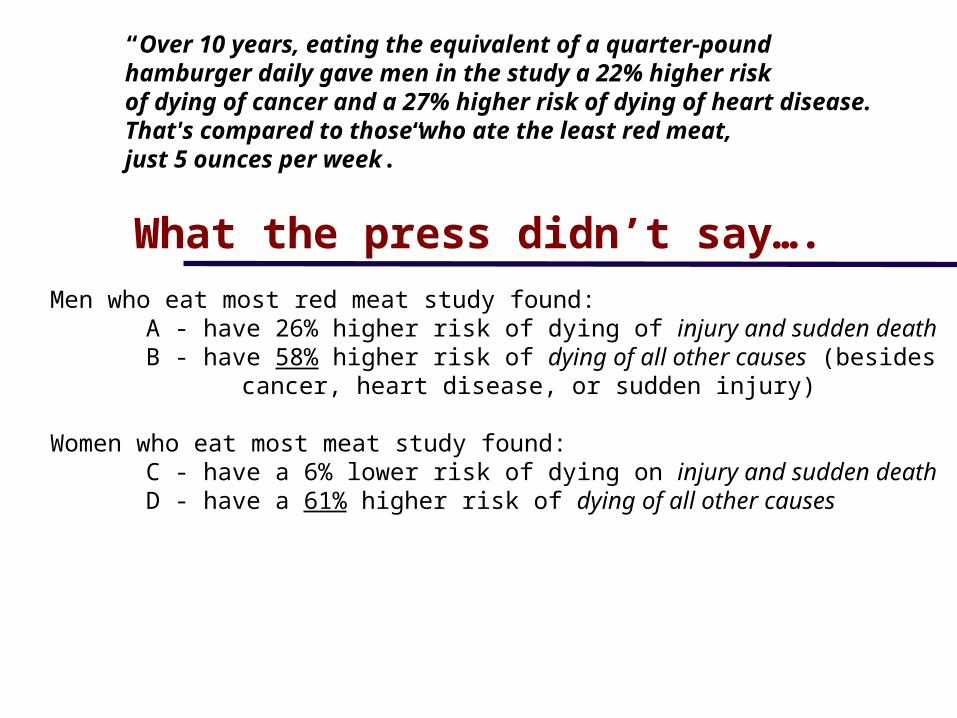
“Over 10 years, eating the equivalent of a quarter-pound hamburger daily gave men in the study a 22% higher risk of dying of cancer and a 27% higher risk of dying of heart disease. That's compared to those who ate the least red meat, just 5 ounces per week.”
Source: Sinha, et al. Arch. Intern. Medicine, March 2009
Page 16
What the press didn’t say….
Men who eat most red meat study found:A - have 26% higher risk of dying of injury and sudden deathB - have 58% higher risk of dying of all other causes (besides
cancer, heart disease, or sudden injury)
Women who eat most meat study found:C - have a 6% lower risk of dying on injury and sudden deathD - have a 61% higher risk of dying of all other causes
“Over 10 years, eating the equivalent of a quarter-pound hamburger daily gave men in the study a 22% higher risk of dying of cancer and a 27% higher risk of dying of heart disease. That's compared to those who ate the least red meat, just 5 ounces per week.”
Page 17
Beef Food Safety RecallsClass I & II Recalls, Quarterly, 1982-2007
0
3
6
9
12
15
18
82.1 84.1 86.1 88.1 90.1 92.1 94.1 96.1 98.1 00.1 02.1 04.1 06.1
Year & Quarter
Recalls
Increase in recalls during 2007 resulted In a 2.6% decline in beef demand
Beef Recall ProblemsBeef Recall Problems
Source: U.S. Food Safety Inspection Service
Page 18
Food Consumed Away from Home Growth Food Consumed Away from Home Growth Benefitted Poultry and Hurt Beef DemandBenefitted Poultry and Hurt Beef Demand
Percentage of Food Consumed Away From HomeQuarterly, 1982-2007
40%
42%
44%
46%
48%
82.1 84.1 86.1 88.1 90.1 92.1 94.1 96.1 98.1 00.1 02.1 04.1 06.1
Year & Quarter
Source: U.S. Department of Commerce
Page 20
Retail Beef Strip Loin Prices, April 2008
Price ($/lb) Store Description$4.99 Albertson's, Denver, CO Albertson's Supreme Beef$7.84 Wal-Mart, Manhattan, KS Wal-Mart Brand$7.99 HyVee, Lincoln, NE HyVee Blue Ribbon - Hormel
$10.99 Dillons, Manhattan, KS USDA Choice$12.99 Whole Foods, Overland Park, KS Certified Organic$14.99 City Market, Avon, CO Laura's Lean Beef$19.99 Cetak's Gourmet Meats, Lincoln, NE Cetak's & Certified Angus Beef$85.00 Dean & Deluca, Leawood, KS Japan Akaushi Wagyu
Data collected by Kelsey Fraiser
Is a Steak a Steak?
Page 21
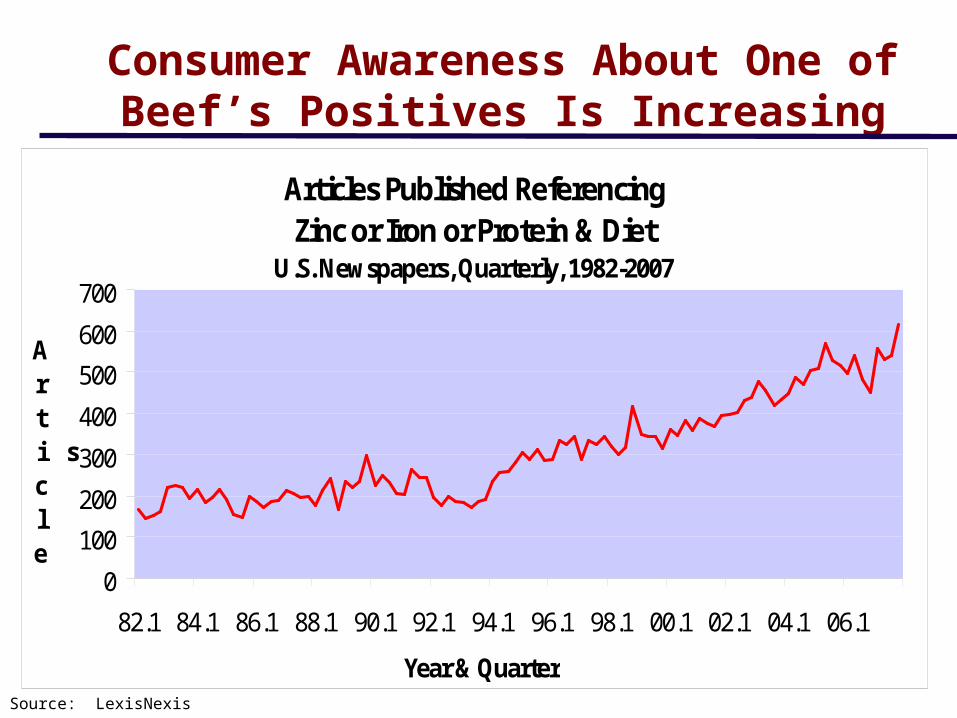
Consumer Awareness About One of Beef’s Positives Is Increasing
Articles Published Referencing Zinc or Iron or Protein & Diet
U.S. Newspapers, Quarterly, 1982-2007
0
100
200
300
400
500
600
700
82.1 84.1 86.1 88.1 90.1 92.1 94.1 96.1 98.1 00.1 02.1 04.1 06.1
Year & Quarter
Article
s
Source: LexisNexis
Page 22
Can Exports Save US?Can Exports Save US?
Page 23
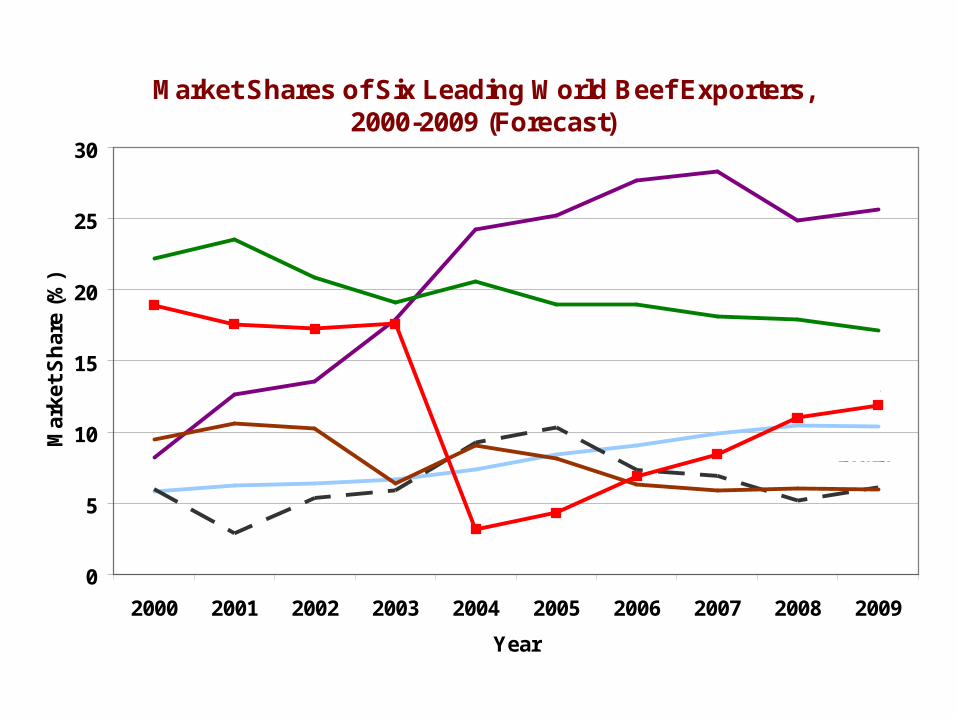
Market Shares of Six Leading World Beef Exporters, 2000-2009 (Forecast)
0
5
10
15
20
25
30
2000 2001 2002 2003 2004 2005 2006 2007 2008 2009
Year
Mar
ket
Sh
are
(%)
BRAZIL
AUSTRALIA
U.S.
Argentina
Source: Foreign Ag Service, USDA
India
Canada
Page 24
Brazil Beef Production GrowthBrazil Beef Production Growth
Beef Production by Four Largest Countries, 2000-2009 (Forecast)
0
2,000
4,000
6,000
8,000
10,000
12,000
14,000
2000 2001 2002 2003 2004 2005 2006 2007 2008 2009
Year
1,0
00 M
etri
c T
on
s C
arc
ass
Wei
gh
t
BRAZIL
US
Source: Foreign Ag Service, USDA
China
4.2% Avg.Annual Growth
EU 27
Page 25
Rodrigo Miranda Vieira
WELL EDUCATED, YOUNGEAGER, ENERGETIC, & CONFIDENT
Our global competition is:Our global competition is:
Page 26
Looking ForwardLooking Forward Weak U.S. economy hurting beef demandWeak U.S. economy hurting beef demand Product quality & BQA remain importantProduct quality & BQA remain important Food safety problems reducing beef demandFood safety problems reducing beef demand Consumers respond to positive nutritional information Consumers respond to positive nutritional information
needs to be exploitedneeds to be exploited Convenience is importantConvenience is important
Lack of new products holding back beef demandLack of new products holding back beef demandAt home & at HRI levelAt home & at HRI level
Export Market is potential major growth area, Export Market is potential major growth area,
but we gotta get after it!but we gotta get after it!
Page 27
Ted’s ThesisTed’s Thesis
Prosperity of cattle & beef industry is driven by consumer demand
All new $ that flow into your industry originate from consumers
Yet, we continuously make policy, production, and marketing decisions that fail to appreciate this well documented fact!
Page 29
Top Five World Pork Exporters, 2000-2009 (Forecast)
0
5
10
15
20
25
30
35
40
45
50
2000 2001 2002 2003 2004 2005 2006 2007 2008 2009
Year
Exp
ort
Mar
ket
Sh
are
(%) U.S.
EU - 27
Canada
Brazil
China
Source: Foreign Ag Service, USDA
Page 30
Top Three World Poultry (Broiler + Turkey) Exporters, 2000-2009 (Forecast)
0
5
10
15
20
25
30
35
40
45
50
2000 2001 2002 2003 2004 2005 2006 2007 2008 2009
Year
Exp
ort
Mar
ket
Sh
are
(%)
U.S.
Brazil
EU - 27
Source: Foreign Ag Service, USDA
Page 32
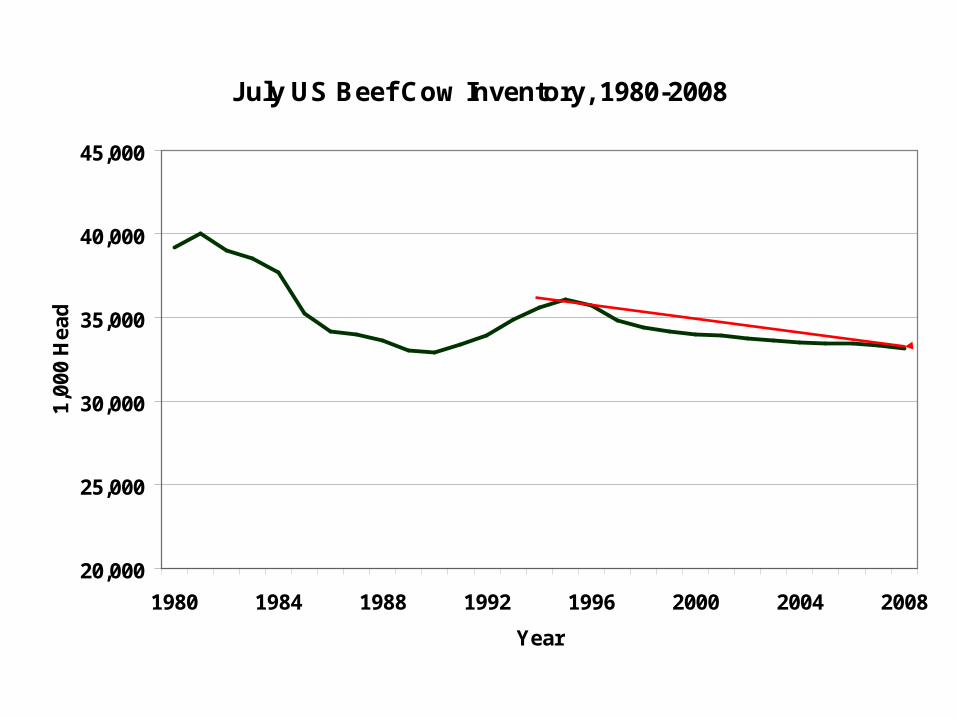
July US Beef Cow Inventory, 1980-2008
20,000
25,000
30,000
35,000
40,000
45,000
1980 1984 1988 1992 1996 2000 2004 2008
Year
1,00
0 H
ead
8% reductionsince 1995
36.1 mln
33.15 mln
Page 33
Number of Operations with Beef Cows, 1986-2007
600,000
650,000
700,000
750,000
800,000
850,000
900,000
950,000
1,000,000
1,050,000
1986 1988 1990 1992 1994 1996 1998 2000 2002 2004 2006
Year
Op
erat
ion
s
25% decline
Page 34
Markets at each stagesupposed to coordinate but system failed
- highly varied product- little price-quality distinction - no incentives to improve
Page 35
1. Safety assured2. Tender3. Flavorful4. Consistently high quality5. Healthy & Nutritious (Nutraceutical)6. Environmentally friendly production7. Animal friendly production8. Locally produced 9. Convenient to prepare10. Competitively priced
What Consumers Collectively Demand
Experience/CredenceAttributes
This means: explicit labeling and brands are essential to convey and assure information
Page 36
SAFE?U.S. beef industry lost $3.2 to $4.7 billion in 2004 alone because of lost exports (Coffey et al., 2005)
Page 37
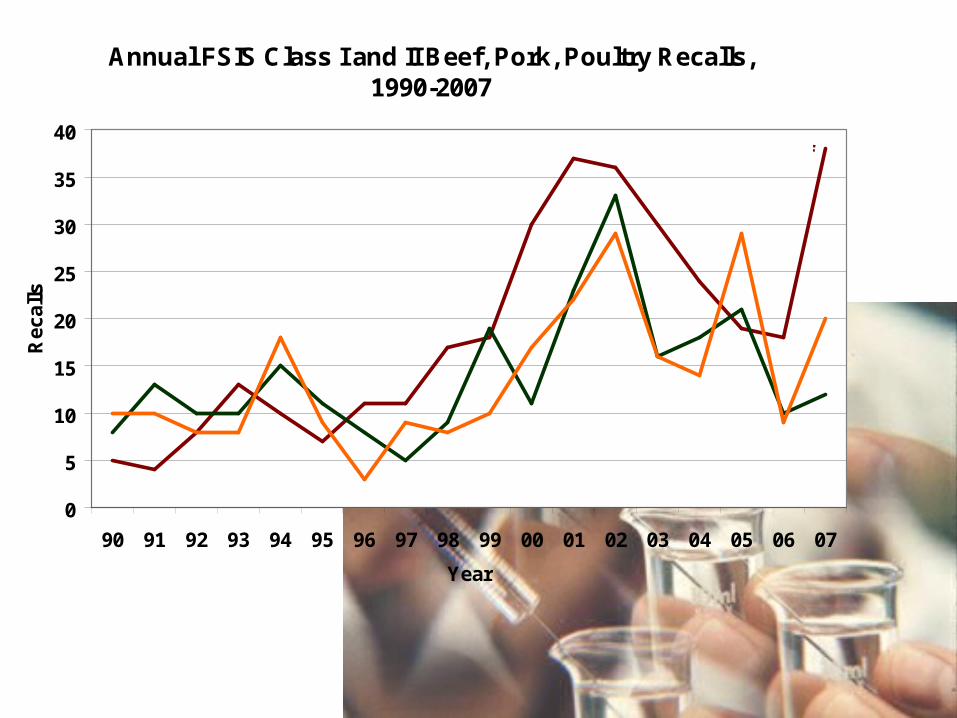
Annual FSIS Class I and II Beef, Pork, Poultry Recalls, 1990-2007
0
5
10
15
20
25
30
35
40
90 91 92 93 94 95 96 97 98 99 00 01 02 03 04 05 06 07
Year
Rec
alls
Beef
Pork
Poultry
Page 38
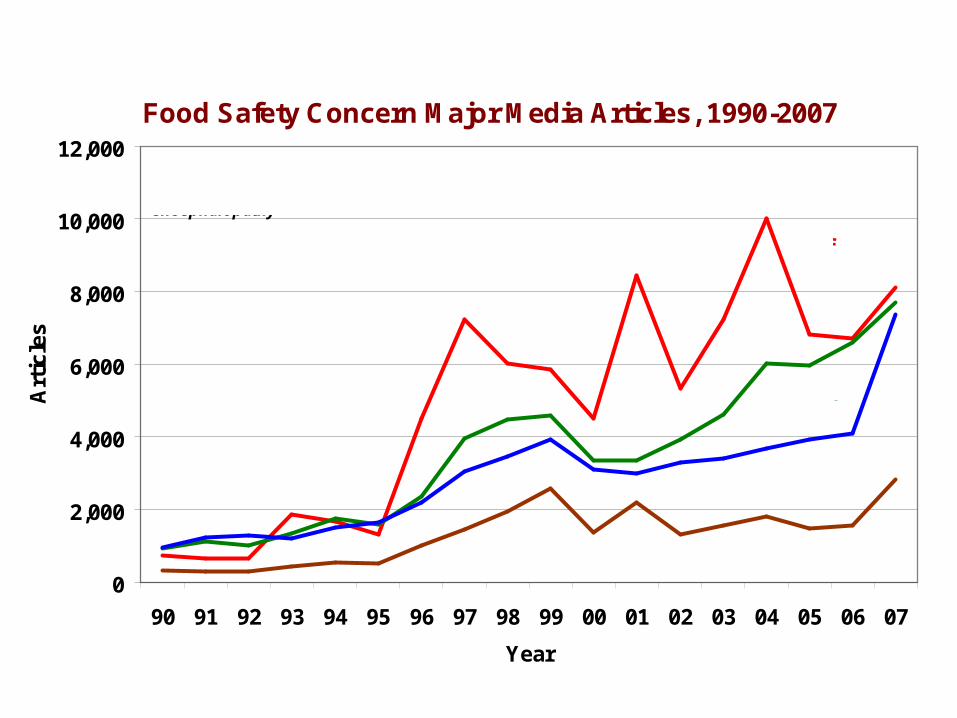
Food Safety Concern Major Media Articles, 1990-2007
0
2,000
4,000
6,000
8,000
10,000
12,000
90 91 92 93 94 95 96 97 98 99 00 01 02 03 04 05 06 07
Year
Art
icle
s
"food safety or contamination or (product recall) or outbreak or salmonella or listeria or e. coli or trichinae or campylobacter or staphylococcus or foodborne or bse or (mad cow) or encephalopathy"
Beef
Pork
Fish/Seafood
Poultry
Page 39
Percentage of Consumers that have Reduced Consumption of Beef Last Five Years Citing Food Safety Concerns
19.6 20.6
31.2
55
0
20
40
60
80
100
Canada US Mexico Japan
Respondent Country
Per
cen
tag
e o
f R
esp
on
den
ts
Survey of 1,000 US, Canadian, Mexican, & Japanese Consumers, 2006
Page 40
Respondent Country
Country of Origin CANADA US JAPAN MEXICO
Unknown 14% 11% 3% 18%
Australia 58% 46% 70% 31%
Brazil 35% 29% 18% 26%
Canada 92% 52% 31% 42%
Japan 43% 36% 85% 30%
Mexico 21% 17% 13% 66%
United States 70% 82% 8% 46%
Percentage of Respondents Indicating Beef from Various Percentage of Respondents Indicating Beef from Various Origins is “somewhat” or “very” safe foodOrigins is “somewhat” or “very” safe food
Page 41
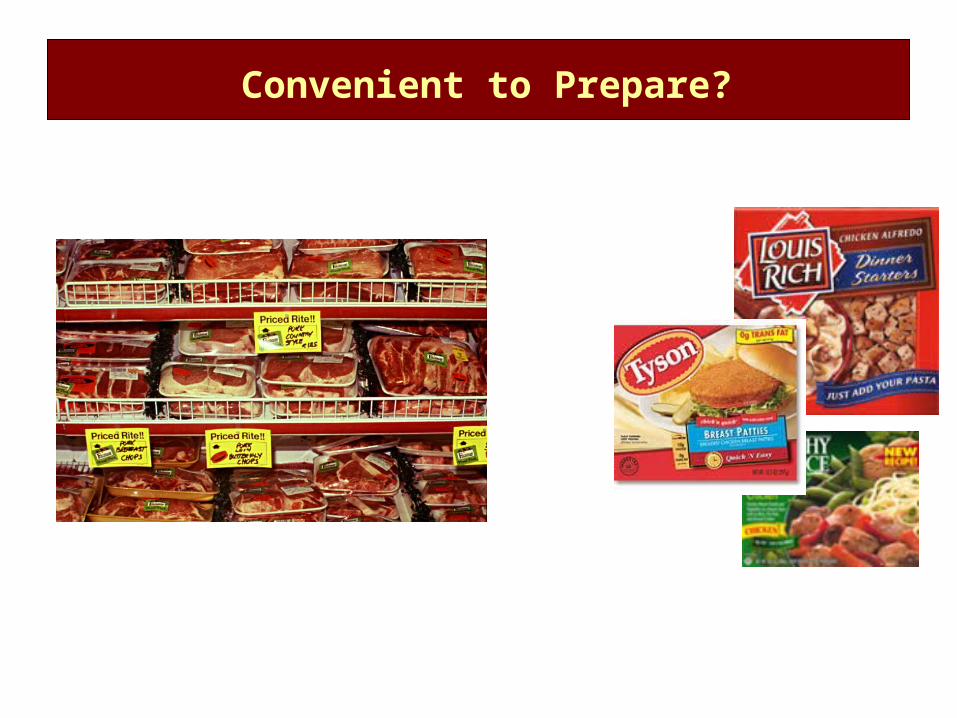
Convenient to Prepare?
Page 42
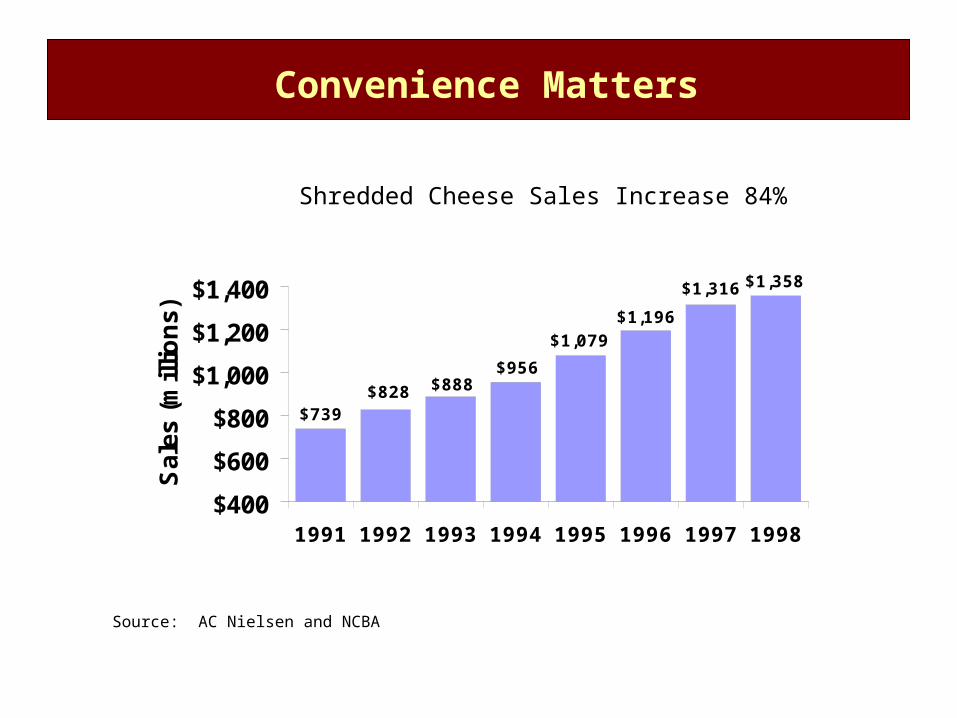
Convenience Matters
Shredded Cheese Sales Increase 84%
Source: AC Nielsen and NCBA
$739$828 $888
$956
$1,079$1,196
$1,316 $1,358
$400
$600
$800
$1,000
$1,200
$1,400
1991 1992 1993 1994 1995 1996 1997 1998
Sa
les
(m
illi
on
s)
Page 43
$106 $168$312
$577
$889
$1,100
$91$82
$0
$200
$400
$600
$800
$1,000
$1,200
1989 1990 1991 1992 1993 1994 1995 1996
Mill
ion
s
Bagged Lettuce Sales: Convenience
Convenience Matters
Source: AC Nielsen and NCBA
Page 44
1. Fresh Branded Case-Ready Products
Page 45
2. Meal Packages
Single dish quick fix meal consumer expenditures expanded 83% in 2001 to $141 million – AC Nielsen
472 beef products introduced in 2001Compared to 70 in 1997 - NCBA
Page 46
3. Food Service
Food service continuesto grow
Diversity of product needs
Quality control in volume are critical
Contracts
Page 47
What do they require?
Product integrity – quality, consistency
High level of accountability of input supplier
Product safety assurances – mega responsibility/risk
Production practice assurances (including location?)
Traceability
Consistent continuous supply
Page 48
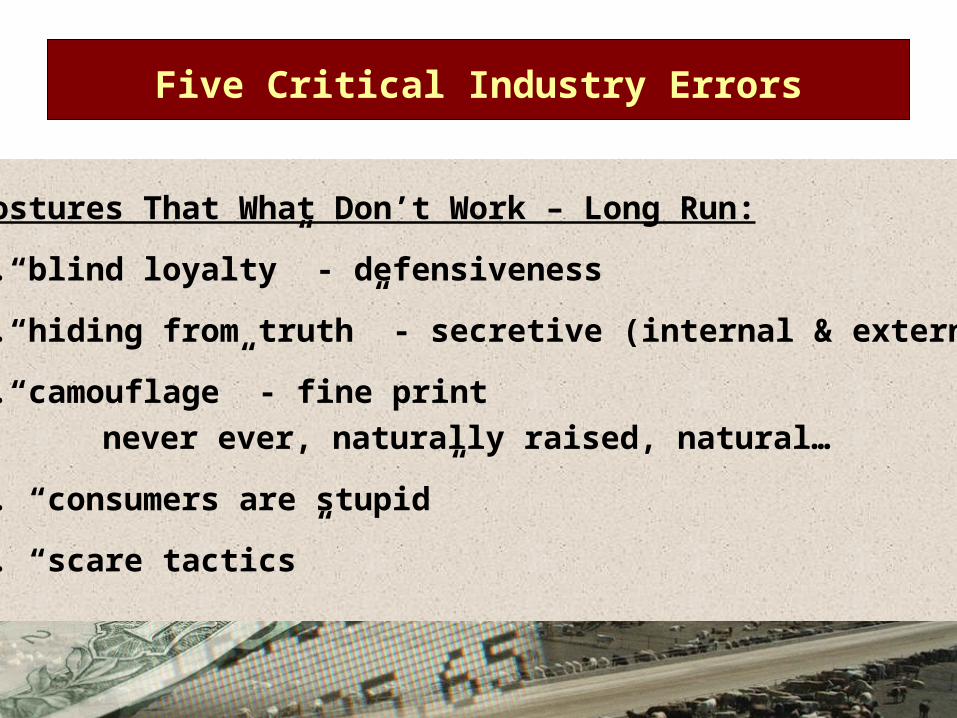
Five Critical Industry Errors
Postures That What Don’t Work – Long Run:
1. “blind loyalty” - defensiveness
2. “hiding from truth” - secretive (internal & external)
3. “camouflage” - fine print
never ever, naturally raised, natural…
4. “consumers are stupid”
5. “scare tactics”
Page 49
Five Industry Recommendations
Postures That What Will Work – Long Run:
1. “give ‘em what they want”
2. “show and tell your story”
3. “invest in technology for consumers”
4. “coordinate” – information/send value vertically
5. “give ‘em your 1-800 number”
If we don’t do these, somebody else will!


![[Bozeman Daily Chronicle] Bozeman High graduation set for ... · Bozeman High School plans to hold graduation June 7 at Montana State University’s Bobcat Stadium, the biggest venue](https://static.documents.pub/doc/80x56/5f23dca25f48fe2e0648d2e7/bozeman-daily-chronicle-bozeman-high-graduation-set-for-bozeman-high-school.jpg)


